
Screening of Indigenous Hanseniaspora Strains from China for Ethanol Reduction in Wine


Abstract
1. Introduction
2. Materials and Methods
2.1. Yeast Strains and Culture Conditions
2.2. Screening of Strains with Low Ethanol Production
2.3. Evaluation of Enological Performance of the Candidate Strains
2.4. ARTP Mutagenesis to Generate Novel Yeast Strains with Lower Ethanol Yield
2.5. Screening for the ARTP Mutagenesis Isolates with Lower Ethanol Yield via Micro- and Lab-Scale Fermentations
2.6. Chemical Analysis
2.7. Statistical Analysis
3. Results
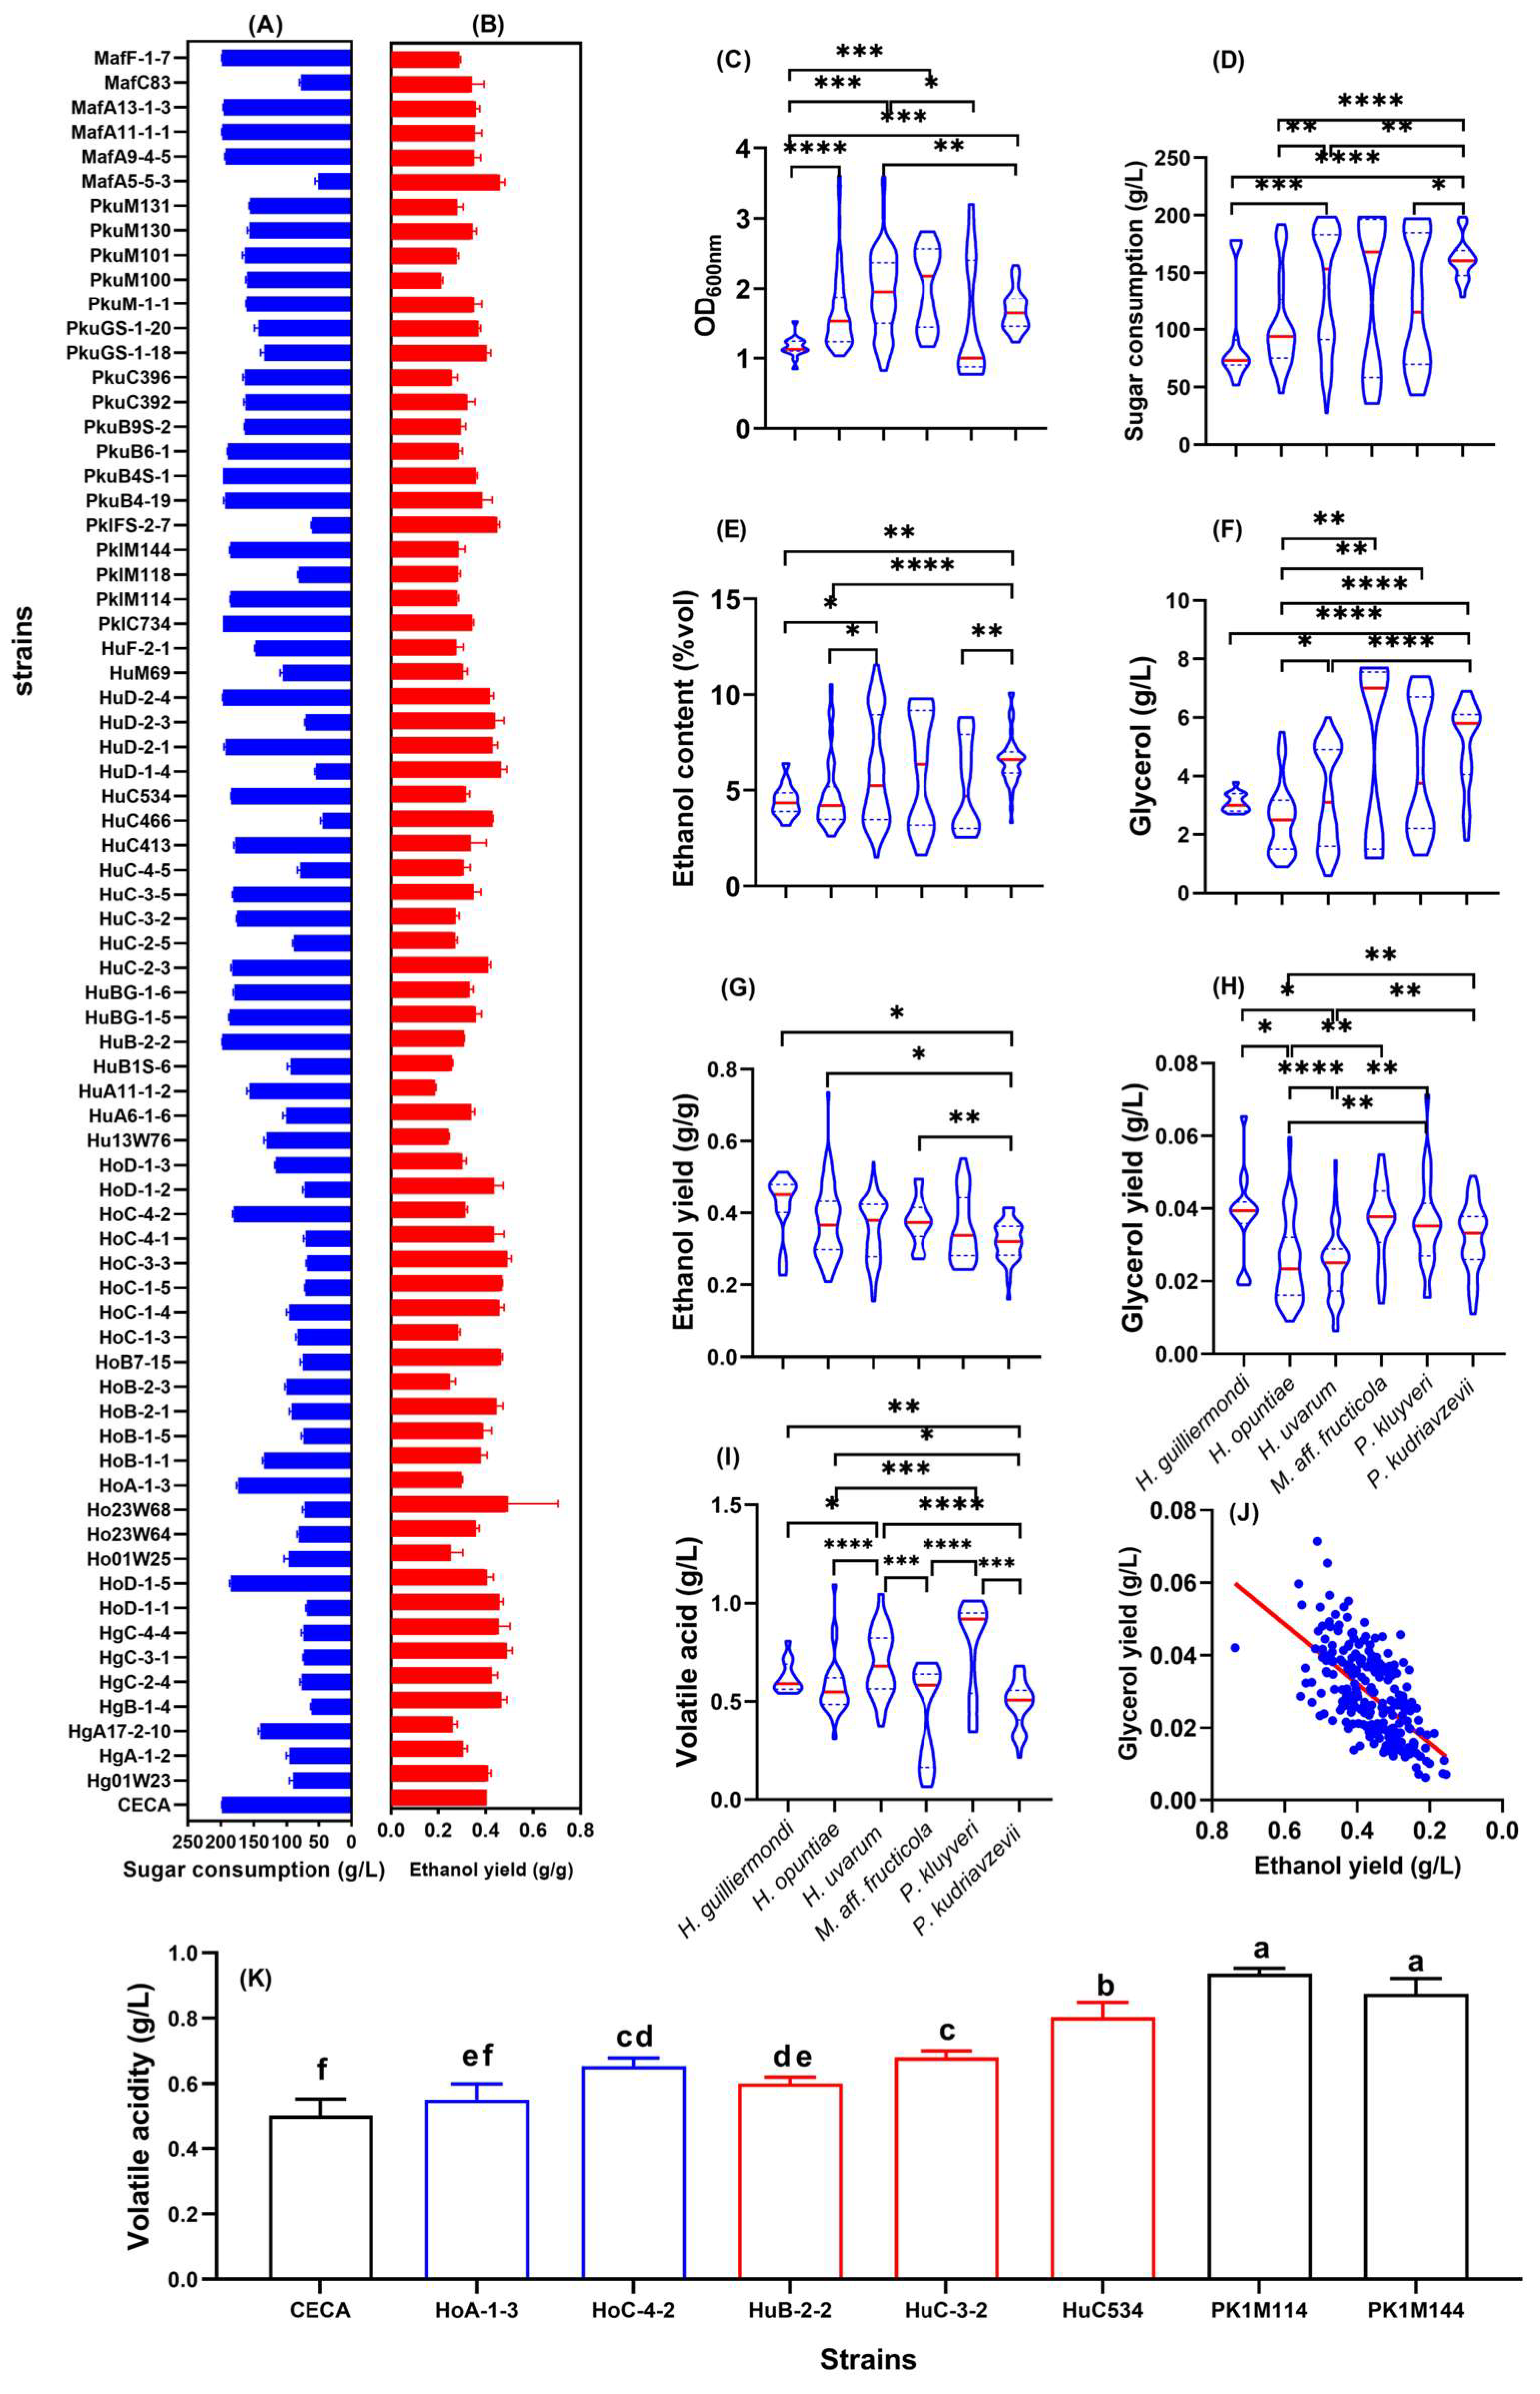
3.1. Evaluation of Non-Saccharomyces Yeasts with Low Ethanol Yield
3.2. Oenological Properties of Low-Ethanol-Yielding Hanseniaspora Yeasts
3.3. ARTP Mutagenesis and Rapid Screening of Yeasts with Lower Ethanol Yield
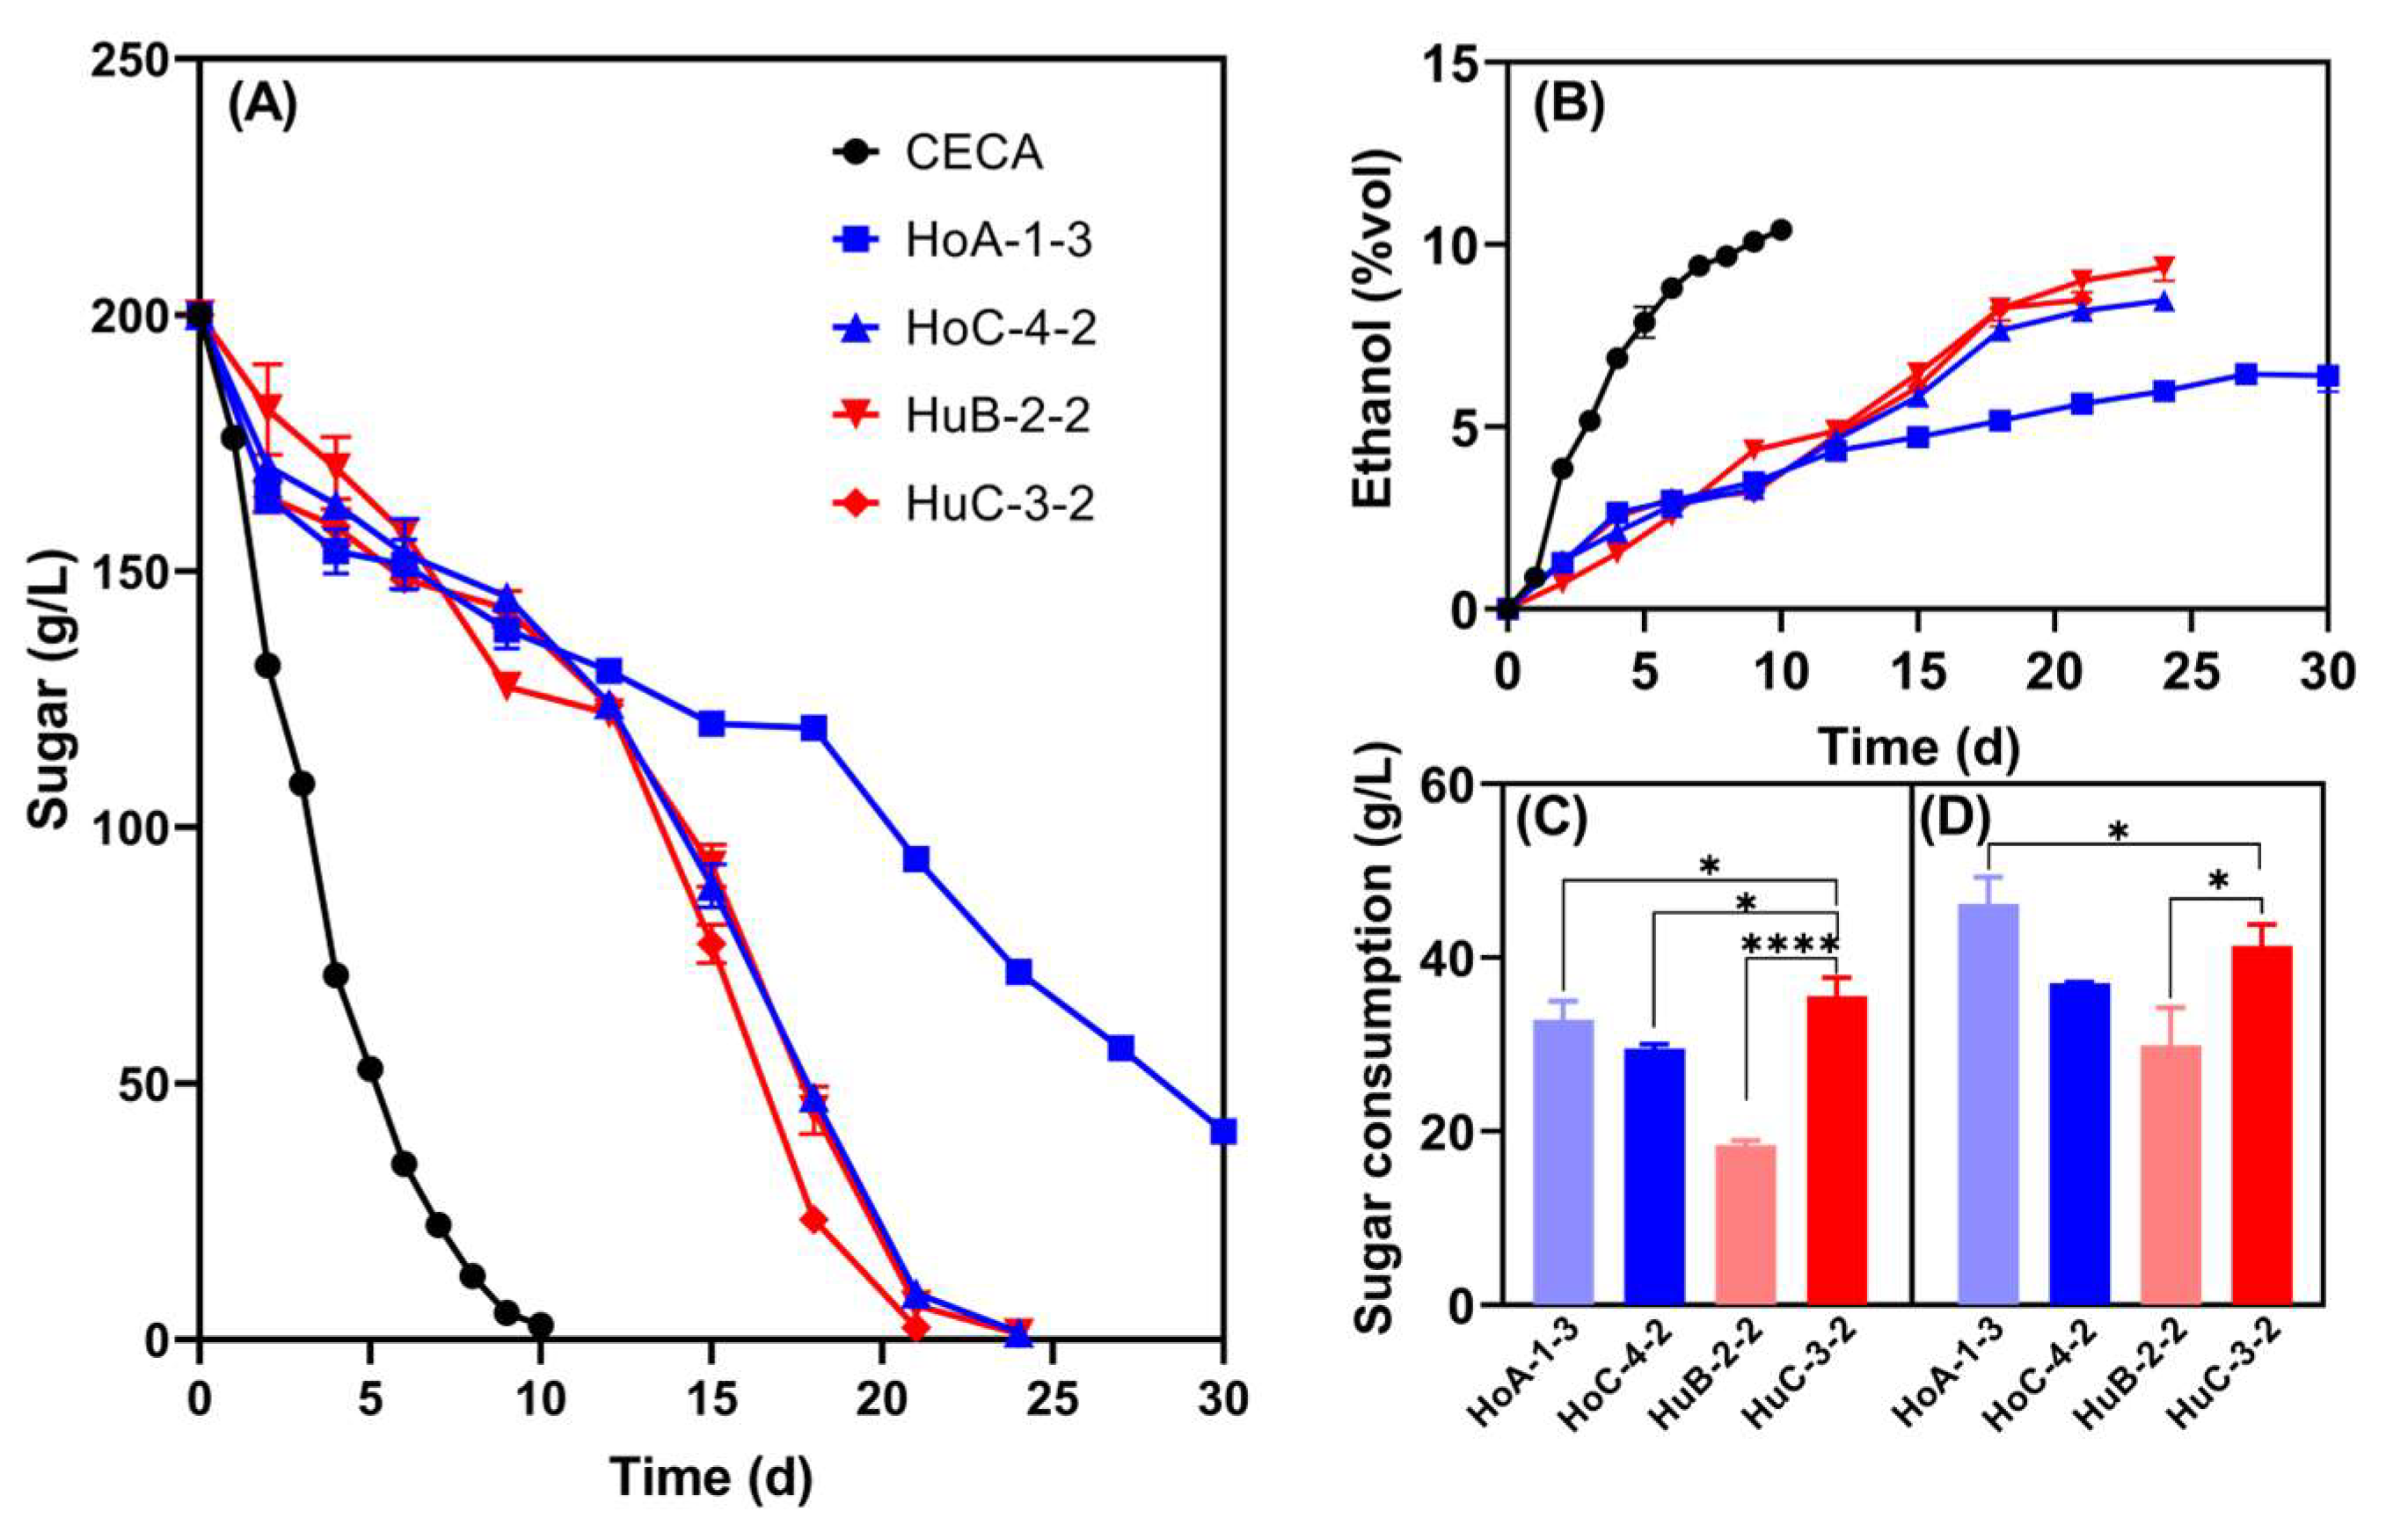
3.4. Sequential Merlot Juice Fermentations Using Low-Ethanol-Yielding Hanseniaspora Yeasts and S. cerevisiae
3.4.1. Dynamic Changes of Sugar Consumption and Yeast Population During Fermentation
3.4.2. Basic Wine Parameters
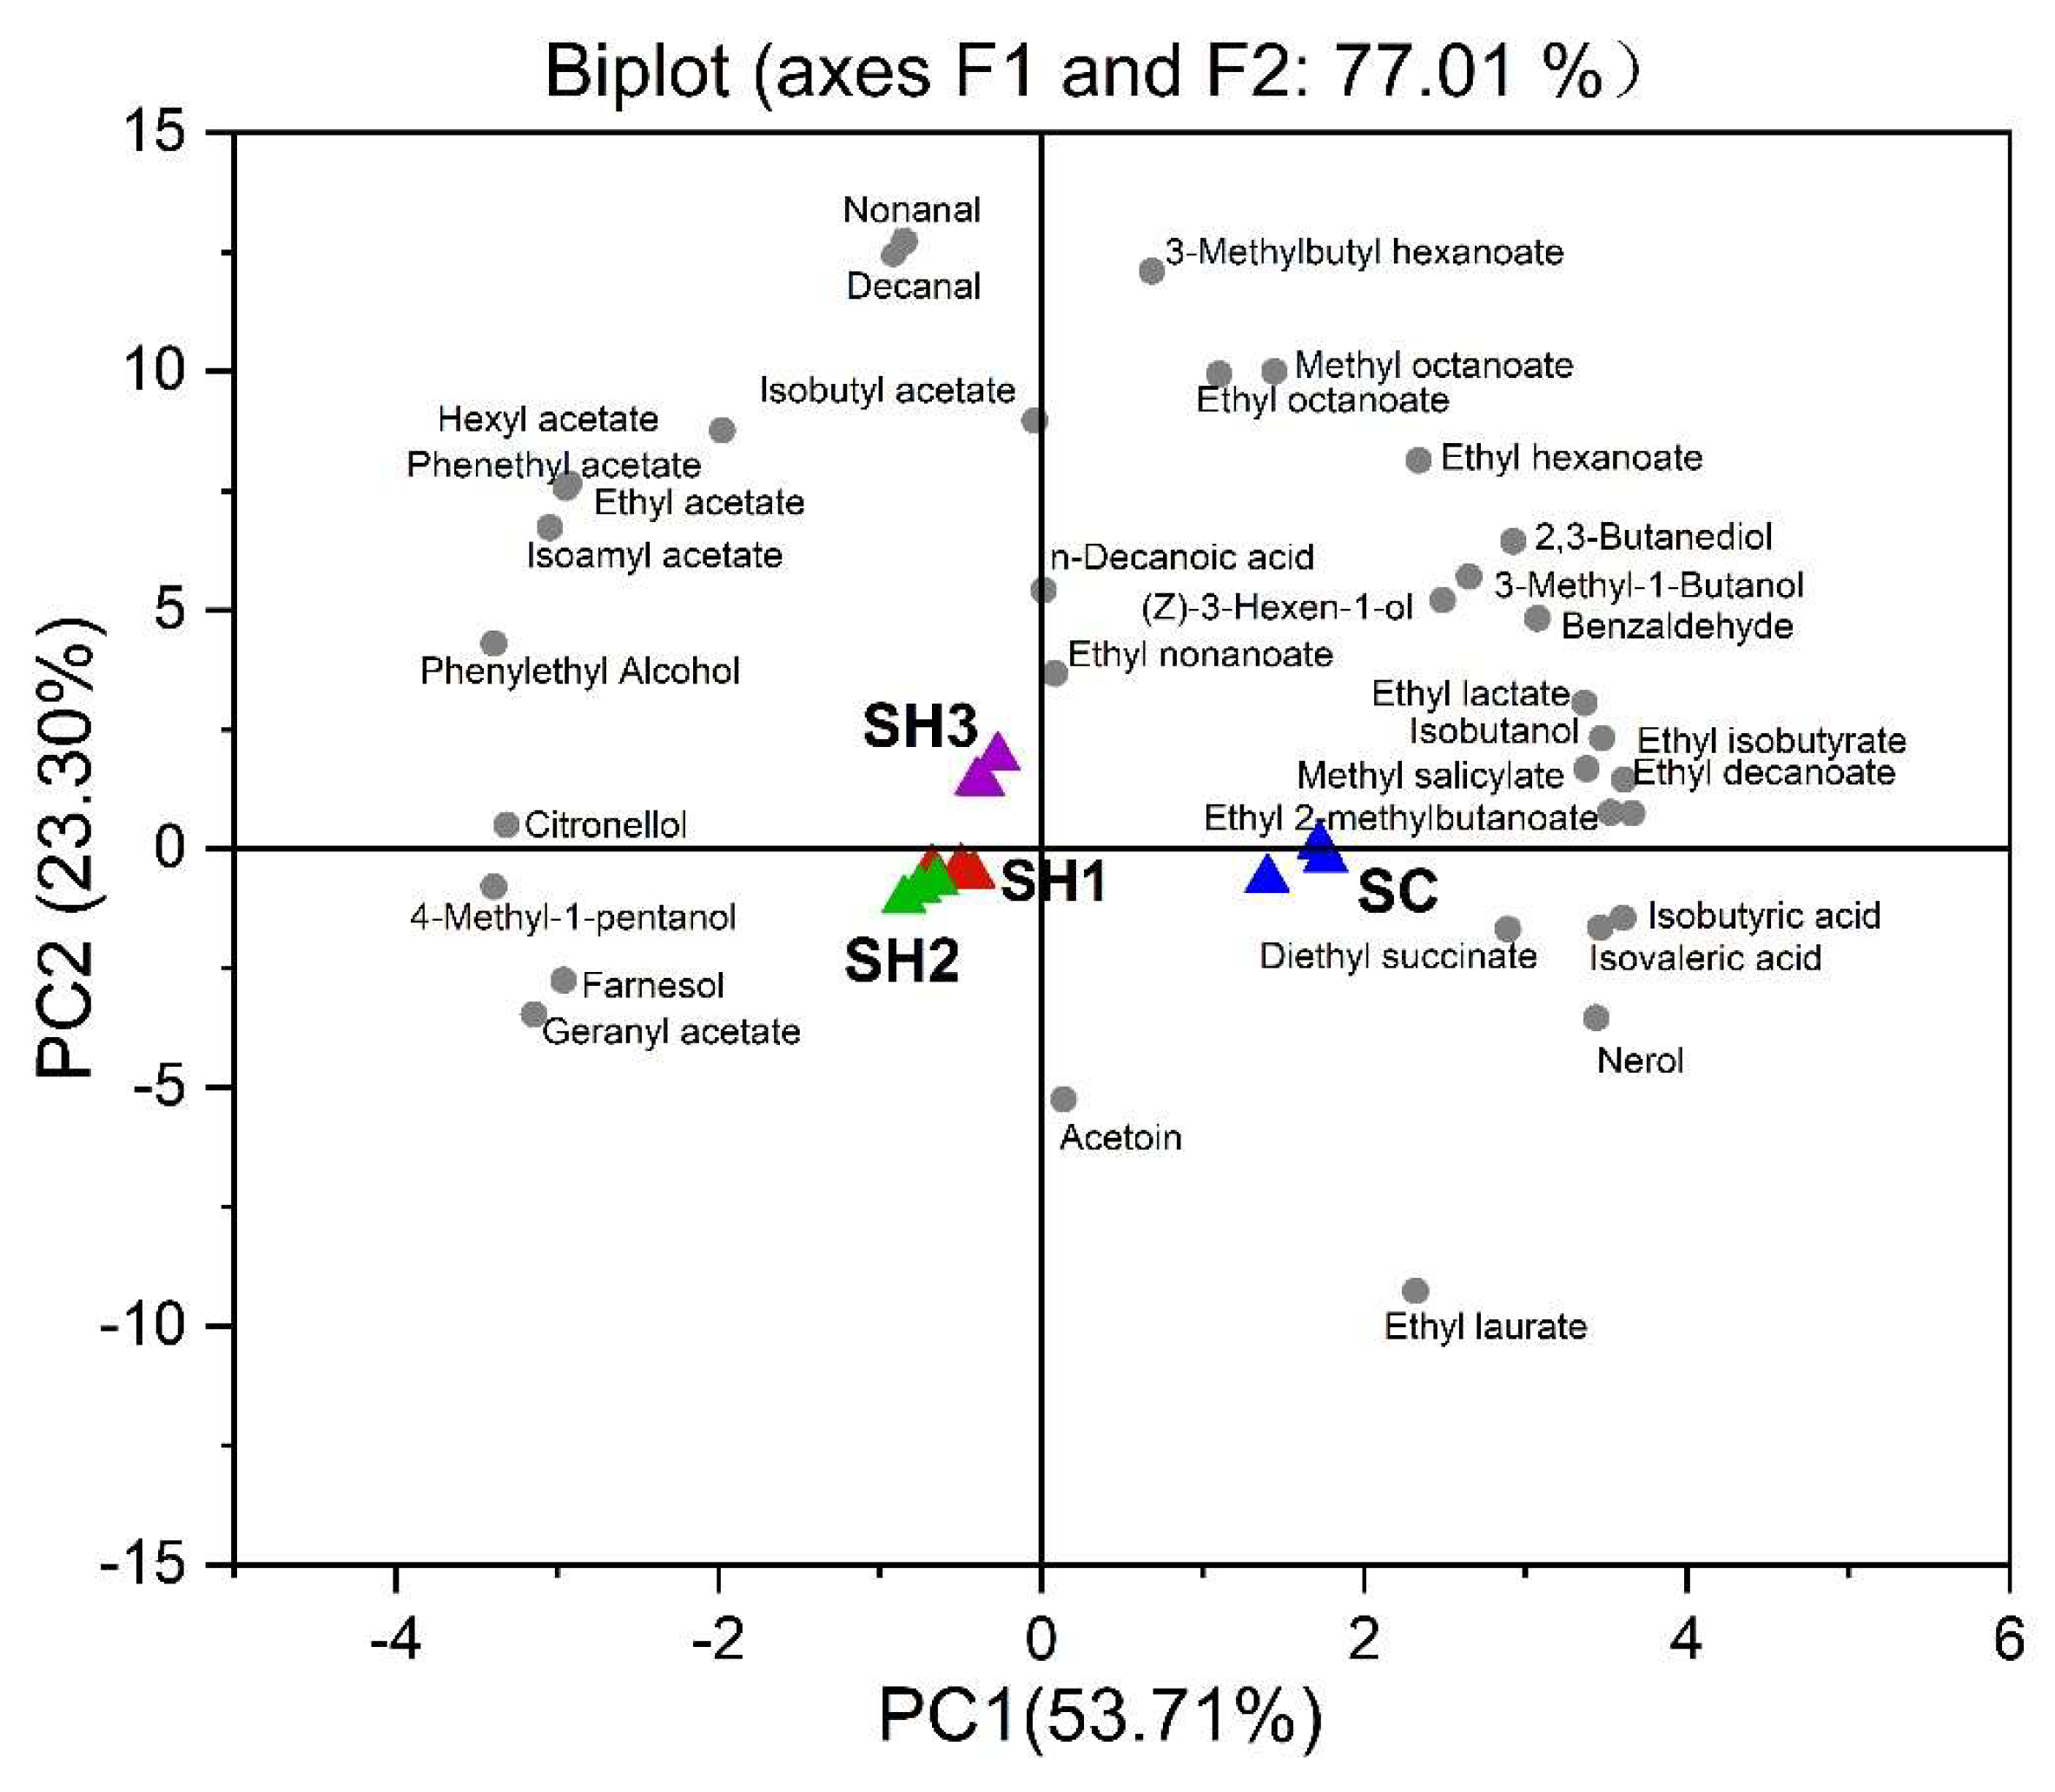
3.4.3. Volatile Compounds of the Wines
4. Discussion
5. Conclusions
Author Contributions
Funding
Institutional Review Board Statement
Informed Consent Statement
Data Availability Statement
Acknowledgments
Conflicts of Interest
Appendix A

| Strain | Size (bp) | Related Yeast | Type Strain | Identity (%) | Isolate Source |
|---|---|---|---|---|---|
| Hg01W23 | 629 | Hanseniaspora guilliermondii TY20 | FJ972220.1 | 99.67 | Jingyang, Shaanxi |
| HgA-1-2 | 628 | Hanseniaspora guilliermondii TY20 | FJ972220.1 | 100.00 | Jingyang, Shaanxi |
| HgA17-2-10 | 640 | Hanseniaspora guilliermondii TY20 | FJ972220.1 | 100.00 | Shanshan, Xinjiang |
| HgB-1-4 | 634 | Hanseniaspora guilliermondii TY20 | FJ972220.1 | 99.50 | Jingyang, Shaanxi |
| HgC-2-4 | 634 | Hanseniaspora guilliermondii TY20 | FJ972220.1 | 100.00 | Jingyang, Shaanxi |
| HgC-3-1 | 633 | Hanseniaspora guilliermondii TY20 | FJ972220.1 | 99.83 | Jingyang, Shaanxi |
| HgC-4-4 | 630 | Hanseniaspora guilliermondii TY14 | FJ972216.1 | 99.50 | Jingyang, Shaanxi |
| HgD-1-1 | 635 | Hanseniaspora guilliermondii TY20 | FJ972220.1 | 99.18 | Jingyang, Shaanxi |
| HgD-1-5 | 631 | Hanseniaspora guilliermondii TY14 | FJ972216.1 | 99.34 | Jingyang, Shaanxi |
| Ho01W25 | 623 | Hanseniaspora opuntiae HCM-NM44 | MK101218.1 | 99.51 | Jingyang, Shaanxi |
| Ho23W64 | 627 | Hanseniaspora opuntiae 11-1139 | MH465522.1 | 99.83 | Jingyang, Shaanxi |
| Ho23W68 | 625 | Hanseniaspora opuntiae HCM-NM44 | MK101218.1 | 99.67 | Jingyang, Shaanxi |
| HoA-1-3 | 618 | Hanseniaspora opuntiae JEY269 | KC111446.1 | 99.68 | Jingyang, Shaanxi |
| HoB-1-1 | 633 | Hanseniaspora opuntiae 11-1184 | MH465493.1 | 99.35 | Jingyang, Shaanxi |
| HoB-1-5 | 632 | Hanseniaspora opuntiae JW11-4 | KU316739.1 | 99.51 | Jingyang, Shaanxi |
| HoB-2-1 | 629 | Hanseniaspora opuntiae 11-1194 | MH465395.1 | 99.83 | Jingyang, Shaanxi |
| HoB-2-3 | 632 | Hanseniaspora opuntiae HCM-NM44 | MK101218.1 | 99.67 | Jingyang, Shaanxi |
| HoB7-15 | 631 | Hanseniaspora opuntiae JPMK66 | MH118515.1 | 100.00 | Jingyang, Shaanxi |
| HoC-1-3 | 633 | Hanseniaspora opuntiae JW11-4 | KU316739.1 | 99.67 | Jingyang, Shaanxi |
| HoC-1-4 | 634 | Hanseniaspora opuntiae SM10UFAM | MN268780.1 | 99.67 | Jingyang, Shaanxi |
| HoC-1-5 | 636 | Hanseniaspora opuntiae CEC 31C-9 | KF263943.1 | 99.83 | Jingyang, Shaanxi |
| HoC-3-3 | 631 | Hanseniaspora opuntiae SM10UFAM | MN268780.1 | 100.00 | Jingyang, Shaanxi |
| HoC-4-1 | 634 | Hanseniaspora opuntiae 11-1139 | MH465522.1 | 99.51 | Jingyang, Shaanxi |
| HoC-4-2 | 633 | Hanseniaspora opuntiae JEY269 | KC111446.1 | 99.83 | Jingyang, Shaanxi |
| HoD-1-2 | 635 | Hanseniaspora opuntiae CEC 31C-9 | KF263943.1 | 99.50 | Jingyang, Shaanxi |
| HoD-1-3 | 630 | Hanseniaspora opuntiae CEC 31C-9 | KF263943.1 | 99.34 | Jingyang, Shaanxi |
| Hu13W76 | 631 | Hanseniaspora uvarum X21-10 | MN337251.1 | 99.51 | Jingyang, Shaanxi |
| HuA6-1-6 | 637 | Hanseniaspora uvarum NS-O-182 | KT922901.1 | 100.00 | Shanshan, Xinjiang |
| HuA11-1-2 | 620 | Hanseniaspora uvarum CEC 32SA-51 | KF263942.1 | 99.35 | Shanshan, Xinjiang |
| HuB1S-6 | 628 | Hanseniaspora uvarum NS-PDC-10 | KT922480.1 | 99.67 | Jingyang, Shaanxi |
| HuB-2-2 | 634 | Hanseniaspora uvarum CBS:2589 | KY107852.1 | 99.67 | Jingyang, Shaanxi |
| HuBG-1-5 | 633 | Hanseniaspora uvarum NS-EM-77 | KT922349.1 | 99.67 | Jingyang, Shaanxi |
| HuBG-1-6 | 636 | Hanseniaspora uvarum NS-O-241 | KT922960.1 | 100.00 | Jingyang, Shaanxi |
| HuC-2-3 | 632 | Hanseniaspora uvarum 11-1148 | MH465536.1 | 99.83 | Jingyang, Shaanxi |
| HuC-2-5 | 635 | Hanseniaspora uvarum HN-NM-67 | MK101217.1 | 99.35 | Jingyang, Shaanxi |
| HuC-3-2 | 629 | Hanseniaspora uvarum HuW1 | KF992155.1 | 99.51 | Jingyang, Shaanxi |
| HuC-3-5 | 634 | Hanseniaspora uvarum X21-10 | MN337251.1 | 99.18 | Jingyang, Shaanxi |
| HuC-4-5 | 631 | Hanseniaspora uvarum X22-9 | MN337255.1 | 99.67 | Jingyang, Shaanxi |
| HuC413 | 633 | Hanseniaspora uvarum NS-O-51 | KT922774.1 | 99.83 | Gansu Mogao Winery |
| HuC466 | 637 | Hanseniaspora uvarum J15-5 | MN337257.1 | 99.66 | Gansu Mogao Winery |
| HuC534 | 639 | Hanseniaspora uvarum NS-EM-122 | KT922393.1 | 100.00 | Gansu Mogao Winery |
| HuD-1-4 | 630 | Hanseniaspora uvarum NS-O-51 | KT922744.1 | 99.83 | Jingyang, Shaanxi |
| HuD-2-1 | 623 | Hanseniaspora uvarum J15-5 | MN337257.1 | 99.51 | Jingyang, Shaanxi |
| HuD-2-3 | 633 | Hanseniaspora uvarum NS-O-16 | KT922739.1 | 99.67 | Jingyang, Shaanxi |
| HuD-2 -4 | 635 | Hanseniaspora uvarum X21-10 | MN337251.1 | 100.00 | Jingyang, Shaanxi |
| HuM69 | 635 | Hanseniaspora uvarum NS-EM-82 | KT922353.1 | 100.00 | Manas, Xinjiang |
| HuF-2-1 | 637 | Hanseniaspora uvarum NS-O-241 | KT922960.1 | 99.49 | Ningxia Royal Horse Winery |
| MafA5-5-3 | 558 | Metschnikowia aff. fructicola D3895 | AM286804.1 | 99.81 | Shanshan, Xinjiang |
| MafA9-4-5 | 578 | Metschnikowia aff. fructicola C83 | EU373448.1 | 99.80 | Shanshan, Xinjiang |
| MafA11-1-1 | 629 | Metschnikowia aff. fructicola D3895 | AM286804.1 | 99.81 | Shanshan, Xinjiang |
| MafA13-1-3 | 559 | Metschnikowia aff. fructicola D3895 | AM286804.1 | 99.81 | Shanshan, Xinjiang |
| MafC83 | 555 | Metschnikowia aff. fructicola D3895 | AM286804.1 | 99.81 | Gansu Mogao Winery |
| MafF-1-7 | 558 | Metschnikowia aff. fructicola D3895 | AM286804.1 | 99.62 | Ningxia Royal Horse Winery |
| PklC734 | 616 | Pichia kluyveri X27-5 | MN337254.1 | 99.51 | Gansu Mogao Winery |
| PklM114 | 617 | Pichia kluyveri X23-10 | MN337239.1 | 99.66 | Manas, Xinjiang |
| PklM118 | 631 | Pichia kluyveri X23-10 | MN337239.1 | 99.66 | Manas, Xinjiang |
| PklM144 | 625 | Pichia kluyveri CBS:7274 | KY108823.1 | 99.66 | Manas, Xinjiang |
| PklFS-2-7 | 630 | Pichia kluyveri YG14 | MF045458.1 | 99.83 | Ningxia Royal Horse Winery |
| PkuB4-19 | 625 | Pichia kudriavzevii CK12 | MN712334.1 | 99.66 | Jingyang, Shaanxi |
| PkuB4S-1 | 616 | Pichia kudriavzevii CBS:5147 | MH545928.1 | 99.83 | Jingyang, Shaanxi |
| PkuB6-1 | 619 | Pichia kudriavzevii ZJ-13 | KY283161.1 | 99.66 | Jingyang, Shaanxi |
| PkuB9S-2 | 618 | Pichia kudriavzevii CK12 | MN712334.1 | 100.00 | Jingyang, Shaanxi |
| PkuC392 | 617 | Pichia kudriavzevii CK12 | MN712334.1 | 99.17 | Gansu Mogao Winery |
| PkuC396 | 570 | Pichia kudriavzevii CK12 | MN712334.1 | 100.00 | Gansu Mogao Winery |
| PkuGS-1-18 | 622 | Pichia kudriavzevii CK12 | MN712334.1 | 100.00 | Helan Mountain, Ningxia |
| PkuGS-1-20 | 621 | Pichia kudriavzevii CK12 | MN712334.1 | 99.83 | Helan Mountain, Ningxia |
| PkuM-1-1 | 621 | Pichia kudriavzevii CK12 | MN712334.1 | 99.83 | Helan Mountain, Ningxia |
| PkuM100 | 621 | Pichia kudriavzevii 4_5 | MF461004.1 | 100.00 | Manas, Xinjiang |
| PkuM101 | 622 | Pichia kudriavzevii 4_5 | MF461004.1 | 100.00 | Manas, Xinjiang |
| PkuM130 | 623 | Pichia kudriavzevii CBS:5147 | MH545928.1 | 100.00 | Manas, Xinjiang |
| PkuM131 | 625 | Pichia kudriavzevii CBS:5147 | MH545928.1 | 100.00 | Manas, Xinjiang |
| Strain | OD600nm | Residual Sugar (g/L) | Sugar Consumption (g/L) | Ethanol (%v/v) | Ethanol Yield (g/g) | Changes in Ethanol Yield (%) | Glycerol (g/L) | Glycerol Yield (g/g) | Total Acid a (g/L) | Volatile Acid b (g/L) |
|---|---|---|---|---|---|---|---|---|---|---|
| Saccharomyces cerevisiae | ||||||||||
| CECA c | 3.39 ± 0.04 | 1.82 ± 0.10 | 198.18 ± 0.10 | 10.16 ± 0.01 | 0.404 ± 0.000 | 0 | 5.30 ± 0.00 | 0.026 ± 0.000 | 7.31 ± 0.11 | 0.50 ± 0.01 |
| Hanseniaspora guilliermondii | ||||||||||
| Hg01W23 | 1.39 ± 0.13 | 110.04 ± 5.91 | 89.96 ± 5.91 | 3.25 ± 0.20 | 0.409 ± 0.014 | −4.30 | 1.25 ± 0.07 | 0.014 ± 0.001 | 6.57 ± 0.47 | 0.52 ± 0.02 |
| HgA-1-2 | 1.58 ± 0.25 | 104.17 ± 4.47 | 95.83 ± 4.47 | 3.70 ± 0.78 | 0.303 ± 0.020 | −32.42 | 1.45 ± 0.05 | 0.015 ± 0.003 | 6.74 ± 0.16 | 0.49 ± 0.05 |
| HgA17-2-10 | 2.21 ± 0.19 | 60.07 ± 2.94 | 139.93 ± 2.94 | 4.64 ± 0.51 | 0.261 ± 0.018 | −40.11 | 2.50 ± 0.06 | 0.018 ± 0.003 | 6.06 ± 0.20 | 0.43 ± 0.03 |
| HgB-1-4 | 1.10 ± 0.02 | 139.01 ± 1.10 | 60.99 ± 1.10 | 3.58 ± 0.37 | 0.465 ± 0.024 | −1.96 | 3.10 ± 0.26 | 0.052 ± 0.002 | 6.22 ± 0.10 | 0.57 ± 0.01 |
| HgC-2-4 | 1.24 ± 0.04 | 123.06 ± 2.46 | 76.94 ± 2.46 | 4.13 ± 0.67 | 0.425 ± 0.025 | −13.94 | 3.03 ± 0.12 | 0.040 ± 0.006 | 6.69 ± 0.21 | 0.62 ± 0.05 |
| HgC-3-1 | 1.22 ± 0.04 | 126.49 ± 1.39 | 73.51 ± 1.39 | 4.55 ± 0.30 | 0.489 ± 0.023 | −1.04 | 2.97 ± 0.25 | 0.040 ± 0.001 | 6.62 ± 0.21 | 0.56 ± 0.03 |
| HgC-4-4 | 1.12 ± 0.01 | 126.07 ± 3.33 | 73.93 ± 3.33 | 4.25 ± 0.27 | 0.455 ± 0.048 | −8.01 | 2.90 ± 0.17 | 0.039 ± 0.001 | 6.55 ± 0.21 | 0.62 ± 0.02 |
| Hanseniaspora opuntiae | ||||||||||
| HoD-1-1 | 1.22 ± 0.02 | 131.10 ± 1.68 | 68.9 ± 1.68 | 4.03 ± 0.14 | 0.459 ± 0.015 | −7.15 | 2.40 ± 0.17 | 0.035 ± 0.007 | 6.65 ± 0.18 | 0.53 ± 0.04 |
| HoD-1-5 | 2.24 ± 0.13 | 15.08 ± 1.51 | 184.92 ± 1.51 | 9.49 ± 0.54 | 0.405 ± 0.027 | −4.00 | 4.97 ± 0.09 | 0.027 ± 0.002 | 7.59 ± 0.18 | 0.82 ± 0.02 |
| Ho01W25 | 1.83 ± 0.10 | 103.41 ± 6.99 | 96.59 ± 6.99 | 3.05 ± 0.40 | 0.252 ± 0.052 | −43.82 | 1.07 ± 0.15 | 0.011 ± 0.002 | 6.01 ± 0.30 | 0.47 ± 0.02 |
| Ho23W64 | 1.43 ± 0.11 | 118.63 ± 2.58 | 81.37 ± 2.58 | 3.53 ± 0.14 | 0.358 ± 0.015 | −16.24 | 1.27 ± 0.15 | 0.016 ± 0.001 | 6.24 ± 0.25 | 0.46 ± 0.06 |
| Ho23W68 | 1.63 ± 0.17 | 127.7 ± 3.58 | 72.30 ± 3.58 | 4.11 ± 0.21 | 0.494 ± 0.211 | −0.03 | 1.77 ± 0.15 | 0.027 ± 0.003 | 6.58 ± 0.12 | 0.51 ± 0.04 |
| HoA-1-3 | 2.46 ± 0.10 | 26.11 ± 2.13 | 173.89 ± 2.13 | 6.58 ± 0.39 | 0.299 ± 0.003 | −30.98 | 3.25 ± 0.07 | 0.019 ± 0.002 | 6.27 ± 0.20 | 0.56 ± 0.07 |
| HoB-1-1 | 1.54 ± 0.21 | 65.65 ± 2.06 | 134.35 ± 2.06 | 6.38 ± 0.41 | 0.378 ± 0.028 | −13.35 | 3.13 ± 0.15 | 0.023 ± 0.004 | 7.12 ± 0.30 | 0.50 ± 0.08 |
| HoB-1-5 | 1.15 ± 0.11 | 126.12 ± 3.75 | 73.88 ± 3.75 | 3.63 ± 0.20 | 0.389 ± 0.036 | −21.38 | 3.23 ± 0.23 | 0.044 ± 0.001 | 6.32 ± 0.44 | 0.58 ± 0.06 |
| HoB-2-1 | 1.17 ± 0.05 | 107.81 ± 3.72 | 92.19 ± 3.72 | 5.15 ± 0.26 | 0.445 ± 0.028 | −0.84 | 2.43 ± 0.06 | 0.027 ± 0.003 | 6.85 ± 0.05 | 0.48 ± 0.07 |
| HoB-2-3 | 1.70 ± 0.19 | 99.91 ± 2.40 | 100.09 ± 2.40 | 3.18 ± 0.32 | 0.250 ± 0.022 | −44.17 | 1.33 ± 0.15 | 0.013 ± 0.001 | 6.54 ± 0.17 | 0.49 ± 0.03 |
| HoB7-15 | 1.48 ± 0.08 | 124.65 ± 3.74 | 75.35 ± 3.74 | 4.26 ± 0.43 | 0.464 ± 0.006 | −6.16 | 1.63 ± 0.15 | 0.023 ± 0.005 | 10.11 ± 0.39 | 1.02 ± 0.03 |
| HoC-1-3 | 1.65 ± 0.11 | 116.74 ± 2.65 | 83.26 ± 2.65 | 2.96 ± 0.40 | 0.283 ± 0.008 | −33.77 | 1.27 ± 0.21 | 0.015 ± 0.003 | 6.76 ± 0.28 | 0.47 ± 0.04 |
| HoC-1-4 | 1.36 ± 0.17 | 103.72 ± 3.54 | 96.28 ± 3.54 | 5.61 ± 0.42 | 0.459 ± 0.018 | 2.28 | 2.83 ± 0.12 | 0.029 ± 0.003 | 6.48 ± 0.03 | 0.54 ± 0.02 |
| HoC-1-5 | 1.23 ± 0.04 | 128.54 ± 1.01 | 71.46 ± 1.01 | 4.08 ± 0.61 | 0.469 ± 0.001 | −5.11 | 2.80 ± 0.10 | 0.042 ± 0.005 | 6.38 ± 0.18 | 0.56 ± 0.04 |
| HoC-3-3 | 1.23 ± 0.04 | 131.31 ± 1.65 | 68.69 ± 1.65 | 4.30 ± 0.47 | 0.492 ± 0.016 | −0.43 | 3.27 ± 0.12 | 0.048 ± 0.008 | 6.85 ± 0.34 | 0.63 ± 0.04 |
| HoC-4-1 | 1.10 ± 0.01 | 128.71 ± 2.77 | 71.29 ± 2.77 | 3.92 ± 0.39 | 0.434 ± 0.043 | −12.21 | 2.73 ± 0.15 | 0.038 ± 0.003 | 6.46 ± 0.28 | 0.59 ± 0.03 |
| HoC-4-2 | 2.40 ± 0.03 | 19.74 ± 1.65 | 180.26 ± 1.65 | 7.13 ± 0.70 | 0.314 ± 0.009 | −25.66 | 4.97 ± 0.25 | 0.028 ± 0.001 | 7.44 ± 0.07 | 0.75 ± 0.03 |
| HoD-1-2 | 1.24 ± 0.01 | 127.08 ± 2.47 | 72.92 ± 2.47 | 4.01 ± 0.23 | 0.435 ± 0.039 | −12.00 | 2.87 ± 0.06 | 0.039 ± 0.001 | 6.52 ± 0.11 | 0.54 ± 0.03 |
| HoD-1-3 | 1.89 ± 0.14 | 84.00 ± 1.89 | 116.00 ± 1.89 | 4.23 ± 0.47 | 0.301 ± 0.017 | −21.53 | 1.75 ± 0.09 | 0.015 ± 0.002 | 5.98 ± 0.52 | 0.60 ± 0.03 |
| Hanseniaspora uvarum | ||||||||||
| Hu13W76 | 2.47 ± 0.19 | 69.44 ± 3.67 | 130.56 ± 3.67 | 4.12 ± 0.69 | 0.244 ± 0.002 | −42.19 | 1.93 ± 0.17 | 0.014 ± 0.001 | 6.17 ± 0.50 | 0.67 ± 0.03 |
| HuA6-1-6 | 1.85 ± 0.20 | 99.8 ± 5.47 | 100.2 ± 5.47 | 4.30 ± 0.18 | 0.339 ± 0.014 | −24.39 | 1.93 ± 0.12 | 0.019 ± 0.000 | 6.05 ± 0.26 | 0.61 ± 0.02 |
| HuA11-1-2 | 2.02 ± 0.14 | 43.85 ± 4.13 | 156.15 ± 4.13 | 3.66 ± 0.24 | 0.185 ± 0.005 | −58.01 | 1.43 ± 0.09 | 0.009 ± 0.003 | 6.11 ± 0.58 | 0.55 ± 0.04 |
| HuB1S-6 | 1.84 ± 0.26 | 106.31 ± 4.79 | 93.69 ± 4.79 | 3.03 ± 0.20 | 0.257 ± 0.004 | −42.73 | 1.35 ± 0.07 | 0.014 ± 0.000 | 7.15 ± 0.05 | 0.44 ± 0.01 |
| HuB-2-2 | 2.56 ± 0.09 | 2.46 ± 0.26 | 197.54 ± 0.26 | 7.72 ± 0.59 | 0.308 ± 0.001 | −24.13 | 5.20 ± 0.17 | 0.028 ± 0.001 | 7.16 ± 0.09 | 0.85 ± 0.03 |
| HuBG-1-5 | 2.46 ± 0.20 | 13.58 ± 1.28 | 186.42 ± 1.28 | 8.52 ± 0.04 | 0.360 ± 0.022 | −12.49 | 4.90 ± 0.28 | 0.026 ± 0.002 | 7.73 ± 0.03d | 0.81 ± 0.01 |
| HuBG-1-6 | 2.15 ± 0.07 | 20.64 ± 1.55 | 179.36 ± 1.55 | 7.56 ± 0.35 | 0.332 ± 0.016 | −21.52 | 4.60 ± 0.14 | 0.026 ± 0.002 | 7.62 ± 0.21 | 0.76 ± 0.04 |
| HuC-2-3 | 2.50 ± 0.10 | 17.11 ± 1.64 | 182.89 ± 1.64 | 9.52 ± 0.26 | 0.411 ± 0.010 | −2.73 | 4.90 ± 0.14 | 0.025 ± 0.001 | 7.52 ± 0.14 | 0.81 ± 0.03 |
| HuC-2-5 | 1.89 ± 0.16 | 110.91 ± 1.72 | 89.09 ± 1.72 | 3.01 ± 0.38 | 0.271 ± 0.008 | −36.59 | 1.20 ± 0.06 | 0.013 ± 0.002 | 6.76 ± 0.32 | 0.51 ± 0.05 |
| HuC-3-2 | 2.32 ± 0.20 | 24.63 ± 0.68 | 175.37 ± 0.68 | 6.13 ± 0.29 | 0.274 ± 0.014 | −33.67 | 5.43 ± 0.25 | 0.030 ± 0.001 | 7.19 ± 0.38 | 0.75 ± 0.10 |
| HuC-3-5 | 2.31 ± 0.17 | 18.88 ± 1.07 | 181.12 ± 1.07 | 8.02 ± 0.07 | 0.349 ± 0.031 | −17.39 | 3.80 ± 0.02 | 0.022 ± 0.003 | 7.69 ± 0.34 | 0.86 ± 0.03 |
| HuC-4-5 | 1.47 ± 0.12 | 120.88 ± 4.31 | 79.12 ± 4.31 | 2.98 ± 0.38 | 0.307 ± 0.027 | −28.03 | 1.00 ± 0.00 | 0.013 ± 0.000 | 6.88 ± 0.09 | 0.44 ± 0.06 |
| HuC413 | 2.11 ± 0.15 | 21.87 ± 2.05 | 178.13 ± 2.05 | 7.63 ± 0.59 | 0.337 ± 0.065 | −19.13 | 4.83 ± 0.31 | 0.027 ± 0.001 | 7.42 ± 0.12 | 0.87 ± 0.05 |
| HuC466 | 0.97 ± 0.05 | 156.07 ± 2.93 | 43.93 ± 2.93 | 2.39 ± 0.26 | 0.429 ± 0.002 | 7.13 | 1.35 ± 0.07 | 0.036 ± 0.002 | 11.03 ± 0.73 | 0.90 ± 0.03 |
| HuC534 | 2.16 ± 0.03 | 16.00 ± 0.43 | 184.00 ± 0.43 | 7.42 ± 0.15 | 0.317 ± 0.015 | −24.86 | 4.90 ± 0.26 | 0.027 ± 0.002 | 7.44 ± 0.27 | 0.70 ± 0.04 |
| HuD-1-4 | 1.01 ± 0.13 | 145.83 ± 1.83 | 54.17 ± 1.83 | 3.19 ± 0.25 | 0.464 ± 0.026 | 11.84 | 2.53 ± 0.23 | 0.047 ± 0.006 | 6.53 ± 0.21 | 0.55 ± 0.06 |
| HuD-2-1 | 2.42 ± 0.17 | 7.34 ± 2.30 | 192.66 ± 2.30 | 10.47 ± 0.63 | 0.429 ± 0.021 | 6.18 | 5.07 ± 0.21 | 0.026 ± 0.001 | 7.41 ± 0.09 | 0.89 ± 0.03 |
| HuD-2-3 | 1.29 ± 0.06 | 129.46 ± 1.65 | 70.54 ± 1.65 | 3.91 ± 0.37 | 0.441 ± 0.037 | −10.77 | 2.63 ± 0.09 | 0.038 ± 0.002 | 6.72 ± 0.23 | 0.63 ± 0.00 |
| HuD-2-4 | 2.34 ± 0.16 | 3.32 ± 0.62 | 196.68 ± 0.62 | 10.42 ± 0.41 | 0.418 ± 0.015 | 2.82 | 5.57 ± 0.38 | 0.028 ± 0.002 | 7.51 ± 0.34 | 1.00 ± 0.01 |
| HuM69 | 1.66 ± 0.01 | 94.56 ± 4.31 | 105.44 ± 4.31 | 4.06 ± 0.24 | 0.305 ± 0.018 | −26.42 | 1.55 ± 0.07 | 0.015 ± 0.001 | 7.28 ± 0.08 | 0.67 ± 0.06 |
| HuF-2-1 | 2.61 ± 0.73 | 53.1 ± 1.58 | 146.90 ± 1.58 | 5.11 ± 0.45 | 0.276 ± 0.030 | −34.81 | 2.53 ± 0.38 | 0.017 ± 0.002 | 6.16 ± 0.37 | 0.58 ± 0.01 |
| Pichia kluyveri | ||||||||||
| PklC734 | 2.09 ± 0.14 | 3.68 ± 0.12 | 196.32 ± 0.12 | 8.55 ± 0.10 | 0.343 ± 0.006 | −15.39 | 6.90 ± 0.20 | 0.035 ± 0.001 | 8.00 ± 0.24 | 0.98 ± 0.04 |
| PklM114 | 2.99 ± 0.15 | 14.7 ± 0.31 | 185.30 ± 0.31 | 6.61 ± 1.47 | 0.280 ± 0.005 | −31.81 | 5.50 ± 0.49 | 0.029 ± 0.007 | 7.81 ± 0.15 | 0.94 ± 0.02 |
| PklM118 | 0.96 ± 0.06 | 93.81 ± 1.76 | 81.37 ± 1.76 | 2.93 ± 0.05 | 0.284 ± 0.009 | −31.47 | 1.65 ± 0.09 | 0.020 ± 0.007 | 7.49 ± 0.14 | 0.50 ± 0.07 |
| PklM144 | 2.30 ± 0.14 | 14.94 ± 1.33 | 185.06 ± 1.33 | 6.70 ± 0.60 | 0.286 ± 0.027 | −30.42 | 6.67 ± 0.15 | 0.036 ± 0.001 | 7.66 ± 0.13 | 0.87 ± 0.05 |
| PklFS-2-7 | 0.88 ± 0.09 | 139.86 ± 1.04 | 60.14 ± 1.04 | 3.35 ± 0.14 | 0.449 ± 0.010 | −5.47 | 2.40 ± 0.06 | 0.041 ± 0.001 | 10.01 ± 0.16 | 0.98 ± 0.04 |
| Pichia kudriavzevii | ||||||||||
| PkuB4-19 | 2.12 ± 0.22 | 6.50 ± 2.02 | 193.50 ± 2.02 | 9.43 ± 1.16 | 0.384 ± 0.044 | −3.39 | 6.60 ± 0.06 | 0.034 ± 0.002 | 8.10 ± 0.21 | 0.65 ± 0.04 |
| PkuB4S-1 | 2.14 ± 0.05 | 3.28 ± 0.07 | 196.72 ± 0.07 | 8.94 ± 0.22 | 0.359 ± 0.005 | −11.75 | 5.93 ± 0.15 | 0.030 ± 0.000 | 7.34 ± 0.26 | 0.66 ± 0.02 |
| PkuB6-1 | 1.99 ± 0.20 | 10.56 ± 0.70 | 189.44 ± 0.70 | 6.88 ± 0.37 | 0.287 ± 0.014 | −29.27 | 5.97 ± 0.45 | 0.031 ± 0.002 | 8.53 ± 0.25 | 0.57 ± 0.02 |
| PkuB9S-2 | 1.48 ± 0.09 | 36.42 ± 0.52 | 163.58 ± 0.52 | 6.11 ± 0.25 | 0.295 ± 0.020 | −34.03 | 5.40 ± 0.44 | 0.033 ± 0.004 | 8.51 ± 0.45 | 0.51 ± 0.03 |
| PkuC392 | 1.41 ± 0.21 | 37.7 ± 2.42 | 162.3 ± 2.42 | 6.62 ± 0.27 | 0.322 ± 0.033 | −28.12 | 4.21 ± 0.20 | 0.026 ± 0.006 | 7.49 ± 0.18 | 0.48 ± 0.02 |
| PkuC396 | 1.81 ± 0.18 | 36.38 ± 2.76 | 163.62 ± 2.76 | 5.32 ± 0.46 | 0.258 ± 0.023 | −42.42 | 4.07 ± 0.25 | 0.025 ± 0.002 | 7.21 ± 0.16 | 0.31 ± 0.02 |
| PkuGS-1-18 | 1.33 ± 0.09 | 66.07 ± 5.59 | 133.93 ± 5.59 | 6.83 ± 0.11 | 0.403 ± 0.018 | −7.61 | 6.10 ± 0.10 | 0.046 ± 0.001 | 6.63 ± 0.15 | 0.30 ± 0.01 |
| PkuGS-1-20 | 1.46 ± 0.11 | 57.02 ± 5.65 | 142.98 ± 5.65 | 6.71 ± 0.12 | 0.370 ± 0.008 | −12.62 | 6.33 ± 0.35 | 0.044 ± 0.004 | 9.71 ± 0.18 | 0.56 ± 0.03 |
| PkuM-1-1 | 1.59 ± 0.11 | 39.55 ± 1.21 | 160.45 ± 1.21 | 7.12 ± 0.37 | 0.351 ± 0.032 | −20.39 | 6.53 ± 0.47 | 0.041 ± 0.004 | 9.03 ± 0.26 | 0.52 ± 0.04 |
| PkuM100 | 1.64 ± 0.23 | 40.37 ± 2.44 | 159.63 ± 2.44 | 4.30 ± 0.14 | 0.213 ± 0.006 | −51.83 | 3.03 ± 0.17 | 0.019 ± 0.001 | 6.33 ± 0.16 | 0.41 ± 0.03 |
| PkuM101 | 1.62 ± 0.19 | 36.72 ± 3.82 | 163.28 ± 3.82 | 5.74 ± 0.30 | 0.277 ± 0.008 | −38.02 | 4.37 ± 0.32 | 0.027 ± 0.001 | 7.29 ± 0.18 | 0.40 ± 0.07 |
| PkuM130 | 1.56 ± 0.11 | 43.76 ± 2.99 | 156.24 ± 2.99 | 6.82 ± 0.33 | 0.344 ± 0.017 | −22.02 | 5.87 ± 0.06 | 0.038 ± 0.000 | 9.77 ± 0.26 | 0.57 ± 0.06 |
| PkuM131 | 1.72 ± 0.17 | 44.40 ± 1.12 | 155.60 ± 1.12 | 5.48 ± 0.44 | 0.279 ± 0.026 | −36.80 | 3.30 ± 0.13 | 0.021 ± 0.002 | 7.23 ± 0.35 | 0.35 ± 0.04 |
| Metschnikowia aff. fructicola | ||||||||||
| MafA5-5-3 | 1.32 ± 0.15 | 149.3 ± 4.79 | 50.70 ± 4.79 | 2.97 ± 0.11 | 0.460 ± 0.021 | 10.72 | 2.60 ± 0.00 | 0.052 ± 0.005 | 6.66 ± 0.20 | 0.16 ± 0.02 |
| MafA9-4-5 | 2.25 ± 0.01 | 7.02 ± 0.91 | 192.98 ± 0.91 | 8.62 ± 0.96 | 0.351 ± 0.028 | −13.15 | 7.40 ± 0.36 | 0.038 ± 0.001 | 7.69 ± 0.22 | 0.60 ± 0.02 |
| MafA11-1-1 | 2.72 ± 0.11 | 2.47 ± 0.76 | 197.53 ± 0.76 | 8.87 ± 1.21 | 0.354 ± 0.029 | −12.75 | 7.20 ± 0.22 | 0.036 ± 0.003 | 7.31 ± 0.56 | 0.63 ± 0.03 |
| MafA13-1-3 | 2.31 ± 0.11 | 4.38 ± 0.55 | 195.62 ± 0.55 | 8.88 ± 0.54 | 0.358 ± 0.017 | −11.88 | 7.33 ± 0.25 | 0.037 ± 0.001 | 7.28 ± 0.40 | 0.64 ± 0.05 |
| MafC83 | 1.51 ± 0.15 | 121.98 ± 2.42 | 78.02 ± 2.42 | 3.35 ± 0.31 | 0.342 ± 0.051 | −30.93 | 1.37 ± 0.15 | 0.018 ± 0.003 | 7.36 ± 0.22 | 0.10 ± 0.03 |
| MafF-1-7 | 2.53 ± 0.11 | 1.85 ± 0.15 | 198.15 ± 0.15 | 7.25 ± 0.37 | 0.289 ± 0.005 | −28.64 | 7.60 ± 0.10 | 0.038 ± 0.000 | 7.63 ± 0.37 | 0.67 ± 0.02 |
References
- Keller, M. Climate Change Impacts on Vineyards in Warm and Dry Areas: Challenges and Opportunities: From the ASEV Climate Change Symposium Part 1–Viticulture. Am. J. Enol. Vitic. 2023, 74, 23024. [Google Scholar] [CrossRef]
- Ubeda, C.; Hornedo-Ortega, R.; Cerezo, A.B.; Garcia-Parrilla, M.C.; Troncoso, A.M. Chemical Hazards in Grapes and Wine, Climate Change and Challenges to Face. Food Chem. 2020, 314, 126222. [Google Scholar] [CrossRef] [PubMed]
- Mavrommati, M.; Economou, C.N.; Kallithraka, S.; Papanikolaou, S.; Aggelis, G. Simultaneous Improvement of Fructophilicity and Ethanol Tolerance of Saccharomyces cerevisiae Strains through a Single Adaptive Laboratory Evolution Strategy. Carbon Resour. Convers. 2024, 100270. [Google Scholar] [CrossRef]
- Jiang, J.; Sumby, K.M.; Sundstrom, J.F.; Grbin, P.R.; Jiranek, V. Directed Evolution of Oenococcus oeni Strains for More Efficient Malolactic Fermentation in a Multi-Stressor Wine Environment. Food Microbiol. 2018, 73, 150–159. [Google Scholar] [CrossRef]
- Moreno-Olivares, J.D.; Giménez-Bañón, M.J.; Ruiz-García, L.; Cebrián-Pérez, A.; Bleda-Sánchez, J.A.; Gil-Muñoz, R. New Wines Characterised by Their Low Alcohol and Extraordinary Polyphenolic Content. Eur. Food Res. Technol. 2025, 251, 233–246. [Google Scholar] [CrossRef]
- Shaw, C.L.; Dolan, R.; Corsi, A.M.; Goodman, S.; Pearson, W. Exploring the Barriers and Triggers towards the Adoption of Low- and No-Alcohol (NOLO) Wines. Food Qual. Prefer. 2023, 110, 104932. [Google Scholar] [CrossRef]
- Gutiérrez, A.R.; Portu, J.; López, R.; Garijo, P.; González-Arenzana, L.; Santamaría, P. Carbonic Maceration Vinification: A Tool for Wine Alcohol Reduction. Food Chem. 2023, 426, 136558. [Google Scholar] [CrossRef]
- Bedoya, K.; Buetas, L.; Rozès, N.; Mas, A.; Portillo, M.C. Influence of Different Stress Factors during the Elaboration of Grape Must’s Pied de Cuve on the Dynamics of Yeast Populations during Alcoholic Fermentation. Food Microbiol. 2024, 123, 104571. [Google Scholar] [CrossRef]
- Garrigós, V.; Vallejo, B.; Mollà-Martí, E.; Picazo, C.; Peltier, E.; Marullo, P.; Matallana, E.; Aranda, A. Up-Regulation of Retrograde Response in Yeast Increases Glycerol and Reduces Ethanol during Wine Fermentation. J. Biotechnol. 2024, 390, 28–38. [Google Scholar] [CrossRef]
- Montevecchi, G.; Ricci, A.; Masino, F.; Ferrari, V.; Versari, A.; Antonelli, A. Profile of Red Wine Partially Dealcoholized with a Membrane-Based Technique and Strategies to Mitigate the Loss of Volatile Compounds. Curr. Res. Food Sci. 2024, 8, 100776. [Google Scholar] [CrossRef]
- Jolly, N.; Mehlomakulu, N.N.; Nortje, S.; Beukes, L.; Hoff, J.; Booyse, M.; Erten, H. Non-Saccharomyces Yeast for Lowering Wine Alcohol Levels: Partial Aeration versus Standard Conditions. FEMS Yeast Res. 2022, 22, foac002. [Google Scholar] [CrossRef] [PubMed]
- Benavides, S.; Franco, W.; Lecco, C.C.D.; Durán, A.; Urtubia, A. Evaluation of Indigenous Candida oleophila and Candida boidinii in Monoculture and Sequential Fermentations: Impact on Ethanol Reduction and Chemical Profile in Chilean Sauvignon Blanc Wines. J. Fungi 2022, 8, 259. [Google Scholar] [CrossRef] [PubMed]
- Mančić, S.; Stamenković Stojanović, S.; Danilović, B.; Djordjević, N.; Malićanin, M.; Lazić, M.; Karabegović, I. Oenological Characterization of Native Hanseniaspora uvarum Strains. Fermentation 2022, 8, 92. [Google Scholar] [CrossRef]
- Urbina, Á.; Calderón, F.; Benito, S. The Combined Use of Lachancea thermotolerans and Lactiplantibacillus plantarum (Former Lactobacillus plantarum) in Wine Technology. Foods 2021, 10, 1356. [Google Scholar] [CrossRef]
- Hranilovic, A.; Gambetta, J.M.; Jeffery, D.W.; Grbin, P.R.; Jiranek, V. Lower-Alcohol Wines Produced by Metschnikowia pulcherrima and Saccharomyces cerevisiae Co-fermentations: The Effect of Sequential Inoculation Timing. Int. J. Food Microbiol. 2020, 329, 108651. [Google Scholar] [CrossRef] [PubMed]
- Capece, A.; Pietrafesa, A.; Pietrafesa, R.; Garrigós, V.; Tedesco, F.; Romano, P.; Matallana, E.; Siesto, G.; Aranda, A. Impact of Starmerella bacillaris and Zygosaccharomyces bailii on Ethanol Reduction and Saccharomyces cerevisiae Metabolism during Mixed Wine Fermentations. Food Res. Int. 2022, 159, 111649. [Google Scholar] [CrossRef]
- Wang, B.; Tan, F.; Chu, R.; Li, G.; Li, L.; Yang, T.; Zhang, M. The Effect of Non-Saccharomyces Yeasts on Biogenic Amines in Wine. Trends Food Sci. Technol. 2021, 116, 1029–1040. [Google Scholar] [CrossRef]
- Fernandes, T.; Osório, C.; Sousa, M.J.; Franco-Duarte, R. Contributions of Adaptive Laboratory Evolution towards the Enhancement of the Biotechnological Potential of Non-conventional Yeast Species. J. Fungi 2023, 9, 186. [Google Scholar] [CrossRef] [PubMed]
- Sánchez, M.L.; Chimeno, S.V.; Mercado, L.A.; Ciklic, I.F. Hybridization and Spore Dissection of Native Wine Yeasts for Improvement of Ethanol Resistance and Osmotolerance. World J. Microbiol. Biotechnol. 2022, 38, 225. [Google Scholar] [CrossRef]
- Zhang, Q.; Miao, R.; Feng, R.; Yan, J.; Wang, T.; Gan, Y.; Zhao, J.; Lin, J.; Gan, B. Application of Atmospheric and Room-Temperature Plasma (ARTP) to Microbial Breeding. Curr. Issues Mol. Biol. 2023, 45, 6466–6484. [Google Scholar] [CrossRef]
- Nie, X.; Xing, Y.; Li, Q.; Gao, F.; Wang, S.; Liu, P.; Li, X.; Tan, Z.; Wang, P.; Shi, H. ARTP Mutagenesis Promotes Selenium Accumulation in Saccharomyces boulardii. LWT 2022, 168, 113916. [Google Scholar] [CrossRef]
- Yun, J.; Zabed, H.M.; Zhang, Y.; Zhang, G.; Zhao, M.; Qi, X. Improving Tolerance and 1,3-Propanediol Production of Clostridium butyricum Using Physical Mutagenesis, Adaptive Evolution and Genome Shuffling. Bioresour. Technol. 2022, 363, 127967. [Google Scholar] [CrossRef] [PubMed]
- Li, Y.; Zhang, Y.; Ye, D.; Song, Y.; Shi, J.; Qin, Y.; Liu, Y. Impact of Serine and Serine Synthesis Genes on H2S Release in Saccharomyces cerevisiae during Wine Fermentation. Food Microbiol. 2022, 103, 103961. [Google Scholar] [CrossRef]
- Li, Y.; Zhang, Y.; Liu, M.; Qin, Y.; Liu, Y. Saccharomyces cerevisiae Isolates with Extreme Hydrogen Sulfide Production Showed Different Oxidative Stress Resistances Responses during Wine Fermentation by RNA Sequencing Analysis. Food Microbiol. 2019, 79, 147–155. [Google Scholar] [CrossRef]
- Liu, N.; Qin, Y.; Song, Y.; Ye, D.; Yuan, W.; Pei, Y.; Xue, B.; Liu, Y. Selection of Indigenous Saccharomyces cerevisiae Strains in Shanshan County (Xinjiang, China) for Winemaking and Their Aroma-Producing Characteristics. World J. Microbiol. Biotechnol. 2015, 31, 1781–1792. [Google Scholar] [CrossRef]
- Chen, Y.; Jiang, J.; Song, Y.; Zang, X.; Wang, G.; Pei, Y.; Song, Y.; Qin, Y.; Liu, Y. Yeast Diversity during Spontaneous Fermentations and Oenological Characterisation of Indigenous Saccharomyces cerevisiae for Potential as Wine Starter Cultures. Microorganisms 2022, 10, 1455. [Google Scholar] [CrossRef] [PubMed]
- Ge, X.; Liu, Y.; Wang, X.; Gao, C.; Mu, J.; Wang, W.; Wang, J. Correlations between Microbes with Volatile Compounds and Physicochemical Indicators of Cabernet Sauvignon Wines Fermented with Different Starters. LWT-Food Sci. Technol. 2024, 198, 115918. [Google Scholar] [CrossRef]
- Yang, L.; Zhu, X.; Mao, Y.; Zhang, X.; Xu, B.; Yang, X. Effect of Different Inoculation Strategies of Mixed Culture Saccharomyces cerevisiae/Oenococcus oeni on the Aroma Quality of Chardonnay Wine. Food Res. Int. 2024, 190, 114636. [Google Scholar] [CrossRef]
- Stribny, J.; Querol, A.; Pérez-Torrado, R. Differences in Enzymatic Properties of the Saccharomyces kudriavzevii and Saccharomyces uvarum Alcohol Acetyltransferases and Their Impact on Aroma-Active Compounds Production. Front. Microbiol. 2016, 7, 897. [Google Scholar] [CrossRef]
- Carpena, M.; Fraga-Corral, M.; Otero, P.; Nogueira, R.A.; Garcia-Oliveira, P.; Prieto, M.A.; Simal-Gandara, J. Secondary Aroma: Influence of Wine Microorganisms in Their Aroma Profile. Foods 2021, 10, 51. [Google Scholar] [CrossRef]
- Tekarslan-Sahin, S.H. Adaptive Laboratory Evolution of Yeasts for Aroma Compound Production. Fermentation 2022, 8, 372. [Google Scholar] [CrossRef]
- Wei, J.; Zhang, Y.; Wang, Y.; Ju, H.; Niu, C.; Song, Z.; Yuan, Y.; Yue, T. Assessment of Chemical Composition and Sensorial Properties of Ciders Fermented with Different Non-Saccharomyces Yeasts in Pure and Mixed Fermentations. Int. J. Food Microbiol. 2020, 318, 108471. [Google Scholar] [CrossRef] [PubMed]
- van Wyk, N.; Grossmann, M.; Wendland, J.; von Wallbrunn, C.; Pretorius, I.S. The Whiff of Wine Yeast Innovation: Strategies for Enhancing Aroma Production by Yeast during Wine Fermentation. J. Agric. Food Chem. 2019, 67, 13496–13505. [Google Scholar] [CrossRef]
- Martin, V.; Valera, M.J.; Medina, K.; Boido, E.; Carrau, F. Oenological Impact of the Hanseniaspora/Kloeckera Yeast Genus on Wines-A Review. Fermentation 2018, 4, 76. [Google Scholar] [CrossRef]
- Coletta, A.; Toci, A.T.; Pati, S.; Ferrara, G.; Grieco, F.; Tufariello, M.; Crupi, P. Effect of Soil Management and Training System on Negroamaro Wine Aroma. Foods 2021, 10, 454. [Google Scholar] [CrossRef] [PubMed]
- Mestre, M.V.; Maturano, Y.P.; Gallardo, C.; Combina, M.; Mercado, L.; Toro, M.E.; Carrau, F.; Vazquez, F.; Dellacassa, E. Impact on Sensory and Aromatic Profile of Low Ethanol Malbec Wines Fermented by Sequential Culture of Hanseniaspora uvarum and Saccharomyces cerevisiae Native Yeasts. Fermentation 2019, 5, 65. [Google Scholar] [CrossRef]
- van Wyk, N.; Badura, J.; von Wallbrunn, C.; Pretorius, I.S. Exploring Future Applications of the Apiculate Yeast Hanseniaspora. Crit. Rev. Biotechnol. 2024, 44, 100–119. [Google Scholar] [CrossRef]
- Gonzalez, R.; Guindal, A.M.; Tronchoni, J.; Morales, P. Biotechnological Approaches to Lowering the Ethanol Yield during Wine Fermentation. Biomolecules 2021, 11, 1569. [Google Scholar] [CrossRef]
- Rossouw, D.; Bauer, F.F. Exploring the Phenotypic Space of Non-Saccharomyces Wine Yeast Biodiversity. Food Microbiol. 2016, 55, 32–46. [Google Scholar] [CrossRef]
- Navarro-Tapia, E.; Querol, A.; Pérez-Torrado, R. Membrane Fluidification by Ethanol Stress Activates Unfolded Protein Response in Yeasts. Microb. Biotechnol. 2018, 11, 465–475. [Google Scholar] [CrossRef]
- Du, Q.; Ye, D.; Zang, X.; Nan, H.; Liu, Y. Effect of Low Temperature on the Shaping of Yeast-Derived Metabolite Compositions during Wine Fermentation. Food Res. Int. 2022, 162, 112016. [Google Scholar] [CrossRef] [PubMed]
- Gao, X.; Liu, E.; Yin, Y.; Yang, L.; Huang, Q.; Chen, S.; Ho, C.-T. Enhancing Activities of Salt-Tolerant Proteases Secreted by Aspergillus oryzae Using Atmospheric and Room-Temperature Plasma Mutagenesis. J. Agric. Food Chem. 2020, 68, 2757–2764. [Google Scholar] [CrossRef]
- Wang, C.; Mas, A.; Esteve-Zarzoso, B. Interaction between Hanseniaspora uvarum and Saccharomyces cerevisiae during Alcoholic Fermentation. Int. J. Food Microbiol. 2015, 206, 67–74. [Google Scholar] [CrossRef] [PubMed]
- Quirós, M.; Rojas, V.; Gonzalez, R.; Morales, P. Selection of Non-Saccharomyces Yeast Strains for Reducing Alcohol Levels in Wine by Sugar Respiration. Int. J. Food Microbiol. 2014, 181, 85–91. [Google Scholar] [CrossRef]
- Hranilovic, A.; Albertin, W.; Capone, D.L.; Gallo, A.; Grbin, P.R.; Danner, L.; Bastian, S.E.P.; Masneuf-Pomarede, I.; Coulon, J.; Bely, M.; et al. Impact of Lachancea thermotolerans on Chemical Composition and Sensory Profiles of Merlot Wines. Food Chem. 2021, 349, 129015. [Google Scholar] [CrossRef] [PubMed]
- Li, J.; Hong, M.; Qi, B. Impact of Torulaspora delbrueckii During Fermentation on Aromatic Profile of Vidal Blanc Icewine. Front. Microbiol. 2022, 13, 860128. [Google Scholar] [CrossRef]
- Vaquero, C.; Escott, C.; Heras, J.M.; Carrau, F.; Morata, A. Co-Inoculations of Lachancea thermotolerans with Different Hanseniaspora Spp.: Acidification, Aroma, Biocompatibility, and Effects of Nutrients in Wine. Food Res. Int. 2022, 161, 111891. [Google Scholar] [CrossRef]
- Jiang, X.; Lu, Y.; Liu, S.Q. Effects of Different Yeasts on Physicochemical and Oenological Properties of Red Dragon Fruit Wine Fermented with Saccharomyces cerevisiae, Torulaspora delbrueckii and Lachancea thermotolerans. Microorganisms 2020, 8, 315. [Google Scholar] [CrossRef]
- Gonzalez, R.; Quirós, M.; Morales, P. Yeast Respiration of Sugars by Non-Saccharomyces Yeast Species: A Promising and Barely Explored Approach to Lowering Alcohol Content of Wines. Trends Food Sci. Technol. 2013, 29, 55–61. [Google Scholar] [CrossRef]
- Magyar, I.; Tóth, T. Comparative Evaluation of Some Oenological Properties in Wine Strains of Candida stellata, Candida zemplinina, Saccharomyces uvarum and Saccharomyces cerevisiae. Food Microbiol. 2011, 28, 94–100. [Google Scholar] [CrossRef]
- Hu, K.; Jin, G.-J.; Mei, W.-C.; Li, T.; Tao, Y.-S. Increase of Medium-Chain Fatty Acid Ethyl Ester Content in Mixed H. uvarum/S. cerevisiae Fermentation Leads to Wine Fruity Aroma Enhancement. Food Chem. 2018, 239, 495–501. [Google Scholar] [CrossRef]
- Zhang, B.; Tang, C.; Yang, D.; Liu, H.; Xue, J.; Duan, C.; Yan, G. Effects of Three Indigenous Non-Saccharomyces Yeasts and Their Pairwise Combinations in Co-fermentation with Saccharomyces cerevisiae on Volatile Compounds of Petit Manseng Wines. Food Chem. 2022, 368, 130807. [Google Scholar] [CrossRef] [PubMed]
- Sumby, K.M.; Grbin, P.R.; Jiranek, V. Microbial Modulation of Aromatic Esters in Wine: Current Knowledge and Future Prospects. Food Chem. 2010, 121, 1–16. [Google Scholar] [CrossRef]
- Kruis, A.J.; Bohnenkamp, A.C.; Patinios, C.; van Nuland, Y.M.; Levisson, M.; Mars, A.E.; van den Berg, C.; Kengen, S.W.M.; Weusthuis, R.A. Microbial Production of Short and Medium Chain Esters: Enzymes, Pathways, and Applications. Biotechnol. Adv. 2019, 37, 107407. [Google Scholar] [CrossRef] [PubMed]
- Xu, Z.; Lin, L.; Chen, Z.; Wang, K.; Sun, J.; Zhu, T. The Same Genetic Regulation Strategy Produces Inconsistent Effects in Different Saccharomyces cerevisiae Strains for 2-Phenylethanol Production. Appl. Microbiol. Biotechnol. 2022, 106, 4041–4052. [Google Scholar] [CrossRef]
- Viana, F.; Belloch, C.; Vallés, S.; Manzanares, P. Monitoring a Mixed Starter of Hanseniaspora vineae–Saccharomyces cerevisiae in Natural Must: Impact on 2-Phenylethyl Acetate Production. Int. J. Food Microbiol. 2011, 151, 235–240. [Google Scholar] [CrossRef]


| Species | Strains | Geographic Origin |
|---|---|---|
| Saccharomyces cerevisiae | CECA (commercial wine yeast from Angel Yeast) | Ningxia |
| Hanseniaspora guilliermondii | Hg01W23, HgA12, HgB14, HgC24, HgC31, HgC44, HgD11, HgD15 | Shaanxi |
| HgA17210 | Xinjiang | |
| Hanseniaspora opuntiae | Ho01W25, Ho23W64, Ho23W68, HoA-1-3, HoB-1-1, HoB-1-5, HoB21, HoB23, HoB715, HoC13, HoC14, HoC15, HoC33, HoC41, HoC42, HoD12, HoD13 | Shaanxi |
| Hanseniaspora uvarum | Hu13W76, HuBS6, HuB22, HuBG15, HuBG16, HuC23, HuC25, HuC01, HuC45 | Shaanxi |
| HuA616, HuA1112, HuM69 | Xinjiang | |
| HuC413, HuC466, HuC534 | Gansu | |
| HuF21 | Ningxia | |
| Metschnikowia aff fructicola | MafA553, MafA945, MafA1111, MafA1313 | Xinjiang |
| MafC83 | Gansu | |
| MafF17 | Ningxia | |
| Pichia kluyveri | Pk1M114, Pk1M118, Pk1M144 | Xinjiang |
| Pk1C734 | Gansu | |
| Pk1FS27 | Ningxia | |
| Pichia kudriavzevii | Pk2B419, Pk2B4S1, Pk2B61, Pk2B9S2 | Shaanxi |
| Pk2C392, Pk2C396 | Gansu | |
| Pk2GS118, Pk2GS120, Pk2M11 | Ningxia | |
| Pk2M100, Pk2M101, Pk2130, Pk2131 | Xinjiang |
| Isolates | Sugar Tolerance Test (g/L) | Ethanol Tolerance Test (%) | Temperature Tolerance Test (°C) | H2S Production | Killer Phenotype | |||||||||
|---|---|---|---|---|---|---|---|---|---|---|---|---|---|---|
| 100 | 200 | 300 | 400 | 2 | 4 | 6 | 8 | 10 | 20 | 30 | 40 | |||
| HoA13 | +++ | +++ | +++ | ++ | +++ | +++ | ++ | + | + | +++ | +++ | ++ | − | − |
| HoC42 | +++ | +++ | +++ | ++ | +++ | +++ | ++ | + | ++ | +++ | +++ | +++ | − | − |
| HuB22 | +++ | +++ | +++ | ++ | +++ | ++ | + | + | ++ | +++ | +++ | + | + | − |
| HuC01 | +++ | +++ | +++ | ++ | +++ | +++ | ++ | + | ++ | +++ | +++ | ++ | − | − |
| SC | SH1 | SH2 | SH3 | |
|---|---|---|---|---|
| Sugar (g/L) | 4.36 ± 0.80 a | 4.02 ± 0.47 a | 3.61 ± 0.08 a | 3.75 ± 0.02 a |
| Ethanol (% v/v) | 15.13 ± 0.22 a | 13.74 ± 0.12 b | 13.76 ± 0.10 b | 13.75 ± 0.07 b |
| Ethanol Yield (g/g) | 0.48 ± 0.01 a | 0.43 ± 0 b | 0.43 ± 0 b | 0.43 ± 0 b |
| ∆ethanol (% v/v) | 0 | −10.42 | −10.42 | −10.42 |
| Glycerol (g/L) | 6.25 ± 0.08 a | 8.79 ± 0.09 b | 9.13 ± 0.07 bc | 8.93 ± 0.12 b |
| Total Acidity (g/L) | 8.18 ± 0.14 a | 7.80 ± 0.11 ab | 7.38 ± 0.28 b | 7.75 ± 0.23 ab |
| Citric Acid (g/L) | 0.15 ± 0 a | 0.14 ± 0.01 ab | 0.12 ± 0.02 b | 0.15 ± 0 a |
| Tartaric Acid (g/L) | 1.18 ± 0.04 c | 1.81 ± 0.09 a | 1.48 ± 0.14 b | 1.63 ± 0.08 ab |
| Pyruvic Acid (mg/L) | 59.89 ± 3.4 a | 50.20 ± 0.07 b | 37.49 ± 3.97 c | 55.72 ± 5.06 ab |
| Malic Acid (g/L) | 2.36 ± 0.20 a | 2.03 ± 0.04 bc | 1.81 ± 0.07 c | 2.11 ± 0.11 ab |
| Succinic Acid (g/L) | 3.58 ± 0.31 a | 2.79 ± 0.05 b | 2.87 ± 0.03 b | 2.87 ± 0.09 b |
| Lactic Acid (g/L) | 0.29 ± 0.01 a | 0.31 ± 0.03 a | 0.27 ± 0.04 a | 0.34 ± 0.09 a |
| Fumaric Acid (g/L) | 0.02 ± 0 a | 0.02 ± 0 a | 0.02 ± 0 a | 0.02 ± 0 a |
| Acetic Acid (g/L) | 0.54 ± 0.02 a | 0.66 ± 0.06 b | 0.60 ± 0.02 ab | 0.59 ± 0.03 a |
| Compounds (mg/L) | SC | SH1 | SH2 | SH3 | Odor Threshold (mg/L) | OVA | Odors |
|---|---|---|---|---|---|---|---|
| Isobutanol | 164.12 ± 8.46 a | 87.01 ± 0.40 c | 91.05 ± 5.94 c | 114.31 ± 9.78 b | 40 | >1 | Fusel alcohol |
| 4-Methyl-1-pentanol | 13.20 ± 2.11 c | 43.27 ± 3.02 a | 35.63 ± 0.97 b | 32.60 ± 2.21 b | 1 | <0.1 | Almond, toasted |
| 3-Methyl-1-Butanol | 221.19 ± 1.51 a | 175.04 ± 0.26 c | 190.04 ± 9.31 b | 210.77 ± 5.84 a | 30 | >1 | whiskey, nail polish |
| 1-Hexanol | 4.40 ± 0.21 a | 4.22 ± 0.32 a | 4.07 ± 0.25 a | 4.65 ± 0.59 a | 8 | 0.1–1 | Green, grass |
| (E)-3-Hexen-1-ol | 0.20 ± 0.01 a | 0.18 ± 0 a | 0.17 ± 0 a | 0.21 ± 0 a | 1 | 0.1–1 | Herbaceous, green |
| (Z)-3-Hexen-1-ol | 0.20 ± 0.02 a | 0.17 ± 0 a b | 0.16 ± 0.01 b | 0.18 ± 0.02 a b | 0.4 | 0.1–1 | Green, cypress |
| 2,3-Butanediol | 26.44 ± 3.75 a | 12.97 ± 0.57 b | 14.27 ± 1.11 b | 21.99 ± 3.46 a | 120 | 0.1–1 | Butter, creamy |
| Phenylethyl alcohol | 94.76 ± 0.31 c | 155.42 ± 10.55 b | 175.43 ± 3.12 a | 184.15 ± 3.26 a | 10 | >1 | Floral, rose |
| ∑Higher alcohols | 511.33 ± 8.32 b | 435.051 ± 10.79 d | 475.22 ± 9.50 c | 536.29 ± 8.84 a | |||
| Ethyl acetate | 85.29 ± 7.31 d | 164.45 ± 7.33 c | 186.15 ± 2.69 b | 238.66 ± 13.68 a | 7.50 | >1 | Fruity, nail polish, balsamic |
| Isobutyl acetate | 0.02 ± 0 a | 0.03 ± 0 b | 0.03 ± 0 b | 0.04 ± 0 b | 1.60 | <0.1 | Waxy, fruity, apple, banana |
| Isoamyl acetate | 1.07 ± 0.02 d | 1.58 ± 0 c | 1.80 ± 0.05 b | 2.07 ± 0.02 a | 0.03 | >1 | Banana |
| Hexyl acetate | 12.23 ± 1.12 b | 18.32 ± 3.39 ab | 16.55 ± 2.09 b | 23.91 ± 4.39 a | 0.67 | <0.1 | Fruity, floral |
| Geranyl acetate | 11.25 ± 0.31 c | 12.70 ± 0.44 b | 13.74 ± 0.37 a | 12.47 ± 0.40 b | 0.06 | 0.1–1 | Floral |
| Phenethyl acetate | 0.19 ± 0 c | 0.49 ± 0.04 b | 0.45 ± 0.04 b | 0.65 ± 20.0 a | 0.25 | >0.1 | Honey, floral, fruity |
| ∑Acetate esters | 86.60 ± 0.73 d | 166.58 ± 7.37 c | 188.44 ± 2.76 b | 241.45 ± 13.65 a | |||
| Ethyl 2-methylbutanoate | 24.21 ± 2.46 a | 2.18 ± 0.10 c | 6.09 ± 0.17 b | 8.61 ± 0.46 b | 0.02 | >1 | Apple, berry, sweet, cider, anise |
| Ethyl hexanoate | 2.71 ± 0.39 a | 2.16 ± 0.02 b | 2.01 ± 0.04 b | 2.64 ± 0.02 a | 0 | >1 | Fruity, green apple, floral, violet |
| Ethyl lactate | 3.16 ± 0.41 a | 1.69 ± 0.15 b | 1.70 ± 0.13 b | 2.20 ± 0.26 b | 146 | <0.1 | Fruity, buttery |
| Ethyl nonanoate | 0.03 ± 0 b | 0.04 ± 0 a | 0.02 ± 0 c | 0.03 ± 0 b | 1.30 | <0.1 | Waxy, fruity, rose, rum |
| Diethyl succinate | 0.86 ± 0.16 a | 0.62 ± 0.03 b | 0.60 ± 0.06 b | 0.59 ± 0.07 b | 6 | 0.1–1 | Wine, fruity |
| Ethyl laurate | 1.73 ± 0.12 a | 1.46 ± 0.08 b | 1.40 ± 0.07 b | 1.04 ± 0.02 c | 146 | <0.1 | Fruity, buttery |
| Ethyl hexadecanoate | 0.94 ± 0.12 a | 0.93 ± 0.07 a | 0.92 ± 0.10 a | 0.86 ± 0.04 a | 1.50 | 0.1–1 | Fatty, rancid, fruity, sweet |
| Ethyl decanoate | 19.81 ± 2.94 a | 11.50 ± 0.74 b | 11.24 ± 1.47 b | 13.31 ± 0.15 b | 0.20 | >1 | Fruity, fatty |
| Ethyl octanoate | 11.55 ± 0.24 b | 11.62 ± 0.23 b | 8.84 ± 0.22 c | 12.67 ± 0.30 a | 0 | >1 | Pear, apricot, fruity, pineapple |
| ∑Ethyl esters | 40.82 ± 3.19 a | 30.02 ± 0.62 bc | 26.73 ± 1.94 c | 33.36 ± 0.53 b | |||
| Isobutyric acid | 16.83 ± 1.60 a | 6.34 ± 0.28 b | 6.66 ± 0.39 b | 6.93 ± 0.41 b | 2.30 | >1 | Cheese, butter, rancid |
| Isovaleric acid | 1.83 ± 0.13 a | 1.15 ± 0.08 b | 1.22 ± 0.03 b | 1.22 ± 0.06 b | 0.03 | >1 | Fatty, sweet, cheese |
| Hexanoic acid | 2.75 ± 0.37 a | 2.51 ± 0.12 a | 2.71 ± 0.16 a | 2.53 ± 0.05 a | 3.00 | >1 | Leafy, wood, varnish |
| Octanoic acid | 1.34 ± 0.21 a | 1.44 ± 0.16 a | 1.60 ± 0.10 a | 1.44 ± 0.04 a | 0.50 | >1 | Butter, almond |
| n-Decanoic acid | 0.99 ± 0.05 ab | 0.81 ± 0.16 b | 1.04 ± 0.04 a | 1.10 ± 0.04 a | 1 | >0.1 | Fatty, unpleasant |
| ∑Fatty acids | 22.75 ± 2.30 a | 11.44 ± 0.42 b | 12.18 ± 0.64 b | 12.12 ± 0.44 b | |||
| Nerol | 0.22 ± 0 a | 0.044 ± 0 c | 0.08 ± 0 b | 0.05 ± 0 c | 0.5 | 0.1–1 | Violets, floral |
| Farnesol | 0.13 ± 0.01 c | 0.18 ± 0.02 b | 0.23 ± 0.01 a | 0.18 ± 0.01 b | 0.02 | >1 | Lemon, floral, anise, honey |
| Acetoin | 11.10 ± 0.34 b | 39.43 ± 0.33 a | 11.93 ± 0.34 c | 12.39 ± 0.47 d | 150 | 0.1–1 | Butter, cream |
| ∑Terpenes | 11.46 ± 0.33 b | 39.66 ± 0.31 a | 12.27 ± 0.33 c | 12.63 ± 0.45 d |
Disclaimer/Publisher’s Note: The statements, opinions and data contained in all publications are solely those of the individual author(s) and contributor(s) and not of MDPI and/or the editor(s). MDPI and/or the editor(s) disclaim responsibility for any injury to people or property resulting from any ideas, methods, instructions or products referred to in the content. |
© 2025 by the authors. Licensee MDPI, Basel, Switzerland. This article is an open access article distributed under the terms and conditions of the Creative Commons Attribution (CC BY) license (https://creativecommons.org/licenses/by/4.0/).
Share and Cite
Yang, H.; Wei, Y.; Feng, W.; Zhang, H.; Jiang, J.; Qin, Y. Screening of Indigenous Hanseniaspora Strains from China for Ethanol Reduction in Wine. Foods 2025, 14, 1113. https://doi.org/10.3390/foods14071113
Yang H, Wei Y, Feng W, Zhang H, Jiang J, Qin Y. Screening of Indigenous Hanseniaspora Strains from China for Ethanol Reduction in Wine. Foods. 2025; 14(7):1113. https://doi.org/10.3390/foods14071113
Chicago/Turabian StyleYang, Huimin, Yue Wei, Wenqian Feng, Haoran Zhang, Jiao Jiang, and Yi Qin. 2025. "Screening of Indigenous Hanseniaspora Strains from China for Ethanol Reduction in Wine" Foods 14, no. 7: 1113. https://doi.org/10.3390/foods14071113
APA StyleYang, H., Wei, Y., Feng, W., Zhang, H., Jiang, J., & Qin, Y. (2025). Screening of Indigenous Hanseniaspora Strains from China for Ethanol Reduction in Wine. Foods, 14(7), 1113. https://doi.org/10.3390/foods14071113