Sensory Properties and Acceptability of Fermented Pearl Millet, a Climate-Resistant and Nutritious Grain, Among Consumers in the United States—A Pilot Study

 , ,
, ,
Abstract
1. Introduction
1.1. Millets as a Climate-Resistant Grain
1.2. Pearl Millet Nutrition
1.3. Fermentation of Pearl Millet to Improve Nutritional Benefits
1.4. Current Investigation
2. Study 1: Sensory Analysis of Flatbreads Made with Whole-Grain Pearl Millet
2.1. Rationale and Overview for Study 1
2.2. Ethics Statement for Study 1
2.3. Materials and Methods for Study 1
2.3.1. Participants in Study 1
2.3.2. Stimuli for Study 1
2.3.3. Sensory Procedures for Study 1
2.3.4. Analysis of Phytic Acid
2.3.5. Data Analysis for Study 1
2.4. Results for Study 1
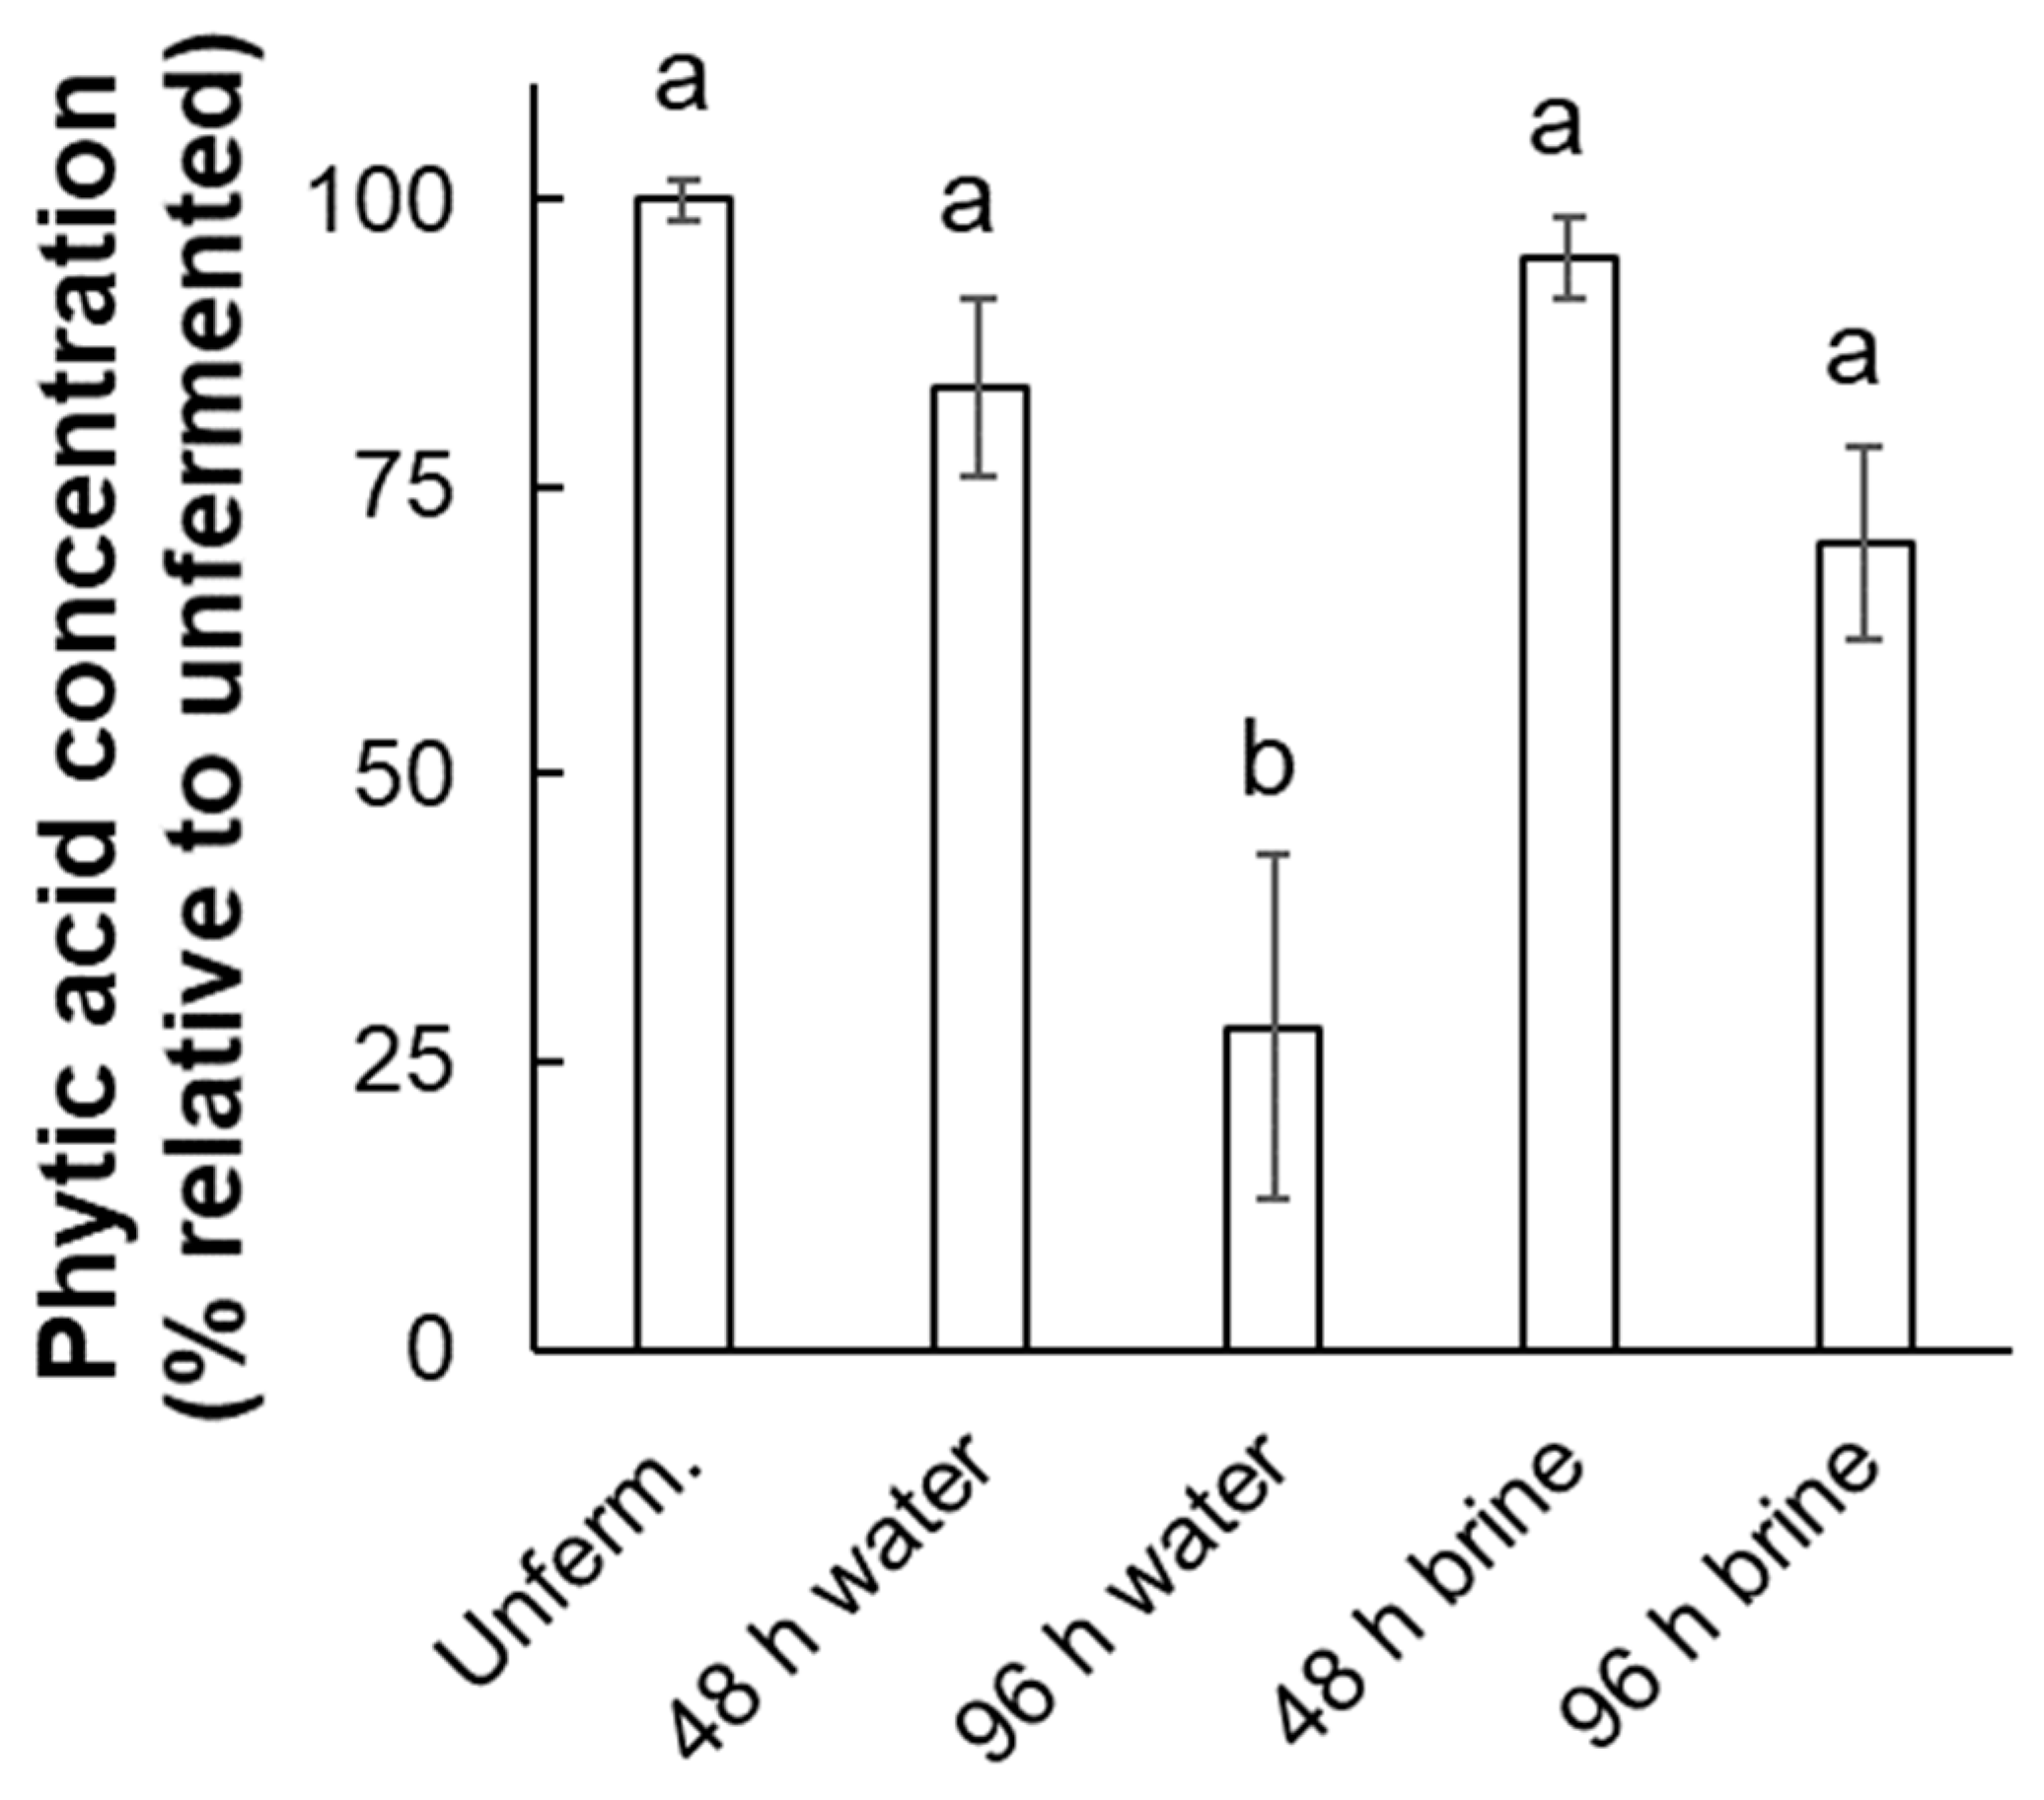
2.4.1. Phytic Acid
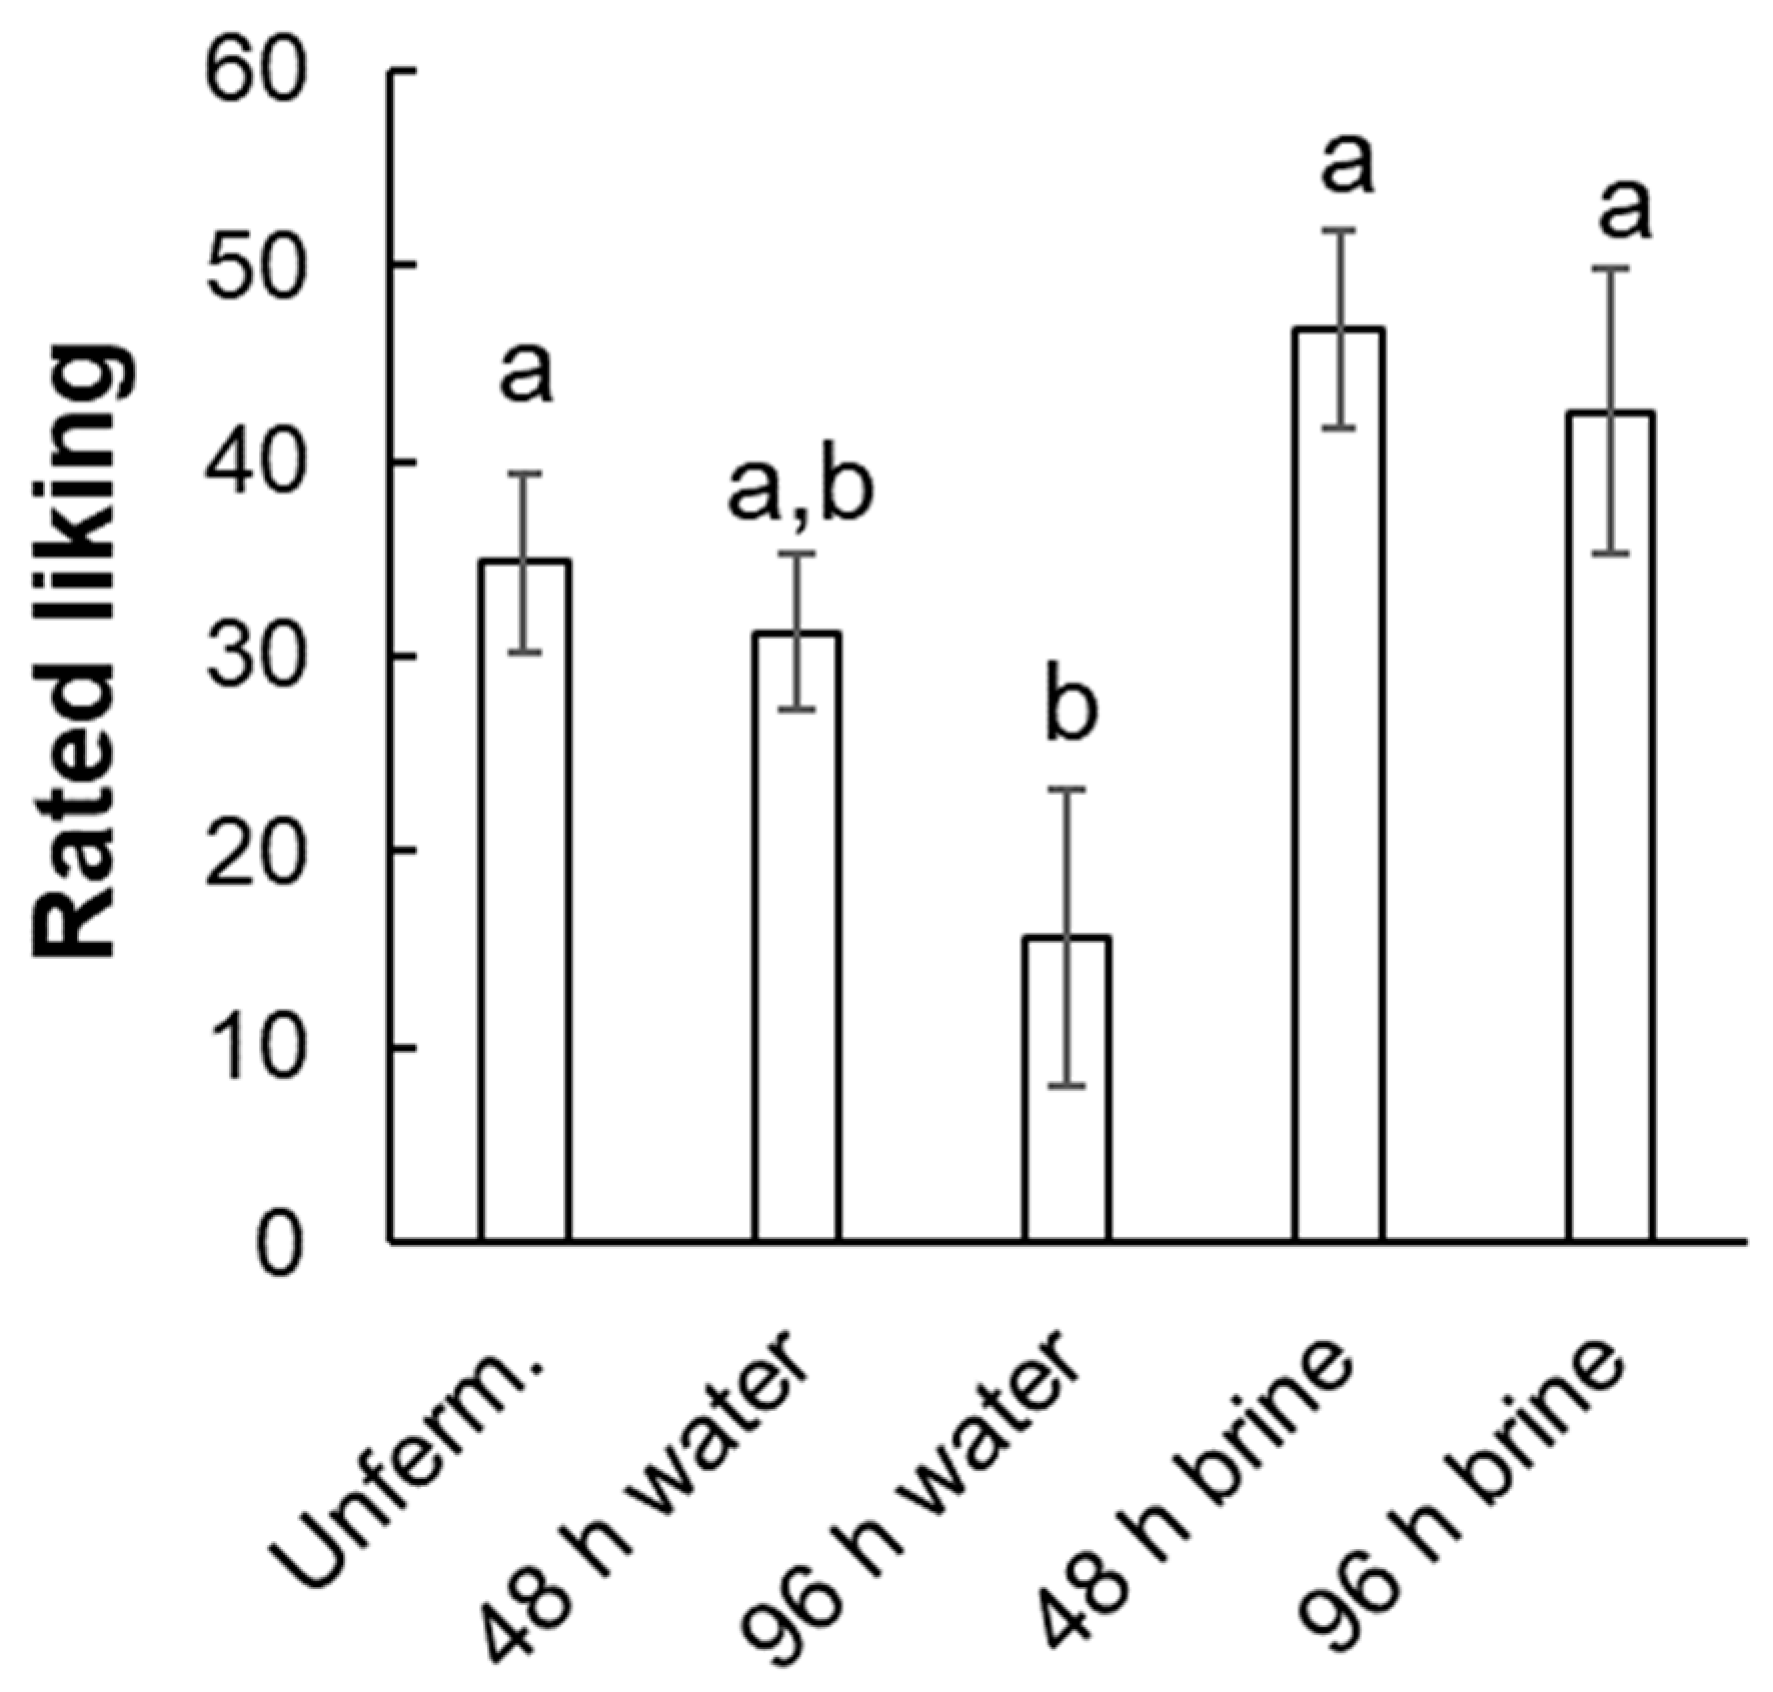
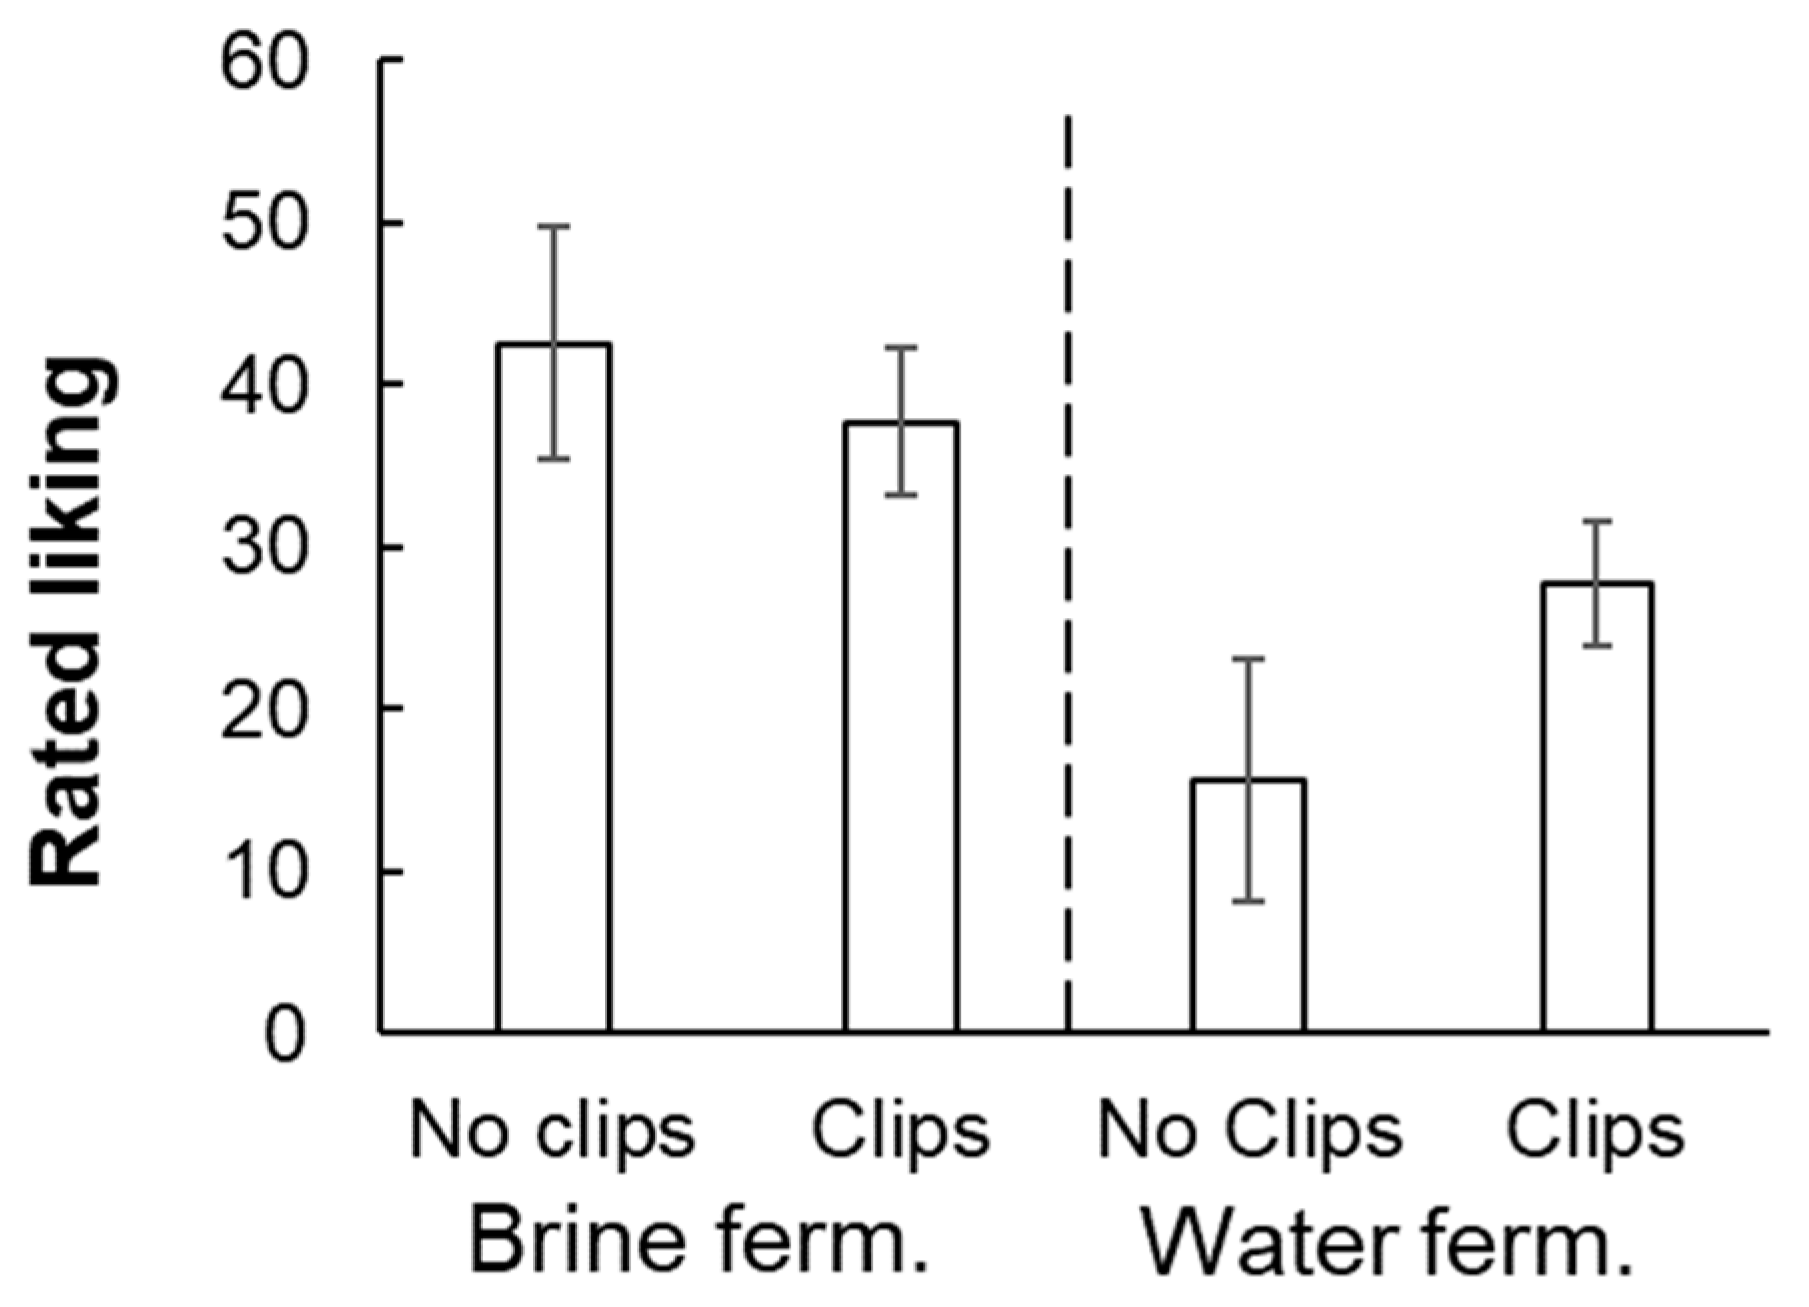
2.4.2. Liking
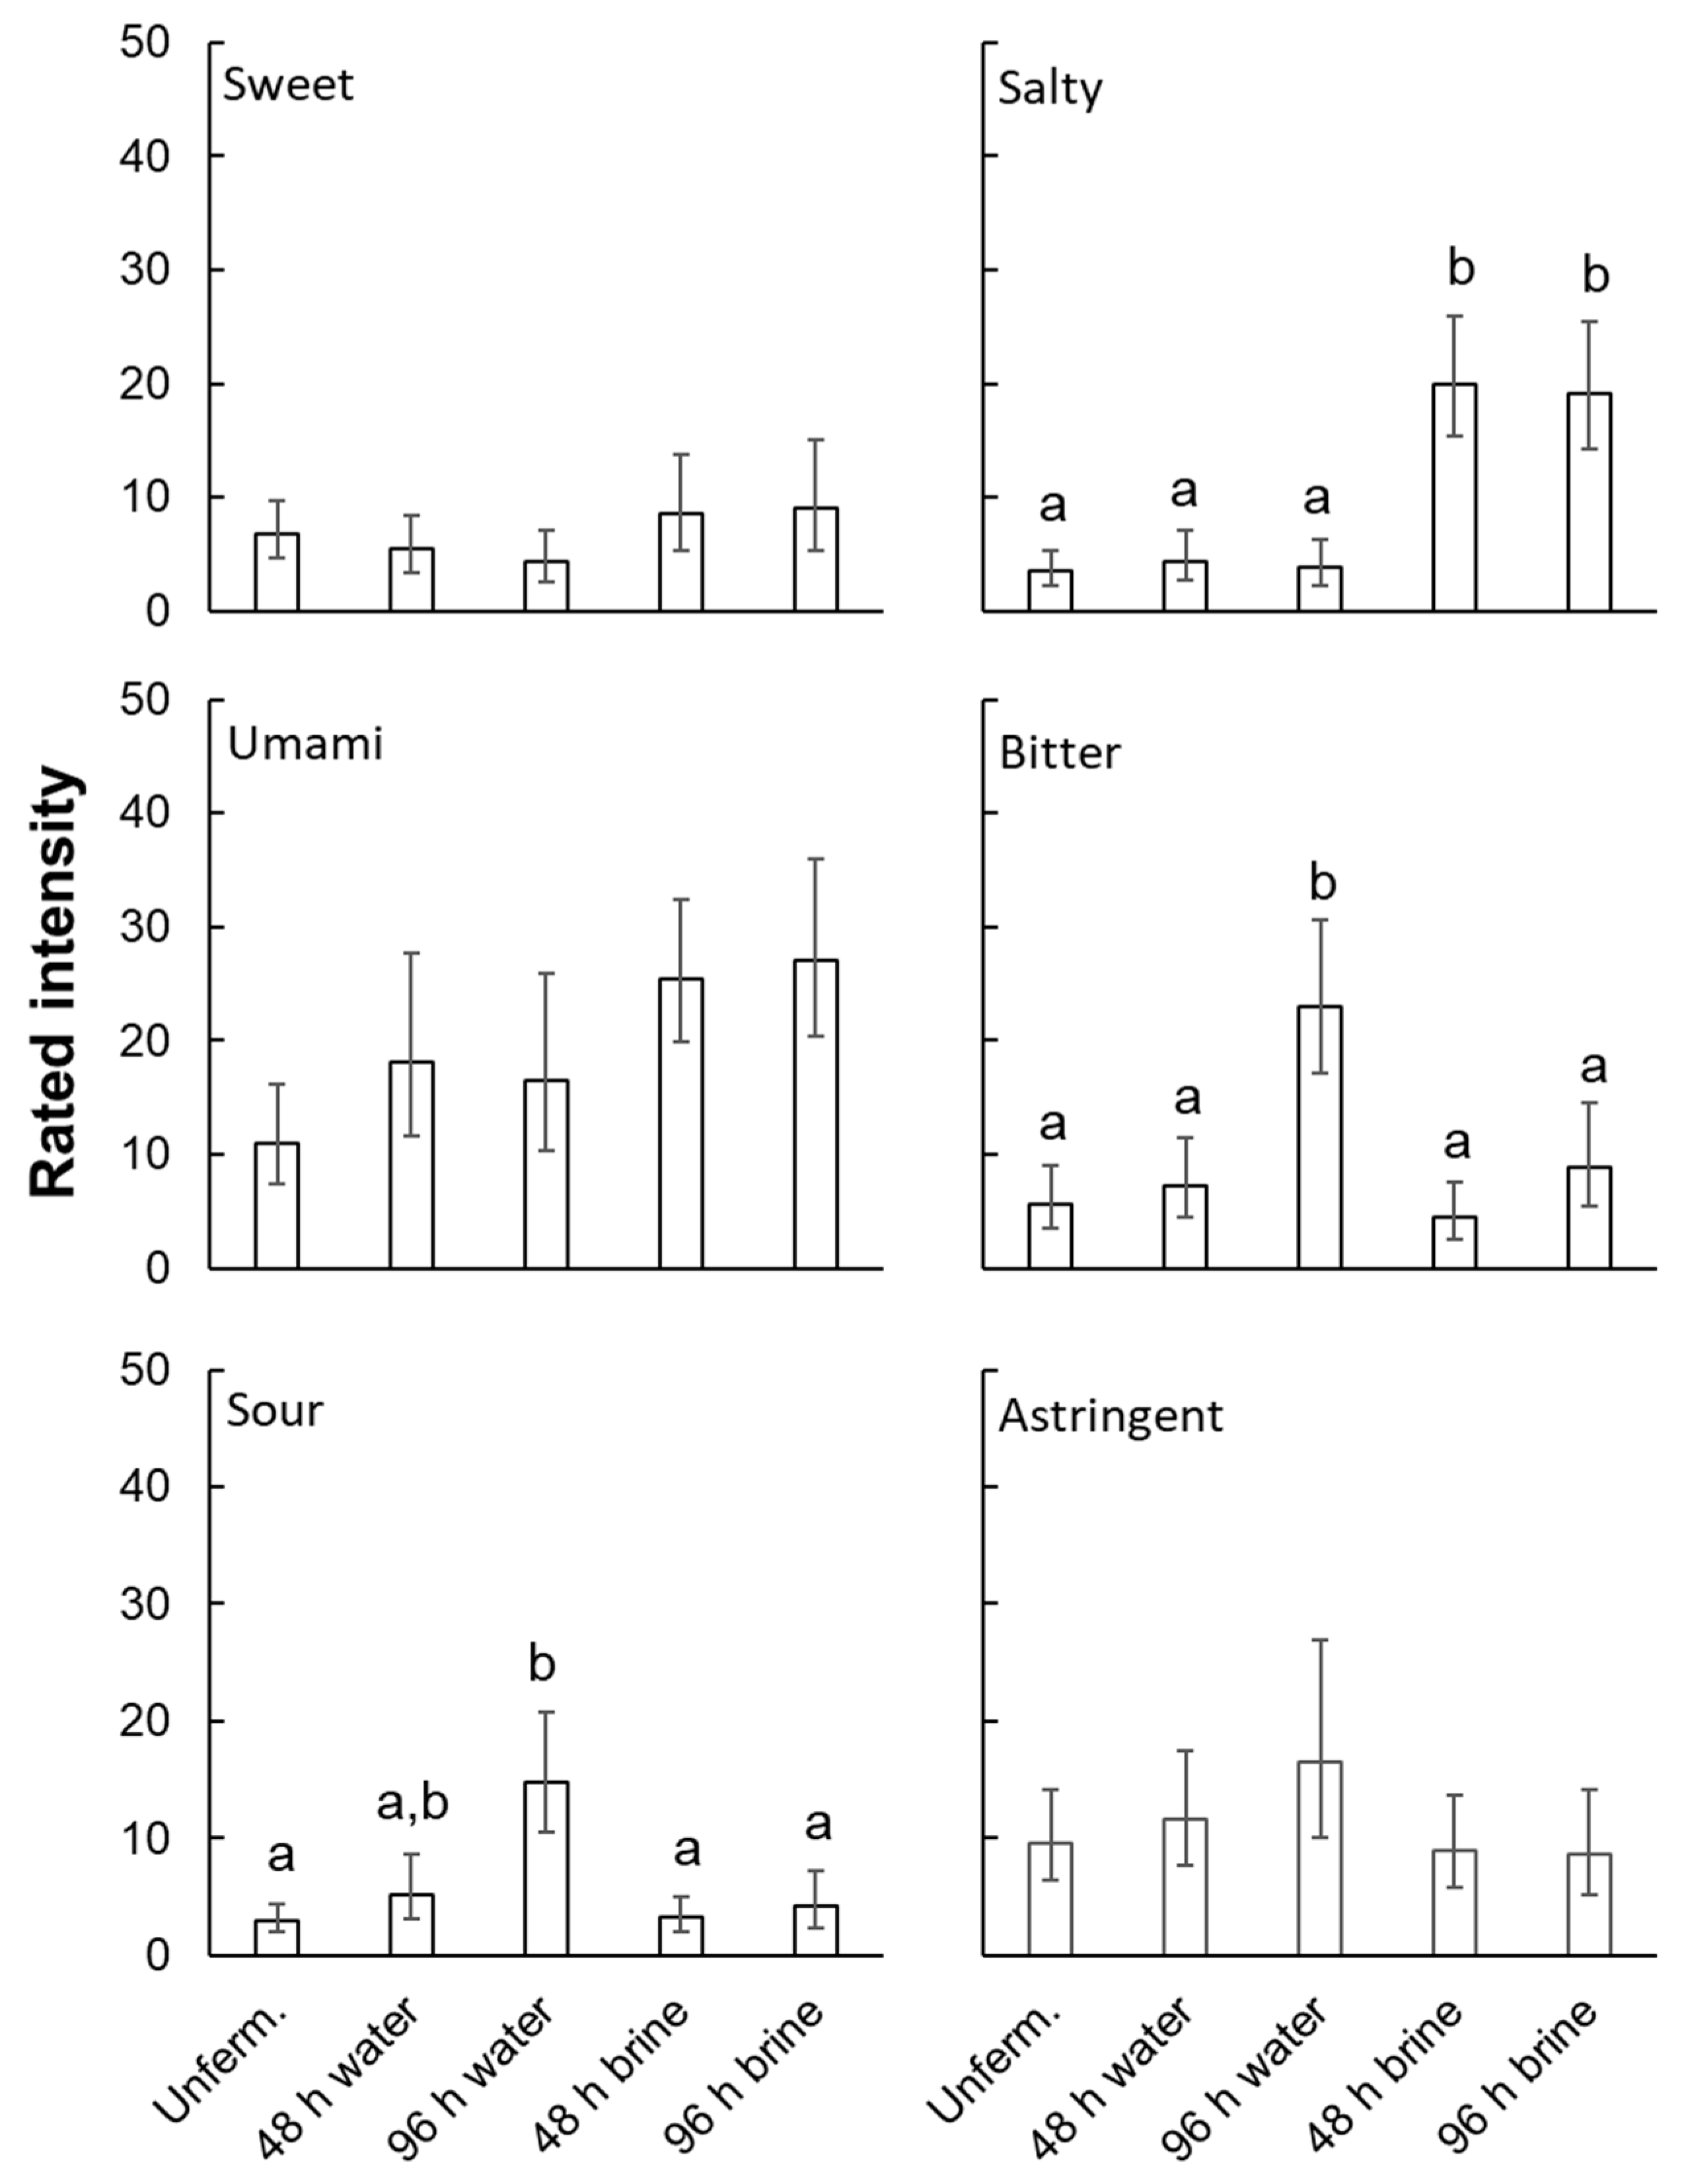
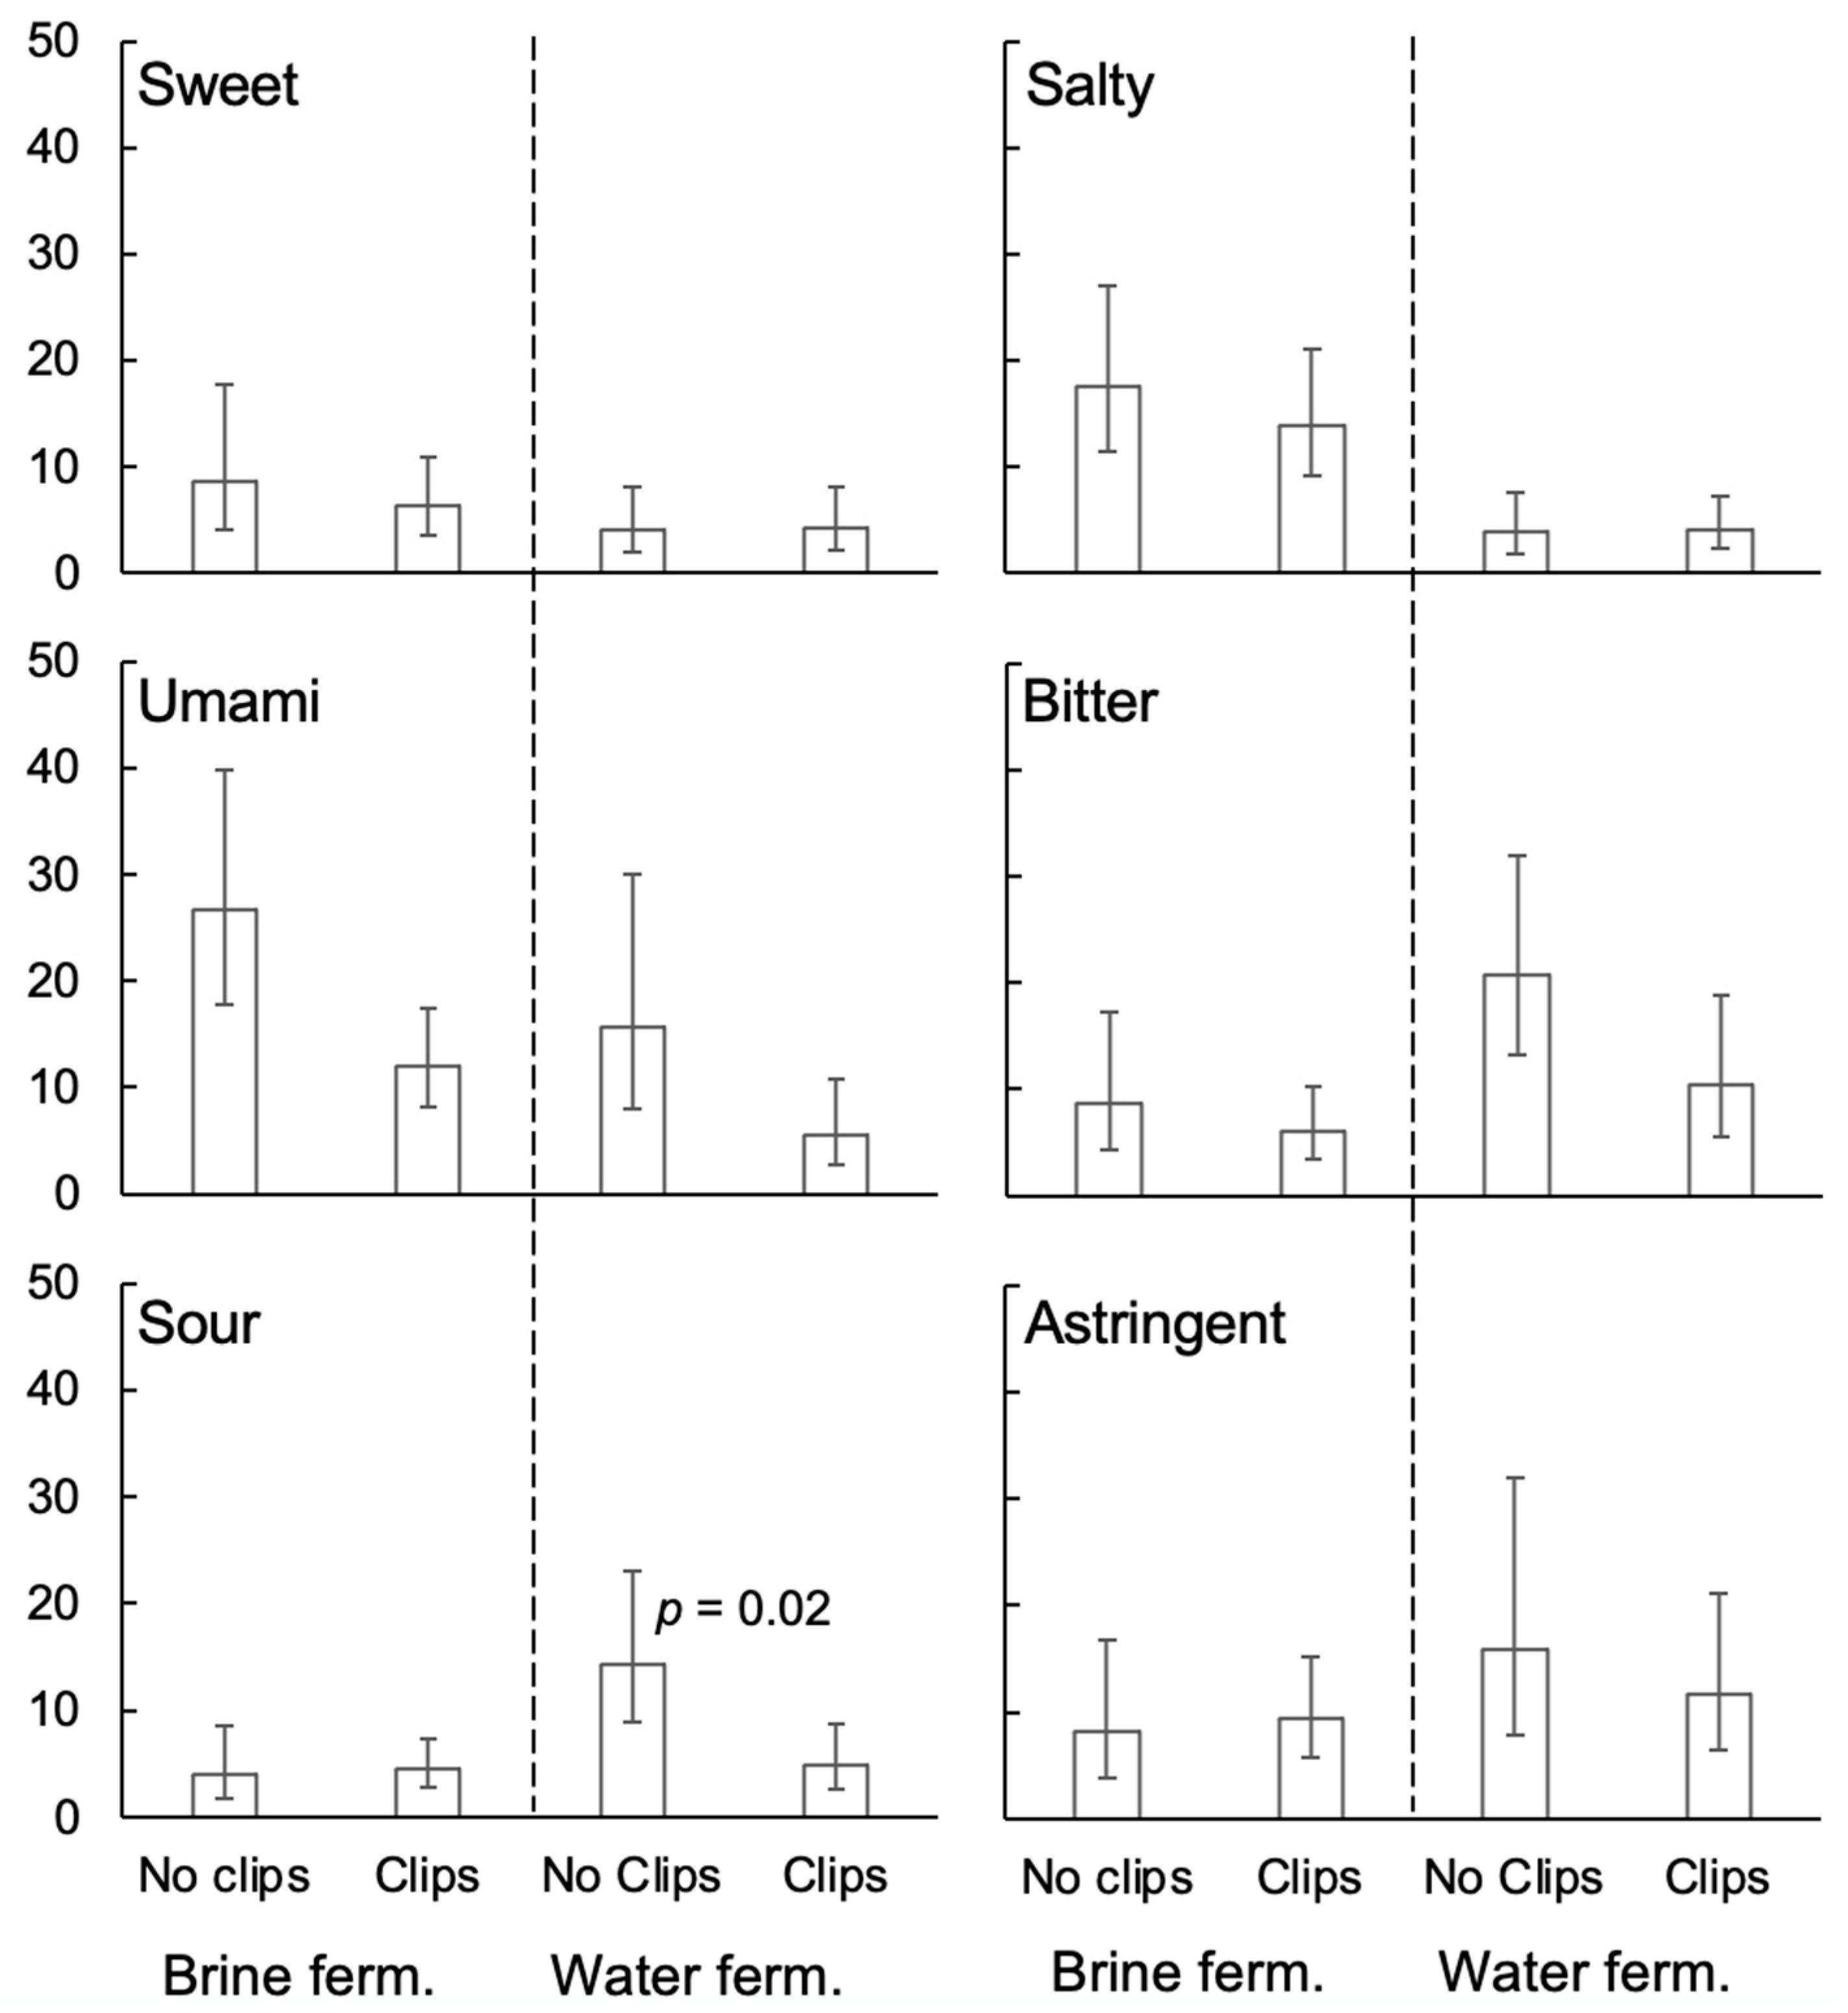
2.4.3. Intensity of Oral Sensations
3. Study 2—Consumer Liking of Sandwich Bread Made with Whole-Grain Pearl Millet
3.1. Rationale and Overview for Study 2
3.2. Ethics Statement for Study 2
3.3. Materials and Methods for Study 2
3.3.1. Participants in Study 2
3.3.2. Stimuli for Study 2
3.3.3. Sensory Procedures for Study 2
3.3.4. Data Analysis for Study 2
3.4. Results for Study 2
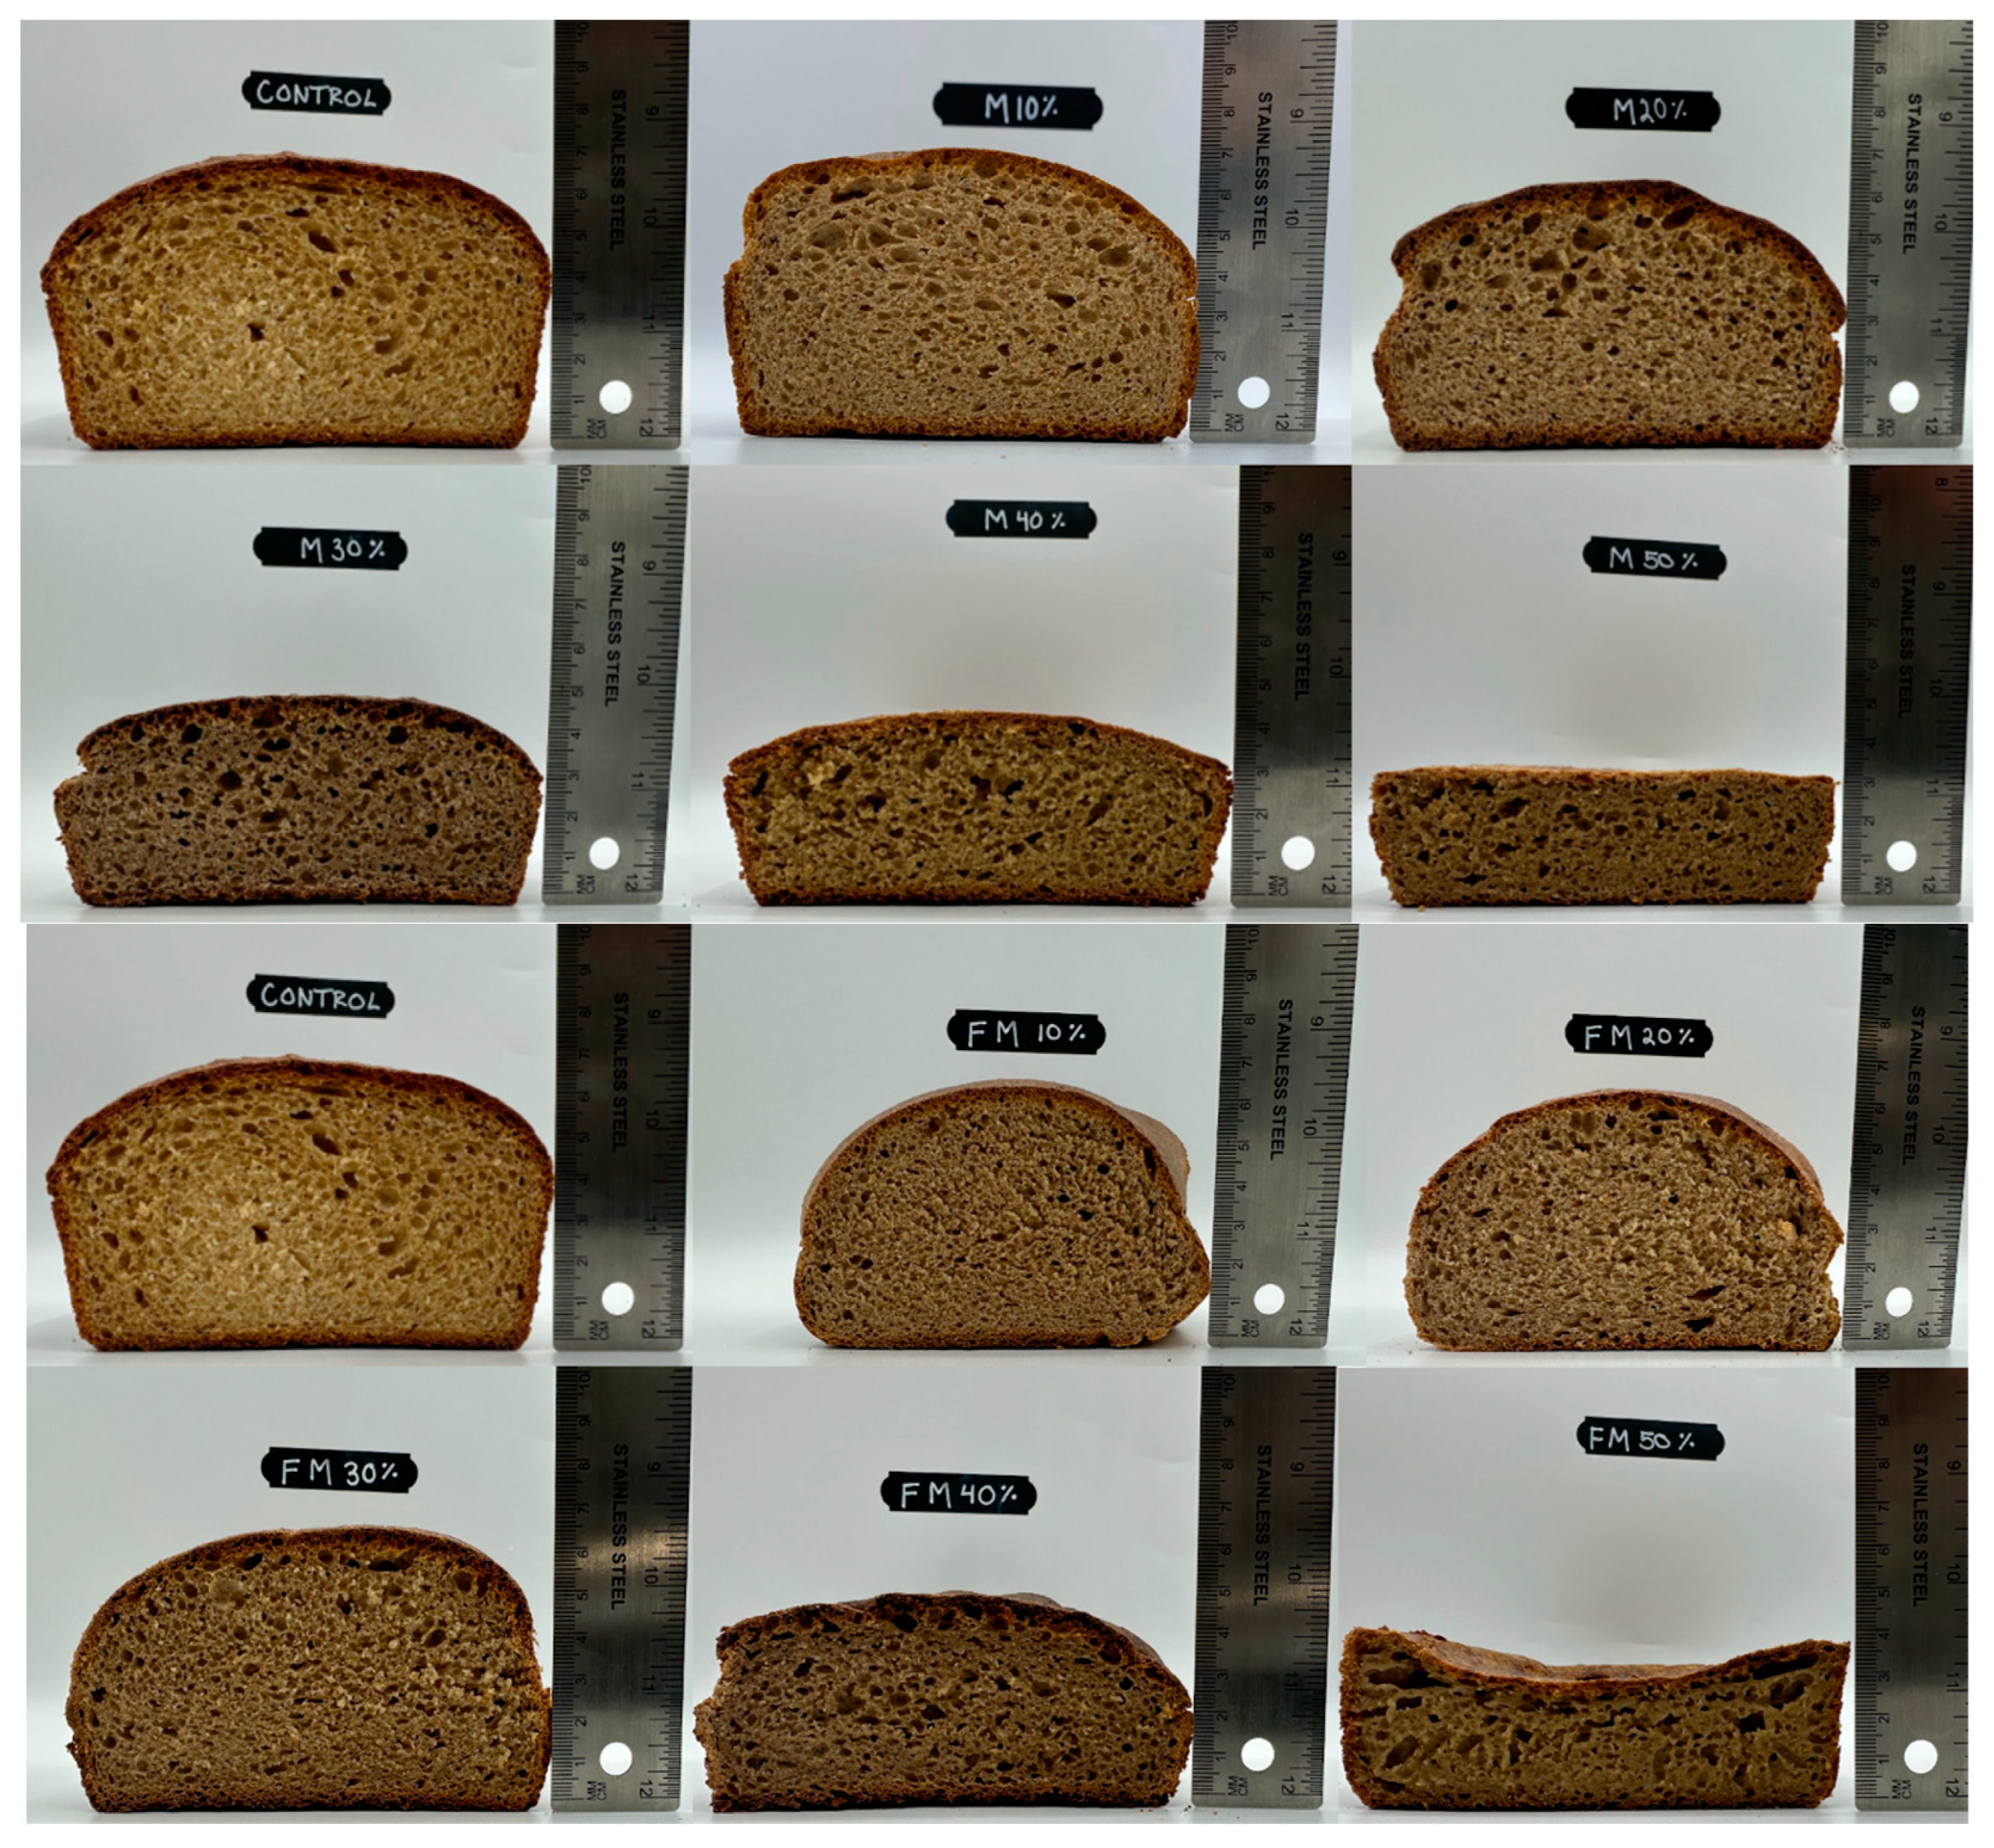
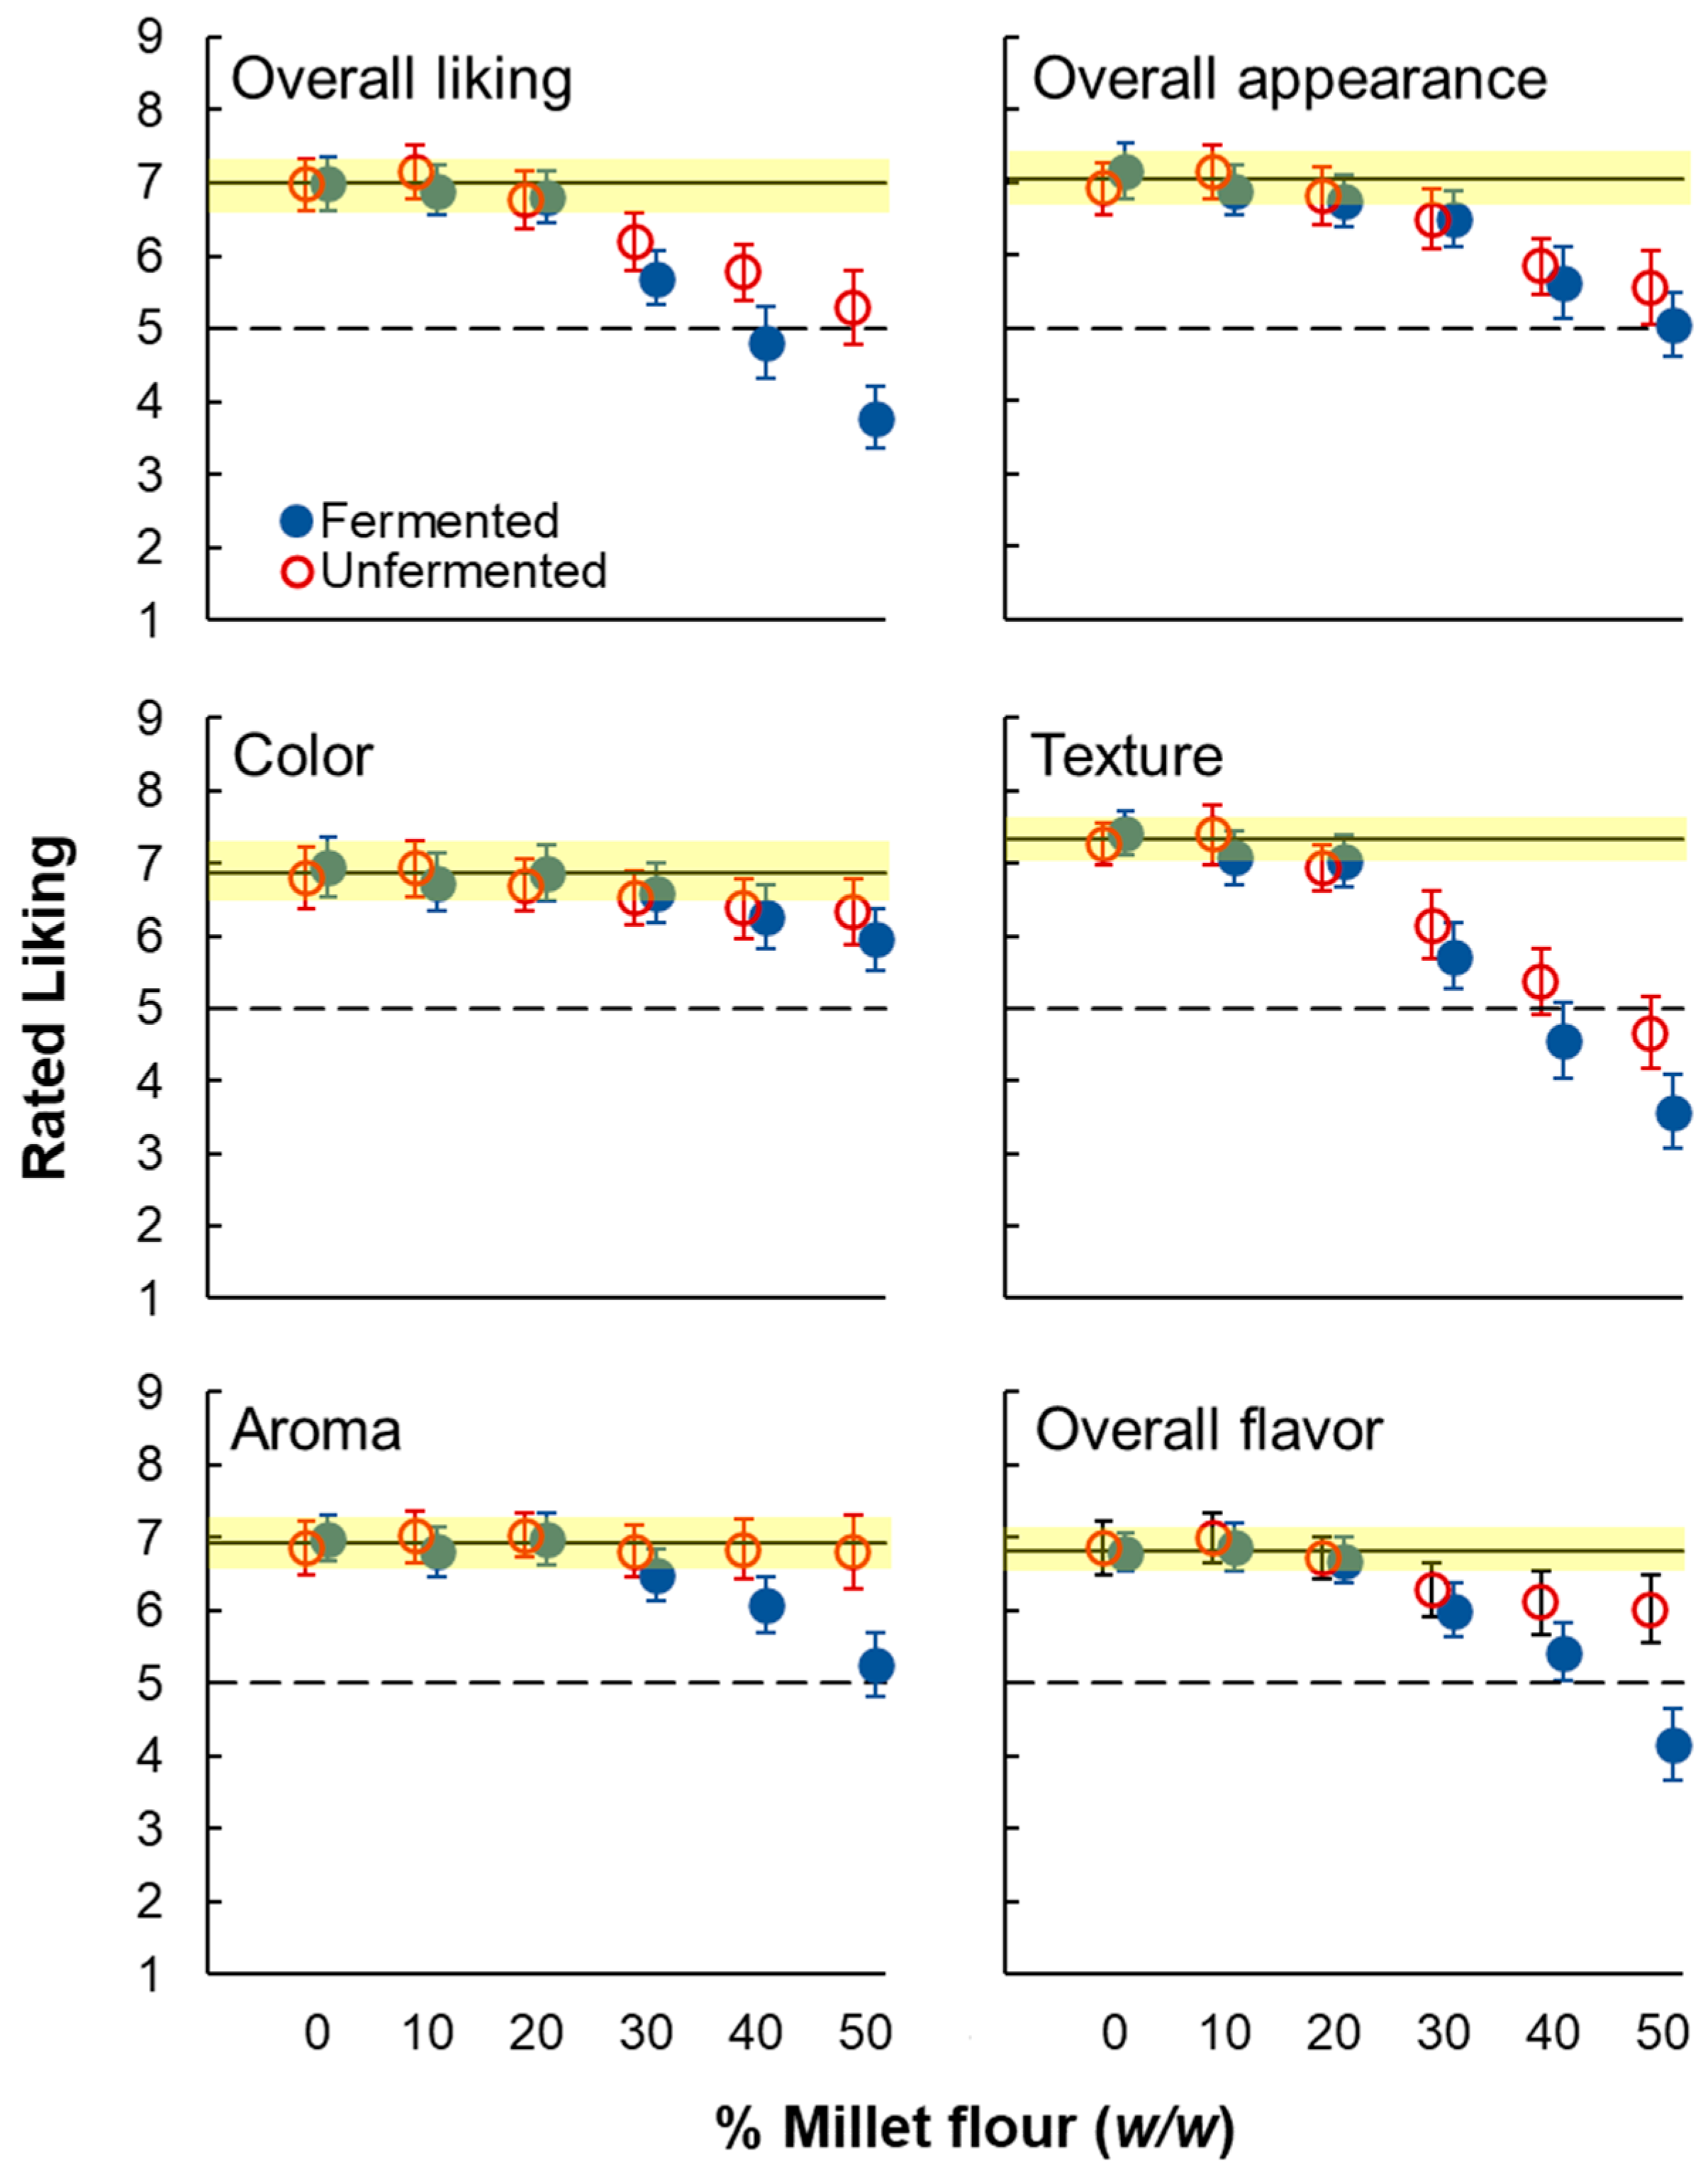
3.4.1. Liking for Model Bread
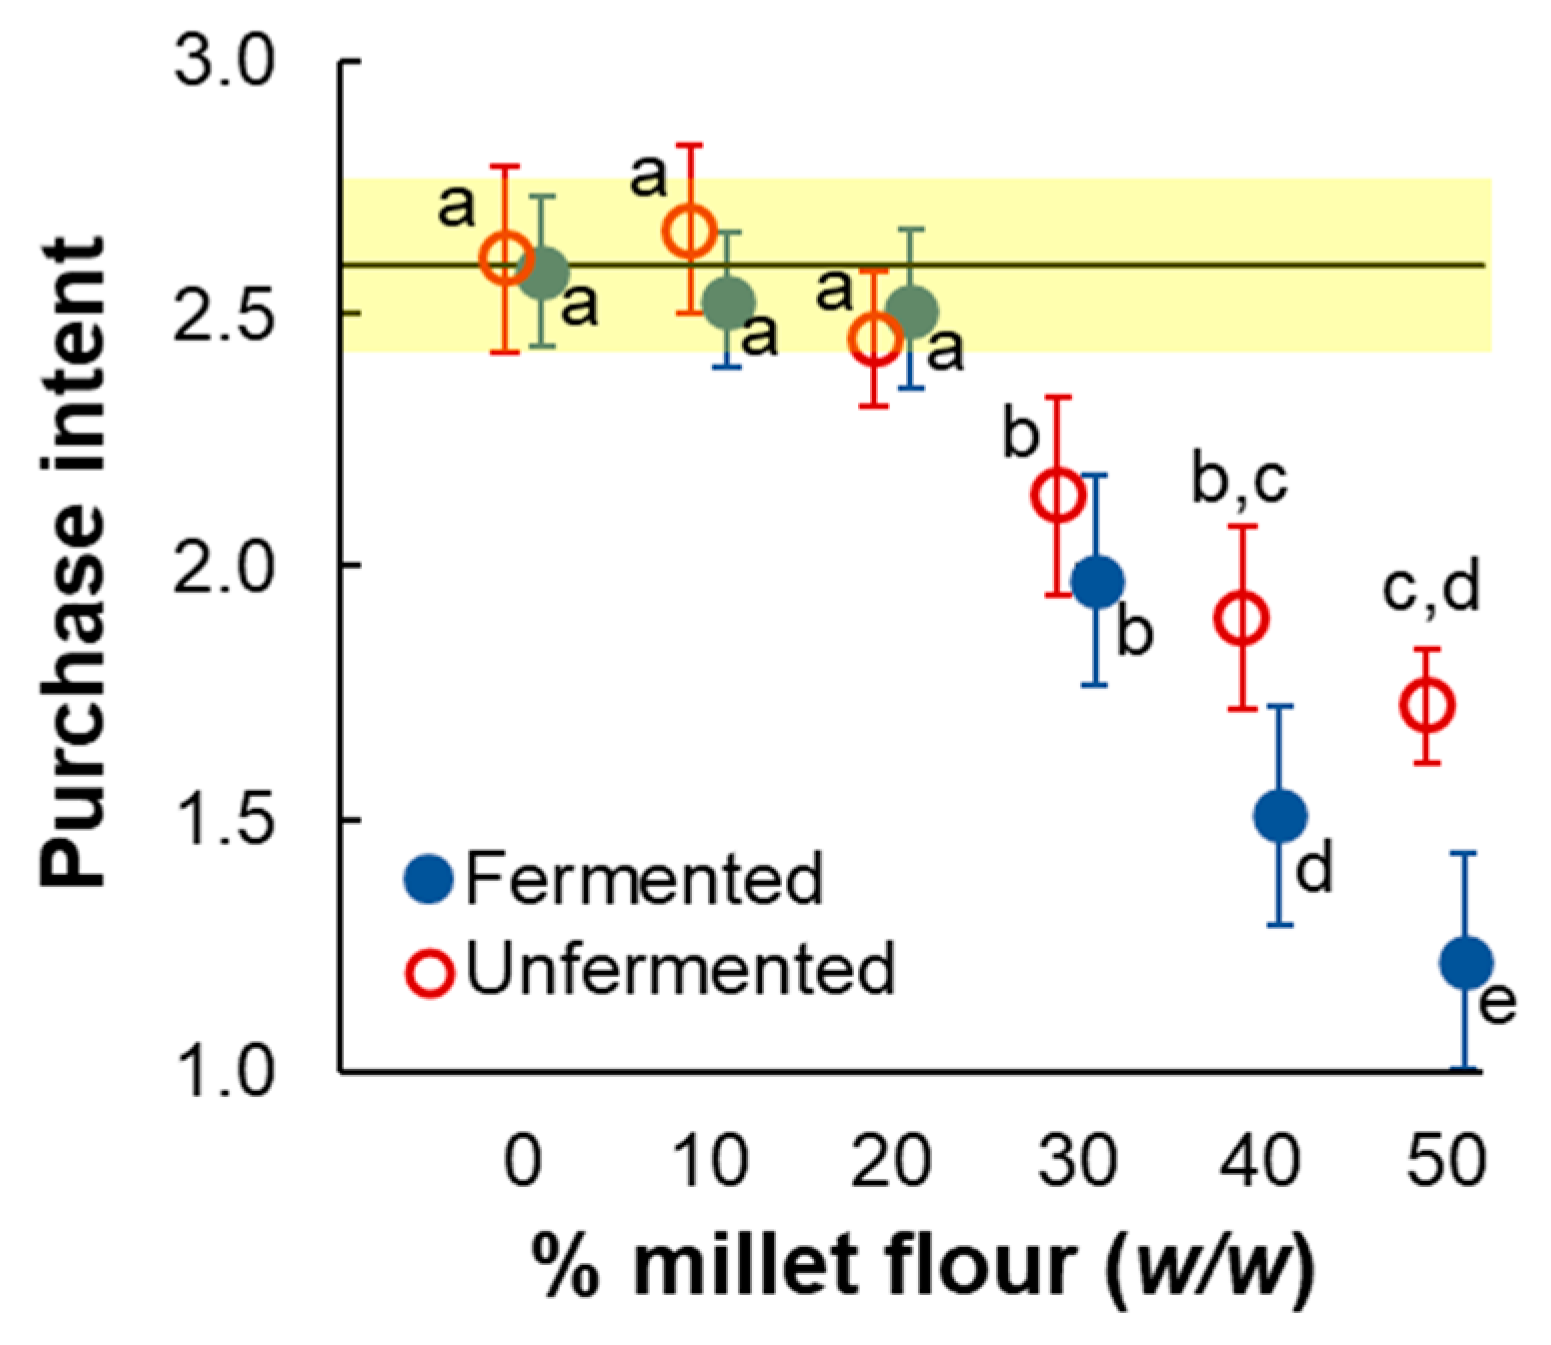
3.4.2. Purchase Intent
4. Discussion
4.1. Effect of Spontaneous Fermentation on Phytic Acid Concentration and Flavor
4.2. Liking for Whole-Grain Bread Made with Partial Substitution by Pearl Millet Flour
4.3. Significance and Potential Impact
4.4. Limitations
5. Conclusions
Supplementary Materials
Author Contributions
Funding
Institutional Review Board Statement
Informed Consent Statement
Data Availability Statement
Acknowledgments
Conflicts of Interest
References
- Habiyaremye, C.; Matanguihan, J.B.; D’Alpoim Guedes, J.; Ganjyal, G.M.; Whiteman, M.R.; Kidwell, K.K.; Murphy, K.M. Proso Millet (Panicum miliaceum L.) and Its Potential for Cultivation in the Pacific Northwest, U.S.: A Review. Front. Plant Sci. 2016, 7, 1961. [Google Scholar] [CrossRef] [PubMed]
- Myers, S.S.; Zanobetti, A.; Kloog, I.; Huybers, P.; Leakey, A.D.B.; Bloom, A.J.; Carlisle, E.; Dietterich, L.H.; Fitzgerald, G.; Hasegawa, T.; et al. Increasing CO2 threatens human nutrition. Nature 2014, 510, 139–142. [Google Scholar] [CrossRef] [PubMed]
- Food and Agriculture Organization of the United Nations. Available online: http://www.fao.org/faostat/en/ (accessed on 21 January 2025).
- Kheya, S.A.; Talukder, S.K.; Datta, P.; Yeasmin, S.; Rashid, M.H.; Hasan, A.K.; Anwar, M.P.; Islam, A.; Islam, A. Millets: The future crops for the tropics—Status, challenges and future prospects. Heliyon 2023, 9, e22123. [Google Scholar] [CrossRef] [PubMed]
- Angeli, V.; Miguel Silva, P.; Crispim Massuela, D.; Khan, M.W.; Hamar, A.; Khajehei, F.; Graeff-Hönninger, S.; Piatti, C. Quinoa (Chenopodium quinoa Willd.): An Overview of the Potentials of the “Golden Grain” and Socio-Economic and Environmental Aspects of Its Cultivation and Marketization. Foods 2020, 9, 216. [Google Scholar] [CrossRef]
- Drewnowski, A. Taste preferences and food intake. Annu. Rev. Nutr. 1997, 17, 237–253. [Google Scholar] [CrossRef]
- McSweeney, M.B.; Duizer, L.M.; Seetharaman, K.; Dan Ramdath, D. Assessment of Important Sensory Attributes of Millet Based Snacks and Biscuits. J. Food Sci. 2016, 81, S1203–S1209. [Google Scholar] [CrossRef]
- Vega-López, S.; Venn, B.J.; Slavin, J.L. Relevance of the Glycemic Index and Glycemic Load for Body Weight, Diabetes, and Cardiovascular Disease. Nutrients 2018, 10, 1361. [Google Scholar] [CrossRef]
- Owheruo, J.O.; Ifesan, B.O.T.; Kolawole, A.O. Physicochemical properties of malted finger millet (Eleusine coracana) and pearl millet (Pennisetum glaucum). Food Sci. Nutr. 2019, 7, 476–482. [Google Scholar] [CrossRef]
- Aune, D.; Keum, N.; Giovannucci, E.; Fadnes, L.T.; Boffetta, P.; Greenwood, D.C.; Tonstad, S.; Vatten, L.J.; Riboli, E.; Norat, T. Whole grain consumption and risk of cardiovascular disease, cancer, and all cause and cause specific mortality: Systematic review and dose-response meta-analysis of prospective studies. Bmj 2016, 353, i2716. [Google Scholar] [CrossRef]
- Slavin, J.; Jacobs, D.; Marquart, L. Whole-grain consumption and chronic disease: Protective mechanisms. Nutr. Cancer 1997, 27, 14–21. [Google Scholar] [CrossRef]
- Stevenson, L.; Phillips, F.; O’Sullivan, K.; Walton, J. Wheat bran: Its composition and benefits to health, a European perspective. Int. J. Food Sci. Nutr. 2012, 63, 1001–1013. [Google Scholar] [CrossRef] [PubMed]
- Zong, G.; Gao, A.; Hu, F.B.; Sun, Q. Whole Grain Intake and Mortality From All Causes, Cardiovascular Disease, and Cancer: A Meta-Analysis of Prospective Cohort Studies. Circulation 2016, 133, 2370–2380. [Google Scholar] [CrossRef] [PubMed]
- Armah, S.M.; Boy, E.; Chen, D.; Candal, P.; Reddy, M.B. Regular Consumption of a High-Phytate Diet Reduces the Inhibitory Effect of Phytate on Nonheme-Iron Absorption in Women with Suboptimal Iron Stores. J. Nutr. 2015, 145, 1735–1739. [Google Scholar] [CrossRef] [PubMed]
- Bohn, T.; Davidsson, L.; Walczyk, T.; Hurrell, R.F. Phytic acid added to white-wheat bread inhibits fractional apparent magnesium absorption in humans. Am. J. Clin. Nutr. 2004, 79, 418–423. [Google Scholar] [CrossRef]
- DiNicolantonio, J.J.; O’Keefe, J.H.; Wilson, W. Subclinical magnesium deficiency: A principal driver of cardiovascular disease and a public health crisis. Open Heart 2018, 5, e000668. [Google Scholar] [CrossRef]
- Bailey, R.L.; Dodd, K.W.; Goldman, J.A.; Gahche, J.J.; Dwyer, J.T.; Moshfegh, A.J.; Sempos, C.T.; Picciano, M.F. Estimation of total usual calcium and vitamin D intakes in the United States. J. Nutr. 2010, 140, 817–822. [Google Scholar] [CrossRef]
- Cormick, G.; Belizán, J.M. Calcium Intake and Health. Nutrients 2019, 11, 1606. [Google Scholar] [CrossRef]
- Miller, J.L. Iron deficiency anemia: A common and curable disease. Cold Spring Harb. Perspect. Med. 2013, 3, a011866. [Google Scholar] [CrossRef]
- Johnson-Wimbley, T.D.; Graham, D.Y. Diagnosis and management of iron deficiency anemia in the 21st century. Therap Adv. Gastroenterol. 2011, 4, 177–184. [Google Scholar] [CrossRef]
- Abbaspour, N.; Hurrell, R.; Kelishadi, R. Review on iron and its importance for human health. J. Res. Med. Sci. 2014, 19, 164–174. [Google Scholar]
- Knorr, D.; Watzke, H. Food Processing at a Crossroad. Front. Nutr. 2019, 6, 85. [Google Scholar] [CrossRef] [PubMed]
- Osman, M.A. Effect of traditional fermentation process on the nutrient and antinutrient contents of pearl millet during preparation of Lohoh. J. Saudi Soc. Agric. Sci. 2011, 10, 1–6. [Google Scholar] [CrossRef]
- El Hag, M.E.; El Tinay, A.H.; Yousif, N.E. Effect of fermentation and dehulling on starch, total polyphenols, phytic acid content and in vitro protein digestibility of pearl millet. Food Chem. 2002, 77, 193–196. [Google Scholar] [CrossRef]
- Balli, D.; Bellumori, M.; Pucci, L.; Gabriele, M.; Longo, V.; Paoli, P.; Melani, F.; Mulinacci, N.; Innocenti, M. Does Fermentation Really Increase the Phenolic Content in Cereals? A Study on Millet. Foods 2020, 9, 303. [Google Scholar] [CrossRef]
- Krishnan, R.; Meera, M.S. Pearl millet minerals: Effect of processing on bioaccessibility. J. Food Sci. Technol. 2018, 55, 3362–3372. [Google Scholar] [CrossRef]
- Adebiyi, J.A.; Obadina, A.O.; Adebo, O.A.; Kayitesi, E. Comparison of nutritional quality and sensory acceptability of biscuits obtained from native, fermented, and malted pearl millet (Pennisetum glaucum) flour. Food Chem. 2017, 232, 210–217. [Google Scholar] [CrossRef]
- Salar, R.K.; Purewal, S.S.; Bhatti, M.S. Optimization of extraction conditions and enhancement of phenolic content and antioxidant activity of pearl millet fermented with Aspergillus awamori MTCC-548. Resour. -Effic. Technol. 2016, 2, 148–157. [Google Scholar]
- Legesse, E. Effect of Processing on Qualtiy Characteristics of Pearl Millet (Pennisetum glaucum) Based Value Added Products. Master’s Thesis, Addis Ababa Institute of Technology, Addis Ababa University, Addis Ababa, Ethiopia, 2013. [Google Scholar]
- Steinkraus, K.H.; National Research Council (US) Panel on the Applications of Biotechnology to Traditional Fermented Foods. Applications of Biotechnology to Fermented Foods: Report of an Ad Hoc Panel of the Board on Science and Technology for International Development; Section 2.5, Lactic Acid Fermentations; National Academies Press (US): Washington, DC, USA, 1992. Available online: https://www.ncbi.nlm.nih.gov/books/NBK234703/ (accessed on 21 January 2025).
- Johanningsmeier, S.D.; Franco, W.; Perez-Diaz, I.; McFeeters, R.F. Influence of sodium chloride, pH, and lactic acid bacteria on anaerobic lactic acid utilization during fermented cucumber spoilage. J. Food Sci. 2012, 77, M397–M404. [Google Scholar] [CrossRef]
- Dimidi, E.; Cox, S.R.; Rossi, M.; Whelan, K. Fermented Foods: Definitions and Characteristics, Impact on the Gut Microbiota and Effects on Gastrointestinal Health and Disease. Nutrients 2019, 11, 1806. [Google Scholar] [CrossRef]
- El-Gendy, S.M.; Abdel-Galil, H.; Shahin, Y.; Hegazi, F.Z. Characteristics of Salt-Tolerant Lactic Acid Bacteria, in Particular Lactobacilli, Leuconostocs and Pediococci, Isolated from Salted Raw Milk. J. Food Prot. 1983, 46, 429–433. [Google Scholar] [CrossRef]
- Katz, S.E. The Art of Fermentation: An In-depth Exploration of Essential Concepts and Processes From Around the World; Chelsea Green Publishing: Windsor County, VT, USA, 2012. [Google Scholar]
- How Much Salt to Use When Fermenting Vegetables; Cultures for Health: Durham, NC, USA, 2022.
- The Spruce Eats. Lacto-Fermentation: How It Works. 2019. Available online: https://www.thespruceeats.com/how-lacto-fermentation-works-1327598 (accessed on 21 January 2025).
- Balasubramanian, S.; Yadav, D.N.; Kaur, J.; Anand, T. Development and shelf-life evaluation of pearl millet based upma dry mix. J. Food Sci. Technol. 2014, 51, 1110–1117. [Google Scholar] [CrossRef] [PubMed]
- Makokha, A.O.; Oniang’o, R.K.; Njoroge, S.M.; Kamar, O.K. Effect of traditional fermentation and malting on phytic acid and mineral availability from sorghum (Sorghum bicolor) and finger millet (Eleusine coracana) grain varieties grown in Kenya. Food Nutr. Bull. 2002, 23 (Suppl. S3), 241–245. [Google Scholar] [CrossRef]
- Lorenz, A.J.; Scott, M.P.; Lamkey, K.R. Quantitative Determination of Phytate and Inorganic Phosphorus for Maize Breeding. Crop Breed. Genet. 2007, 47, 600–604. [Google Scholar] [CrossRef]
- Greenhouse, S.W.; Geisser, S. On methods in the analysis of profile data. Psychometrika 1959, 24, 95–112. [Google Scholar] [CrossRef]
- WG, C. The comparison of percentages in matched samples. Biometrika 1950, 37, 256–266. [Google Scholar]
- Stephen, D.; Ahmad Zaidi Adruce, S. Cochran’s Q with Pairwise McNemar for Dichotomous Multiple Responses Data: A Practical Approach. Int. J. Eng. Technol. 2018, 7, 4. [Google Scholar] [CrossRef]
- McNemar, Q. Note on the sampling error of the difference between correlated proportions or percentages. Psychometrika 1947, 12, 153–157. [Google Scholar] [CrossRef]
- Fagerland, M.W.; Lydersen, S.; Laake, P. The McNemar test for binary matched-pairs data: Mid-p and asymptotic are better than exact conditional. BMC Med. Res. Methodol. 2013, 13, 91. [Google Scholar] [CrossRef]
- Onweluzo, J.; Nwabugwu, C. Fermentation of millet and pigeon pea seeds for flour production: Effects of composition and selected functional properties. Pak. J. Nutr. 2009, 8, 737–744. [Google Scholar] [CrossRef]
- Yang, X.; Hu, W.; Xiu, Z.; Jiang, A.; Yang, X.; Saren, G.; Ji, Y.; Guan, Y.; Feng, K. Effect of salt concentration on microbial communities, physicochemical properties and metabolite profile during spontaneous fermentation of Chinese northeast sauerkraut. J. Appl. Microbiol. 2020, 129, 1458–1471. [Google Scholar] [CrossRef]
- Gupta, R.K.; Gangoliya, S.S.; Singh, N.K. Reduction of phytic acid and enhancement of bioavailable micronutrients in food grains. J. Food Sci. Technol. 2015, 52, 676–684. [Google Scholar] [CrossRef] [PubMed]
- Sacchi, R.; Corrado, G.; Basile, B.; Mandarello, D.; Ambrosino, M.L.; Paduano, A.; Savarese, M.; Caporaso, N.; Aponte, M.; Genovese, A. Effect of Salt Addition and Fermentation Time on Phenolics, Microbial Dynamics, Volatile Organic Compounds, and Sensory Properties of the PDO Table Olives of Gaeta (Italy). Molecules 2022, 27, 8100. [Google Scholar] [CrossRef] [PubMed]
- Di Stefano, E.; White, J.; Seney, S.; Hekmat, S.; McDowell, T.; Sumarah, M.; Reid, G. A Novel Millet-Based Probiotic Fermented Food for the Developing World. Nutrients 2017, 9, 529. [Google Scholar] [CrossRef] [PubMed]
- Fan, X.; Li, X.; Zhang, T.; Guo, Y.; Shi, Z.; Wu, Z.; Zeng, X.; Pan, D. Novel Millet-Based Flavored Yogurt Enriched With Superoxide Dismutase. Front. Nutr. 2021, 8, 791886. [Google Scholar] [CrossRef]
- Drewnowski, A.; Gomez-Carneros, C. Bitter taste, phytonutrients, and the consumer: A review. Am. J. Clin. Nutr. 2000, 72, 1424–1435. [Google Scholar] [CrossRef]
- Karolkowski, A.; Belloir, C.; Briand, L.; Salles, C. Non-Volatile Compounds Involved in Bitterness and Astringency of Pulses: A Review. Molecules 2023, 28, 3298. [Google Scholar] [CrossRef]
- Soares, S.; Kohl, S.; Thalmann, S.; Mateus, N.; Meyerhof, W.; De Freitas, V. Different phenolic compounds activate distinct human bitter taste receptors. J. Agric. Food Chem. 2013, 61, 1525–1533. [Google Scholar] [CrossRef]
- Schiffman, S.S.; Sennewald, K.; Gagnon, J. Comparison of taste qualities and thresholds of D- and L-amino acids. Physiol. Behav. 1981, 27, 51–59. [Google Scholar] [CrossRef]
- Schiffman, S.S.; Engelhard, H.H., 3rd. Taste of dipeptides. Physiol. Behav. 1976, 17, 523–535. [Google Scholar] [CrossRef]
- Maehashi, K.; Matano, M.; Wang, H.; Vo, L.A.; Yamamoto, Y.; Huang, L. Bitter peptides activate hTAS2Rs, the human bitter receptors. Biochem. Biophys. Res. Commun. 2008, 365, 851–855. [Google Scholar] [CrossRef]
- Kohl, S.; Behrens, M.; Dunkel, A.; Hofmann, T.; Meyerhof, W. Amino acids and peptides activate at least five members of the human bitter taste receptor family. J. Agric. Food Chem. 2013, 61, 53–60. [Google Scholar] [CrossRef]
- Hutkins, R. Microbiology and Technology of Fermented Foods, 2nd ed.; Wiley-Blackwell: New York, NY, USA, 2018. [Google Scholar]
- Annunziata, G.; Arnone, A.; Ciampaglia, R.; Tenore, G.C.; Novellino, E. Fermentation of Foods and Beverages as a Tool for Increasing Availability of Bioactive Compounds. Focus on Short-Chain Fatty Acids. Foods 2020, 9, 999. [Google Scholar] [CrossRef] [PubMed]
- Goyal, P.; Chugh, L.K. Shelf life determinants and enzyme activities of pearl millet: A comparison of changes in stored flour of hybrids, CMS lines, inbreds and composites. J. Food Sci. Technol. 2017, 54, 3161–3169. [Google Scholar] [CrossRef] [PubMed]
- Thayer, D.W.; Ogg, J.E. Aldehydes and ketones produced during fermentation of glucose by Escherichia coli. J. Bacteriol. 1967, 94, 488–489. [Google Scholar] [CrossRef] [PubMed]
- Saerens, S.M.; Delvaux, F.R.; Verstrepen, K.J.; Thevelein, J.M. Production and biological function of volatile esters in Saccharomyces cerevisiae. Microb. Biotechnol. 2010, 3, 165–177. [Google Scholar] [CrossRef]
- Zhou, T.; Feng, Y.; Thomas-Danguin, T.; Zhao, M. Enhancement of saltiness perception by odorants selected from Chinese soy sauce: A gas chromatography/olfactometry-associated taste study. Food Chem. 2021, 335, 127664. [Google Scholar] [CrossRef]
- Isogai, T.; Wise, P.M. The Effects of Odor Quality and Temporal Asynchrony on Modulation of Taste Intensity by Retronasal Odor. Chem. Senses 2016, 41, 557–566. [Google Scholar] [CrossRef]
- Liem, D.G.; Miremadi, F.; Keast, R.S. Reducing sodium in foods: The effect on flavor. Nutrients 2011, 3, 694–711. [Google Scholar] [CrossRef]
- Ash, A.; Wilde, P.J.; Bradshaw, D.J.; King, S.P.; Pratten, J.R. Structural modifications of the salivary conditioning film upon exposure to sodium bicarbonate: Implications for oral lubrication and mouthfeel. Soft Matter 2016, 12, 2794–2801. [Google Scholar] [CrossRef]
- Gillette, M. Flavor effects of sodium chloride. Food Technol. 1985, 39, 47–56. [Google Scholar]
- Wise, P.M.; Damani, S.; Breslin, P.A.S. Sodium, but not potassium, blocks bitterness in simple model chicken broths. J. Food Sci. Technol. 2019, 56, 3151–3156. [Google Scholar] [CrossRef] [PubMed]
- Mora, M.R.; Wang, Z.; Goddard, J.M.; Dando, R. Consumers Respond Positively to the Sensory, Health, and Sustainability Benefits of the Rare Sugar Allulose in Yogurt Formulations. Foods 2022, 11, 3718. [Google Scholar] [CrossRef] [PubMed]
- Cabello-Olmo, M.; Krishnan, P.G.; Araña, M.; Oneca, M.; Díaz, J.V.; Barajas, M.; Rovai, M. Development, Analysis, and Sensory Evaluation of Improved Bread Fortified with a Plant-Based Fermented Food Product. Foods 2023, 12, 2817. [Google Scholar] [CrossRef] [PubMed]
- García-Gómez, B.; Fernández-Canto, N.; Vázquez-Odériz, M.L.; Quiroga-García, M.; Muñoz-Ferreiro, N.; Romero-Rodríguez, M.Á. Sensory descriptive analysis and hedonic consumer test for Galician type breads. Food Control 2022, 134, 108765. [Google Scholar] [CrossRef]
- Alhassan, M.W.; Ojangba, T.; Amagloh, F.K. Development of Gluten-free Biscuit from Peanut-Pearl Millet Composite Flour. Am. J. Food Sci. Technol. 2019, 7, 40–44. [Google Scholar]
- Anju, T., Jr.; Sarita, S. Suitability of Foxtail Millet (Setaria italica) and Barnyard Millet (Echinochloa frumentacea) for Development of Low Glycemic Index Biscuits. Malays. J. Nutr. 2010, 16, 361–368. [Google Scholar]
- Udaybeer, U.; Khan, M.; Patel, S.; Godase, S. Development of low gluten cookies from pearl millet. Agric. Update 2017, 12, 785–789. [Google Scholar] [CrossRef]
- Rai, S.; Kaur, A.; Singh, B. Quality characteristics of gluten free cookies prepared from different flour combinations. J. Food Sci. Technol. 2014, 51, 785–789. [Google Scholar] [CrossRef]
- Obatolu, V. Nutrient and sensory qualities of extruded malted or unmalted millet/soybean mixture. Food Chem. 2002, 76, 129–133. [Google Scholar] [CrossRef]
- Arora, L.; Aggarwal, R.; Dhaliwal, I.; Gupta, O.P.; Kaushik, P. Assessment of sensory and nutritional attributes of foxtail millet-based food products. Front. Nutr. 2023, 10, 1146545. [Google Scholar] [CrossRef]
- Anitha, S.; Arjun, P.; Palli, N.C.; Sreekanth, N.; Miruthika Devi, S.A.; Pandey, S.; Krishnan, S.; Prasad, S.; Sharma, S.; Chidambara Murthy, K.N.; et al. Sensory and nutritional evaluation of nine types of millet substituted for polished white rice in select Indian meal preparations. Front. Sustain. Food Syst. 2024, 8, 1331260. [Google Scholar] [CrossRef]
- Mudau, M.; Mashau, M.E.; Ramashia, S.E. Nutritional Quality, Antioxidant, Microstructural and Sensory Properties of Spontaneously Fermented Gluten-Free Finger Millet Biscuits. Foods 2022, 11, 1265. [Google Scholar] [CrossRef] [PubMed]
- FERRIOLA, D.; STONE, M. Sweetener Effects on Flaked Millet Breakfast Cereals. J. Food Sci. 1998, 63, 726–729. [Google Scholar] [CrossRef]
- Radeke, M.K.; Stahelski, A.J. Altering age and gender stereotypes by creating the Halo and Horns Effects with facial expressions. Humanit. Soc. Sci. Commun. 2020, 7, 14. [Google Scholar] [CrossRef]
- García-Segovia, P.; Igual, M.; Martínez-Monzó, J. Physicochemical Properties and Consumer Acceptance of Bread Enriched with Alternative Proteins. Foods 2020, 9, 933. [Google Scholar] [CrossRef]
- Magano, N.; du Rand, G.; de Kock, H. Perception of Gluten-Free Bread as Influenced by Information and Health and Taste Attitudes of Millennials. Foods 2022, 11, 491. [Google Scholar] [CrossRef]
- Gillespie, R.; Ahlborn, G.J. Mechanical, sensory, and consumer evaluation of ketogenic, gluten-free breads. Food Sci. Nutr. 2021, 9, 3327–3335. [Google Scholar] [CrossRef]
- USDA. Crop Genetics and Breeding Research: Tifton, GA; USDA: Washington, DC, USA, 2002. [Google Scholar]
- USDA. Commodity Costs and Returns; USDA: Washington, DC, USA, 2025. [Google Scholar]
- Muntner, P.; Shimbo, D.; Carey, R.M.; Charleston, J.B.; Gaillard, T.; Misra, S.; Myers, M.G.; Ogedegbe, G.; Schwartz, J.E.; Townsend, R.R.; et al. Measurement of Blood Pressure in Humans: A Scientific Statement from the American Heart Association. Hypertension 2019, 73, e35–e66. [Google Scholar] [CrossRef]
- Anitha, S.; Tsusaka, T.W.; Botha, R.; Givens, D.I.; Rajendran, A.; Parasannanavar, D.J.; Subramaniam, K.; Bhandari, R.K.; Kane-Potaka, J. Impact of regular consumption of millets on fasting and post-prandial blood glucose level: A systematic review and meta-analysis. Front. Sustain. Food Syst. 2024, 7, 1226474. [Google Scholar] [CrossRef]
- Anitha, S.; Tsusaka, T.W.; Botha, R.; Kane-Potaka, J.; Givens, D.I.; Rajendran, A.; Bhandari, R.K. Are Millets More Effective in Managing Hyperlipidaemia and Obesity than Major Cereal Staples? A Systematic Review and Meta-Analysis. Sustainability 2022, 14, 6659. [Google Scholar] [CrossRef]
- Anitha, S.; Upadhyay, S.; Kane-Potaka, J. Millets have the potential to increase satiety and reduce the feeling of hunger: A systematic review. Front. Sustain. Food Syst. 2024, 8, 1348068. [Google Scholar] [CrossRef]
- Samtiya, M.; Aluko, R.E.; Dhaka, N.; Dhewa, T.; Puniya, A.K. Nutritional and health-promoting attributes of millet: Current and future perspectives. Nutr. Rev. 2023, 81, 684–704. [Google Scholar] [CrossRef] [PubMed]
- Anitha, S.; Kane-Potaka, J.; Tsusaka, T.W.; Botha, R.; Rajendran, A.; Givens, D.I.; Parasannanavar, D.J.; Subramaniam, K.; Prasad, K.D.V.; Vetriventhan, M.; et al. A Systematic Review and Meta-Analysis of the Potential of Millets for Managing and Reducing the Risk of Developing Diabetes Mellitus. Front. Nutr. 2021, 8, 687428. [Google Scholar] [CrossRef] [PubMed]
- Agrawal, P.; Singh, B.R.; Gajbe, U.; Kalambe, M.A.; Bankar, M. Managing Diabetes Mellitus With Millets: A New Solution. Cureus 2023, 15, e44908. [Google Scholar] [CrossRef]
- Pei, J.; Umapathy, V.R.; Vengadassalapathy, S.; Hussain, S.F.J.; Rajagopal, P.; Jayaraman, S.; Veeraraghavan, V.P.; Palanisamy, C.P.; Gopinath, K. A Review of the Potential Consequences of Pearl Millet (Pennisetum glaucum) for Diabetes Mellitus and Other Biomedical Applications. Nutrients 2022, 14, 2932. [Google Scholar] [CrossRef]
- Torangatti, G.; Naik, R. Glycaemic and lipemic response of composite foods in normal and NIDDM subjects. Int. J. Diabetic Dev. Countries 1996, 19, 161–171. [Google Scholar]
- Mani, U.V.; Prabhu, B.M.; Damle, S.S.; Mani, I. Glycaemic index of some commonly consumed foods in western India. Asia Pac. J. Clin. Nutr. 1993, 2, 111–114. [Google Scholar]
- United States Census Bureau. National Population by Characteristics: 2020–2021. Available online: https://www.census.gov/data/tables/time-series/demo/popest/2020s-national-detail.html (accessed on 21 January 2025).
- Foster, S.; Beck, E.; Hughes, J.; Grafenauer, S. Whole Grains and Consumer Understanding: Investigating Consumers’ Identification, Knowledge and Attitudes to Whole Grains. Nutrients 2020, 12, 2170. [Google Scholar] [CrossRef]
- Sajdakowska, M.; Gębski, J.; Żakowska-Biemans, S.; Jeżewska-Zychowicz, M. Willingness to eat bread with health benefits: Habits, taste and health in bread choice. Public Health 2019, 167, 78–87. [Google Scholar] [CrossRef]
- Szakály, Z.; Kiss, M. Chapter 20—Consumer acceptance of different cereal-based “healthy foods”. In Developing Sustainable and Health Promoting Cereals and Pseudocereals; Rakszegi, M., Papageorgiou, M., Rocha, J.M., Eds.; Academic Press: Cambridge, MA, USA, 2023; pp. 467–488. [Google Scholar]

| Characteristic | Total n = 30 |
|---|---|
| Age, years, mean ± SD | 31.1 ± 10.0 |
| Sex, female n (%) | 20 (66.7) |
| Sex, male n (%) | 10 (33.3) |
| Race, n (%) | |
| Asian/Pacific Islanders | 9 (30) |
| Black/African American | 5 (16.7) |
| White | 13 (43.3) |
| Mixed | 3 (10) |
| Body mass index, kg/m2, n (%) | |
| <18.5 | 0 (0) |
| 18.6–24.9 | 14 (46.7) |
| 25–30 | 11 (36.7) |
| >30 | 5 (16.7) |
| Bread consumption, servings/week, n (%) | |
| 0 | 1 (3.3) |
| 1 to 3 | 11 (36.7) |
| 4 to 6 | 13 (43.3) |
| 7+ | 5 (16.7) |
| Effect | F-Ratio | DF Numerator | DF Denominator | p |
|---|---|---|---|---|
| (1) Rated attribute | 13.58 | 3.2 | 91.7 | <0.0001 |
| (2) Fermentation | 25.03 | 1.0 | 29.0 | <0.0001 |
| (3) % Pearl millet flour | 87.71 | 2.1 | 62.3 | <0.0001 |
| 1 x 2 | 10.62 | 2.7 | 76.9 | <0.0001 |
| 1 x 3 | 30.63 | 7.7 | 224.0 | <0.0001 |
| 2 x 3 | 19.80 | 3.1 | 89.5 | <0.0001 |
| 1 x 2 x 3 | 4.49 | 9.3 | 270.9 | <0.0001 |
| Attribute | Effect | F-Ratio | DF Numerator. | DF Denominator. | p |
|---|---|---|---|---|---|
| Overall liking | Fermentation | 34.72 | 1.0 | 29.0 | <0.0001 |
| % Pearl millet flour | 93.12 | 2.5 | 72.0 | <0.0001 | |
| Interaction | 17.59 | 3.6 | 104.1 | <0.0001 | |
| Appearance | Fermentation | 2.86 | 1.0 | 29.0 | 0.10 |
| % pearl millet flour | 56.23 | 2.4 | 70.8 | <0.0001 | |
| Interaction | 2.16 | 2.7 | 79.7 | 0.11 | |
| Color | Fermentation | 0.84 | 1.0 | 29.0 | 0.37 |
| % pearl millet flour | 12.63 | 1.8 | 51.8 | <0.0001 | |
| Interaction | 4.73 | 3.4 | 99.0 | 0.003 | |
| Texture | Fermentation | 23.13 | 1.0 | 29.0 | <0.0001 |
| % pearl millet flour | 121.04 | 2.5 | 73.2 | <0.0001 | |
| Interaction | 9.08 | 3.1 | 89.5 | <0.0001 | |
| Aroma | Fermentation | 13.49 | 1.0 | 29.0 | 0.001 |
| % pearl millet flour | 15.71 | 2.2 | 64.7 | <0.0001 | |
| Interaction | 16.37 | 2.7 | 78.9 | <0.0001 | |
| Flavor | Fermentation | 28.48 | 1.0 | 29.0 | <0.0001 |
| % pearl millet flour | 42.04 | 2.3 | 66.4 | <0.0001 | |
| Interaction | 23.67 | 3.2 | 93.1 | <0.0001 |
| % Millet Flour (w/w) | |||||||
|---|---|---|---|---|---|---|---|
| Rating | Fermented | 0 | 10 | 20 | 30 | 40 | 50 |
| Overall liking | No | a | a | a | b | b,c | d |
| Yes | a | a | a | c,d | e | f | |
| Appearance | N/A * | a | a | a,b | b | c | d |
| Color | No | a,b,c | a,b | a,b,c,g | c,e,f,g | e,f,g | e,f |
| Yes | b | a,b,c | a,b | a,c,f,g | e,h | h | |
| Texture | No | a | a | a | b | c | d |
| Yes | a | a | a | b,c | d | e | |
| Aroma | No | a,b | a | a | a,b | a,b | a,b |
| Yes | a | a,b | a,b | b,c | c | d | |
| Flavor | No | a | a | a,b | b,c | c | c |
| Yes | a | a | a,b | C | d | e | |
| Fermented | Unfermented | |||
|---|---|---|---|---|
| Replicate | Q, df = 5 | p (2-Tailed) | Q, df = 5 | p (2-Tailed) |
| 1st session, 1st judgment | 47.77 | <0.000001 | 21.36 | <0.001 |
| 1st session, 2nd judgment | 74.44 | <0.000001 | 41.43 | <0.000001 |
| 2nd session, 1st judgment | 46.81 | <0.000001 | 41.81 | <0.000001 |
| 2nd sessions, 2nd judgment | 62.66 | <0.000001 | 50.51 | <0.000001 |
| Comparison | Fermented | Unfermented |
|---|---|---|
| 10% vs. 0% | 0.594 | 0.535 |
| 20% vs. 0% | 0.247 | 0.337 |
| 30% vs. 0% | 0.001 * | 0.023 |
| 40% vs. 0% | <0.001 * | <0.001 * |
| 50% vs. 0% | <0.001 * | <0.001 * |
Disclaimer/Publisher’s Note: The statements, opinions and data contained in all publications are solely those of the individual author(s) and contributor(s) and not of MDPI and/or the editor(s). MDPI and/or the editor(s) disclaim responsibility for any injury to people or property resulting from any ideas, methods, instructions or products referred to in the content. |
© 2025 by the authors. Licensee MDPI, Basel, Switzerland. This article is an open access article distributed under the terms and conditions of the Creative Commons Attribution (CC BY) license (https://creativecommons.org/licenses/by/4.0/).
Share and Cite
Cheung, M.M.; Miller, L.; Deutsch, J.; Sherman, R.; Katz, S.H.; Wise, P.M. Sensory Properties and Acceptability of Fermented Pearl Millet, a Climate-Resistant and Nutritious Grain, Among Consumers in the United States—A Pilot Study. Foods 2025, 14, 871. https://doi.org/10.3390/foods14050871
Cheung MM, Miller L, Deutsch J, Sherman R, Katz SH, Wise PM. Sensory Properties and Acceptability of Fermented Pearl Millet, a Climate-Resistant and Nutritious Grain, Among Consumers in the United States—A Pilot Study. Foods. 2025; 14(5):871. https://doi.org/10.3390/foods14050871
Chicago/Turabian StyleCheung, May M., Lauren Miller, Jonathan Deutsch, Rachel Sherman, Solomon H. Katz, and Paul M. Wise. 2025. "Sensory Properties and Acceptability of Fermented Pearl Millet, a Climate-Resistant and Nutritious Grain, Among Consumers in the United States—A Pilot Study" Foods 14, no. 5: 871. https://doi.org/10.3390/foods14050871
APA StyleCheung, M. M., Miller, L., Deutsch, J., Sherman, R., Katz, S. H., & Wise, P. M. (2025). Sensory Properties and Acceptability of Fermented Pearl Millet, a Climate-Resistant and Nutritious Grain, Among Consumers in the United States—A Pilot Study. Foods, 14(5), 871. https://doi.org/10.3390/foods14050871