
An Experimental and Computational Study on the Effects of Ball Milling on the Physicochemical Properties and Digestibility of a Canna Starch/Tea Polyphenol Complex


Abstract

1. Introduction
2. Materials and Methods
2.1. Materials and Instruments
2.2. Preparation of Samples
2.3. Determination of Solubility and Swelling Power
2.4. Particle Size Analysis and Complex Particle Size Determination
2.5. Thermogravimetric Analysis (TGA)
2.6. Determination of Starch Gelatinization Properties
2.7. Rheological Properties
2.7.1. Measurement of Static Rheological Properties
2.7.2. Determination of Dynamic Viscoelastic Properties
2.8. Fourier Transform Infrared (FT-IR) Spectra Collection
2.9. X-Ray Diffraction (XRD)
2.10. Scanning Electron Microscopy (SEM)
2.11. MD Simulation
2.12. In Vitro Digestibility Determination
2.13. Statistical Analysis
3. Results and Discussion
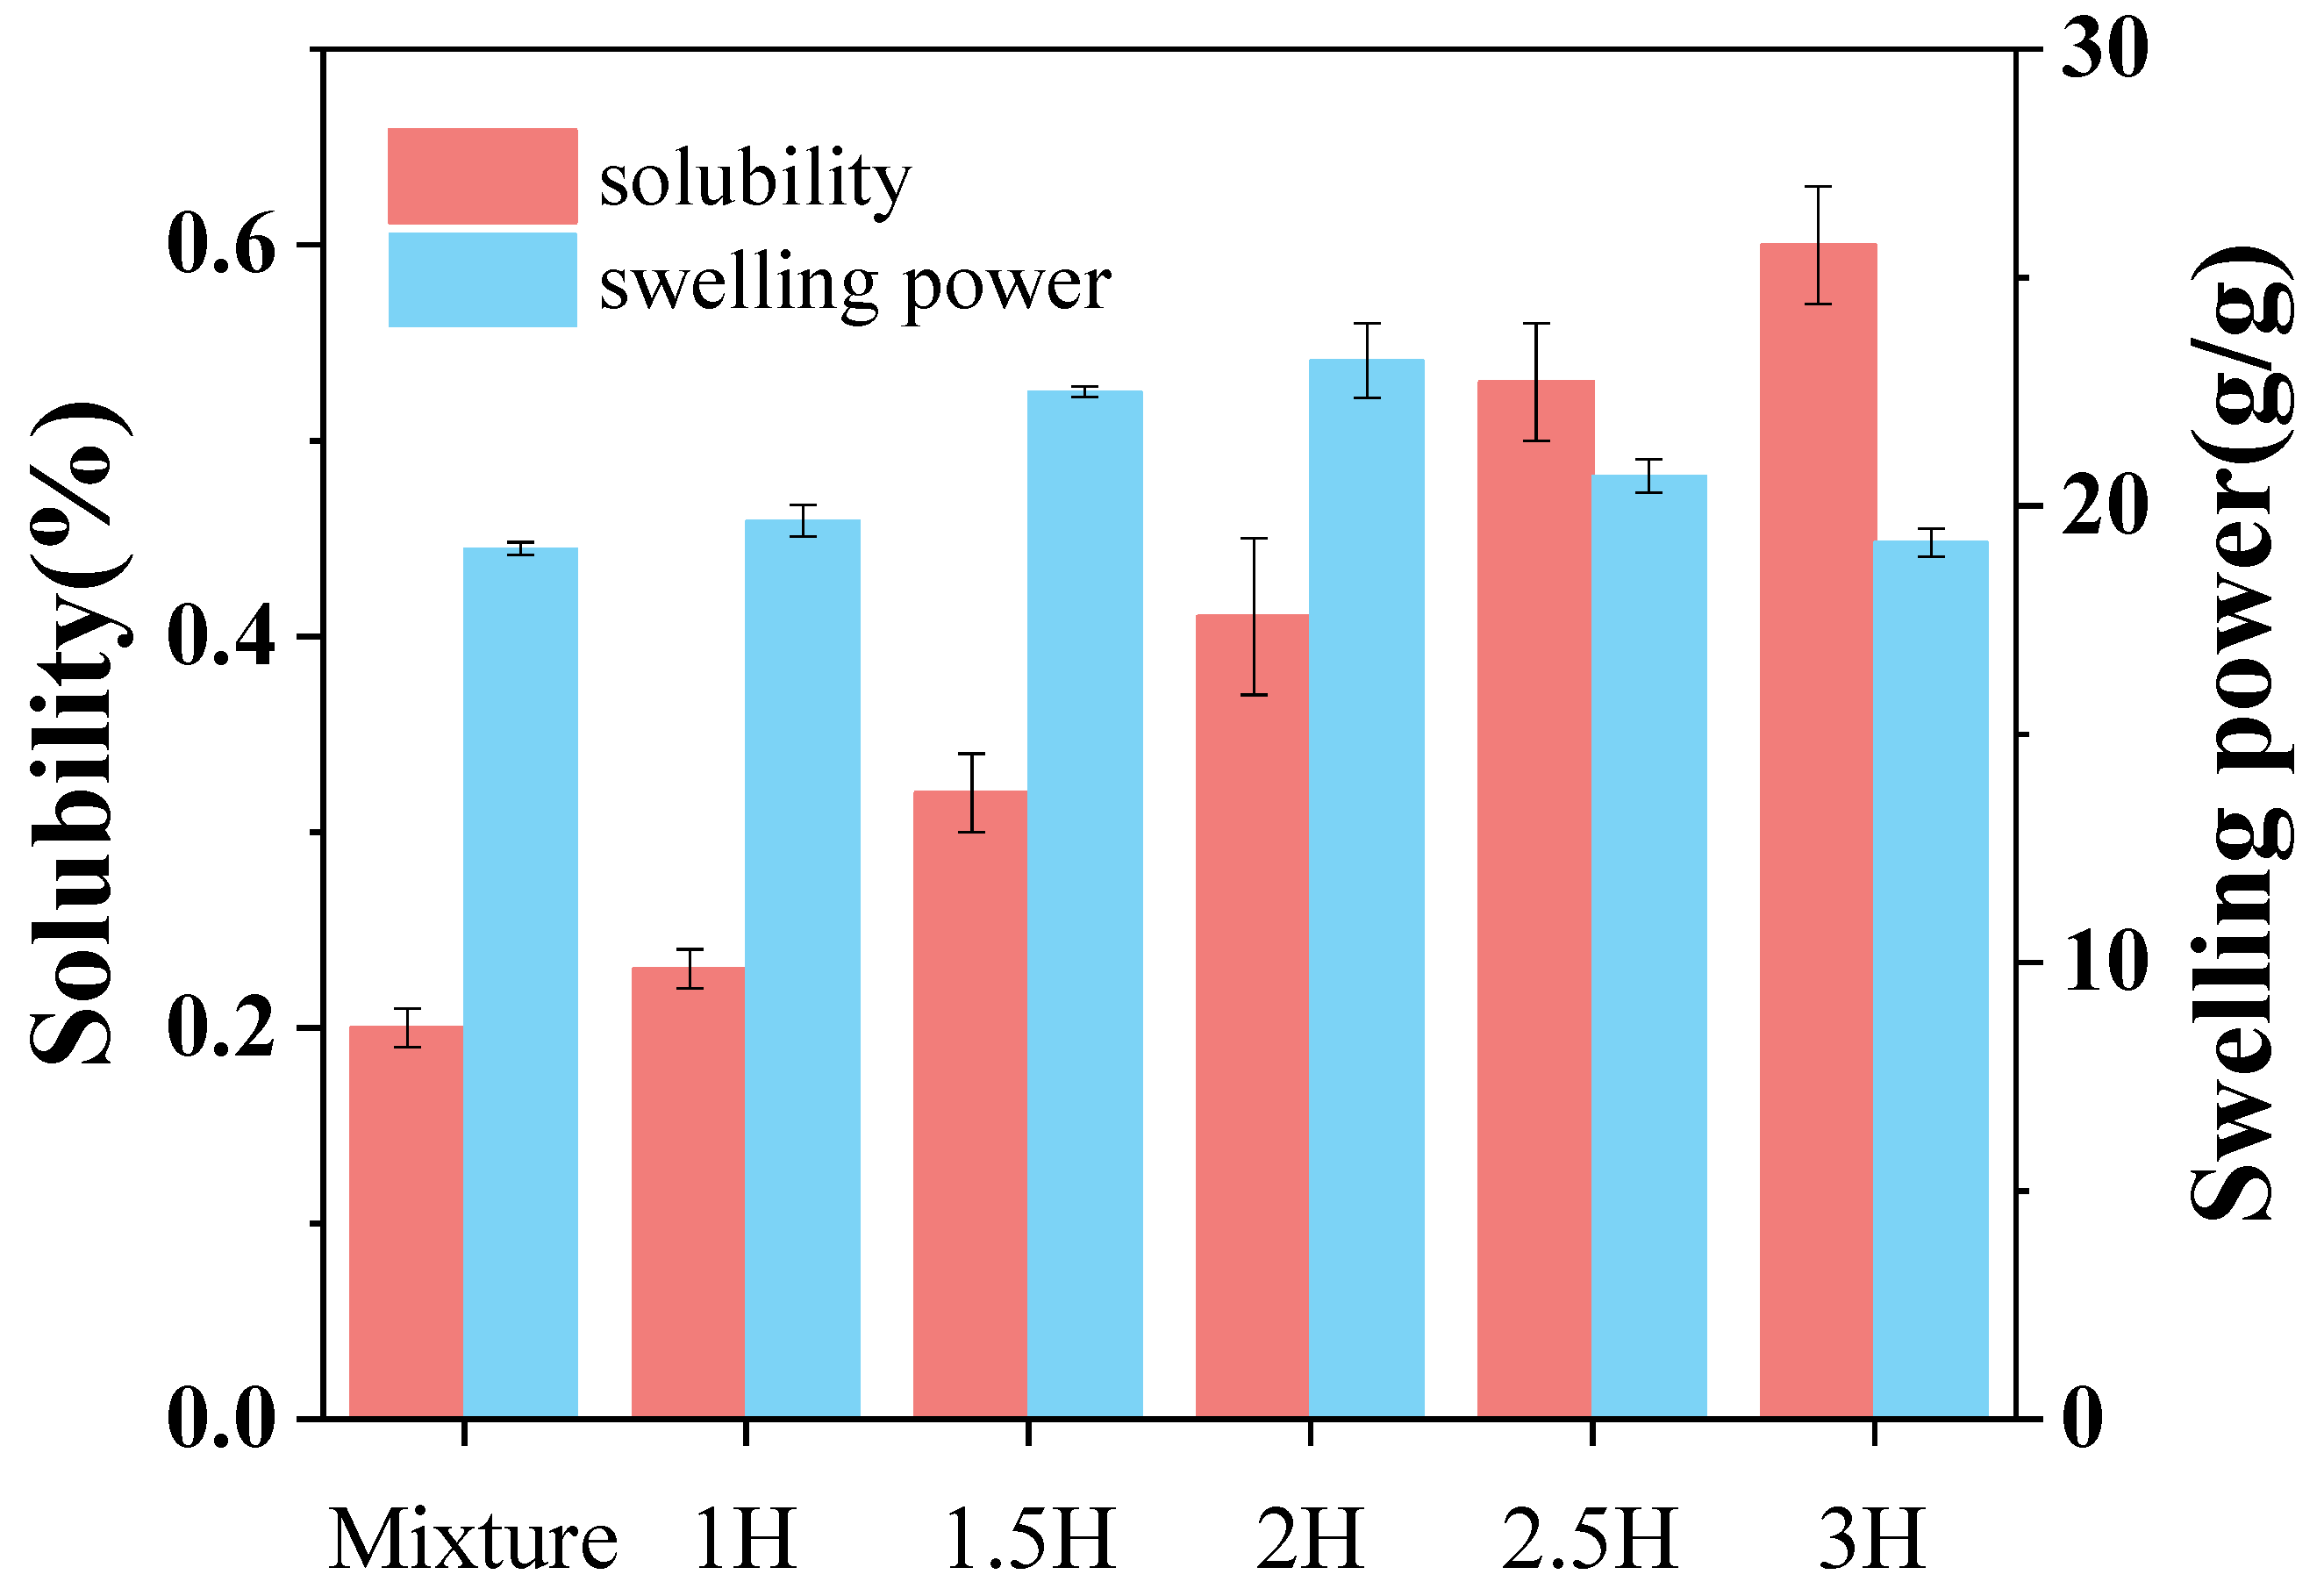
3.1. Solubility and Swelling Power
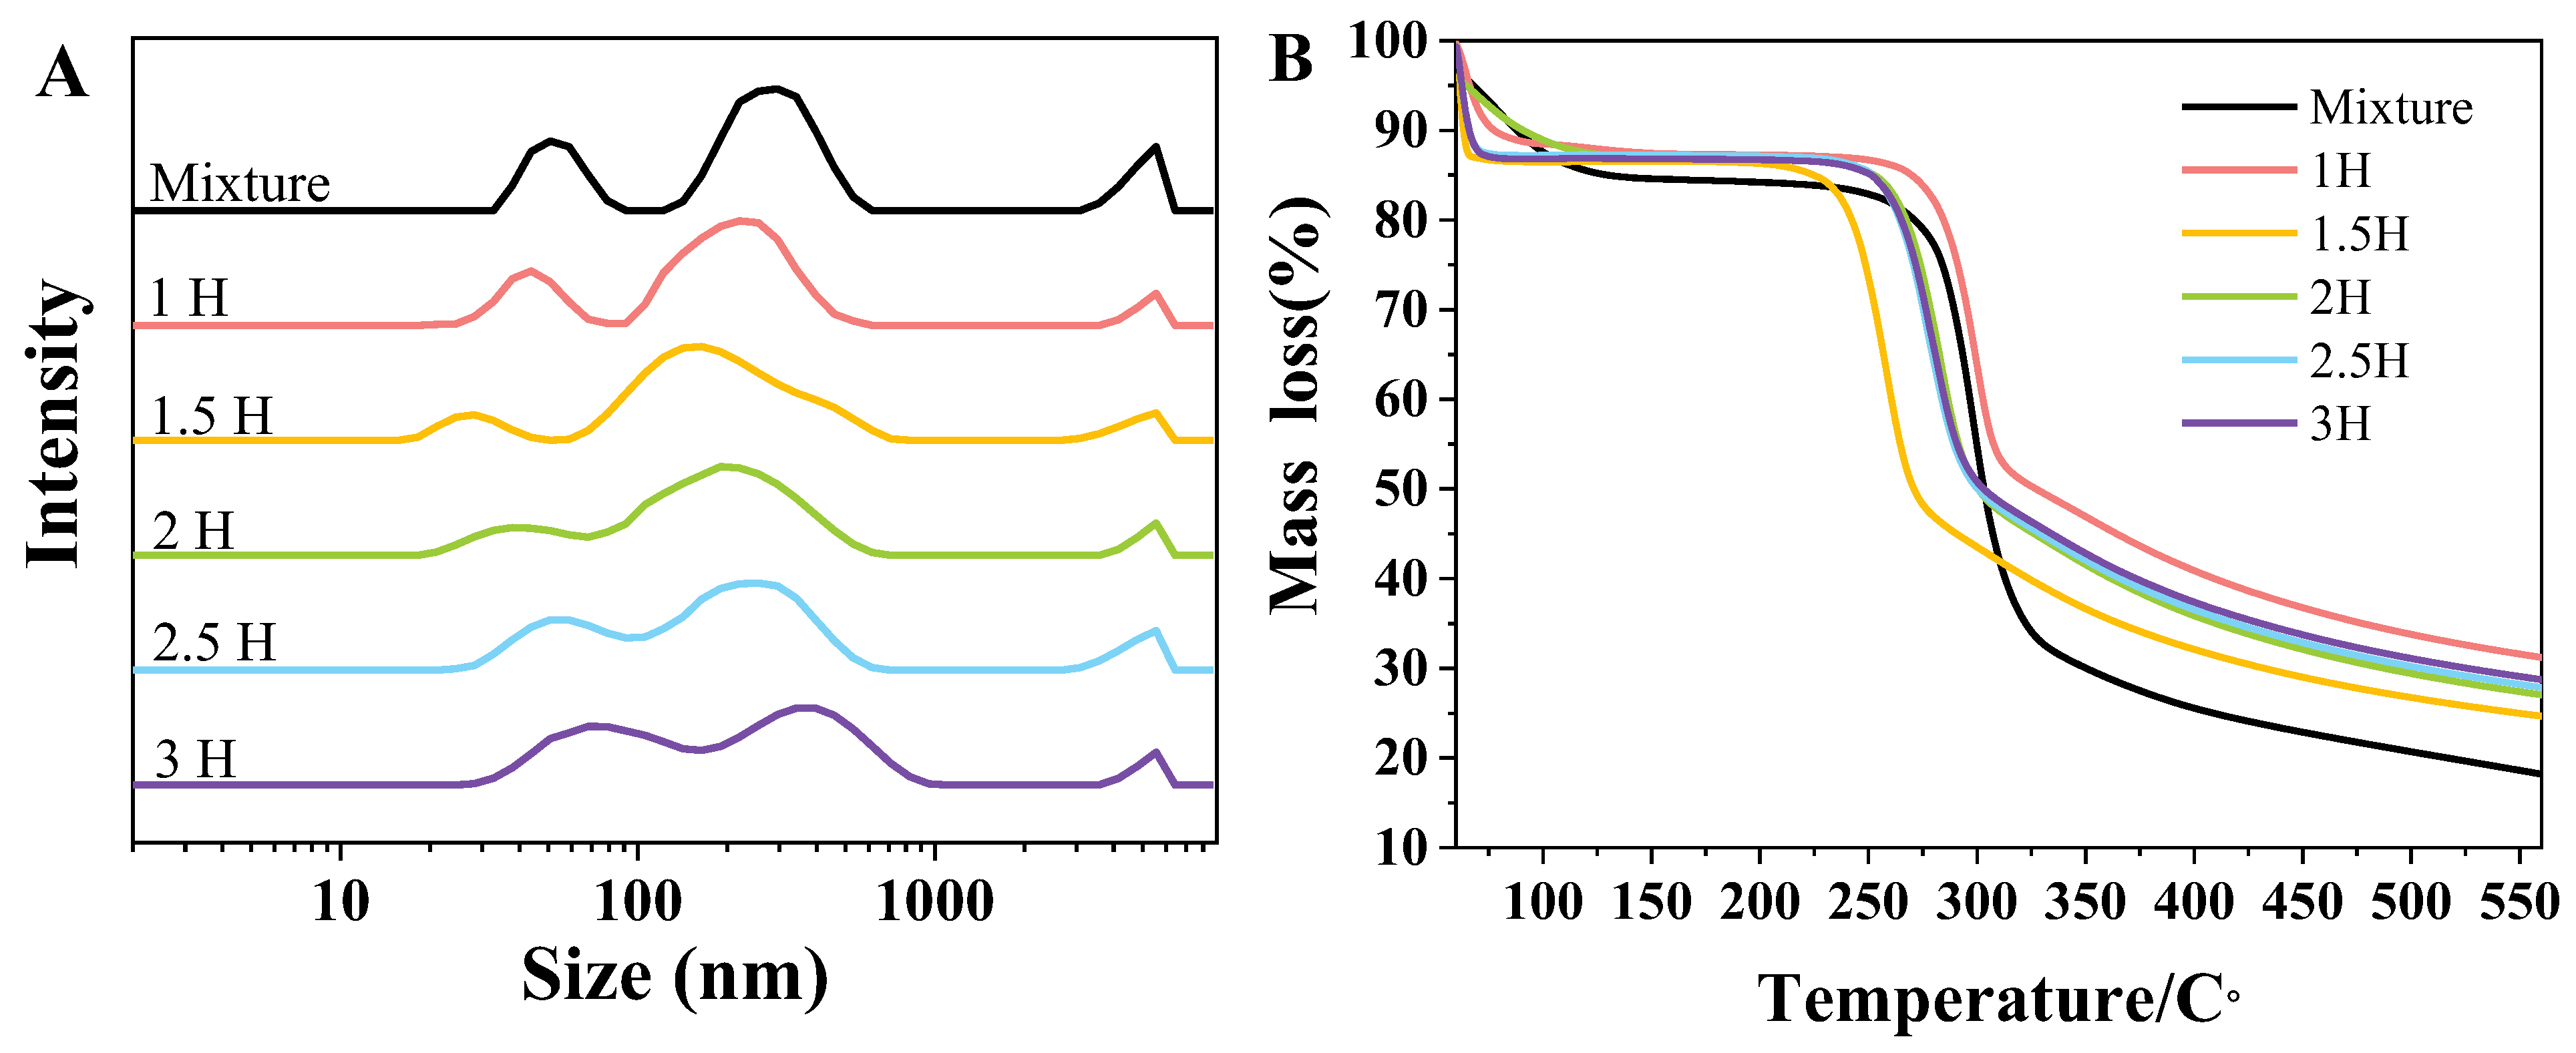
3.2. Particle Size Determination of Complexes
3.3. TGA
3.4. Gelatinization Characteristics
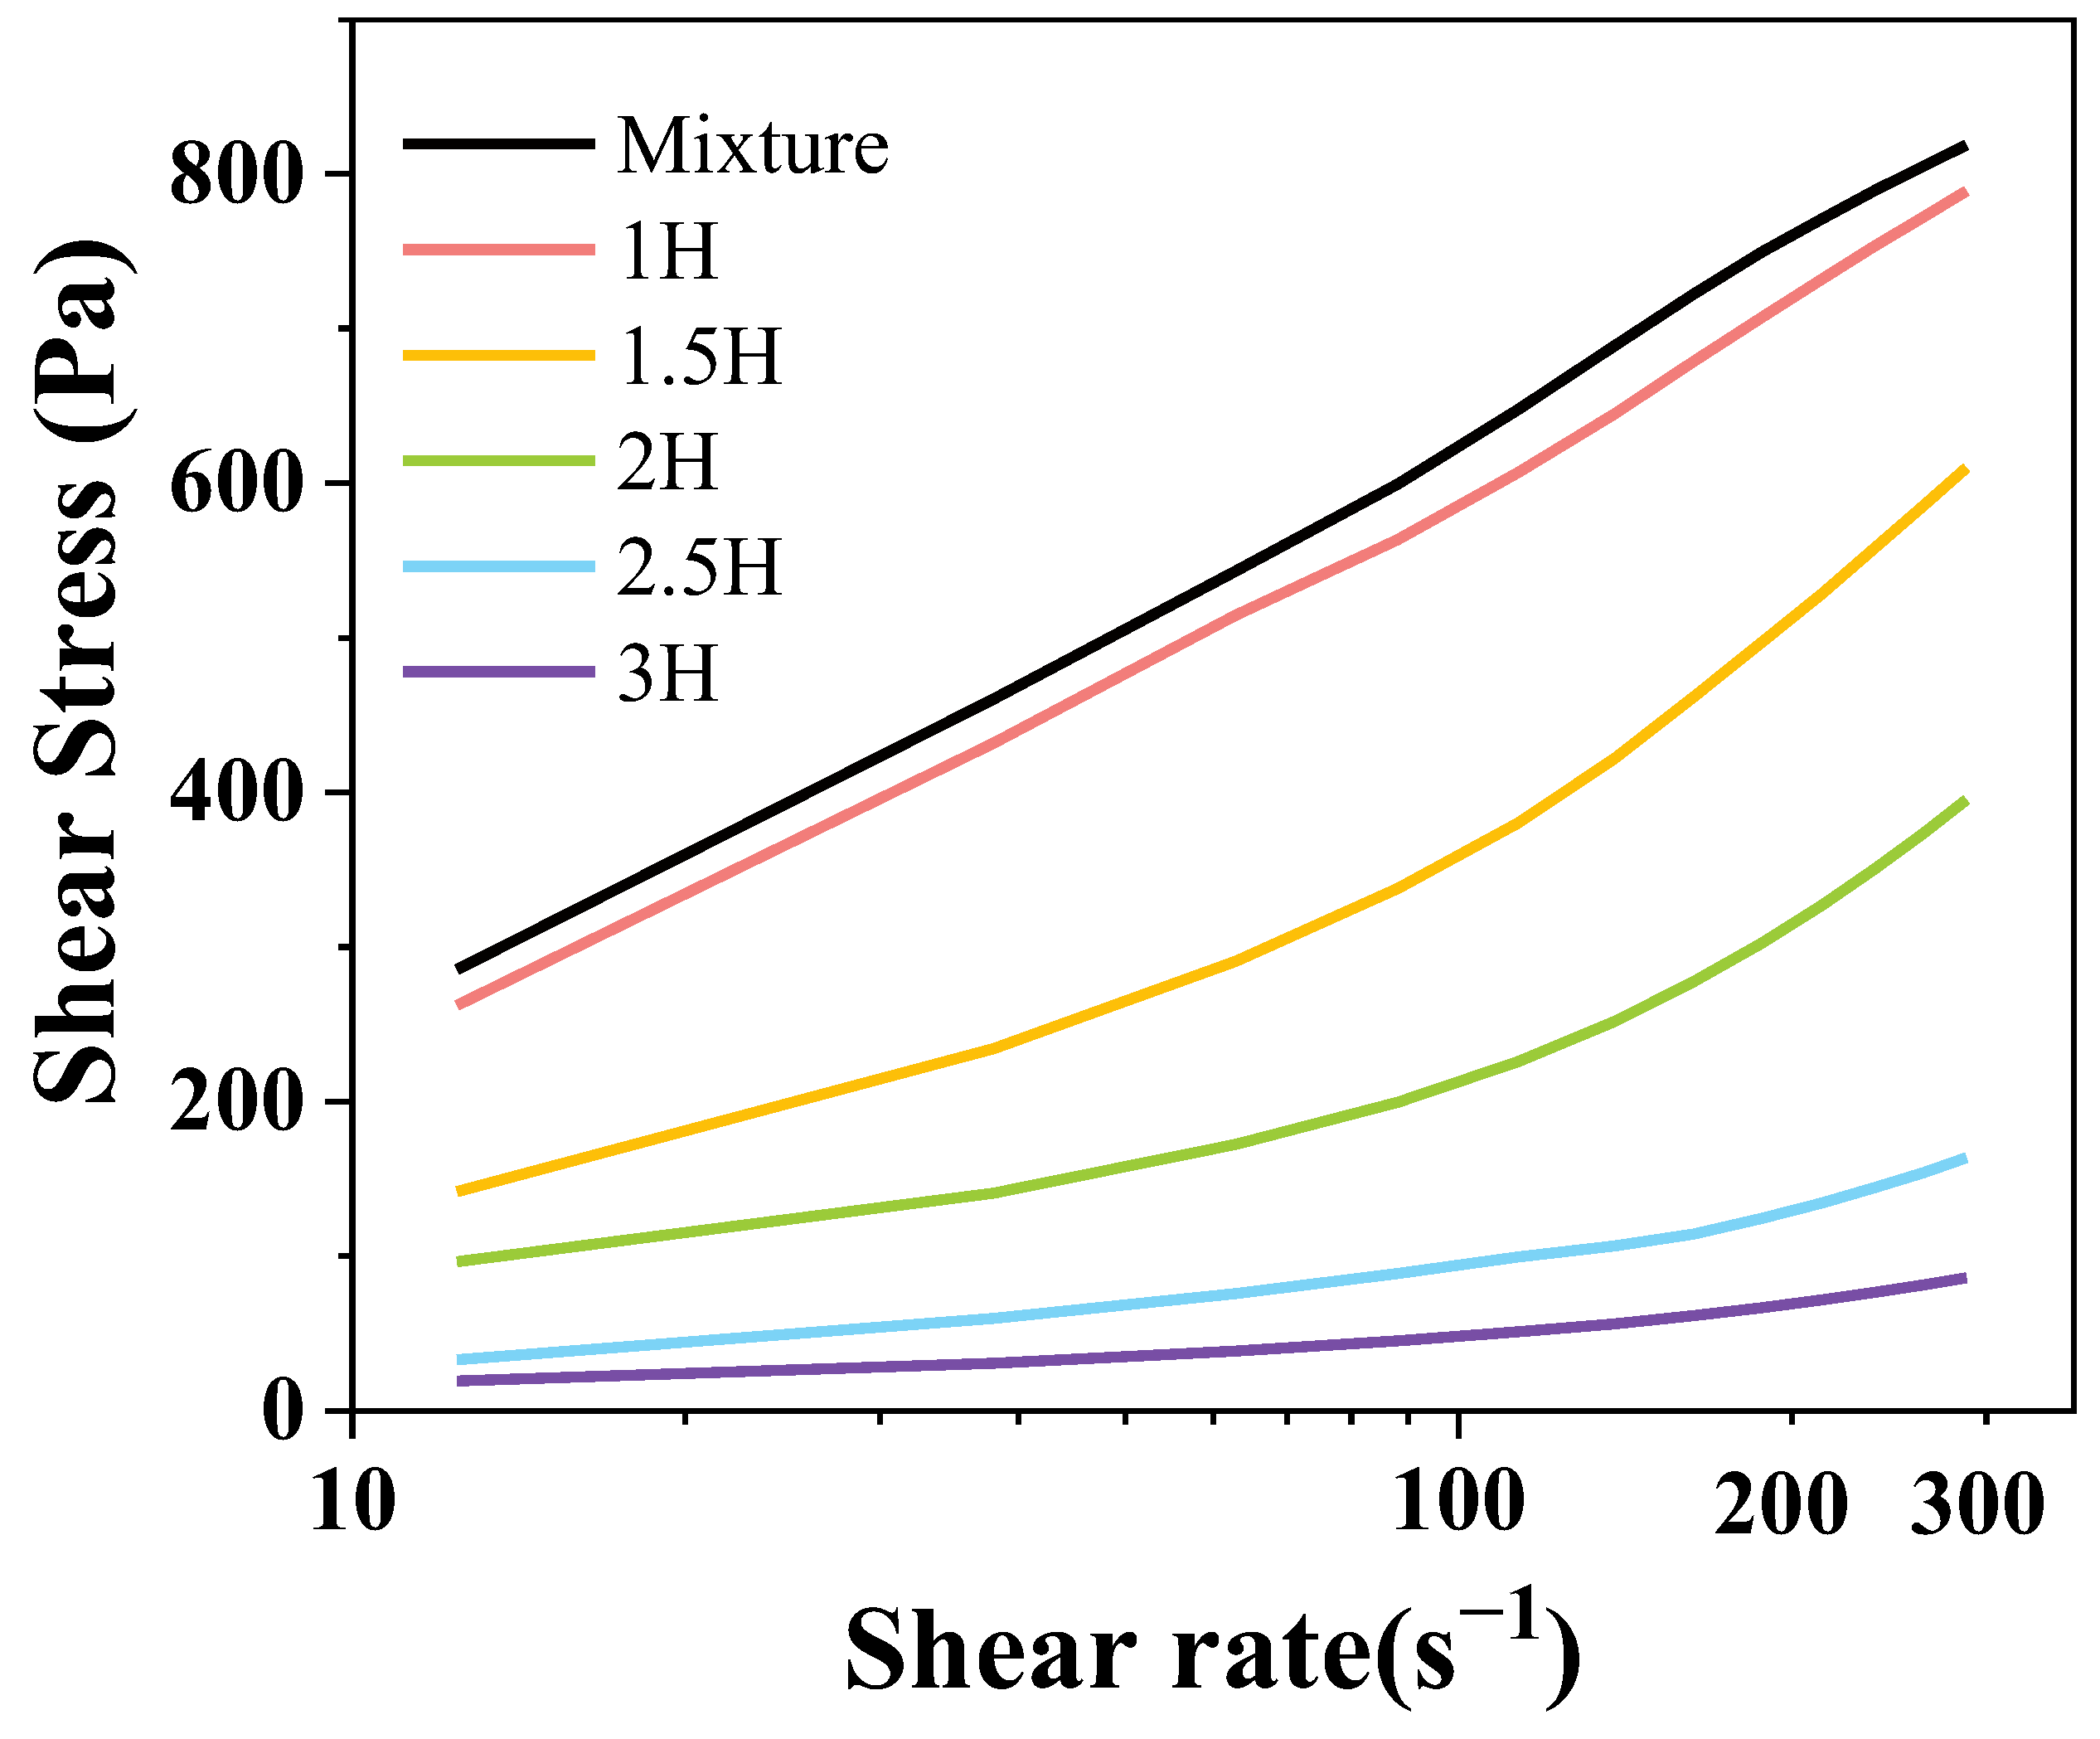
3.5. Static Rheological Analysis
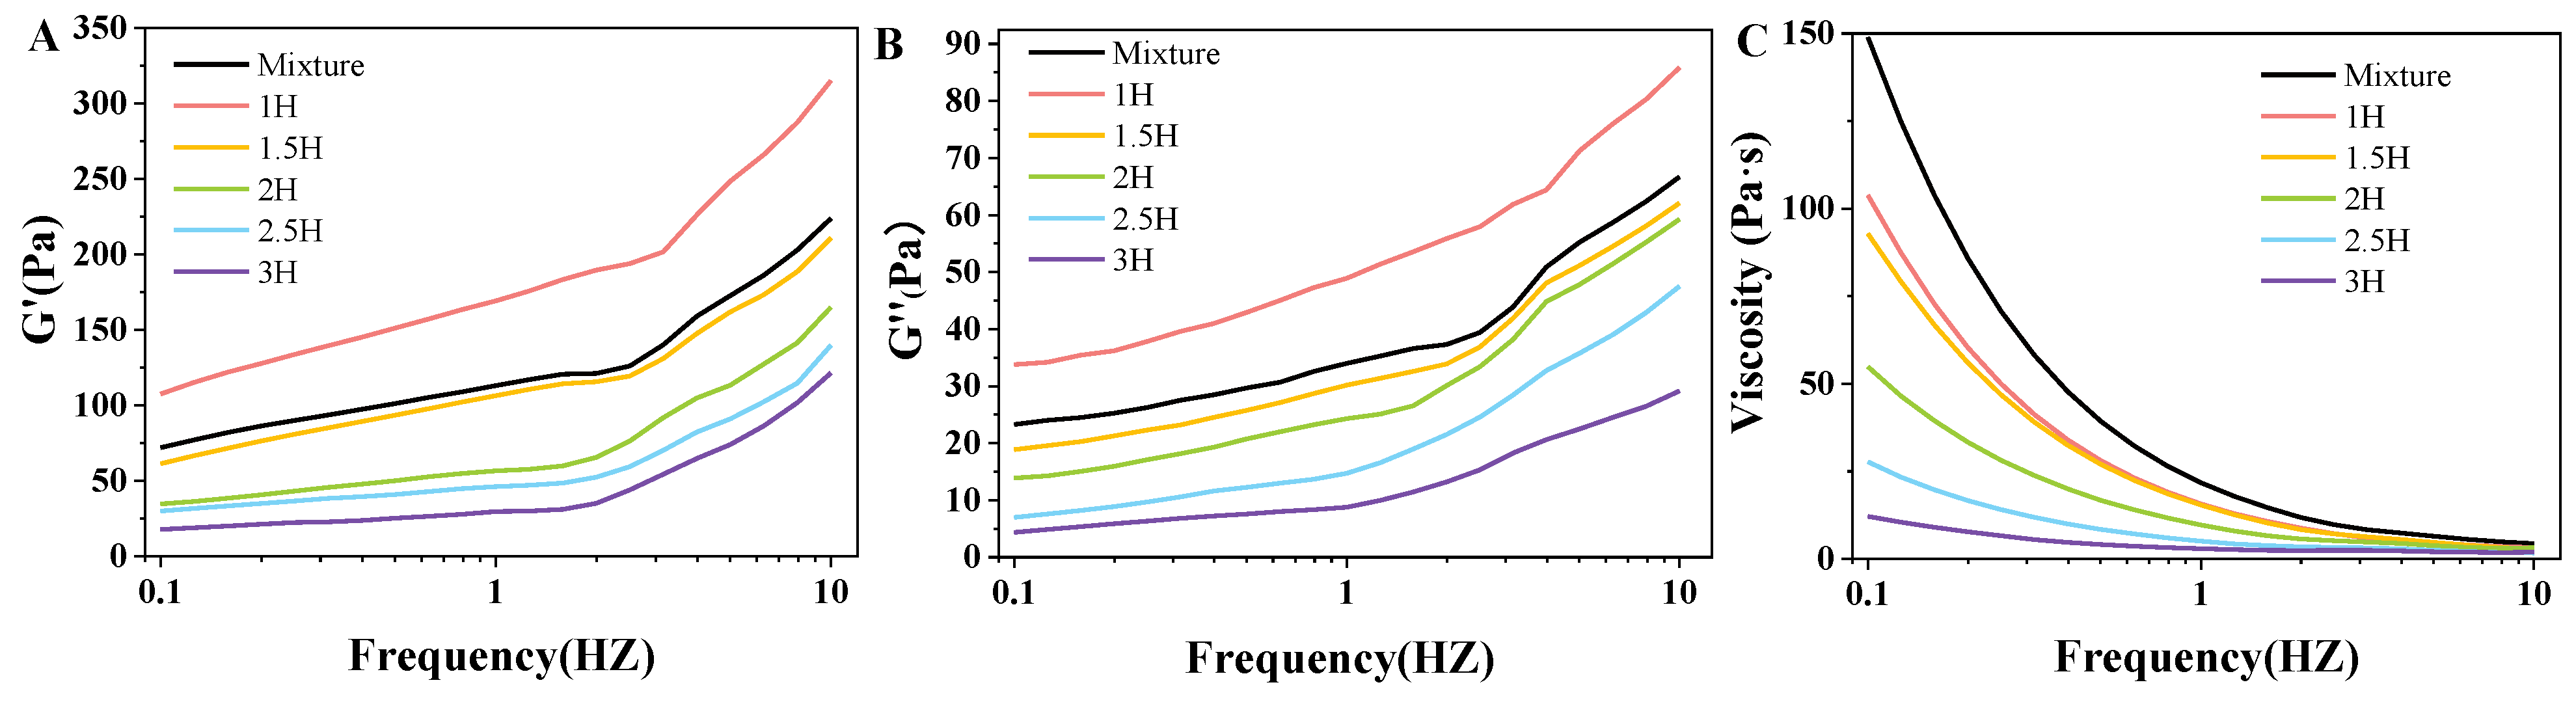
3.6. State of Viscoelastic Properties Analysis
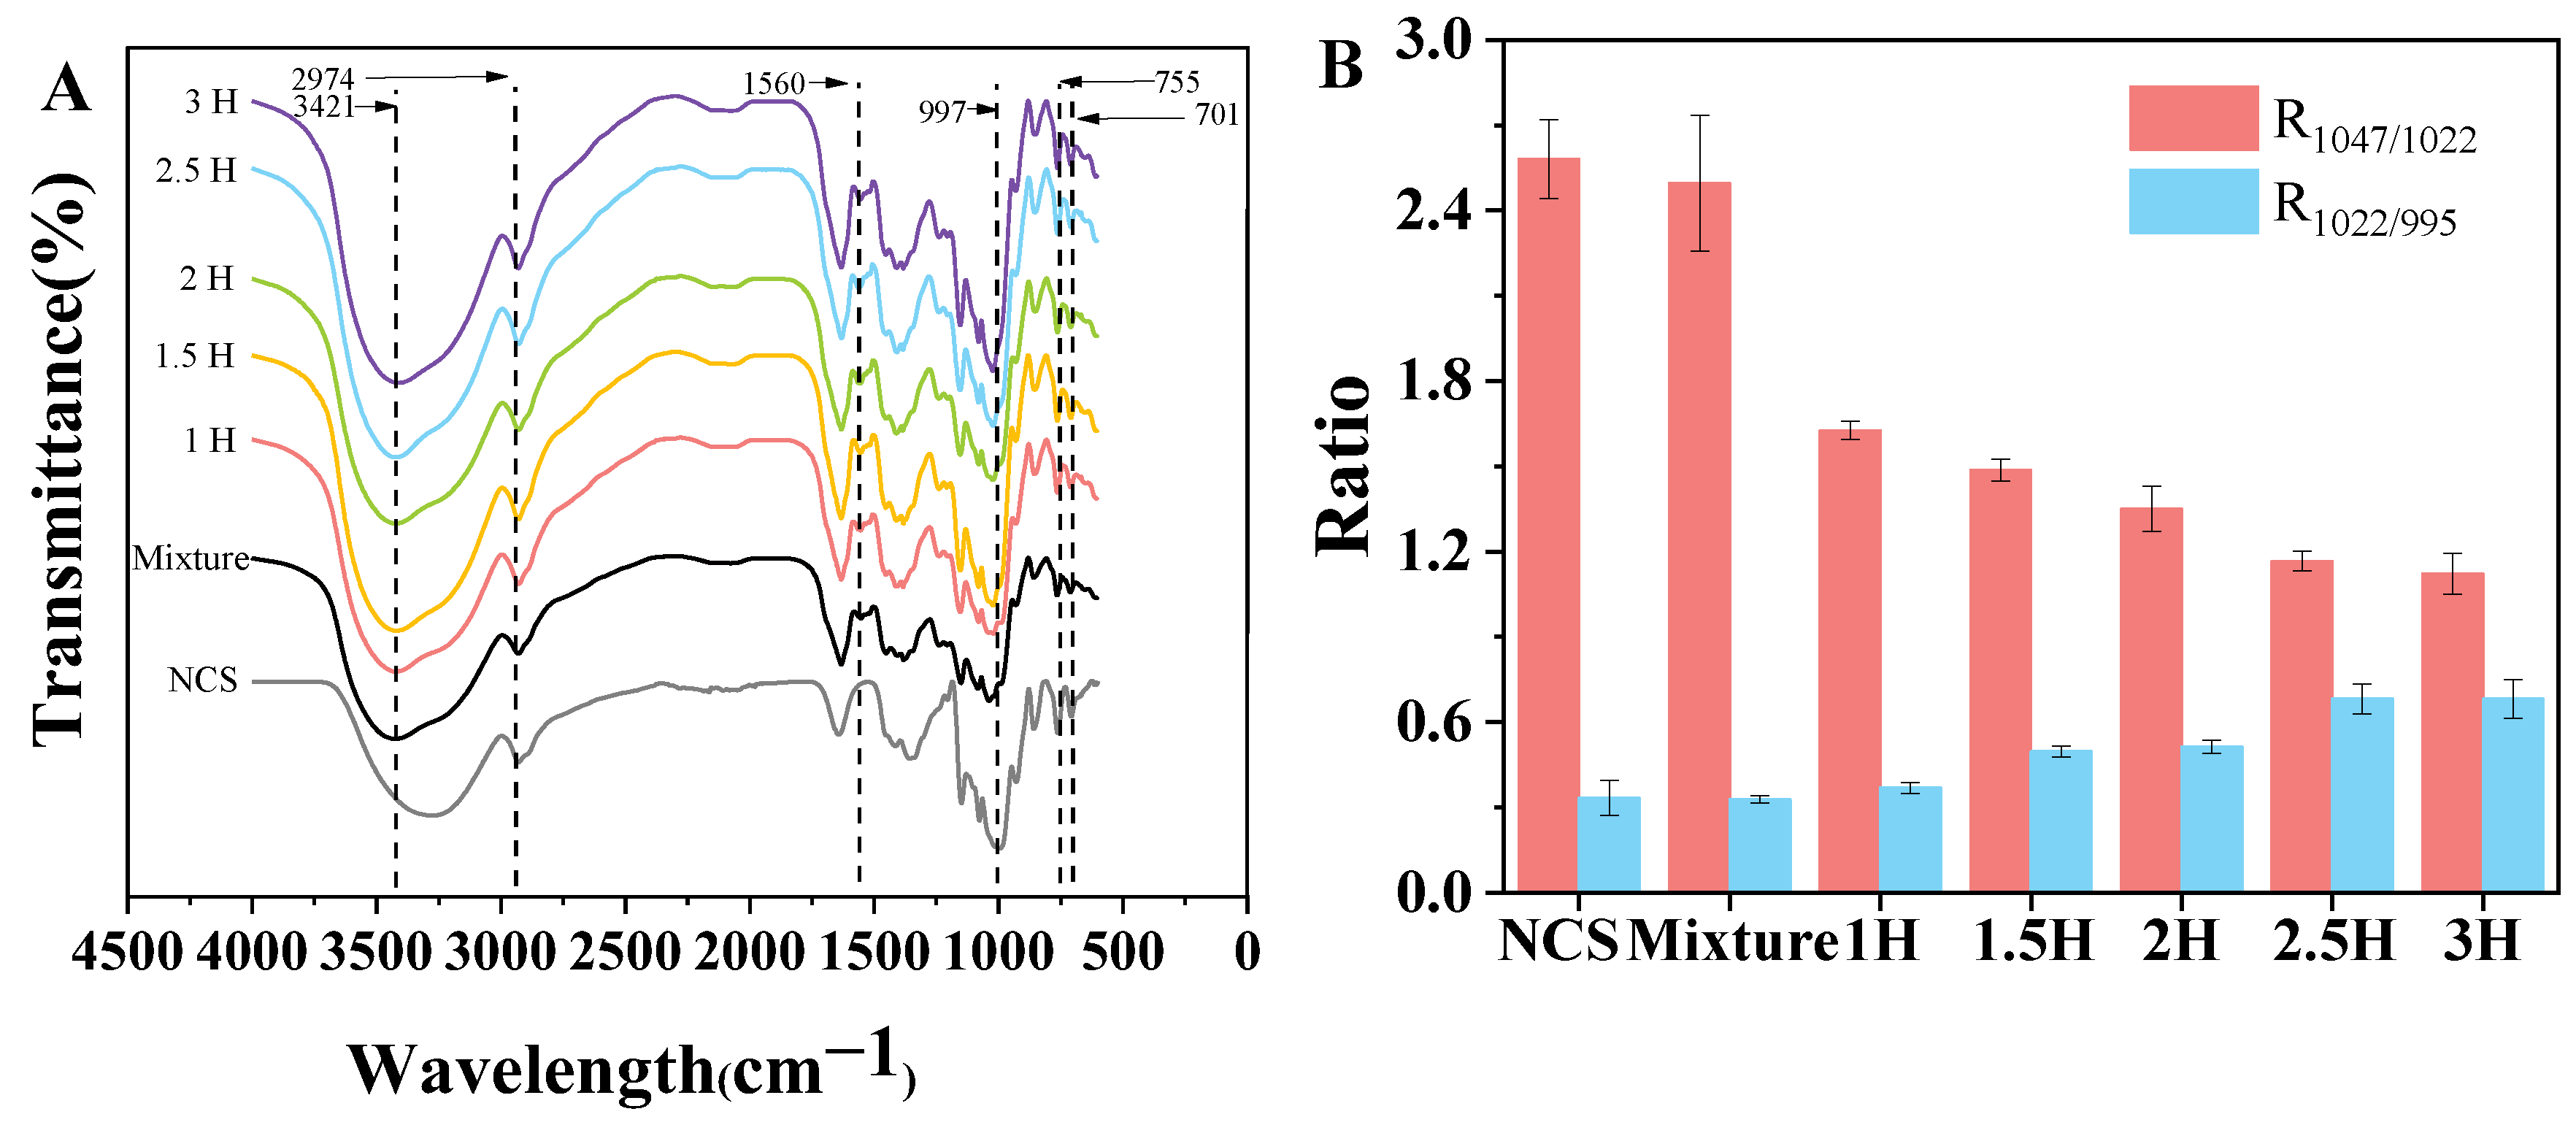
3.7. FT-IR Spectroscopy
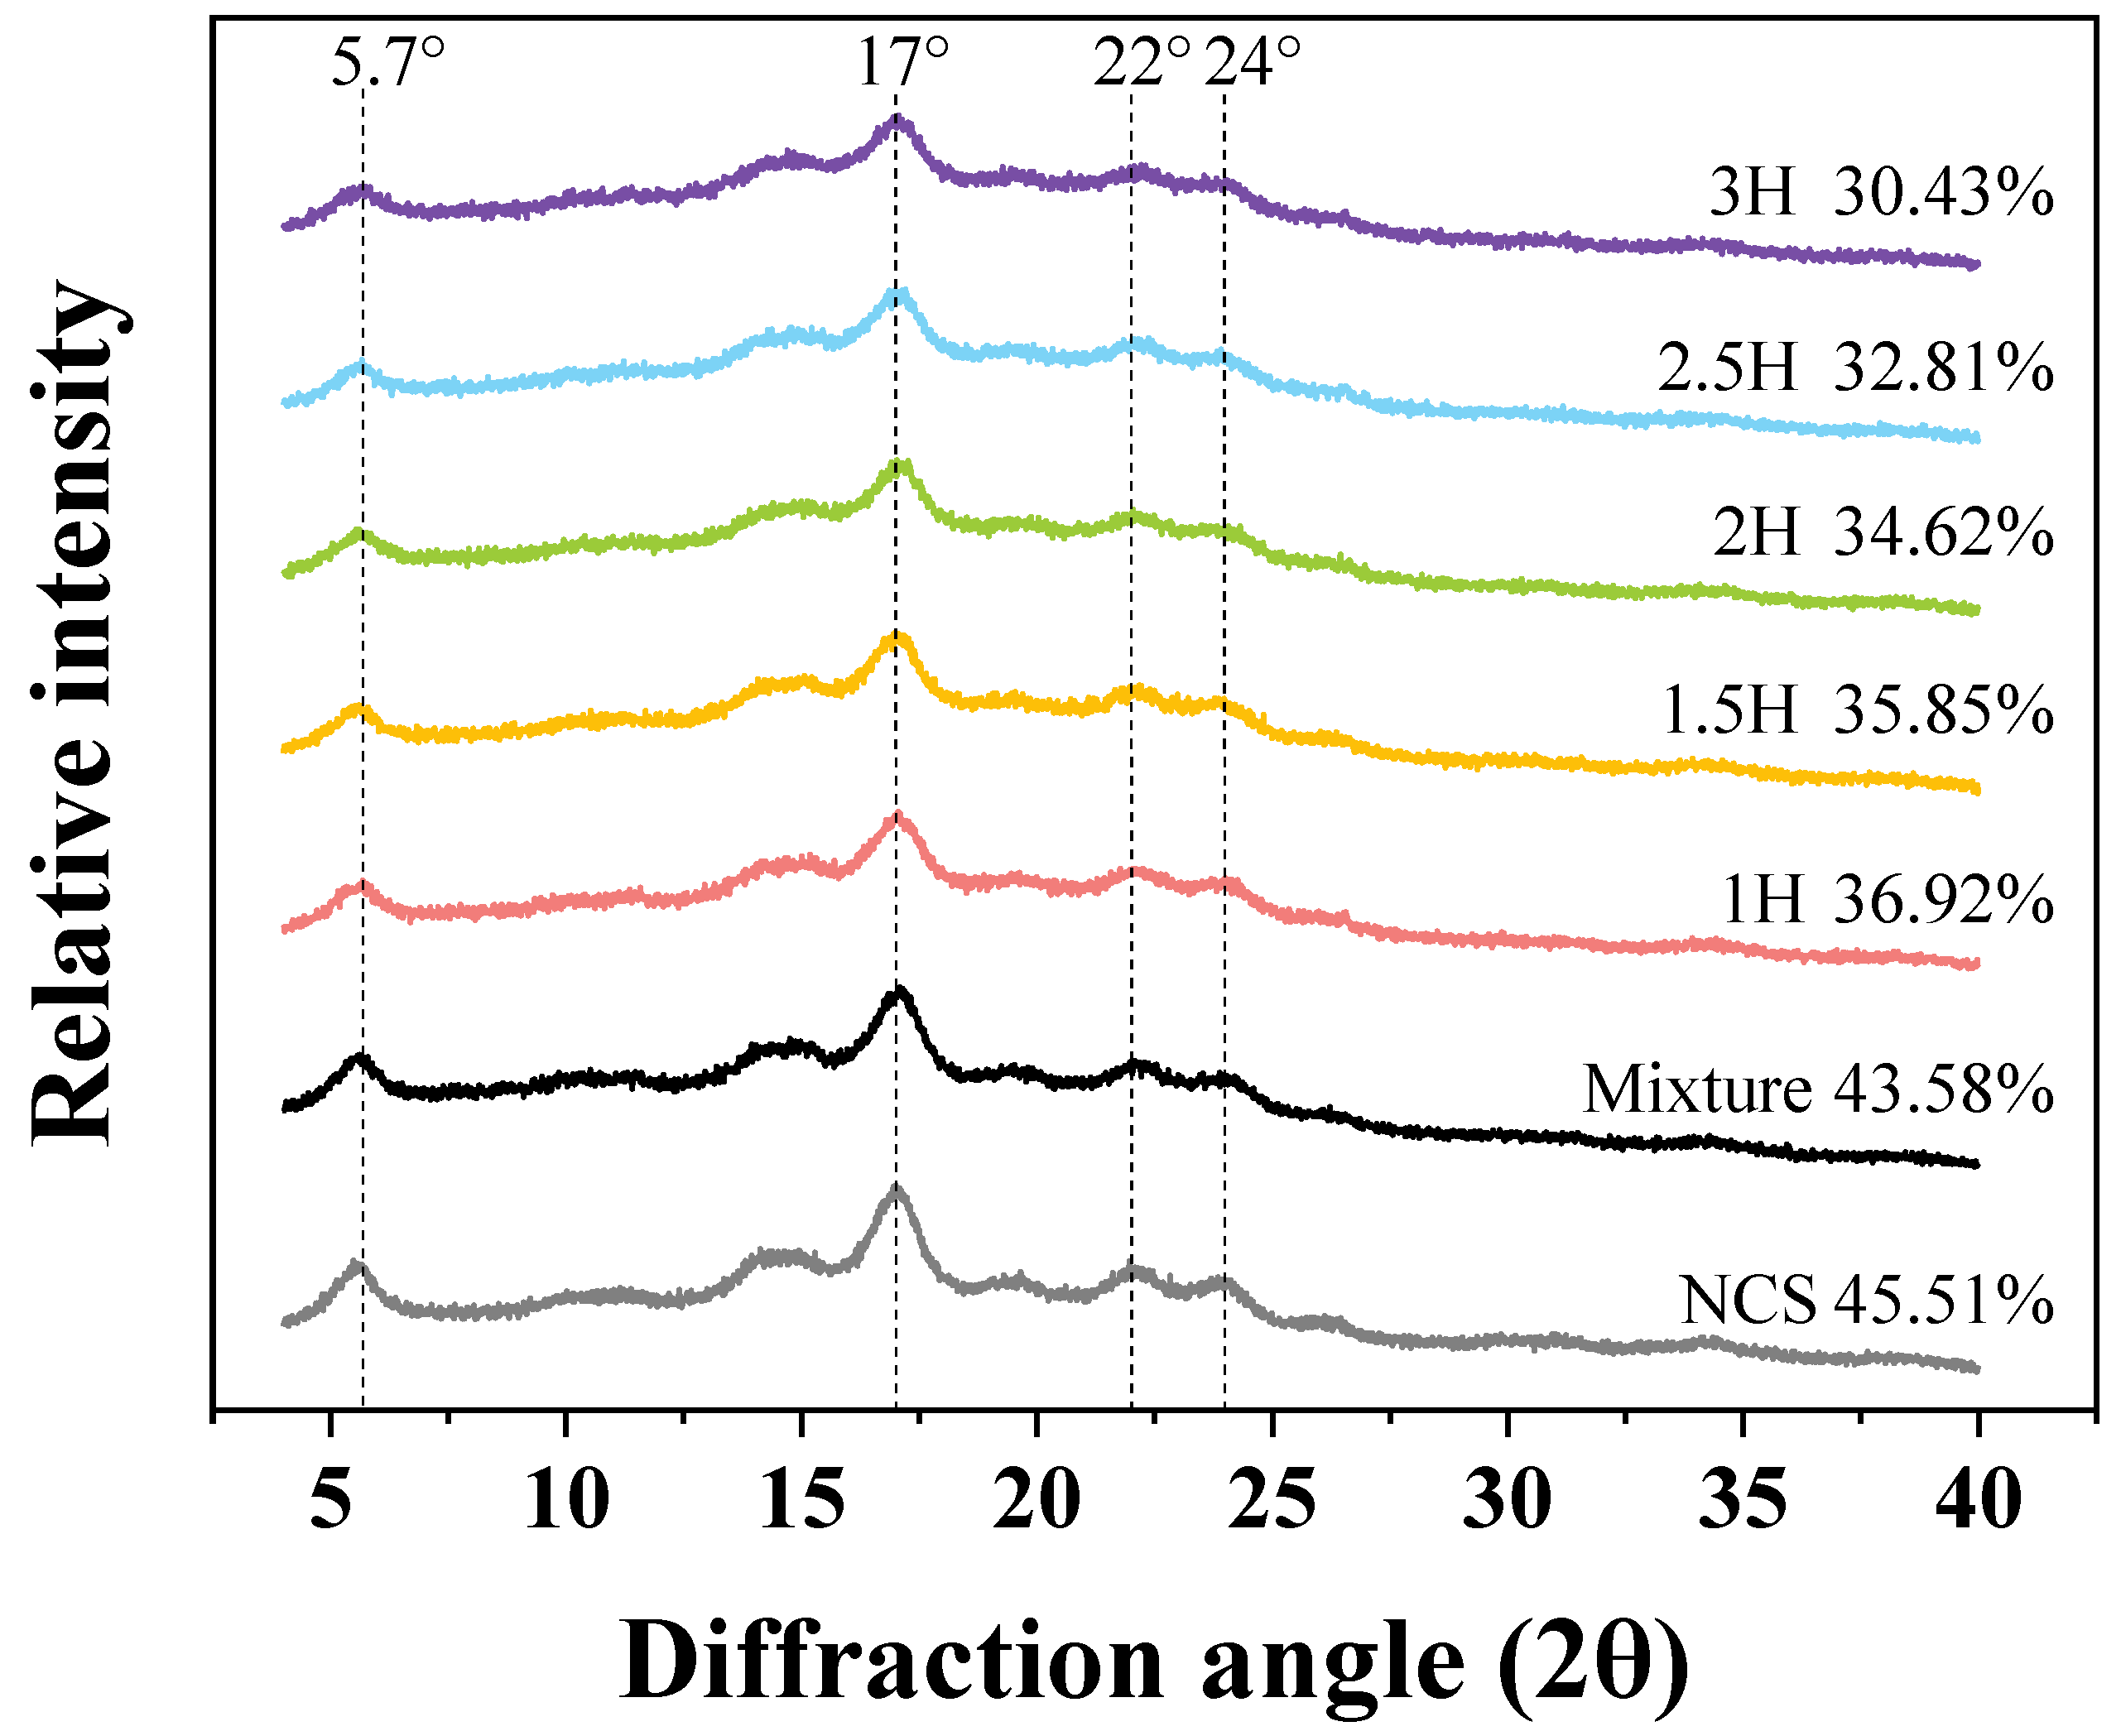
3.8. XRD
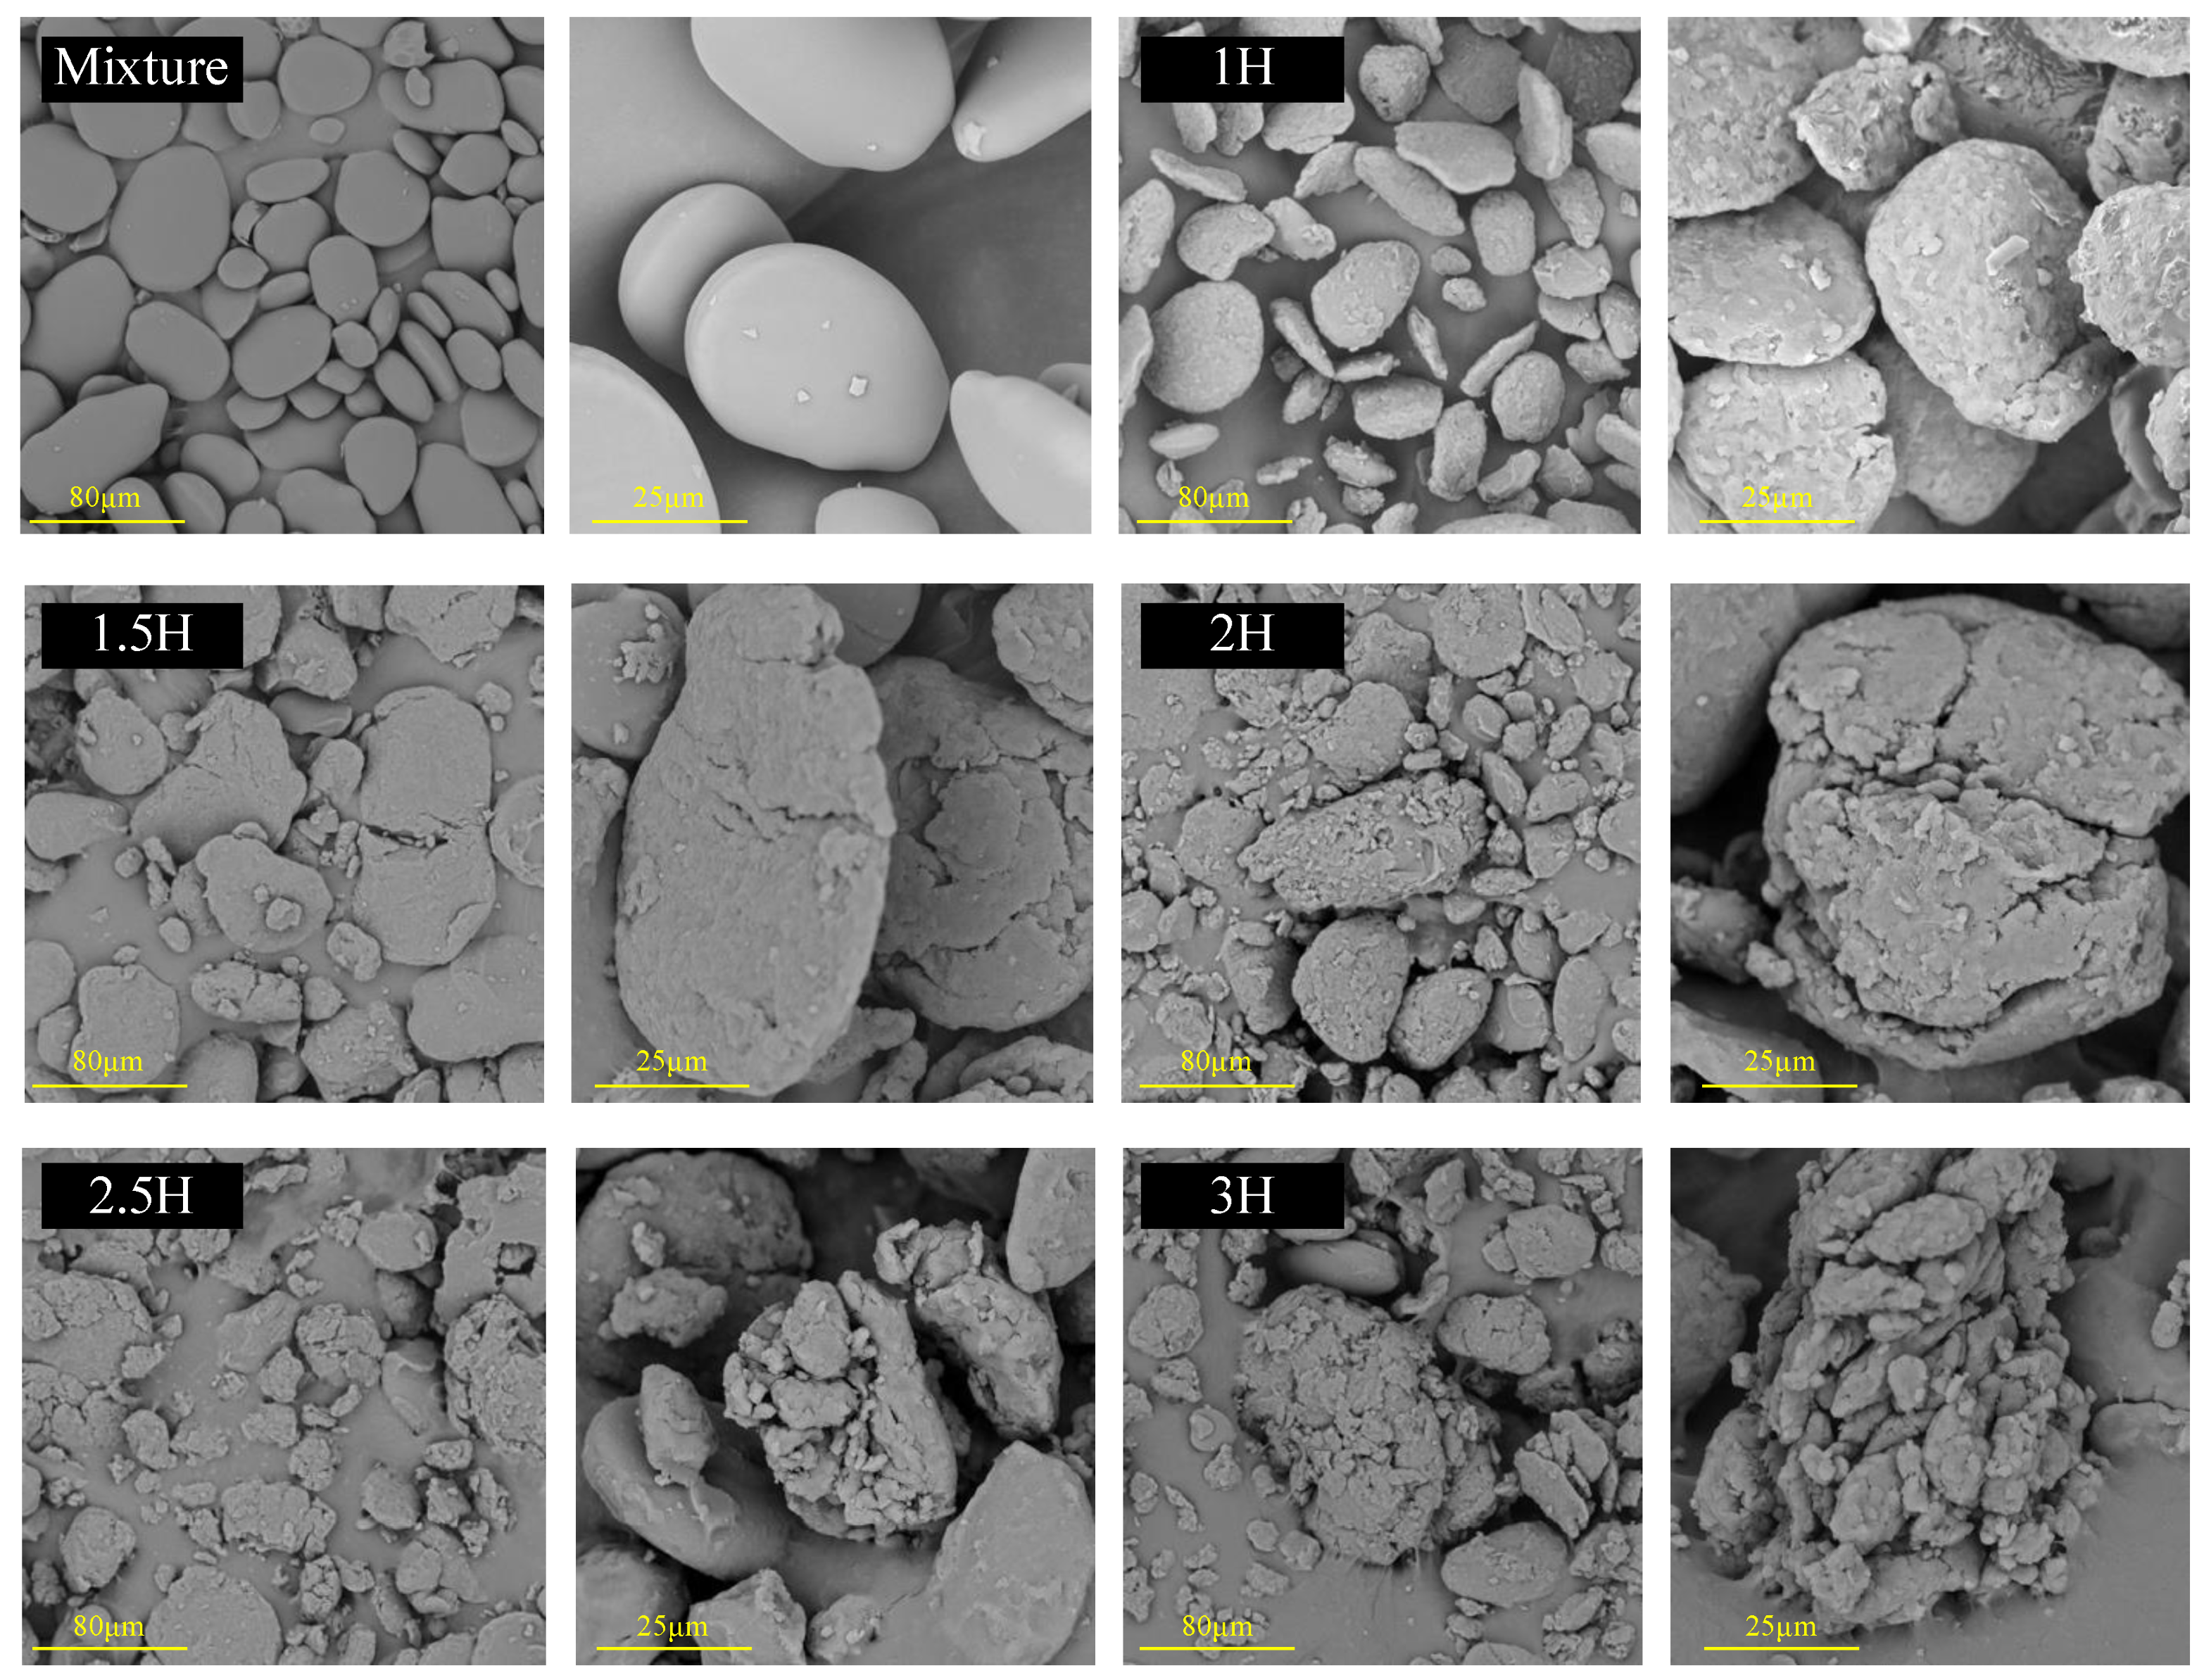
3.9. SEM
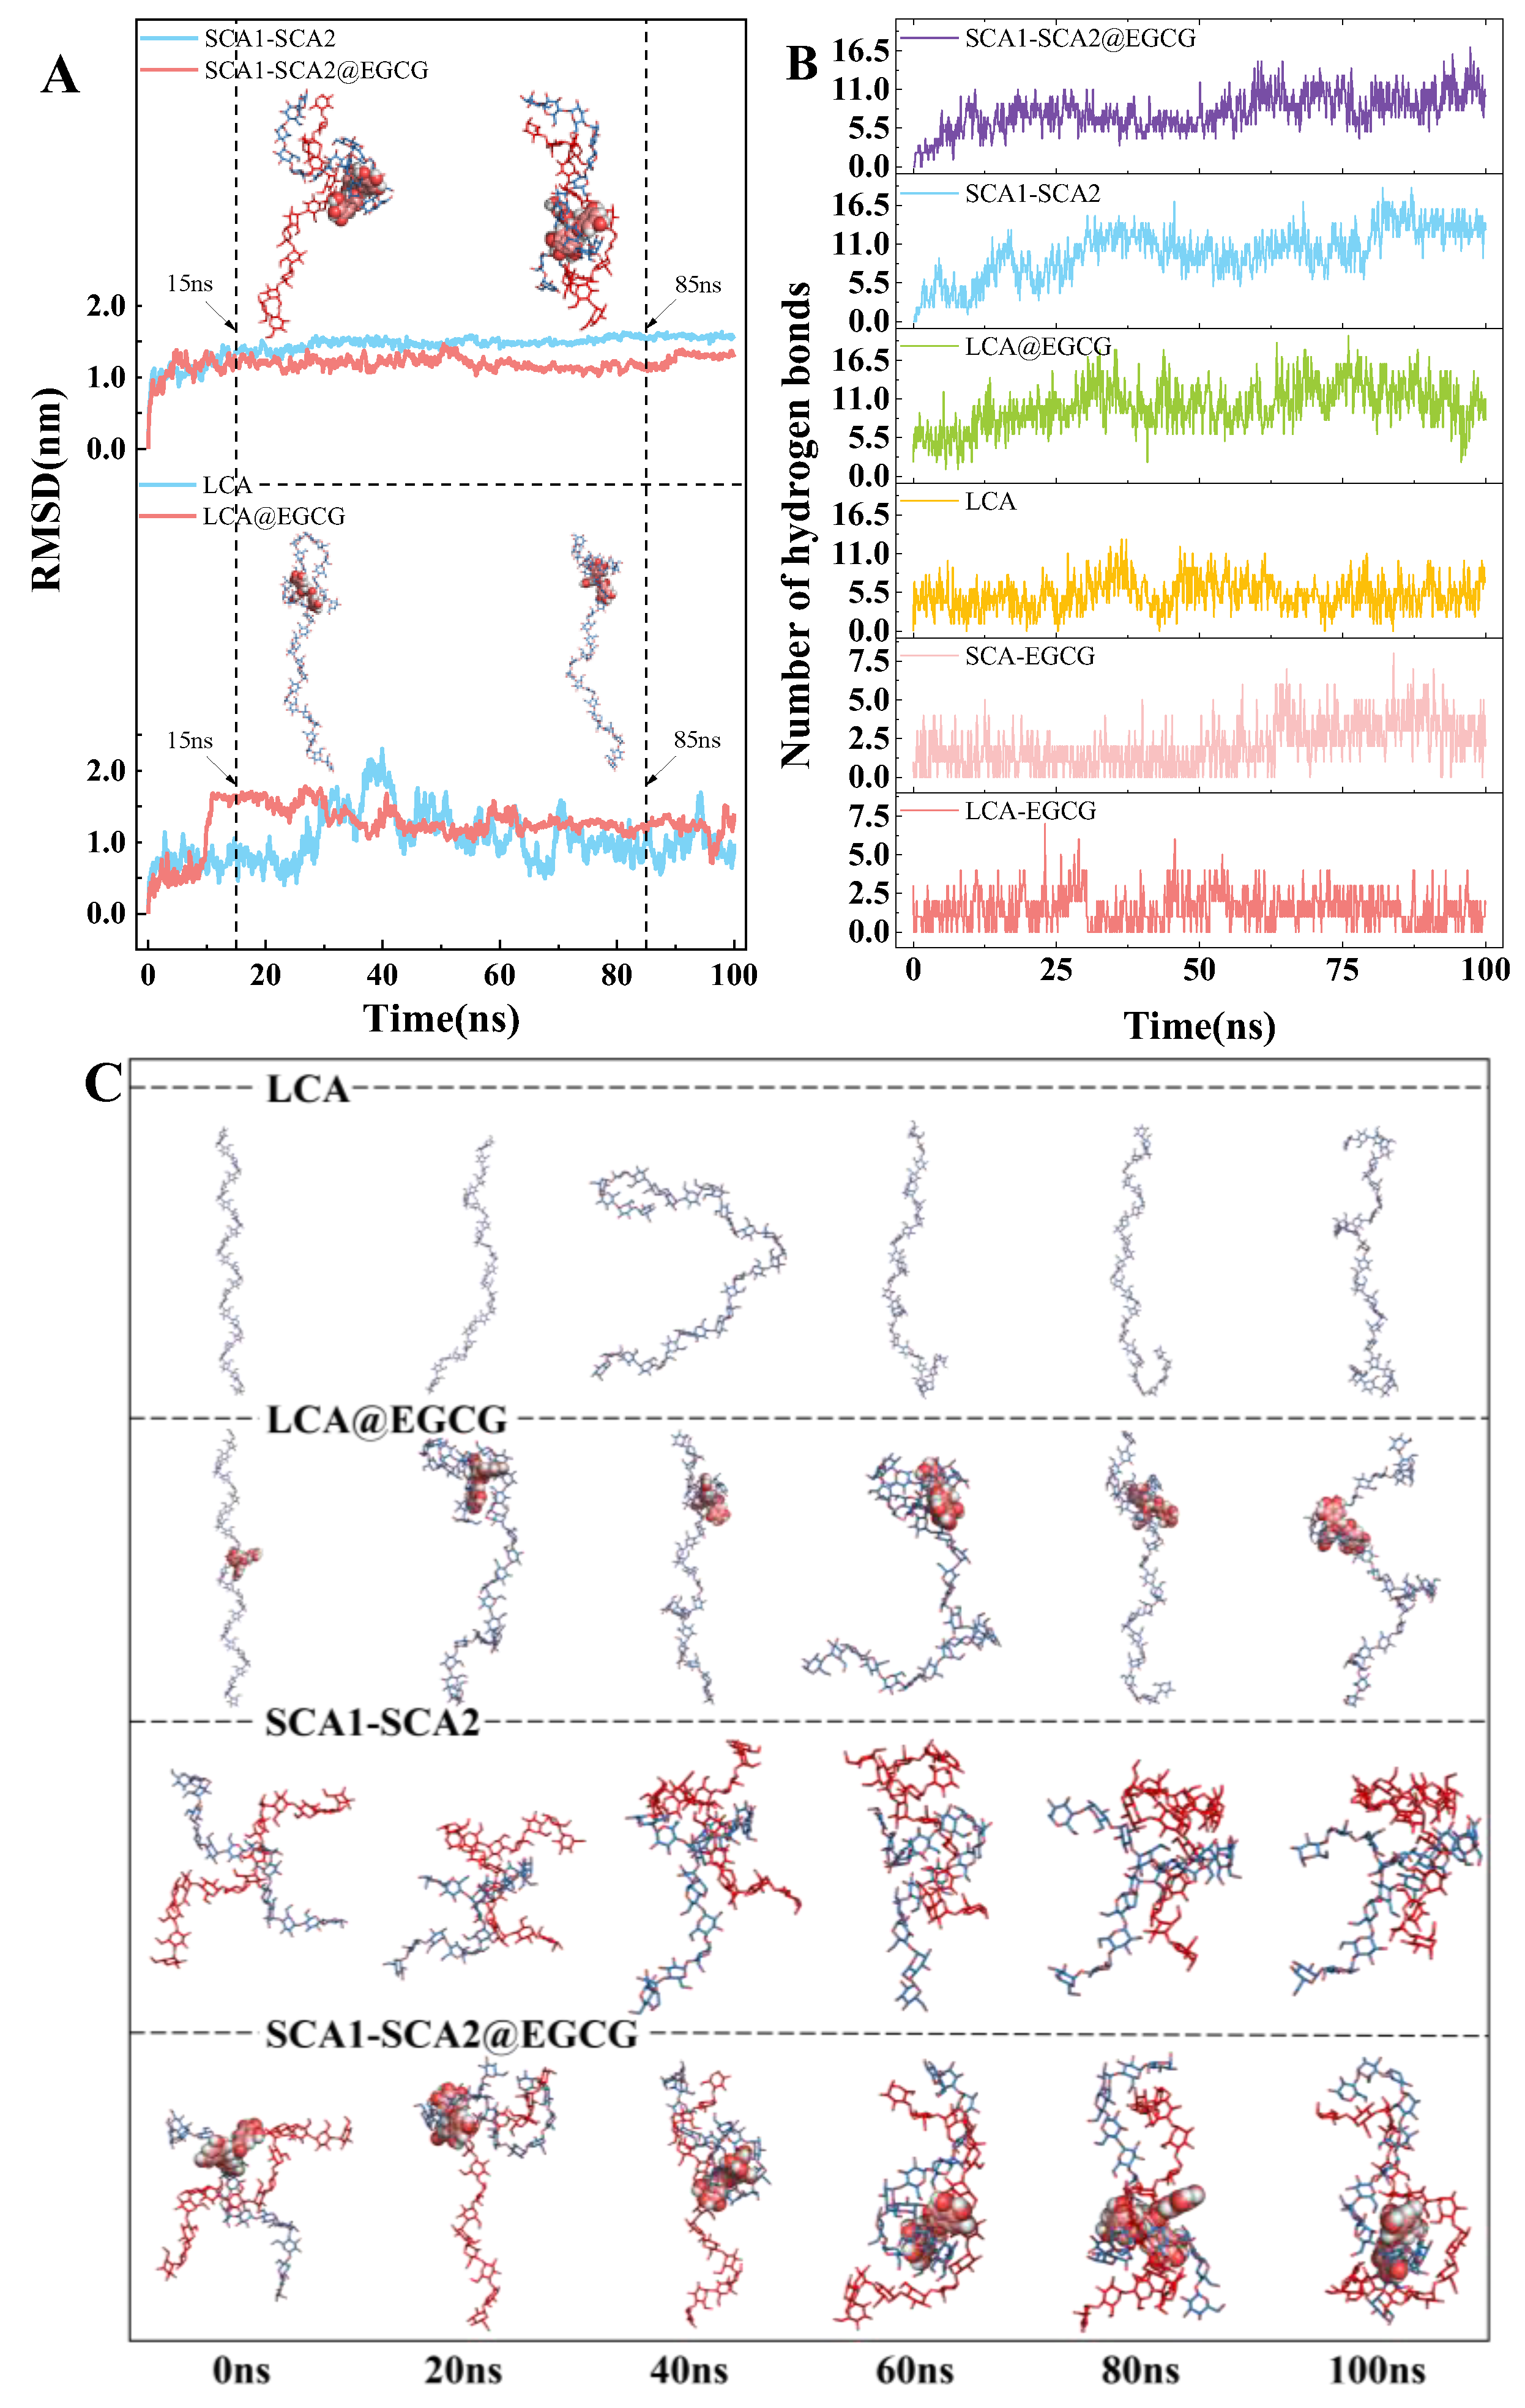
3.10. Structural Stability Analysis
3.11. Hydrogen Bond Dynamics
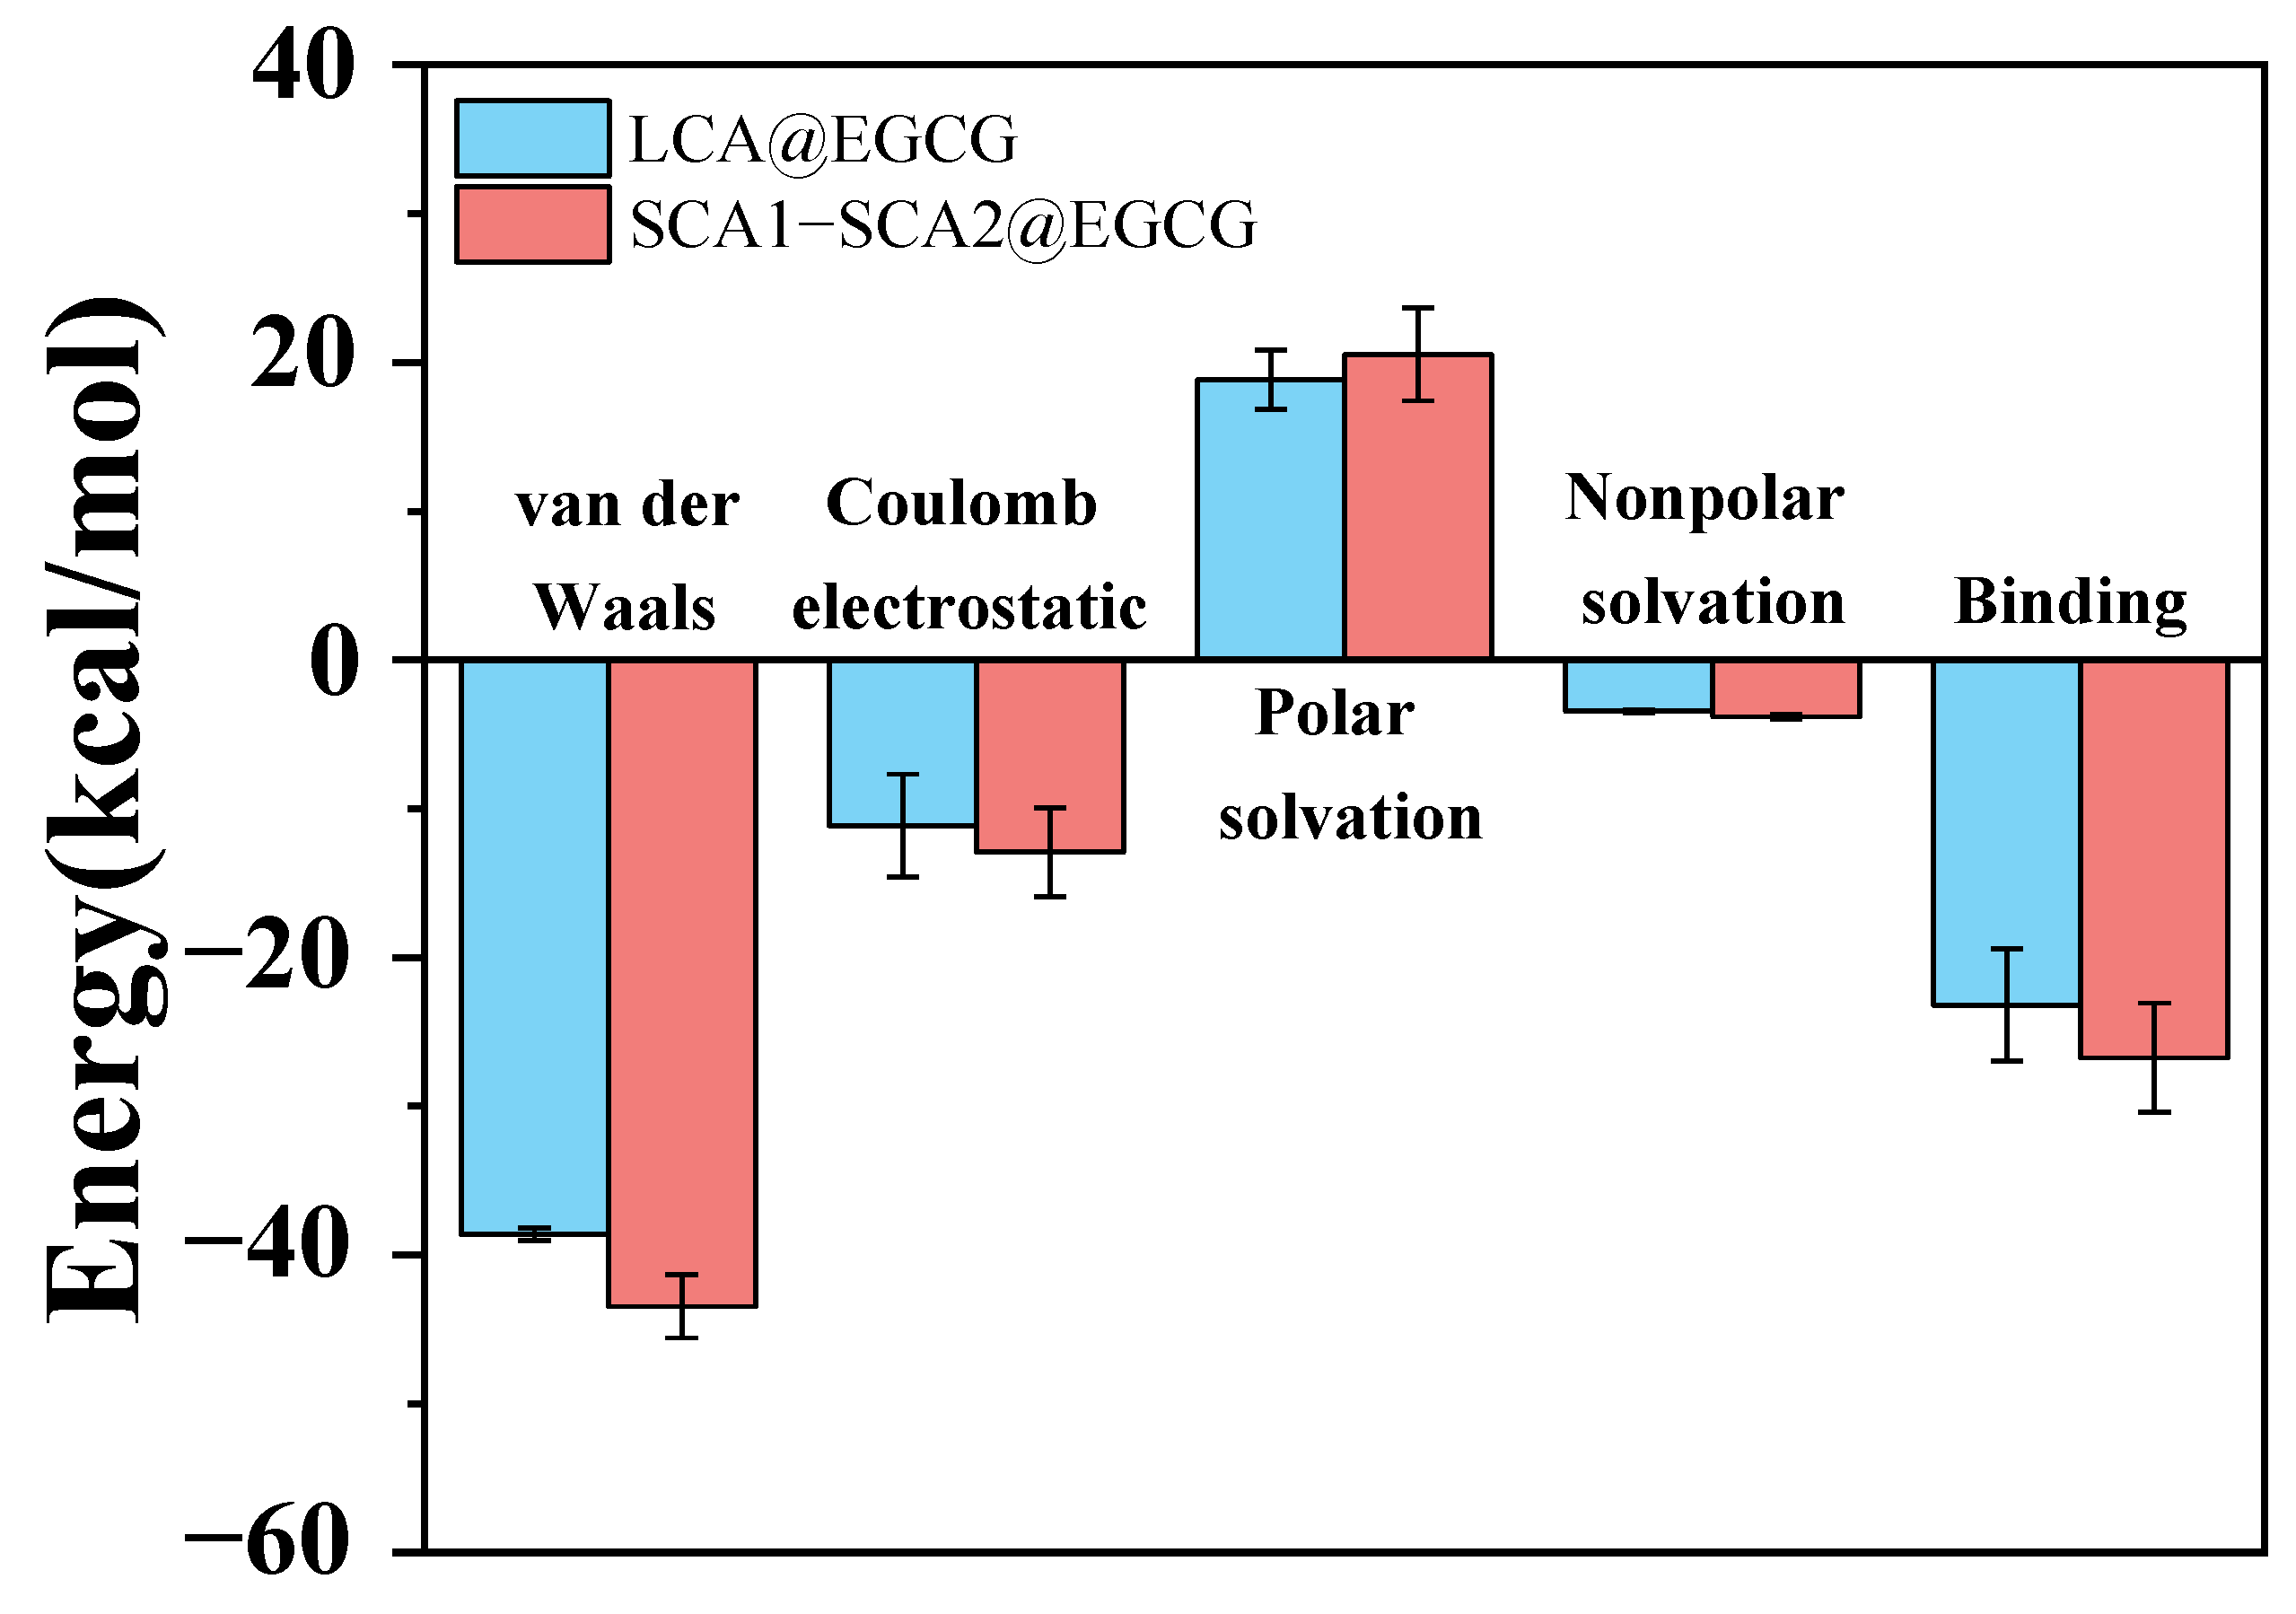
3.12. Energy Contribution Analysis
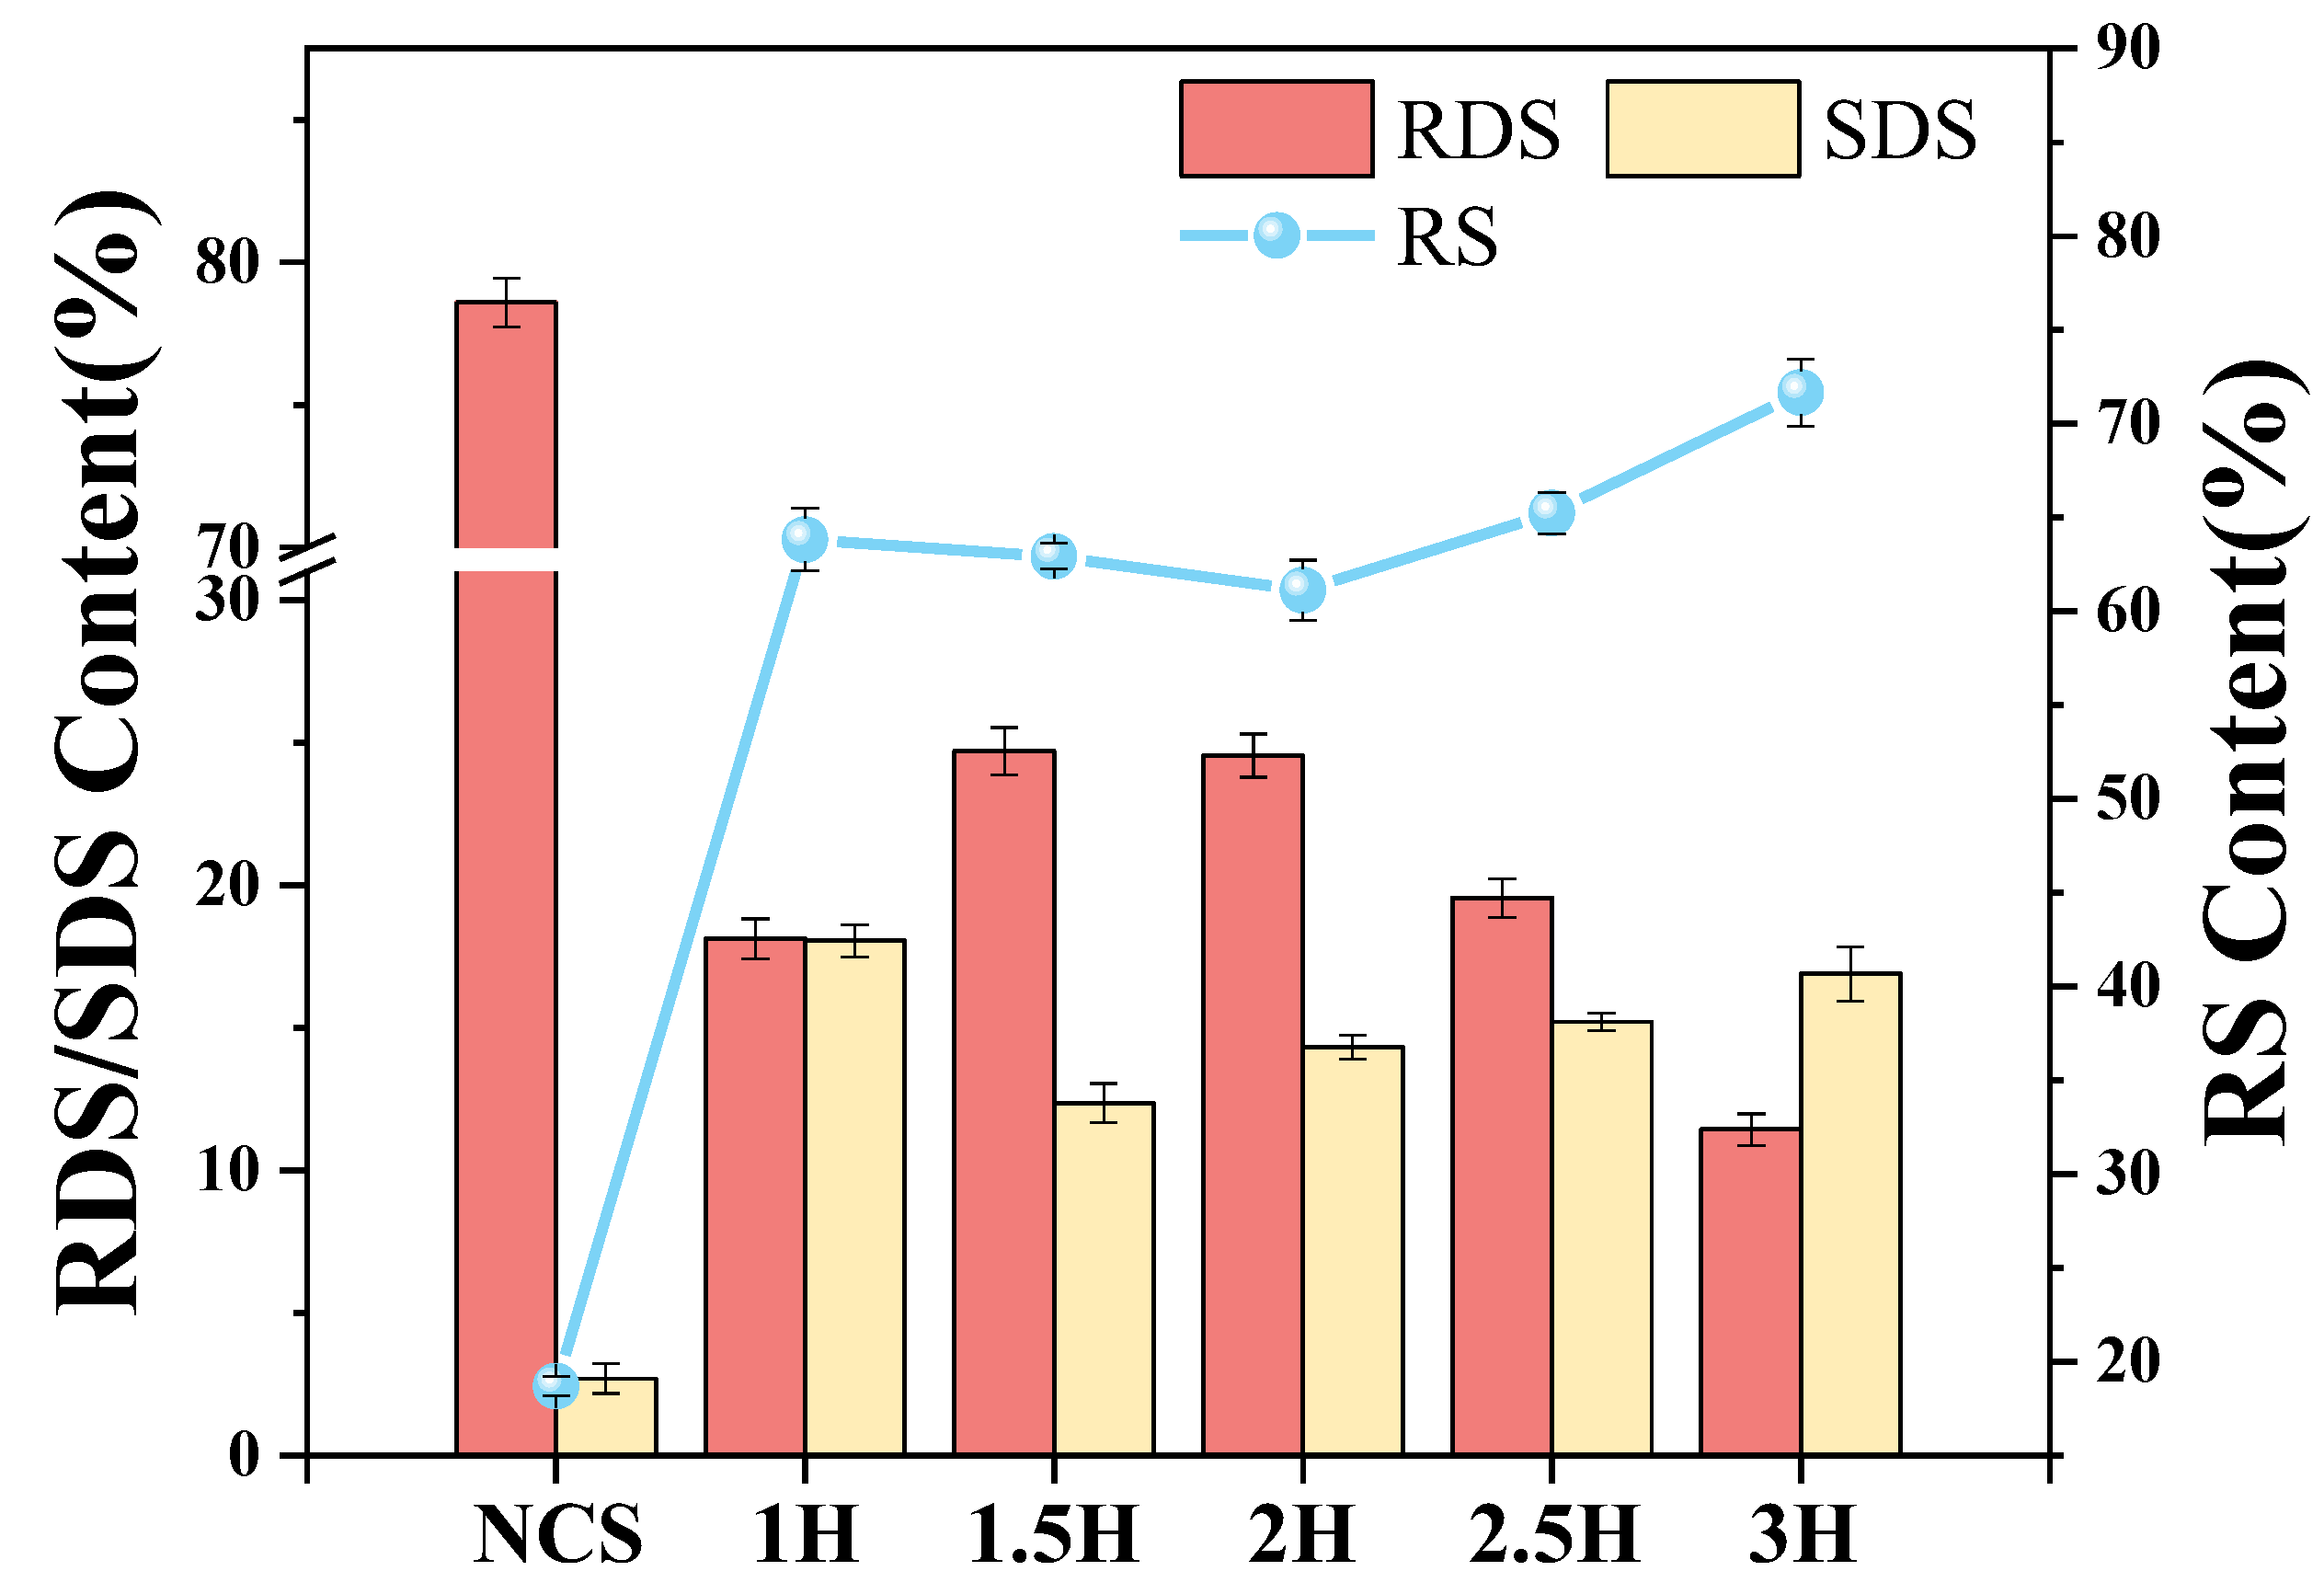
3.13. In Vitro Digestibility of TP–CS Complex
4. Conclusions
Author Contributions
Funding
Data Availability Statement
Conflicts of Interest
References
- Bai, Y.; Zhou, X.; Zhan, C.; Ma, L.; Yuan, Y.; Wu, C.; Chen, M.; Chen, G.; Ni, Q.; Wu, F.; et al. 3D Hierarchical Nano-Flake/Micro-Flower Iron Fluoride with Hydration Water Induced Tunnels for Secondary Lithium Battery Cathodes. Nano Energy 2017, 32, 10–18. [Google Scholar] [CrossRef]
- Wang, L.; Ma, R.; Tian, Y. Quercetin Slow-Release System Delays Starch Digestion via Inhibiting Transporters and Enzymes. Food Chem. 2024, 461, 140855. [Google Scholar] [CrossRef]
- Bodjrenou, D.M.; Li, X.; Lu, X.; Lei, S.; Zheng, B.; Zeng, H. Resistant Starch from Sweet Potatoes: Recent Advancements and Applications in the Food Sector. Int. J. Biol. Macromol. 2023, 225, 13–26. [Google Scholar] [CrossRef]
- Althawab, S.A.; Amoako, D.B.; Annor, G.A.; Awika, J.M. Stability of Starch-Proanthocyanidin Complexes to in-Vitro Amylase Digestion after Hydrothermal Processing. Food Chem. 2023, 421, 136182. [Google Scholar] [CrossRef]
- García-Pérez, P.; Giuberti, G.; Sestili, F.; Lafiandra, D.; Botticella, E.; Lucini, L. The Functional Implications of High-Amylose Wholegrain Wheat Flours: An in Vitro Digestion and Fermentation Approach Combined with Metabolomics. Food Chem. 2023, 418, 135959. [Google Scholar] [CrossRef]
- Zhu, J.; Tao, K.; Prakash, S.; Zhang, C.; Gilbert, R.G.; Liu, Q. Using Starch Structure to Choose Rices with an Optimal Combination of Palatability and Digestibility. Food Hydrocoll. 2023, 141, 108763. [Google Scholar] [CrossRef]
- Sun, L.; Wang, Y.; Miao, M. Inhibition of α-Amylase by Polyphenolic Compounds: Substrate Digestion, Binding Interactions and Nutritional Intervention. Trends Food Sci. Technol. 2020, 104, 190–207. [Google Scholar] [CrossRef]
- Zhu, F. Interactions between Starch and Phenolic Compound. Trends Food Sci. Technol. 2015, 43, 129–143. [Google Scholar] [CrossRef]
- Zeng, X.; Zheng, B.; Xiao, G.; Chen, L. Synergistic Effect of Extrusion and Polyphenol Molecular Interaction on the Short/Long-Term Retrogradation Properties of Chestnut Starch. Carbohydr. Polym. 2022, 276, 118731. [Google Scholar] [CrossRef]
- Li, L.; Gao, J.; Koh, H.S.A.; Zhou, W. Bioaccessibility and Bioavailability of (-)-Epigallocatechin Gallate in the Bread Matrix with Glycemic Reduction. Foods 2023, 12, 30. [Google Scholar] [CrossRef]
- Xu, C.; Zhou, S.; Song, H.; Hu, H.; Yang, Y.; Zhang, X.; Ma, S.; Feng, X.; Pan, Y.; Gong, S.; et al. Green Tea Polyphenols-Derived Hybrid Materials in Manufacturing, Environment, Food and Healthcare. Nano Today 2023, 52, 101990. [Google Scholar] [CrossRef]
- Forester, S.C.; Gu, Y.; Lambert, J.D. Inhibition of Starch Digestion by the Green Tea Polyphenol, (−)-Epigallocatechin-3-Gallate. Mol. Nutr. Food Res. 2012, 56, 1647–1654. [Google Scholar] [CrossRef]
- Barber, E.; Houghton, M.J. Flavonoids as Human Intestinal α-Glucosidase Inhibitors. Foods 2021, 10, 1939. [Google Scholar] [CrossRef]
- Lv, Y.; Zhang, L.; Li, M.; He, X.; Hao, L.; Dai, Y. Physicochemical Properties and Digestibility of Potato Starch Treated by Ball Milling with Tea Polyphenols. Int. J. Biol. Macromol. 2019, 129, 207–213. [Google Scholar] [CrossRef]
- Bangar, S.P.; Singh, A.; Ashogbon, A.O.; Bobade, H. Ball-Milling: A Sustainable and Green Approach for Starch Modification. Int. J. Biol. Macromol. 2023, 237, 124069. [Google Scholar] [CrossRef]
- Li, H.; Wang, N.; Zhang, D.; Wu, J.; Tan, S.; Li, Y.; Zhang, N.; Yang, L.; Wang, X. Comparative Study on the Structure Characterization and Activity of RS5 Made from Canna Edulis Native Starch and High-Amylose Corn Starch. Int. J. Biol. Macromol. 2024, 271, 132340. [Google Scholar] [CrossRef]
- Chen, N.; Feng, Z.J.; Gao, H.X. Effects of Phenols with Different Structure Characteristics on Properties of Potato Starch: Action Rule and Molecular Mechanism. J. Food Process. Preserv. 2022, 46, e16679. [Google Scholar] [CrossRef]
- Xie, Q.; Liu, X.; Liu, H.; Zhang, Y.; Xiao, S.; Ding, W.; Lyu, Q.; Fu, Y.; Wang, X. Insight into the Effect of Garlic Peptides on the Physicochemical and Anti-Staling Properties of Wheat Starch. Int. J. Biol. Macromol. 2023, 229, 363–371. [Google Scholar] [CrossRef]
- Sun, C.; Hu, Y.; Zhu, Z.; He, Z.; Mei, L.; Wang, C.; Xie, Q.; Chen, X.; Du, X. Starch Nanoparticles with Predictable Size Prepared by Alternate Treatments of Ball Milling and Ultrasonication. Int. J. Biol. Macromol. 2024, 272, 132862. [Google Scholar] [CrossRef]
- Kathyayani, D.; Mahesh, B.; Channe Gowda, D.; Sionkowska, A.; Veeranna, S. Investigation of Miscibiliy and Physicochemical Properties of Synthetic Polypeptide with Collagen Blends and Their Wound Healing Characteristics. Int. J. Biol. Macromol. 2023, 246, 125704. [Google Scholar] [CrossRef]
- Pang, Z.; Bourouis, I.; Sun, M.; Cao, J.; Liu, P.; Sun, R.; Chen, C.; Li, H.; Liu, X. Physicochemical Properties and Microstructural Behaviors of Rice Starch/Soy Proteins Mixtures at Different Proportions. Int. J. Biol. Macromol. 2022, 209, 2061–2069. [Google Scholar] [CrossRef]
- Xie, F.; Zhang, H.; Xia, Y.; Ai, L. Effects of Tamarind Seed Polysaccharide on Gelatinization, Rheological, and Structural Properties of Corn Starch with Different Amylose/Amylopectin Ratios. Food Hydrocoll. 2020, 105, 105854. [Google Scholar] [CrossRef]
- Pourfarzad, A.; Yousefi, A.; Ako, K. Steady/Dynamic Rheological Characterization and FTIR Study on Wheat Starch-Sage Seed Gum Blends. Food Hydrocoll. 2021, 111, 106380. [Google Scholar] [CrossRef]
- Zhu, Q.; Tang, J.; Yao, S.; Feng, J.; Mi, B.; Zhu, W.; Chen, Q.; Liu, D.; Xu, E. Controllable Structure of Porous Starch Facilitates Bioactive Encapsulation by Mild Gelatinization. Food Hydrocoll. 2023, 145, 109135. [Google Scholar] [CrossRef]
- Hanwell, M.D.; Curtis, D.E.; Lonie, D.C.; Vandermeersch, T.; Zurek, E.; Hutchison, G.R. Avogadro: An Advanced Semantic Chemical Editor, Visualization, and Analysis Platform. J. Cheminform. 2012, 4, 17. [Google Scholar] [CrossRef]
- Kirschner, K.N.; Yongye, A.B.; Tschampel, S.M.; González-Outeiriño, J.; Daniels, C.R.; Foley, B.L.; Woods, R.J. GLYCAM06: A Generalizable Biomolecular Force Field. Carbohydrates. J. Comput. Chem. 2008, 29, 622–655. [Google Scholar] [CrossRef]
- Englyst, H.N.N.; Kingman, S.M.M.; Cummings, J.H.H. Classification and Measurement of Nutritionally Important Starch Fractions. Eur. J. Clin. Nutr. 1992, 46 (Suppl. S2), S33–S50. [Google Scholar]
- González, L.C.; Loubes, M.A.; Tolaba, M.P. Incidence of Milling Energy on Dry-Milling Attributes of Rice Starch Modified by Planetary Ball Milling. Food Hydrocoll. 2018, 82, 155–163. [Google Scholar] [CrossRef]
- da Cruz, E.P.; Pires, J.B.; dos Santos, F.N.; Fonseca, L.M.; Radünz, M.; Dal Magro, J.; Gandra, E.A.; da Rosa Zavareze, E.; Dias, A.R.G. Encapsulation of Lemongrass Essential Oil into Cassava Starch Fibers for Application as Antifungal Agents in Bread. Food Hydrocoll. 2023, 145, 109105. [Google Scholar] [CrossRef]
- Amaraweera, S.M.; Gunathilake, C.; Gunawardene, O.H.; Fernando, N.M.; Wanninayaka, D.B.; Manamperi, A.; Dassanayake, R.S.; Rajapaksha, S.M.; Gangoda, M.; Fernando, C.A.N.; et al. Preparation and Characterization of Biodegradable Cassava Starch Thin Films for Potential Food Packaging Applications. Cellulose 2021, 28, 10531–10548. [Google Scholar] [CrossRef]
- Wang, J.; Yang, H.; Luo, L.; Ye, H.; Xu, H.; Sun, Y.; Gong, L.; Yang, H. Persimmon Leaf Polyphenols as Potential Ingredients for Modulating Starch Digestibility: Effect of Starch-Polyphenol Interaction. Int. J. Biol. Macromol. 2024, 270, 132524. [Google Scholar] [CrossRef]
- Shen, H.; Yu, J.; Bai, J.; Ge, X.; Liang, W.; Ospankulova, G.; Muratkhan, M.; Zhang, G.; Li, W. Electron Beam Irradiation Regulates the Structure and Functionality of Ball-Milled Corn Starch: The Related Mechanism. Carbohydr. Polym. 2022, 297, 120016. [Google Scholar] [CrossRef]
- Zhang, X.; Wang, C.; Liu, Z.; Xue, Y.; Zhao, Q.; Shen, Q. Four Stages of Multi-Scale Structural Changes in Rice Starch during the Entire High Hydrostatic Pressure Treatment. Food Hydrocoll. 2023, 134, 108012. [Google Scholar] [CrossRef]
- Chen, N.; Wang, Q.; Wang, M.-X.; Li, N.; Briones, A.V.; Cassani, L.; Prieto, M.A.; Carandang, M.B.; Liu, C.; Gu, C.M.; et al. Characterization of the Physicochemical, Thermal and Rheological Properties of Cashew Kernel Starch. Food Chem. X 2022, 15, 100432. [Google Scholar] [CrossRef]
- Park, J.; Choi, H.W.; Park, J.D.; Choi, H.D.; Hong, J.S. Impact of Annealing and Incorporation of Vegetable Oils on Physicochemical and Rheological Properties of Wheat Starch. Int. J. Biol. Macromol. 2024, 282, 137227. [Google Scholar] [CrossRef]
- Xie, S.; Chen, H.; Jiang, X.; Zhou, B.; Guo, Z.; Zeng, H.; Zhang, Y. Structural and Physicochemical Properties of a Chinese Yam Starch–Tea Polyphenol Complex Prepared Using Autoclave-Assisted Pullulanase Treatment. Foods 2023, 12, 3763. [Google Scholar] [CrossRef]
- Romero Hernández, H.A.; Gutiérrez, T.J.; Tovar, J.; Bello-Pérez, L.A. Complexation of Octenyl Succinic Anhydride-Esterified Corn Starch/Polyphenol-Rich Roselle (Hibiscus sabdariffa L.) Extract: Structural and Digestibility Features. Food Hydrocoll. 2023, 145, 109125. [Google Scholar] [CrossRef]
- Wei, Y.; Cheng, F.; Zheng, H. Synthesis and Flocculating Properties of Cationic Starch Derivatives. Carbohydr. Polym. 2008, 74, 673–679. [Google Scholar] [CrossRef]
- Lan, X.; Xie, S.; Wu, J.; Xie, F.; Liu, X.; Wang, Z. Thermal and Enzymatic Degradation Induced Ultrastructure Changes in Canna Starch: Further Insights into Short-Range and Long-Range Structural Orders. Food Hydrocoll. 2016, 58, 335–342. [Google Scholar] [CrossRef]
- Liu, L.; An, X.; Zhang, H.; Lu, Z.; Nie, S.; Cao, H.; Xu, Q.; Liu, H. Ball Milling Pretreatment Facilitating α-Amylase Hydrolysis for Production of Starch-Based Bio-Latex with High Performance. Carbohydr. Polym. 2020, 242, 116384. [Google Scholar] [CrossRef]
- Zhang, H.; Jiang, Y.; Pan, J.; Lv, Y.; Liu, J.; Zhang, S.; Zhu, Y. Effect of Tea Products on the in Vitro Enzymatic Digestibility of Starch. Food Chem. 2018, 243, 345–350. [Google Scholar] [CrossRef]

| Sample | PV (cP) | TV (cP) | BD (cP) | FV (cP) | SB (cP) |
|---|---|---|---|---|---|
| Mixture | 5738.3 ± 17.2 a | 3012.5 ± 26.0 a | 2661.7 ± 24.9 a | 3122.3 ± 25.2 b | 110.7 ± 1.5 c |
| 1H | 3608.2 ± 16.2 b | 2473.3 ± 8.6 b | 1129.3 ± 8.5 b | 3218.0 ± 17.0 a | 748.7 ± 21.5 a |
| 1.5H | 1661.3 ± 16.9 c | 1234.3 ± 12.9 c | 427.0 ± 12.5 c | 1751.0 ± 14.7 c | 526.7 ± 22.3 b |
| 2H | 892.7 ± 13.7 d | 780.3 ± 10.9 d | 115.3 ± 9.0 d | 1105.7 ± 11.1 d | 335.3 ± 19.1 c |
| 2.5H | 289.3 ± 9.1 e | 270.0 ± 7.0 e | 28.3 ± 1.5 e | 402.3 ± 8.0 e | 136.0 ± 4.6 d |
| 3H | 163.3 ± 8.0 f | 157.3 ± 6.8 f | 13.7 ± 2.4 e | 218.3 ± 5.6 f | 88.7 ± 6.1 e |
| Sample | K (Pa·sn) | N | r2 |
|---|---|---|---|
| Mixture | 112.93 ± 4.51 b | 0.35 ± 0.03 d | 0.967 |
| 1H | 133.49 ± 3.28 a | 0.31 ± 0.01 c | 0.995 |
| 1.5H | 47.97 ± 4.58 c | 0.45 ± 0.02 b | 0.997 |
| 2H | 28.67 ± 0.90 d | 0.45 ± 0.04 b | 0.983 |
| 2.5H | 10.64 ± 1.13 e | 0.49 ± 0.01 a | 0.996 |
| 3H | 6.90 ± 0.99 e | 0.47 ± 0.02 ab | 0.988 |
Disclaimer/Publisher’s Note: The statements, opinions and data contained in all publications are solely those of the individual author(s) and contributor(s) and not of MDPI and/or the editor(s). MDPI and/or the editor(s) disclaim responsibility for any injury to people or property resulting from any ideas, methods, instructions or products referred to in the content. |
© 2025 by the authors. Licensee MDPI, Basel, Switzerland. This article is an open access article distributed under the terms and conditions of the Creative Commons Attribution (CC BY) license (https://creativecommons.org/licenses/by/4.0/).
Share and Cite
Wang, Y.; Di, K.; Sun, Y.; Li, X.; Zheng, J.; Zhang, F. An Experimental and Computational Study on the Effects of Ball Milling on the Physicochemical Properties and Digestibility of a Canna Starch/Tea Polyphenol Complex. Foods 2025, 14, 208. https://doi.org/10.3390/foods14020208
Wang Y, Di K, Sun Y, Li X, Zheng J, Zhang F. An Experimental and Computational Study on the Effects of Ball Milling on the Physicochemical Properties and Digestibility of a Canna Starch/Tea Polyphenol Complex. Foods. 2025; 14(2):208. https://doi.org/10.3390/foods14020208
Chicago/Turabian StyleWang, Yizhou, Kejun Di, Ying Sun, Xiaojing Li, Jiong Zheng, and Fusheng Zhang. 2025. "An Experimental and Computational Study on the Effects of Ball Milling on the Physicochemical Properties and Digestibility of a Canna Starch/Tea Polyphenol Complex" Foods 14, no. 2: 208. https://doi.org/10.3390/foods14020208
APA StyleWang, Y., Di, K., Sun, Y., Li, X., Zheng, J., & Zhang, F. (2025). An Experimental and Computational Study on the Effects of Ball Milling on the Physicochemical Properties and Digestibility of a Canna Starch/Tea Polyphenol Complex. Foods, 14(2), 208. https://doi.org/10.3390/foods14020208