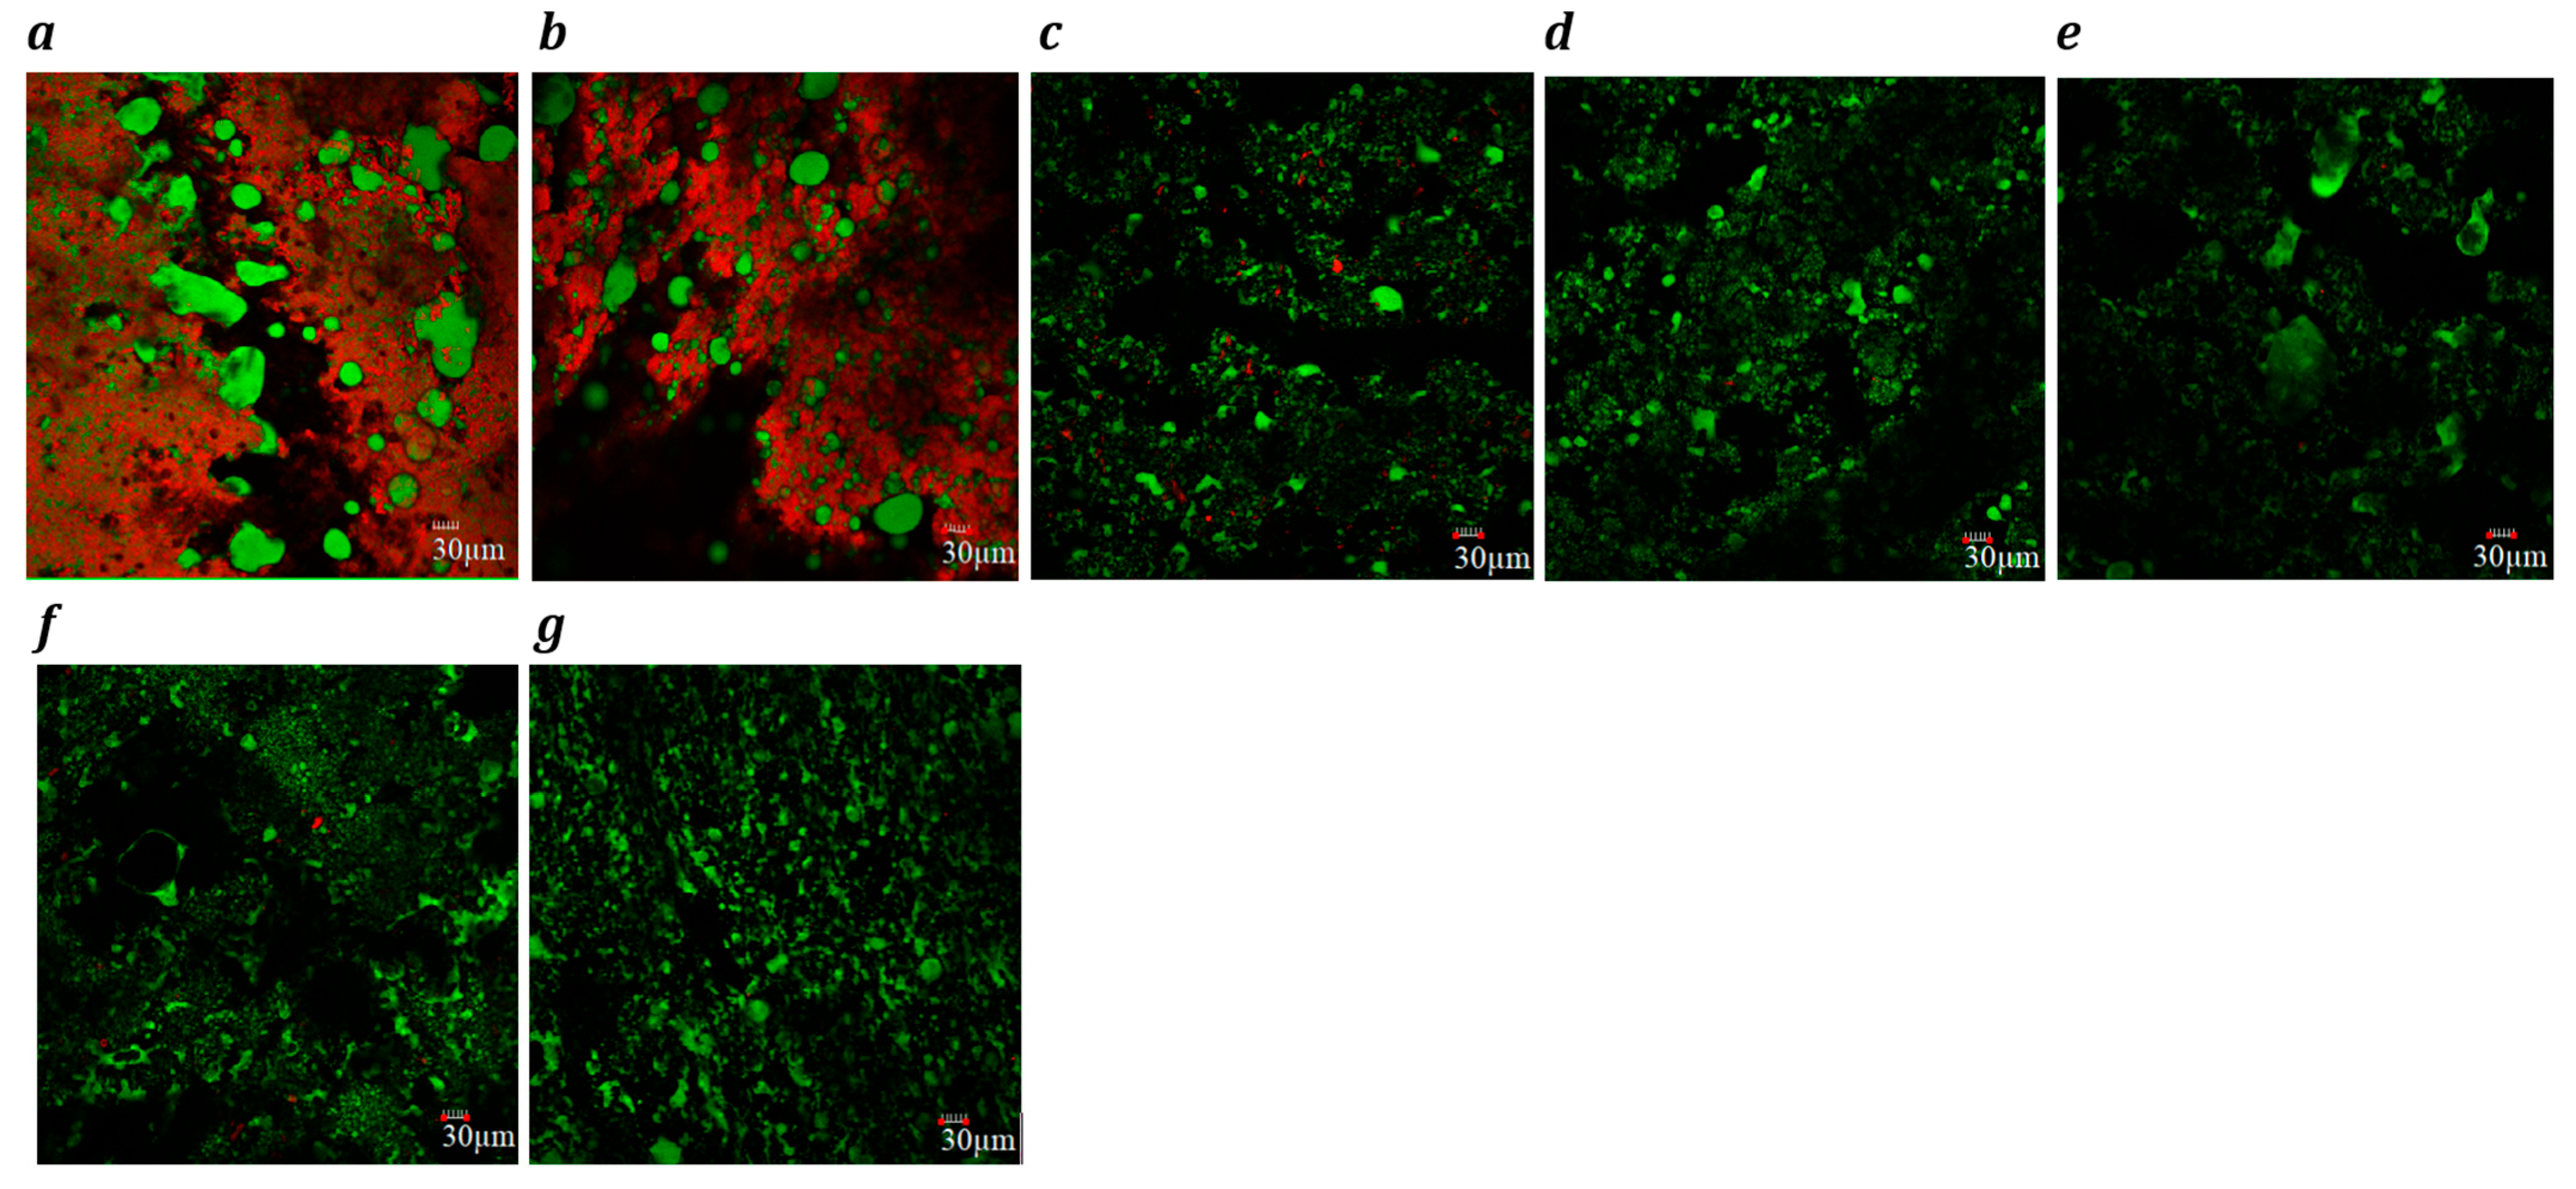
Figure 1.
Confocal laser scanning microscopy images (×20) of block-style cheddar (a) processed (b), Plant 1 (c), Plant 2 (d), Plant 3 (e), Plant 4 (f) and Plant 5 (g) products. Fat globules are stained green, and protein is stained red. Each image includes a 30 µm scale bar.
Figure 1.
Confocal laser scanning microscopy images (×20) of block-style cheddar (a) processed (b), Plant 1 (c), Plant 2 (d), Plant 3 (e), Plant 4 (f) and Plant 5 (g) products. Fat globules are stained green, and protein is stained red. Each image includes a 30 µm scale bar.
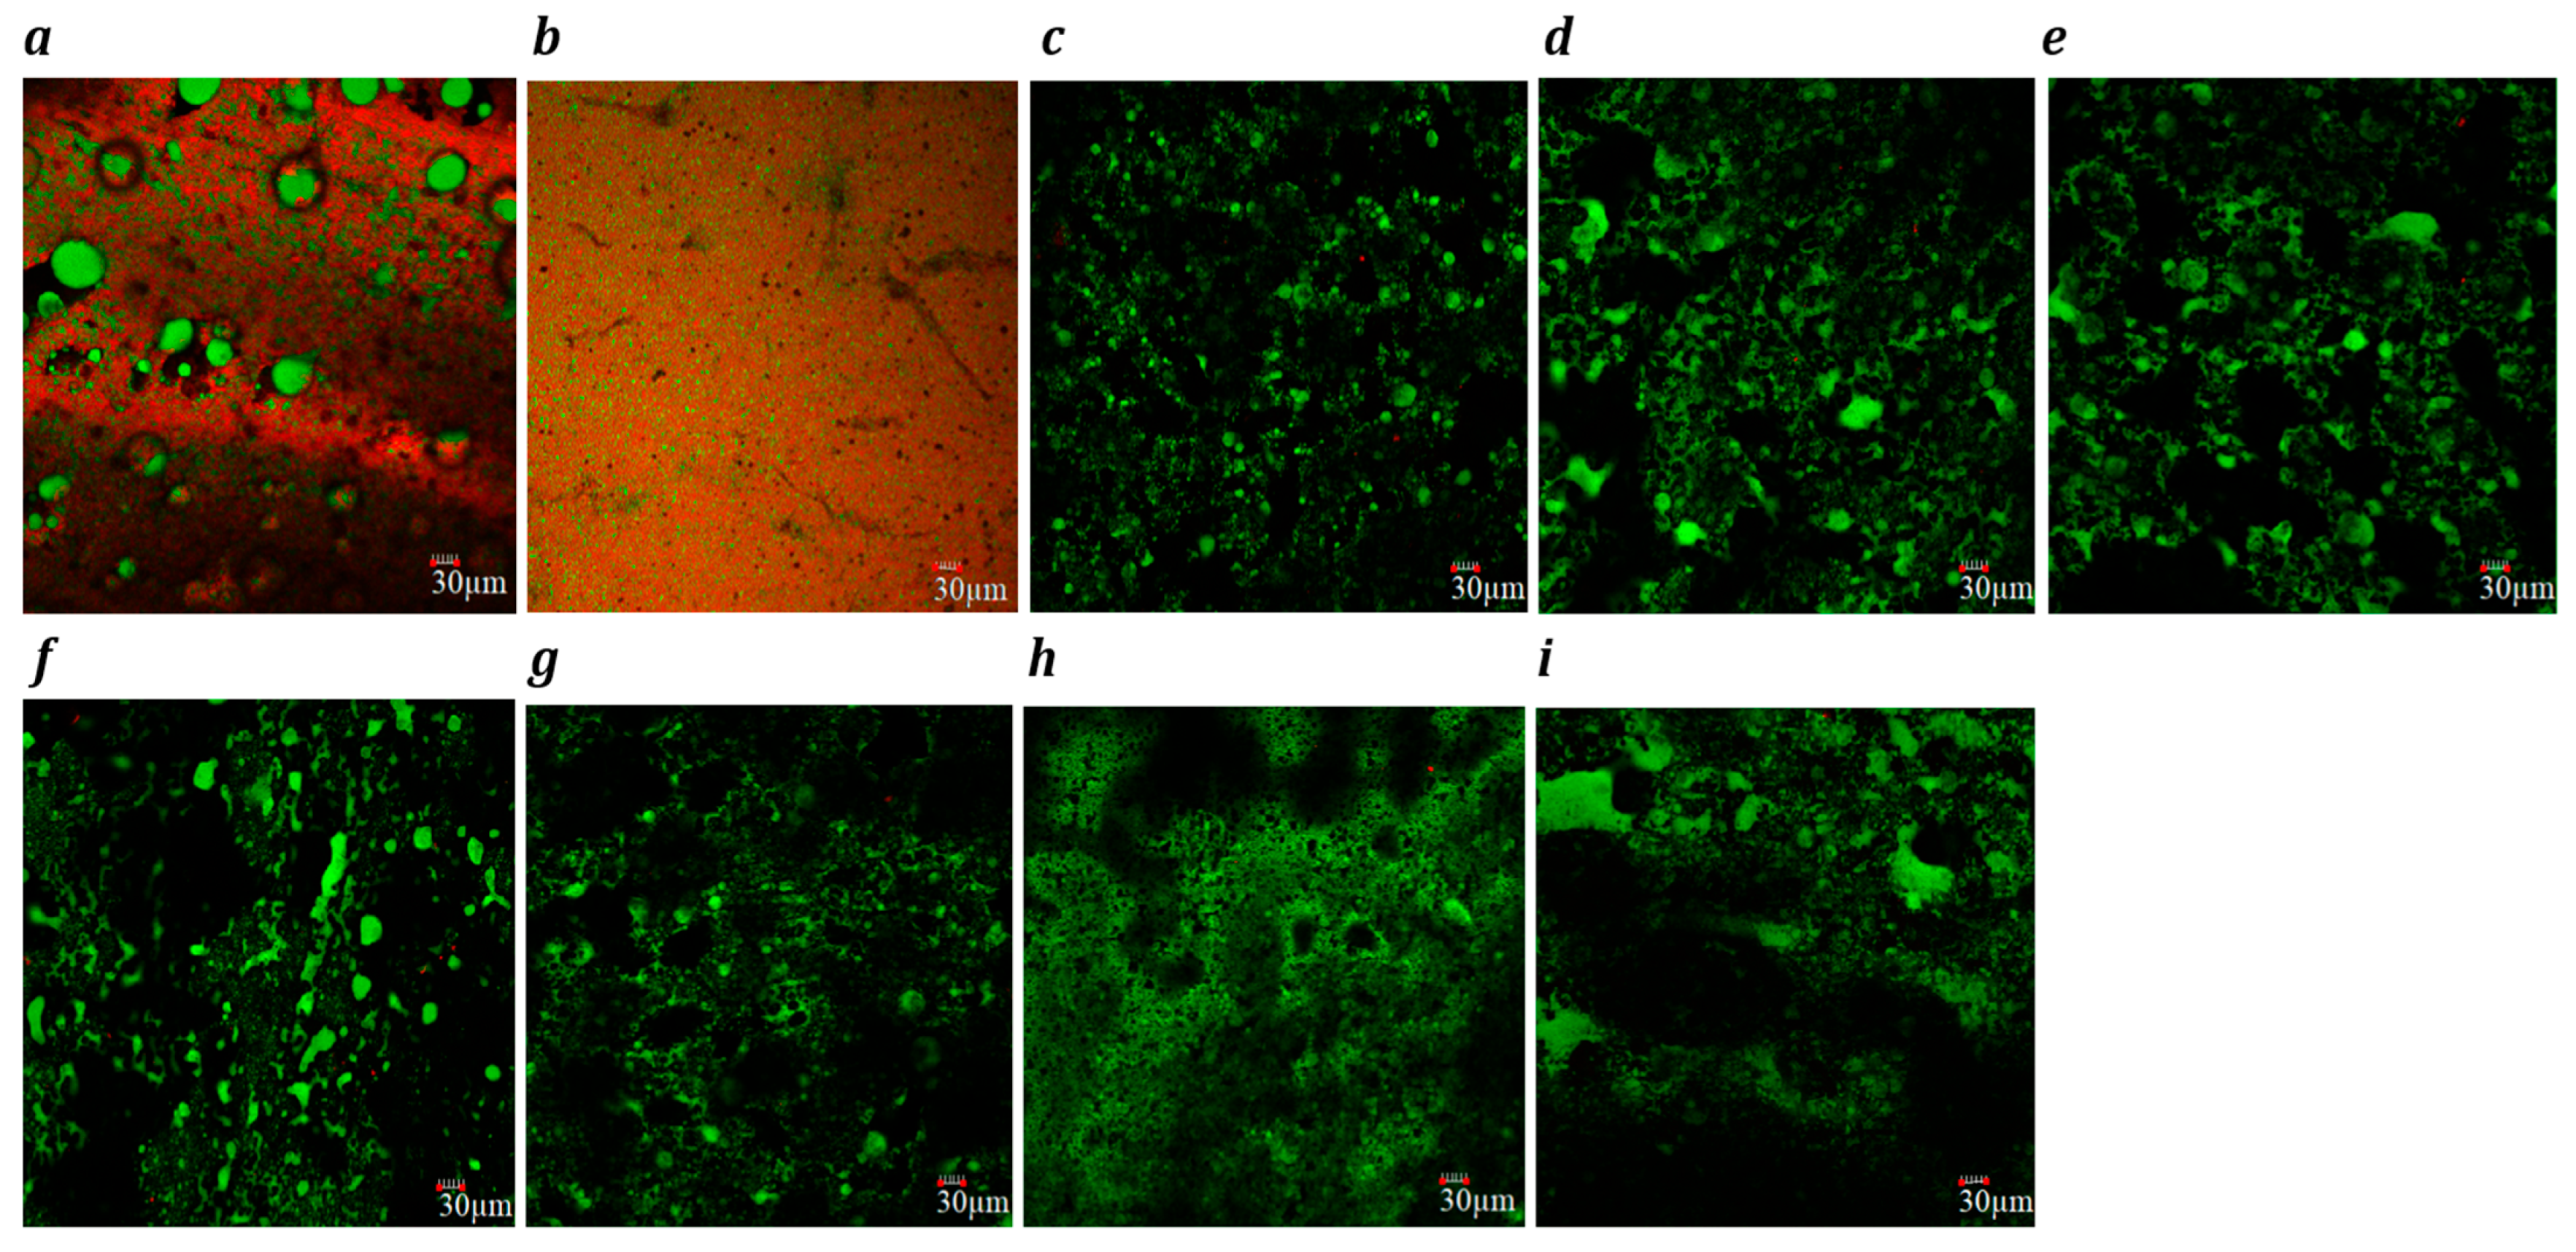
Figure 2.
Confocal laser scanning microscopy images (×20) of slice-style cheddar, (a) processed (b), Plant 1 (c), Plant 2 (d), Plant 3 (e), Plant 4 (f), Plant 5 (g), Plant 6 (h) and Plant 7 (i) products. Fat globules are stained green, and protein is stained red. Each image includes a 30 µm scale bar.
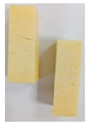
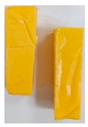
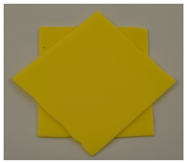
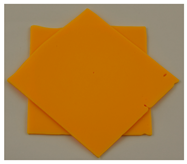
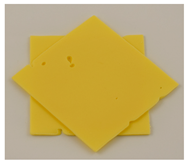
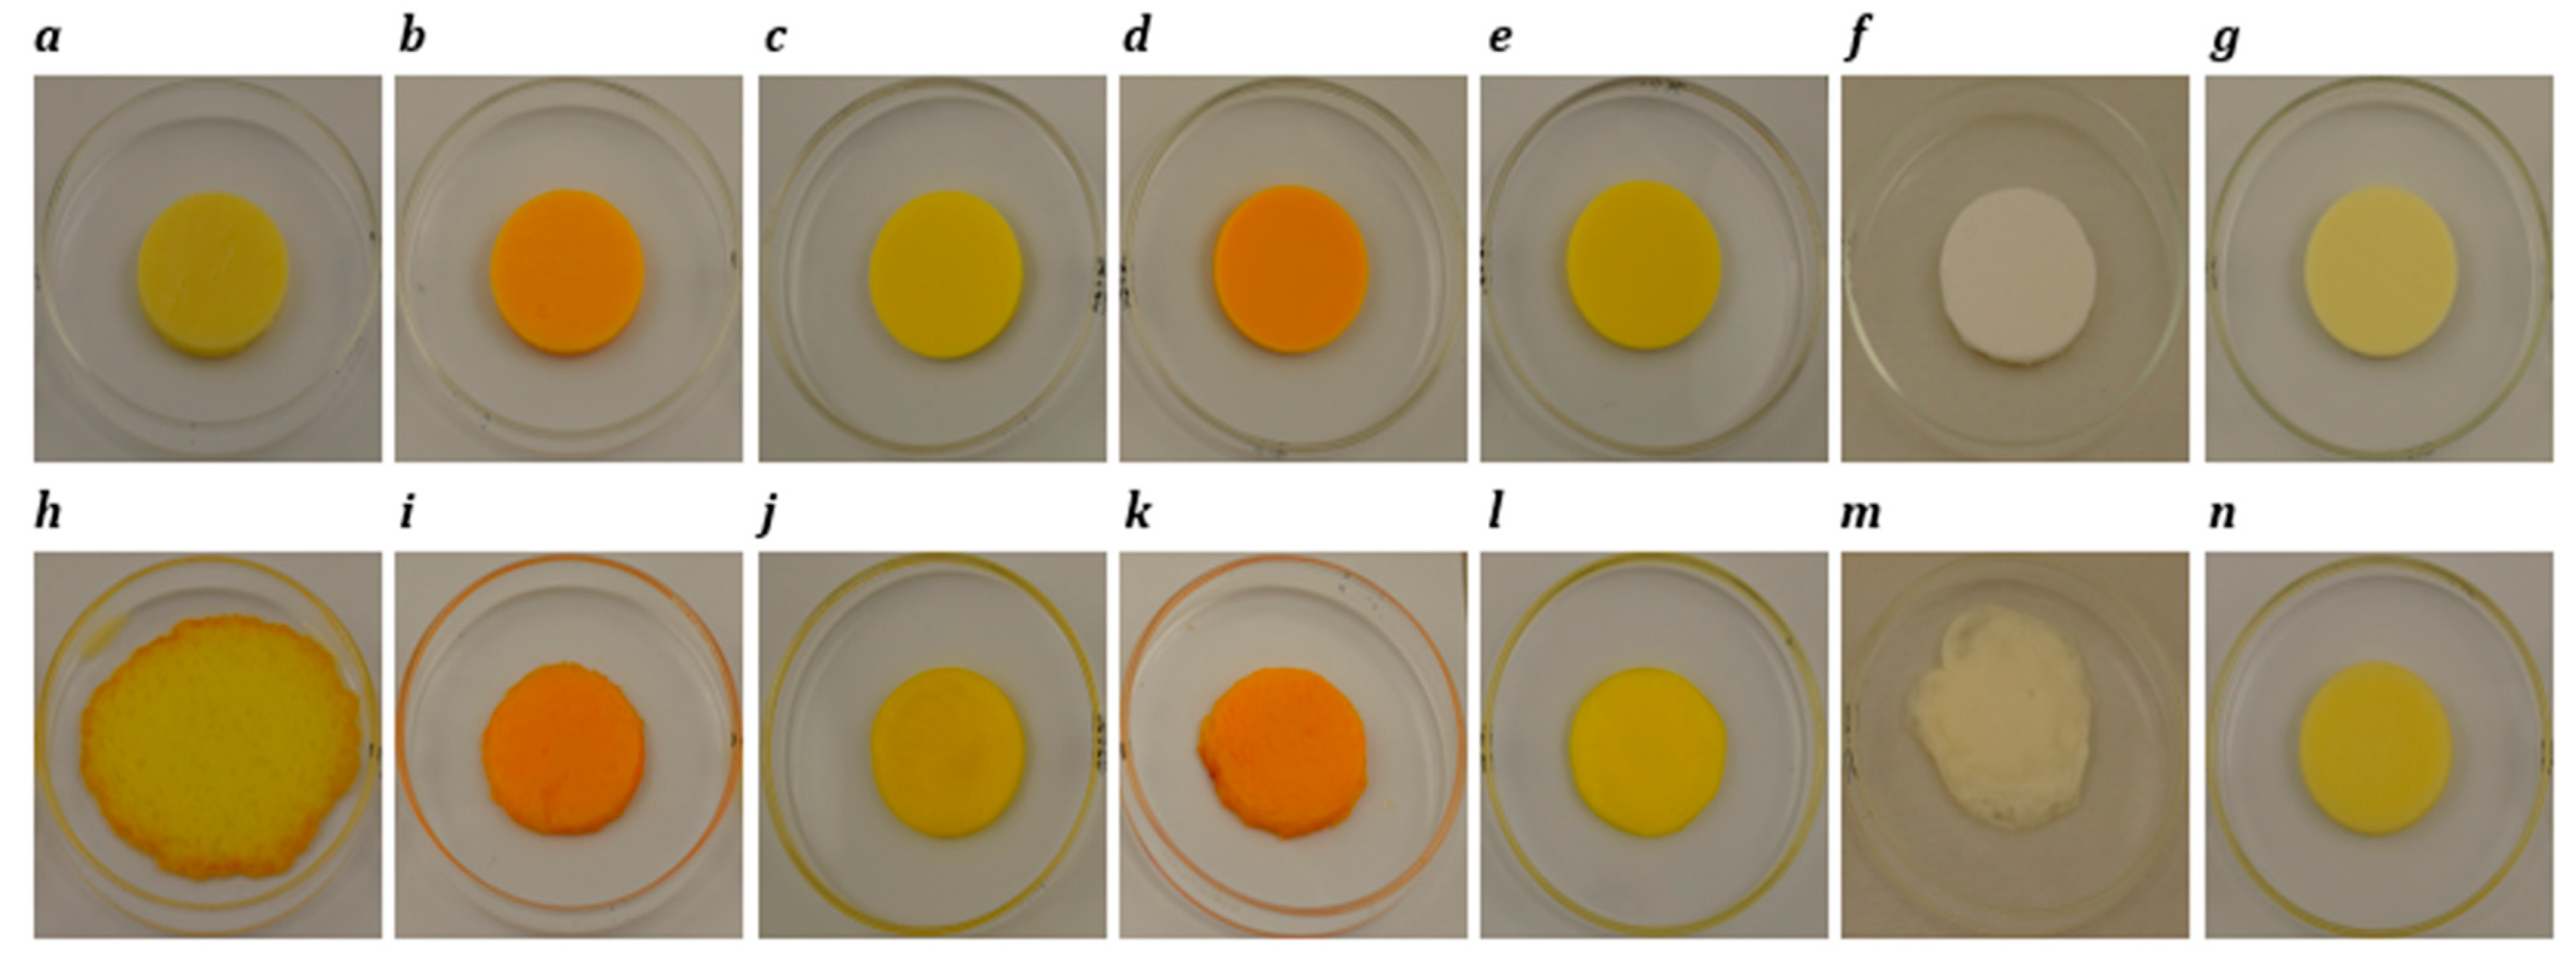
Figure 3.
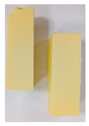
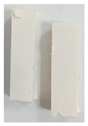
Photographs of block-style cheddar, processed, Plant 1, Plant 2, Plant 3, Plant 4 and Plant 5 products before (a–g) and after (h–n) oven-melting at 232 °C for 5 min.
Figure 3.
Photographs of block-style cheddar, processed, Plant 1, Plant 2, Plant 3, Plant 4 and Plant 5 products before (a–g) and after (h–n) oven-melting at 232 °C for 5 min.
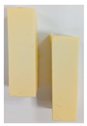
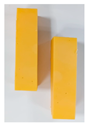
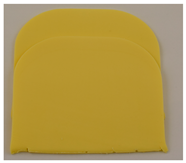
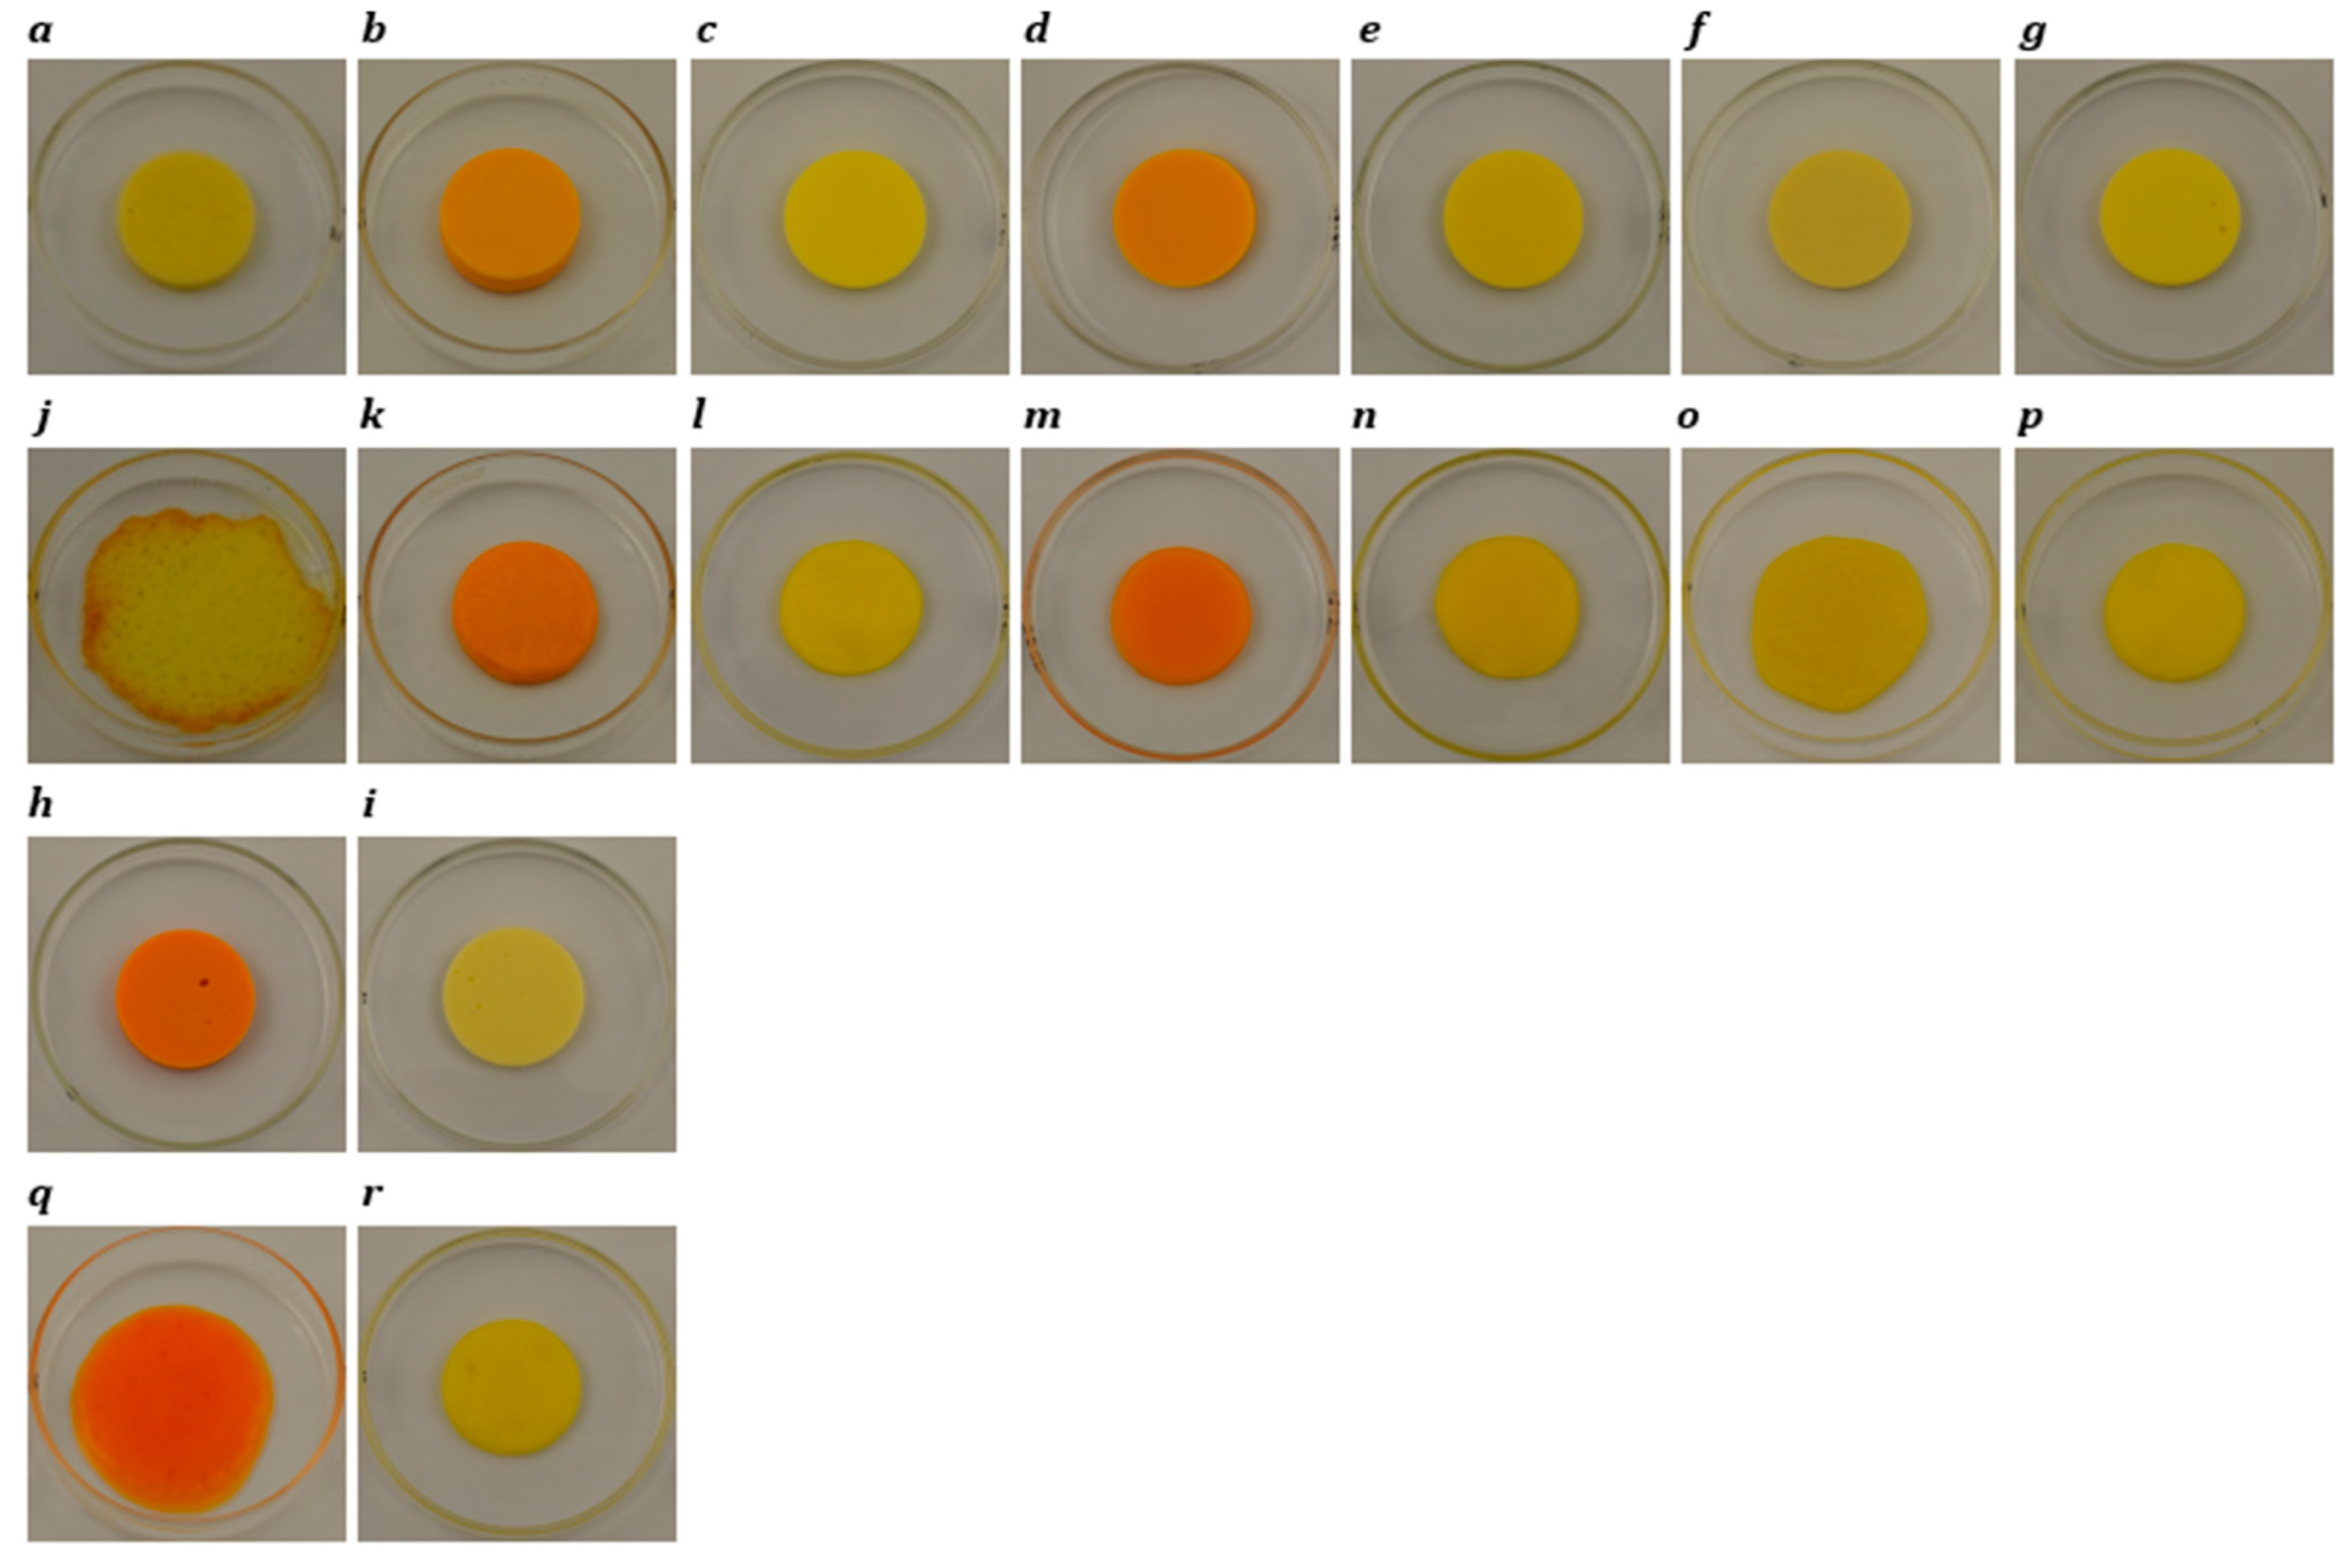
Figure 4.
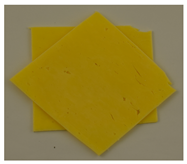
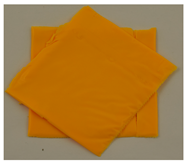
Photographs of slice-style cheddar, processed, Plant 1, Plant 2, Plant 3, Plant 4, Plant 5, Plant 6, and Plant 7 products before (a–i) and after (j–r) oven-melting at 232 °C for 5 min.
Figure 4.
Photographs of slice-style cheddar, processed, Plant 1, Plant 2, Plant 3, Plant 4, Plant 5, Plant 6, and Plant 7 products before (a–i) and after (j–r) oven-melting at 232 °C for 5 min.
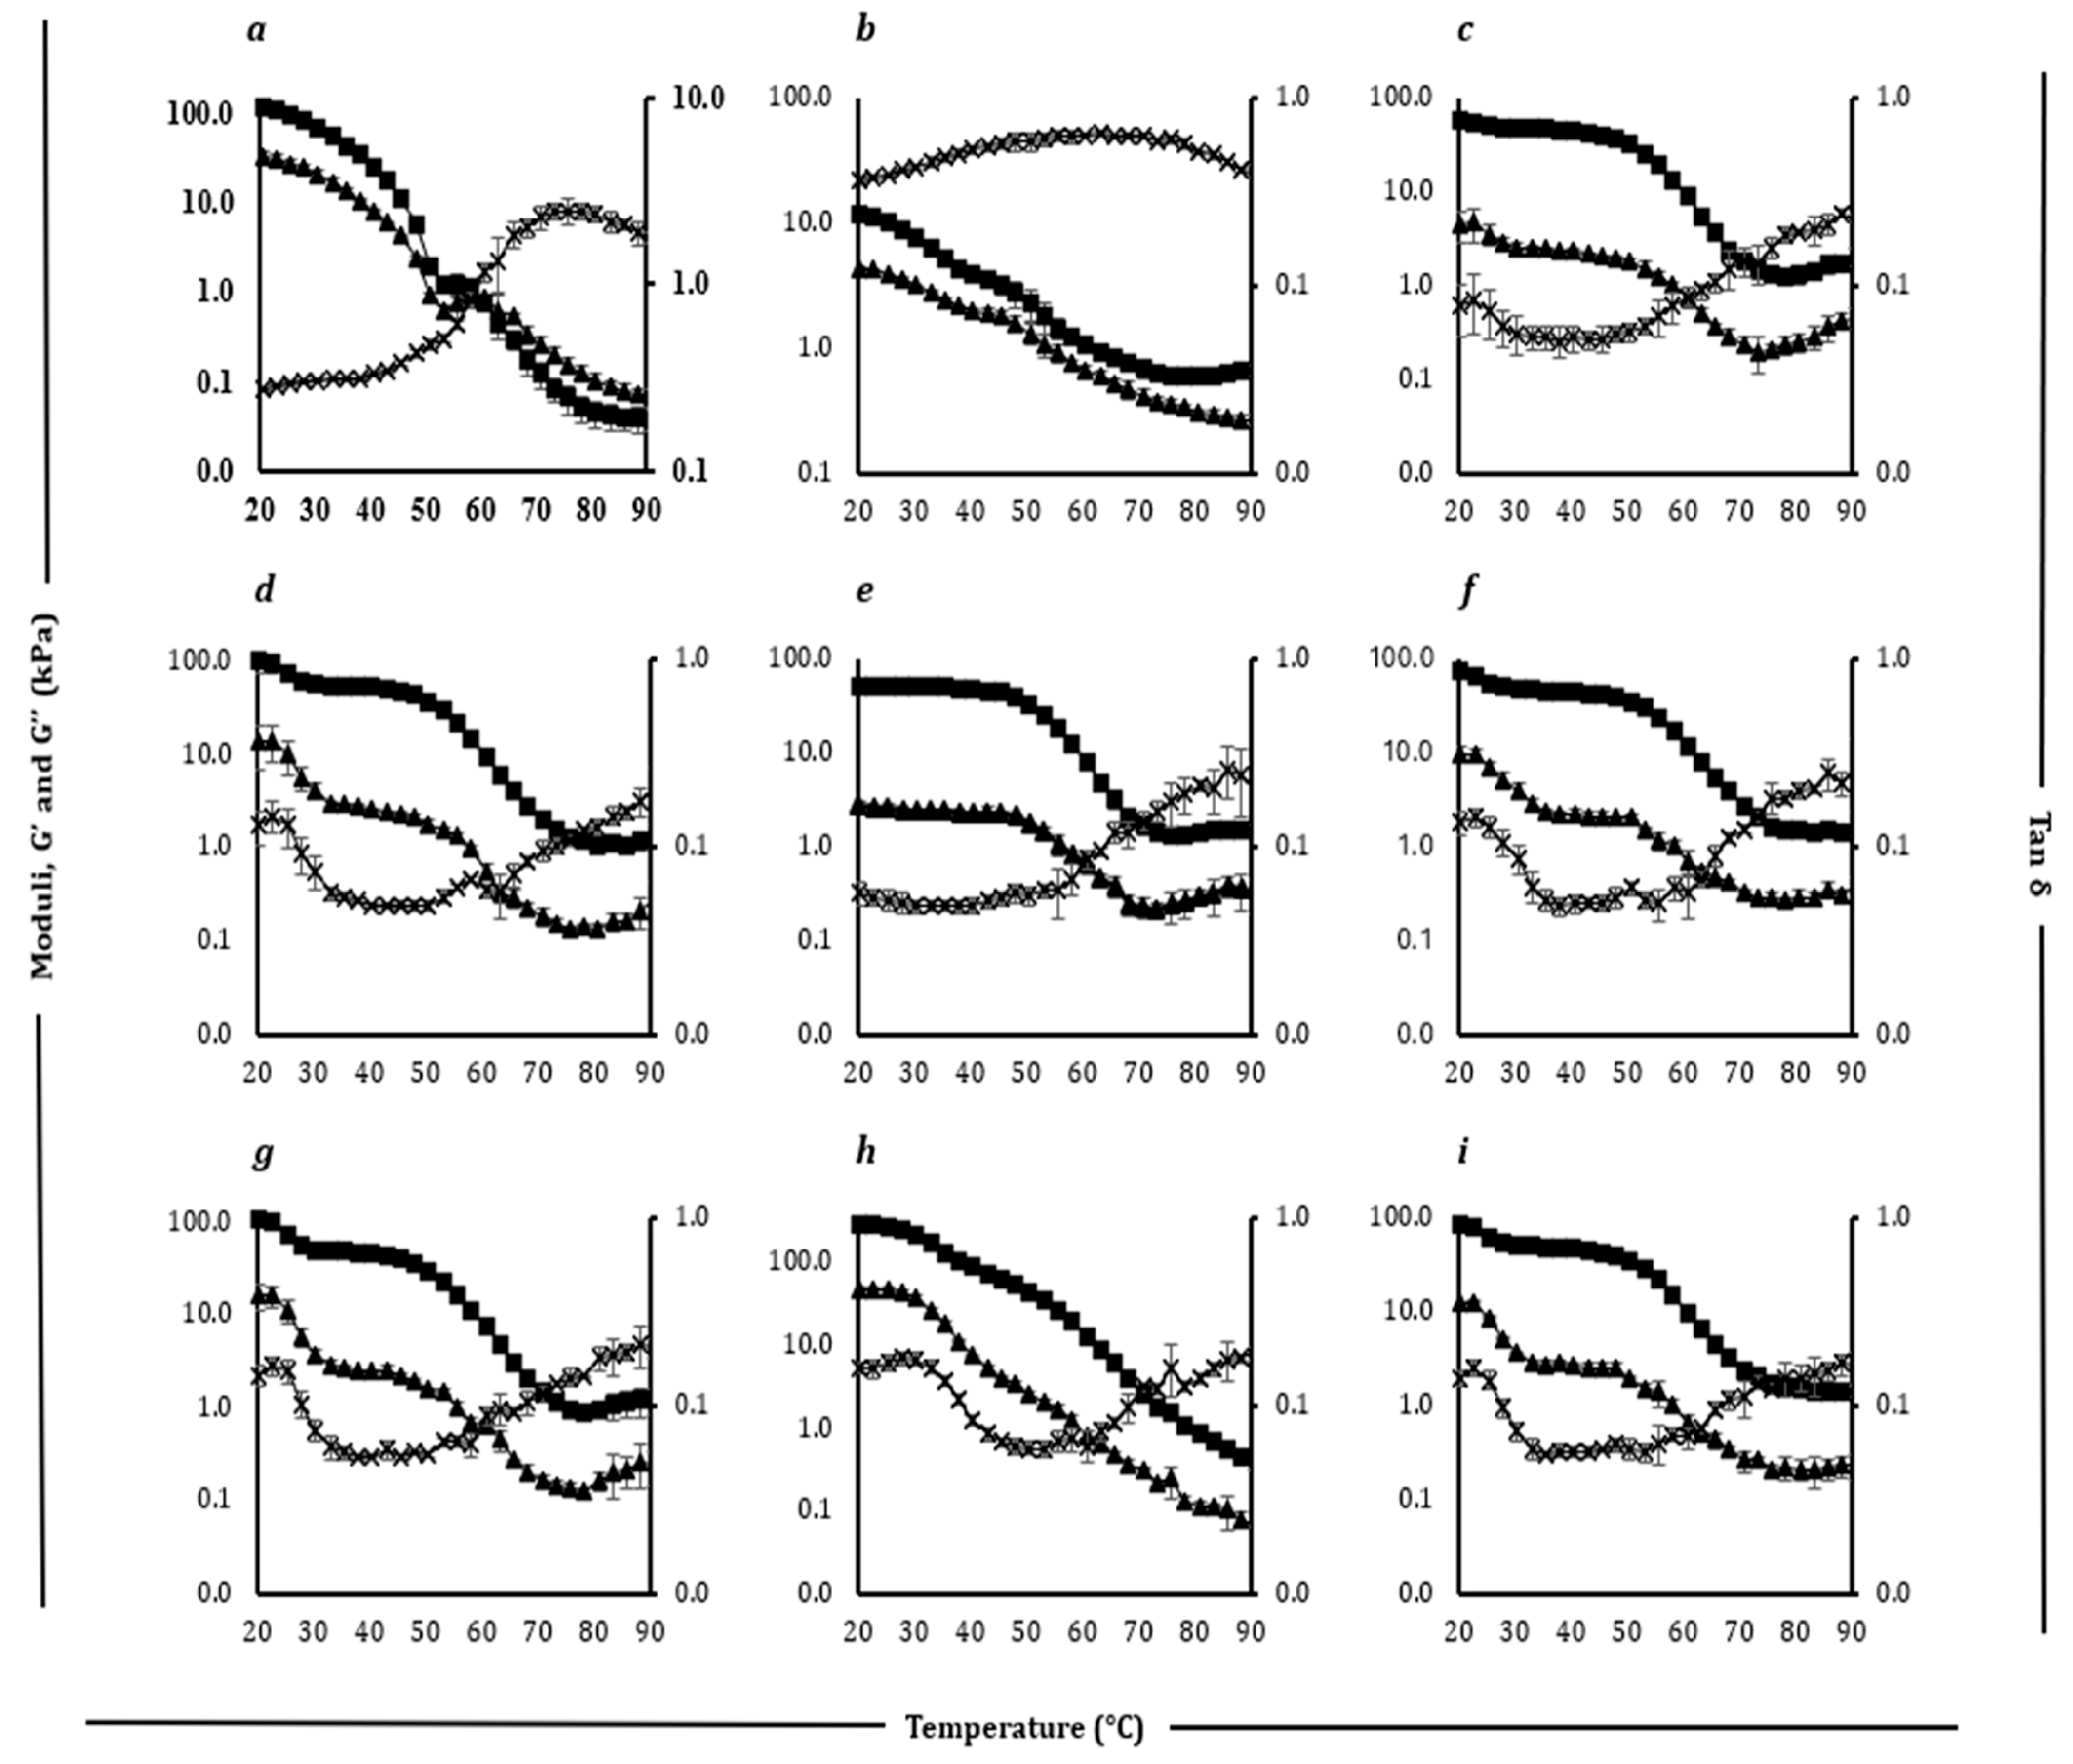
Figure 5.
Rheological profiles showing storage modulus (G′) (filled square), loss modulus (G″) (filled triangle), and loss tangent (Tan δ) (cross) as a function of temperature (20–90 °C) for block style cheddar (a), processed (b), Plant 1 (c), Plant 2 (d), Plant 3 (e), Plant 4 (f), and Plant 5 (g) products.
Figure 6.
Rheological profiles showing storage modulus (G′) (filled square), loss modulus (G″) (filled triangle), and loss tangent (Tan δ) (cross) as a function of temperature (20–90 °C) for slice-style cheddar (a), processed (b), Plant 1 (c), Plant 2 (d), Plant 3 (e), Plant 4 (f), Plant 5 (g), Plant 6 (h), and Plant 7 (i) products.
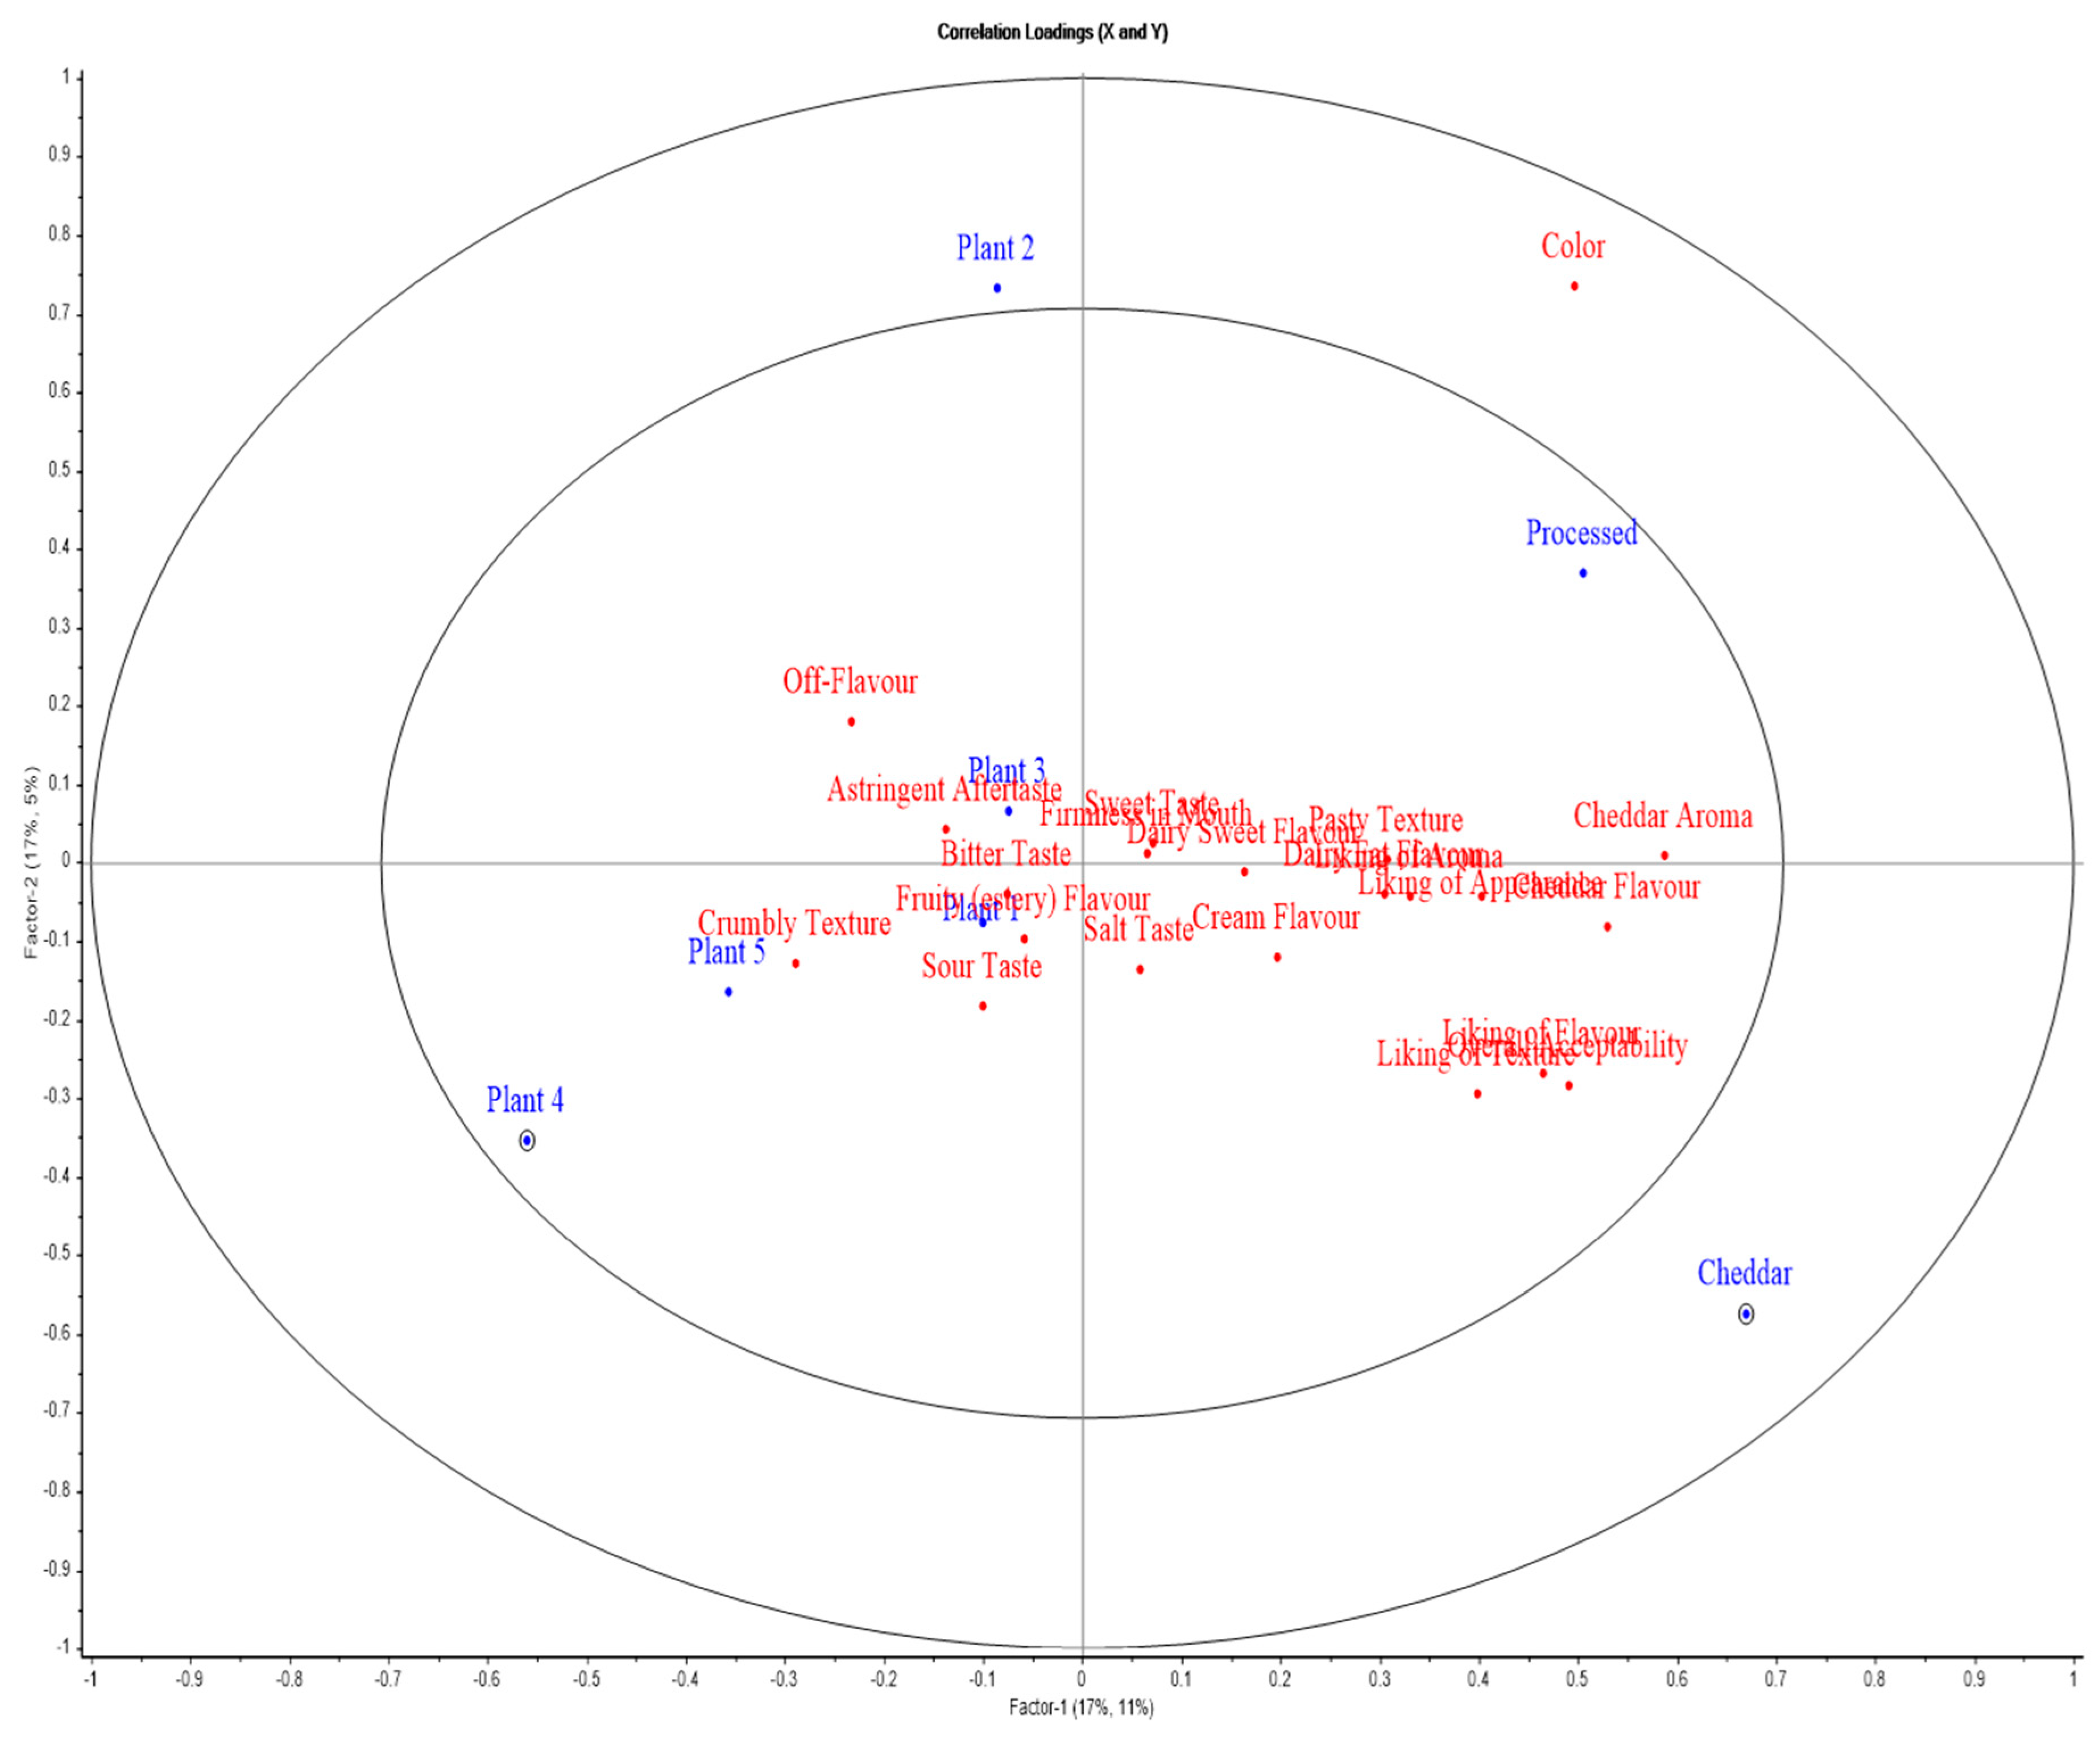
Figure 7.
APLSR graph for sensory evaluation of block-style products. Plotted are cheese variants (blue) versus sensory (hedonic and descriptive) attributes (red).
Figure 7.
APLSR graph for sensory evaluation of block-style products. Plotted are cheese variants (blue) versus sensory (hedonic and descriptive) attributes (red).
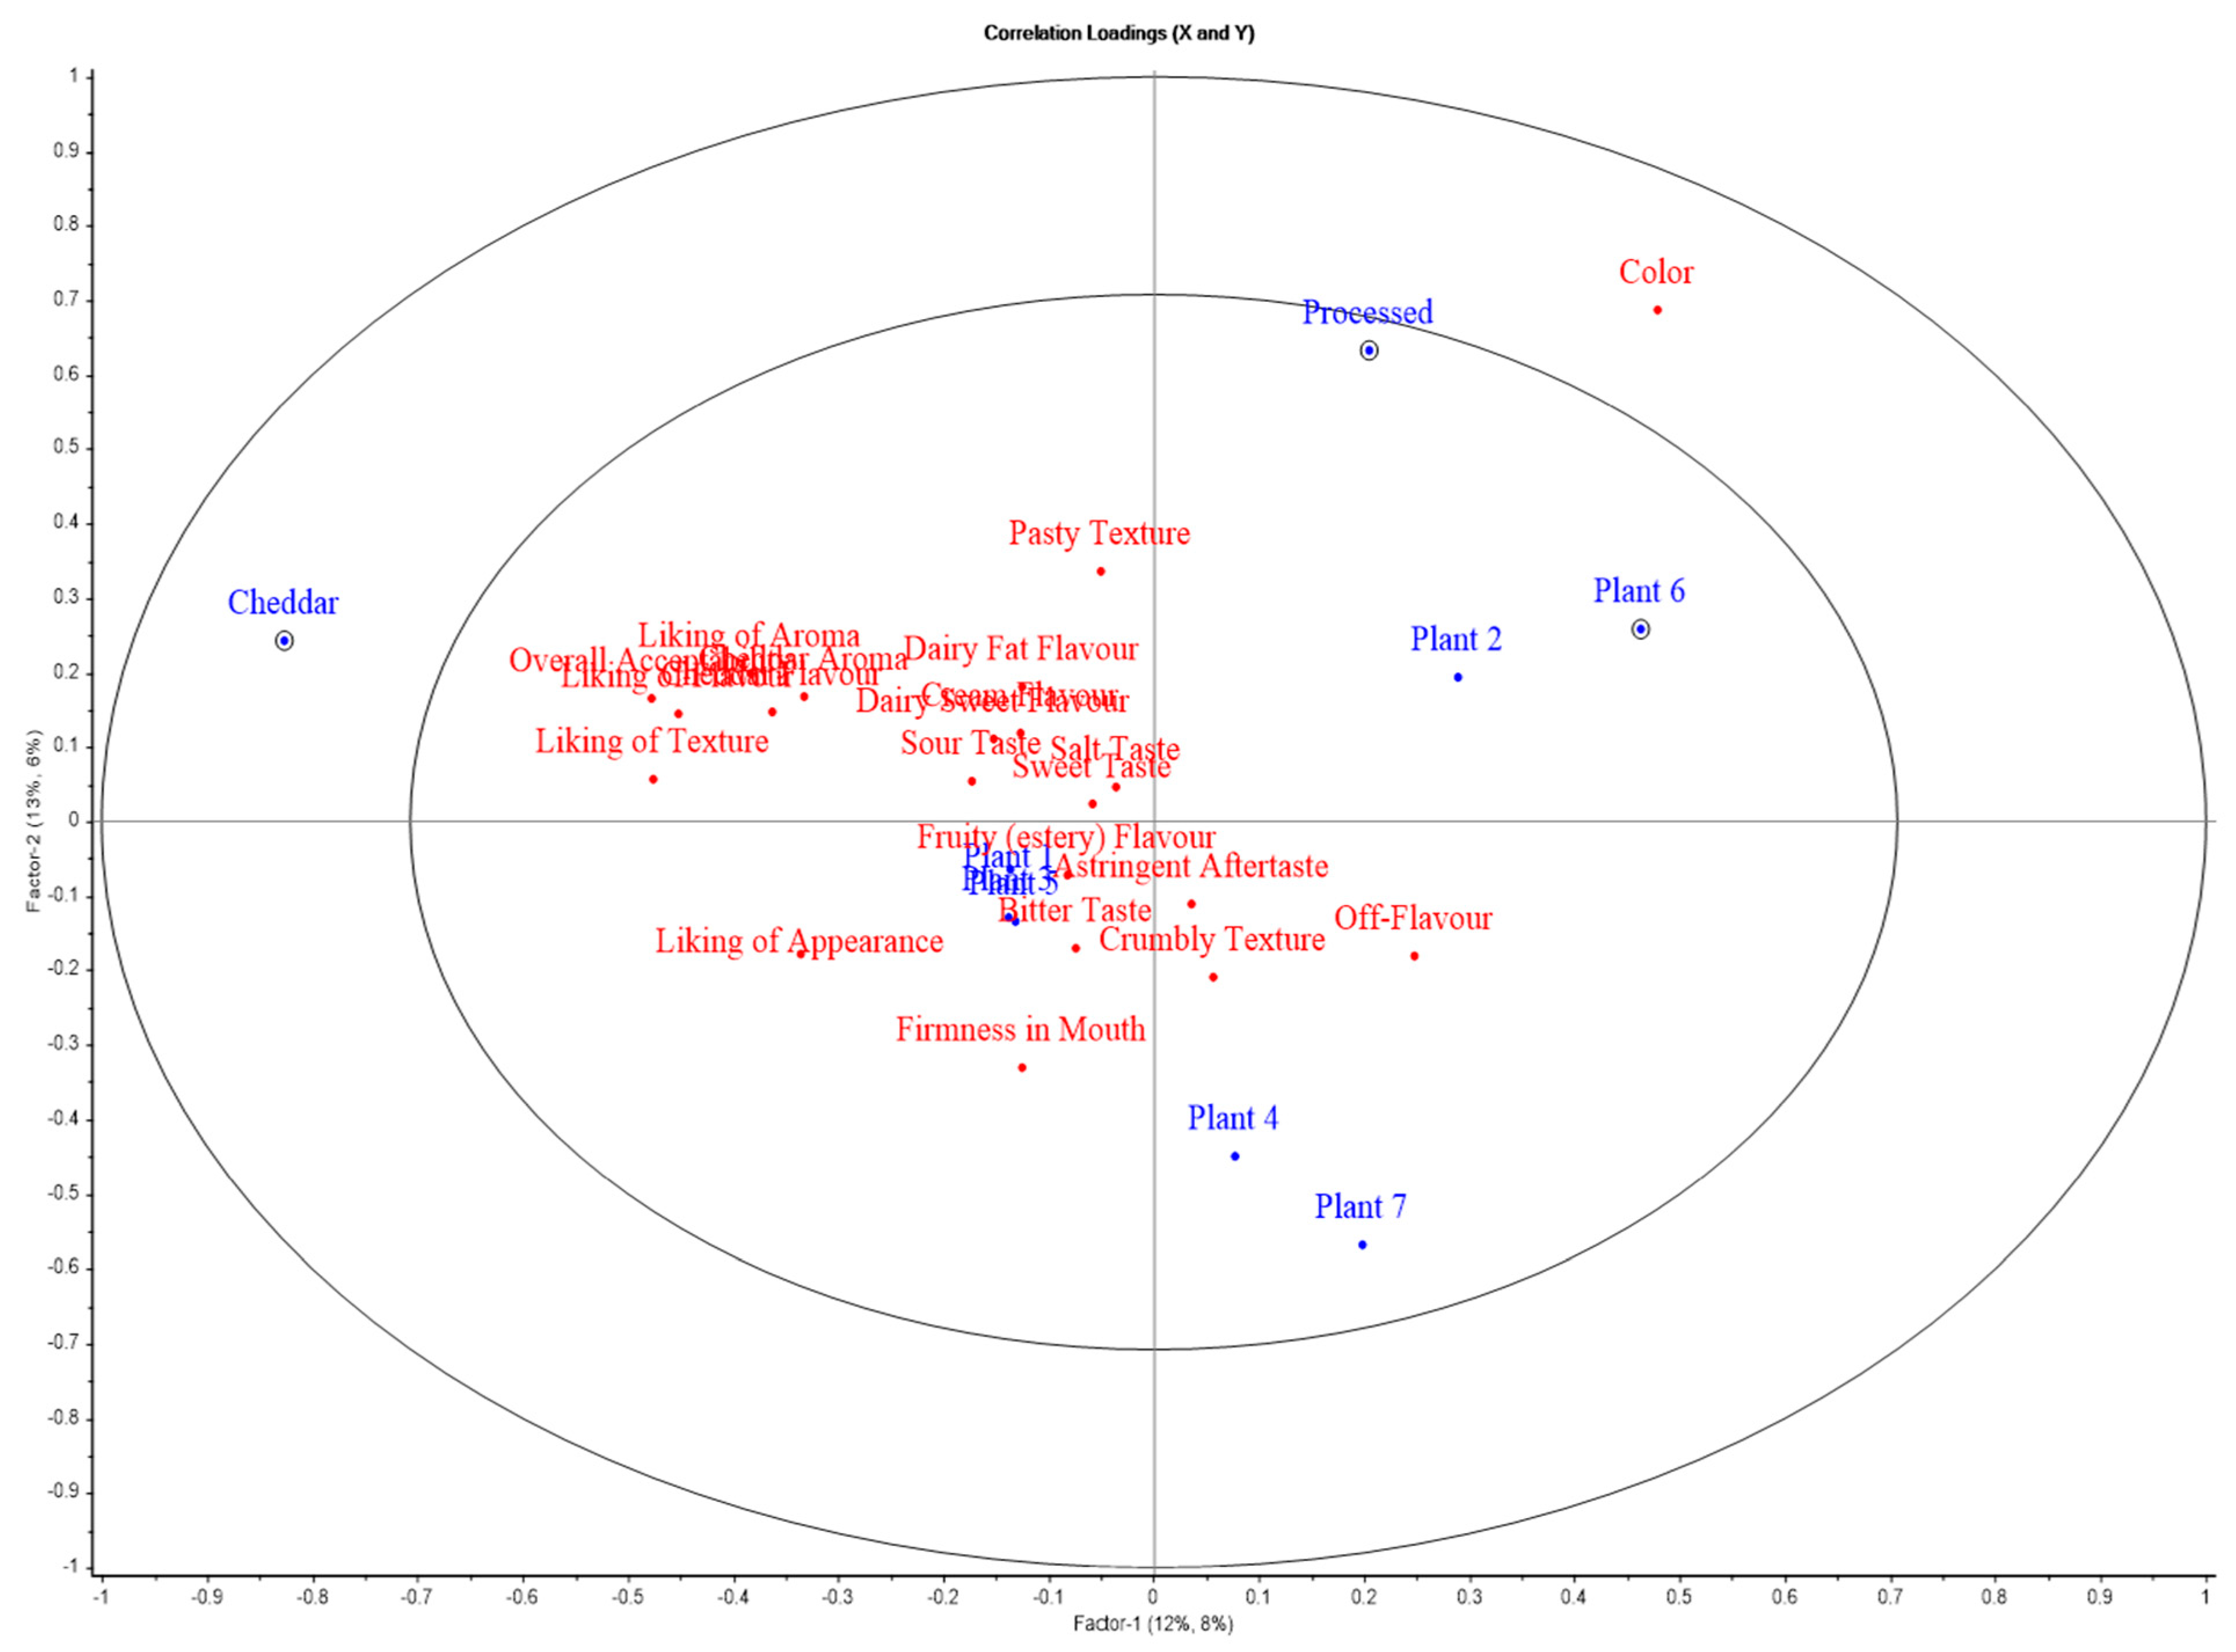
Figure 8.
APLSR graph for sensory evaluation of slice-style products. Plotted are cheese variants (blue) versus sensory (hedonic and descriptive) attributes (red).
Figure 8.
APLSR graph for sensory evaluation of slice-style products. Plotted are cheese variants (blue) versus sensory (hedonic and descriptive) attributes (red).
Table 1.
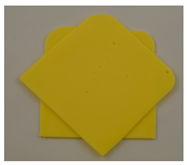
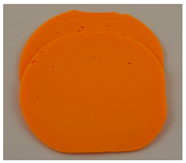
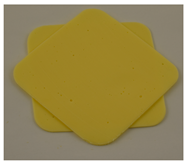
List of ingredients and images for block-style products.
Table 1.
List of ingredients and images for block-style products.
| Products | Ingredients | Pictures |
|---|
| Cheddar | Milk, salt, and rennet | ![Foods 14 02701 i001]() |
| Processed | Cheese (60 g/100 g), modified maize starch, water, whey powder (milk), vegetable oils (coconut, palm), milk protein, tri-calcium phosphate, emulsifying salts (sodium phosphates, sodium polyphosphate), colour (paprika, carotene), acidity regulator (citric acid) | ![Foods 14 02701 i002]() |
| Plant 1 | Water, coconut oil (24 g/100 g), modified starch, starch, sea salt, lentil protein, cheddar flavour, acidity regulator (lactic acid), olive extract, colour (beta-carotene), vitamin B12 | ![Foods 14 02701 i003]() |
| Plant 2 | Water, modified starch, coconut oil (21 g/100 g), sea salt, starch, cheddar flavour, olive extract, vitamin B12, colour (beta-carotene, paprika extract) | ![Foods 14 02701 i004]() |
| Plant 3 | Water, modified maize starch, coconut oil (24 g/100 g), maize starch, modified potato starch, sea salt, modified tapioca starch, flavouring, vitamin B12, olive extract, colour (carotenes) | ![Foods 14 02701 i005]() |
| Plant 4 | Water, potato protein, coconut oil (25 g/100 g) (non-hydrogenated), starch, sea salt, vegan flavourings, acidity regulator (lactic acid) (non-dairy), olive extract, vitamin B12 | ![Foods 14 02701 i006]() |
| Plant 5 | Water, coconut oil (24 g/100 g) (non-hydrogenated), modified starch, starch, tapioca maltodextrin, sea salt, vegan natural flavourings, olive extract, colour (natural beta-carotene), vitamin B12 | ![Foods 14 02701 i007]() |
Table 2.
List of ingredients and images for slice-style products.
Table 2.
List of ingredients and images for slice-style products.
| Products | Ingredients | Pictures |
|---|
| Cheddar | Milk, rennet, salt | ![Foods 14 02701 i008]() |
| Processed | Cheese (60 g/100 g), water, milk protein, palm oil, modified potato starch, calcium phosphate, salt, salts (E452, E339), flavouring (milk), acidity regulator (lactic acid) (milk), natural colours (beta carotene, paprika extract) | ![Foods 14 02701 i009]() |
| Plant 1 | Water, coconut oil (23 g/100 g), modified starch, starch, sea salt, flavouring, olive extract, colour (beta-carotene), vitamin B12 | ![Foods 14 02701 i010]() |
| Plant 2 | Water, coconut oil (23 g/100 g), modified starch, starch, sea salt, cheddar flavour, olive extract, colour (beta-carotene, paprika), vitamin B12 | ![Foods 14 02701 i011]() |
| Plant 3 | Water, coconut oil (23 g/100 g), modified starch, starch, sea salt, smoke flavour, olive extract, colour (beta-carotene), vitamin B12 | ![Foods 14 02701 i012]() |
| Plant 4 | Water, coconut oil (25 g/100 g), modified potato starch, salt, calcium lactate, preservative (sorbic acid), natural flavouring, natural colour (beta-carotene), iron, vitamin D2, B6 & B12 | ![Foods 14 02701 i013]() |
| Plant 5 | Water, coconut oil (24 g/100 g) (non-hydrogenated), modified starch, sea salt, olive extract, vegan flavourings, colour (natural beta-carotene), vitamin B12 | ![Foods 14 02701 i014]() |
| Plant 6 | Water, shea oil, coconut oil, modified starch, salt, flavouring, lemon juice powder, spice extract, colour (beta-carotene) | ![Foods 14 02701 i015]() |
| Plant 7 | Water, coconut oil (24 g/100 g) (non-hydrogenated), modified starch, sea salt, olive extract, vegan flavourings, colour (natural beta-carotene), vitamin B12 | ![Foods 14 02701 i016]() |
Table 3.
Chemical composition, pH, water activity, and meltability of block-style variants.
Table 3.
Chemical composition, pH, water activity, and meltability of block-style variants.
| | Cheddar | Processed | Plant 1 | Plant 2 | Plant 3 | Plant 4 | Plant 5 |
|---|
| Protein (%) | 25.6 ± 0.1 a | 18.5 ± 0.1 b | 1.2 ± 0.0 d | 0.1 ± 0.0 e | 0.1 ± 0.0 e | 1.7 ± 0.0 c | 0.1 ± 0.0 e |
| Fat (%) | 34.8 ± 0.8 a | 24.9 ± 0.2 c | 23.8 ± 0.2 d | 21.1 ± 0.2 f | 22.6 ± 0.4 e | 24.2 ± 0.8 cd | 26.6 ± 0.1 b |
| Moisture (%) | 38.0 ± 0.1 g | 47.8 ± 0.1 f | 50.7 ± 0.0 d | 53.2 ± 0.1 b | 51.9 ± 0.1 c | 56.9 ± 0.1 a | 46.9 ± 0.1 e |
| Ash (%) | 3.8 ± 0.0 b | 4.5 ± 0.0 a | 2.4 ± 0.1 c | 2.2 ± 0.1 d | 2.1 ± 0.0 d | 2.4 ± 0.0 c | 2.2 ± 0.0 d |
| CHO * (%) | <0.0 e | 4.8 ± 0.2 d | 21.9 ± 0.3 b | 23.4 ± 0.2 a | 23.3 ± 0.4 ab | 14.9 ± 0.8 c | 24.2 ± 0.1 a |
| pH | 5.28 ± 0.0 b | 6.03 ± 0.0 a | 4.06 ± 0.0 d | 3.56 ± 0.0 e | 4.01 ± 0.0 d | 3.50 ± 0.0 f | 4.20 ± 0.0 c |
| Water activity | 0.95 ± 0.0 c | 0.98 ± 0.0 a | 0.98 ± 0.0 a | 0.98 ± 0.0 a | 0.96 ± 0.0 b | 0.98 ± 0.0 a | 0.96 ± 0.0 b |
| Meltability (%) | 81.7 ± 4.4 a | 2.2 ± 0.4 c | 6.7 ± 1.7 c | 2.2 ± 2.6 c | 3.3 ± 1.7 c | 17.2 ± 7.5 b | 0.0 d |
Table 4.
Chemical composition, pH, water activity, and meltability of slice-style variants.
Table 4.
Chemical composition, pH, water activity, and meltability of slice-style variants.
| | Cheddar | Processed | Plant 1 | Plant 2 | Plant 3 | Plant 4 | Plant 5 | Plant 6 | Plant 7 |
|---|
| Protein (%) | 25.2 ± 0.4 a | 12.9 ± 0.0 b | 0.1 ± 0.0 c | 0.1 ± 0.0 c | 0.1 ± 0.0 c | 0.1 ± 0.0 c | 0.1 ± 0.0 c | 0.2 ± 0.0 c | 0.2 ± 0.0 c |
| Fat (%) | 35.0 ± 0.5 a | 20.5 ± 0.8 f | 22.5 ± 0.3 de | 22.7 ± 0.1 de | 21.6 ± 0.3 e | 25.3 ± 0.4 c | 22.9 ± 0.35 d | 32.0 ± 0.1 b | 25.8 ± 0.0 c |
| Moisture (%) | 37.5 ± 0.0 h | 53.4 ± 0.0 a | 52.9 ± 0.2 b | 52.4 ± 0.0 c | 52.6 ± 0.0 c | 48.2 ± 0.1 e | 51.8 ± 0.0 d | 42.7 ± 0.1 g | 47.3 ± 0.0 f |
| Ash (%) | 3.7 ± 0.0 b | 5.7 ± 0.0 a | 2.3 ± 0.0 d | 2.3 ± 0.0 d | 2.4 ± 0.0 d | 2.6 ± 0.1 c | 2.3 ± 0.1 d | 2.2 ± 0.1 d | 1.8 ± 0.0 e |
| CHO * (%) | <0.0 e | 7.8 ± 0.8 d | 22.1 ± 0.5 c | 22.6 ± 0.1 c | 23.3 ± 0.4 bc | 23.8 ± 0.5 ab | 22.8 ± 0.4 bc | 22.9 ± 0.3 bc | 24.9 ± 0.1 a |
| pH | 5.32 ± 0.0 a | 6.00 ± 0.0 b | 4.10 ± 0.0 e | 4.05 ± 0.0 f | 3.91 ± 0.0 g | 4.71 ± 0.0 c | 3.89 ± 0.0 h | 4.49 ± 0.0 d | 4.47 ± 0.0 d |
| Water activity | 0.95 ± 0.0 d | 0.97 ± 0.0 b | 0.97 ± 0.0 b | 0.98 ± 0.0 a | 0.97 ± 0.0 b | 0.97 ± 0.0 b | 0.96 ± 0.0 c | 0.97 ± 0.0 b | 0.96 ± 0.0 c |
| Meltability (%) | 83.3 ± 3.3 a | 4.0 ± 0.0 d | 1.7 ± 0.0 d | 1.8 ± 0.2 d | 1.7 ± 0.0 d | 34.5 ± 2.6 c | 2.2 ± 0.9 c | 46.1 ± 1.9 b | 1.7 ± 0.0 c |
Table 5.
Colour space values (L*, a*, b*) before and after melting for block-style products.
Table 5.
Colour space values (L*, a*, b*) before and after melting for block-style products.
| | Cheddar | Processed | Plant 1 | Plant 2 | Plant 3 | Plant 4 | Plant 5 |
|---|
| Before melting |
| L* | 83.3 ± 0.2 e | 76.7 ± 1.1 g | 88.2 ± 0.1 d | 79.8 ± 0.4 f | 90.0 ± 0.1 c | 93.6 ± 0.4 a | 92.1 ± 0.1 b |
| a* | −3.6 ± 0.1 f | 9.1 ± 0.2 b | −1.6 ± 0.0 d | 10.3 ± 0.1 a | −4.2 ± 0.0 g | −1.3 ± 0.0 c | −2.3 ± 0.0 e |
| b* | 28.6 ± 0.5 e | 47.6 ± 0.2 b | 29.5 ± 0.3 d | 50.6 ± 0.5 a | 34.5 ± 0.1 c | 7.7 ± 0.1 g | 16.5 ± 0.1 f |
| After melting |
| L* | 73.7 ± 0.9 e | 67.5 ± 0.4 f | 77.7 ± 0.4 d | 68.2 ± 4.1 b | 78.7 ± 0.9 c | 88.5 ± 0.3 a | 81.9 ± 0.5 b |
| a* | −6.3 ± 0.1 g | 8.8 ± 0.4 b | −1.9 ± 0.1 d | 15.5 ± 0.2 a | −5.8 ± 0.1 f | −1.2 ± 0.0 c | −4.2 ± 0.0 e |
| b* | 27.8 ± 0.6 d | 52.3 ± 0.2 b | 51.1 ± 0.5 c | 68.6 ± 2.0 a | 53.8 ± 0.7 b | 11.3 ± 0.2 f | 22.3 ± 0.1 e |
Table 6.
Colour space values (L*, a*, b*) before and after melting for slice-style products.
Table 6.
Colour space values (L*, a*, b*) before and after melting for slice-style products.
| | Cheddar | Processed | Plant 1 | Plant 2 | Plant 3 | Plant 4 | Plant 5 | Plant 6 | Plant 7 |
|---|
| Before melting |
| L* | 81.7 ± 0.4 f | 80.6 ± 0.3 g | 86.9 ± 0.1 c | 79.2 ± 0.1 h | 85.8 ± 0.1 e | 88.1 ± 0.0 a | 87.4 ± 0.1 b | 75.4 ± 0.2 i | 86.7 ± 0.1 d |
| a* | −3.9 ± 0.01 e | 11.4 ± 0.2 b | −5.2 ± 0.0 h | 9.0 ± 0.1 c | −4.1 ± 0.1 f | −3.0 ±0.0 d | −4.9 ± 0.1 g | 17.5 ± 0.1 a | −3.9 ± 0.0 e |
| b* | 30.4 ± 0.3 f | 45.9 ± 0.2 b | 35.8 ± 0.1 d | 51.5 ± 0.1 a | 35.6 ± 0.3 d | 32.4 ± 0.0 f | 34.6 ± 0.1 e | 44.5 ± 0.8 c | 23.9 ± 0.0 g |
| After melting |
| L* | 70.9 ± 0.6 e | 77.5 ± 0.8 b | 76.6 ± 1.2 bc | 63.7 ± 0.0 f | 75.9 ± 0.1 c | 81.5 ± 1.1 a | 73.8 ± 0.3 d | 64.5 ± 0.4 f | 70.4 ± 0.0 e |
| a* | −6.4 ± 0.0 g | 17.8 ± 0.2 b | −5.4 ± 0.1 f | 15.0 ± 0.1 c | −4.1 ± 0.0 d | −6.2 ±0.0 g | −3.9 ± 0.0 d | 21.8 ± 0.2 a | −5.1 ± 0.0 e |
| b* | 30.9 ± 0.7 g | 67.8 ± 0.6 a | 54.2 ± 0.6 e | 61.4 ± 0.1 b | 53.9 ± 0.1 d | 53.1 ±0.3 de | 53.5 ± 0.2 de | 58.2 ± 0.8 c | 33.1 ± 0.0 f |
Table 7.
Texture profile analysis parameters: hardness, adhesiveness, springiness, and cohesiveness, rheological parameters including storage modulus (G′), loss modulus (G″) at 20 °C and 90 °C, maximum loss tangent (Tan δmax), and thermal behaviour, i.e., DSC Peak T (°C) of block-style products.
Table 7.
Texture profile analysis parameters: hardness, adhesiveness, springiness, and cohesiveness, rheological parameters including storage modulus (G′), loss modulus (G″) at 20 °C and 90 °C, maximum loss tangent (Tan δmax), and thermal behaviour, i.e., DSC Peak T (°C) of block-style products.
| | Cheddar | Processed | Plant 1 | Plant 2 | Plant 3 | Plant 4 | Plant 5 |
|---|
| Hardness (N) | 179.2 ± 2.4 a | 80.8 ± 1.6 f | 105.9 ± 0.6 e | 145.3 ± 2.3 b | 131.5 ± 0.6 c | 65.7 ± 0.7 g | 124.5 ± 2.2 d |
| Adhesiveness (N.s) | 11.1 ± 0.8 b | 16.1 ± 4.1 a | 0.8 ± 0.3 g | 2.1 ± 0.7 e | 4.5 ± 0.4 d | 1.3 ± 0.1 f | 5.1 ± 0.8 c |
| Springiness (-) | 0.2 ± 0.0 c | 0.1 ± 0.0 d | 0.4 ± 0.1 b | 0.5 ± 0.2 a | 0.4 ± 0.2 b | 0.2 ± 0.0 c | 0.2 ± 0.1 c |
| Cohesiveness (-) | 0.1 ± 0.0 a | 0.1 ± 0.0 a | 0.1 ± 0.0 a | 0.1 ± 0.0 a | 0.1 ± 0.0 a | 0.1 ± 0.0 a | 0.1 ± 0.0 a |
| G′ (20 °C) | 56.9 ± 5.6 c | 15.1 ± 0.9 g | 34.7 ± 4.3 e | 23.4 ± 2.8 f | 47.3 ± 0.2 d | 86.1 ± 16.5 a | 70.5 ± 12.9 b |
| G″ (20 °C) | 15.1 ± 0.8 a | 3.3 ± 0.5 c | 4.7 ± 0.8 c | 1.9 ± 0.5 c | 4.4 ± 0.4 c | 8.8 ± 2.3 b | 9.5 ± 2.2 b |
| G′ (90 °C) | 0.1 ± 0.0 d | 2.7 ± 0.7 a | 0.2 ± 0.0 d | 1.2 ± 0.1 bc | 0.7 ± 0.1 cd | 1.9 ± 0.2 b | 1.4 ± 0.3 bc |
| G″ (90 °C) | 0.1 ± 0.0 d | 0.8 ± 0.2 a | 0.0 ± 0.0 e | 0.3 ± 0.0 b | 0.2 ± 0.0 c | 0.3 ± 0.0 b | 0.3 ± 0.1 c |
| Tan δmax | 1.9 ± 0.0 a | 0.4 ± 0.0 b | 0.2 ± 0.0 d | 0.3 ± 0.0 c | 0.2 ± 0.0 cd | 0.1 ± 0.0 e | 0.2 ± 0.0 de |
| DSC Peak 1 T (°C) | 13.8 ± 0.0 b | 12.0 ± 0.7 c | 21.6 ± 0.5 a | 21.1 ± 0.3 a | 20.8 ± 0.1 a | 21.4 ± 0.9 a | 21.2 ± 0.5 a |
| DSC Peak 2 T (°C) | 30.1 ± 0.8 a | 29.5 ± 0.6 a | - | - | - | - | - |
Table 8.
Uniaxial compression testing i.e., hardness, along with rheological parameters, including storage modulus (G′), loss modulus (G″) at 20 °C and 90 °C, maximum loss tangent (Tan δmax), and thermal behaviour, i.e., DSC Peak T (°C) of slice-style products.
Table 8.
Uniaxial compression testing i.e., hardness, along with rheological parameters, including storage modulus (G′), loss modulus (G″) at 20 °C and 90 °C, maximum loss tangent (Tan δmax), and thermal behaviour, i.e., DSC Peak T (°C) of slice-style products.
| | Cheddar | Processed | Plant 1 | Plant 2 | Plant 3 | Plant 4 | Plant 5 | Plant 6 | Plant 7 |
|---|
| Hardness (N) | 3.4 ± 0.0 ef | 0.6 ± 0.0 h | 2.8 ± 0.0 g | 3.6 ± 0.0 d | 3.3 ± 0.0 f | 4.7 ± 0.0 b | 3.5 ± 0.0 e | 6.6 ± 0.1 a | 3.8 ± 0.0 c |
| G′ (20 °C) | 119.4 ± 16.7 b | 11.7 ± 2.4 f | 57.5 ± 7.1 de | 94.3 ± 21.2 bcd | 49.6 ± 5.1 ef | 72.4 ± 6.7 cde | 106.8 ± 21.5 bc | 290.4 ± 14.9 a | 85.9 ± 7.8 bcde |
| G″ (20 °C) | 32.3 ± 4.3 b | 4.3 ± 0.2 de | 4.5 ± 1.6 cd | 13.9 ± 5.8 bc | 2.8 ± 0.3 e | 9.7 ± 1.6 bcd | 15.6 ± 4.7 c | 45.9 ± 5.7 a | 11.9 ± 0.3 bcd |
| G′ (90 °C) | 0.0 ± 0.0 d | 0.7 ± 0.1 cd | 1.9 ± 0.4 a | 1.3 ± 0.4 abc | 1.5 ± 0.1 ab | 1.5 ± 0.2 ab | 1.2 ± 0.4 bc | 0.4 ± 0.0 d | 1.4 ± 0.2 ab |
| G″ (90 °C) | 0.1 ± 0.0 b | 0.3 ± 0.0 ab | 0.5 ± 0.1 a | 0.3 ± 0.1 ab | 0.3 ± 0.1 ab | 0.4 ± 0.1 a | 0.2 ± 0.1 ab | 0.1 ± 0.0 b | 0.2 ± 0.1 ab |
| Tan δmax | 2.5 ± 0.4 a | 0.6 ± 0.0 b | 0.2 ± 0.0 c | 0.2 ± 0.3 c | 0.2 ± 0.0 c | 0.2 ± 0.0 c | 0.2 ± 0.0 c | 0.2 ± 0.0 c | 0.2 ± 0.0 c |
DSC Peak 1
T (°C) | 13.3 ± 0.2 d | 31.4 ± 0.3 a | 20.2 ± 0.2 c | 21.0 ± 0.7 c | 20.5 ± 0.8 c | 20.8 ± 0.9 c | 21.3 ± 0.9 c | 29.5 ± 0.9 b | 21.4 ± 0.8 c |
DSC Peak 2
T (°C) | 29.2 ± 0.3 a | - | - | - | - | - | - | - | - |
Table 9.
Beta coefficient values for the seonsory data (hedonic and descriptive) for block-style dairy and plant-based cheese analogues.
Table 9.
Beta coefficient values for the seonsory data (hedonic and descriptive) for block-style dairy and plant-based cheese analogues.
| | Liking of Appearance | Liking of Aroma | Liking of Flavour | Liking of Texture | Overall Acceptability | Colour | Cheddar Aroma | Firmness in Mouth | Pasty Texture | Crumbly Texture | Sweet Taste | Salt Taste | Sour Taste | Bitter Taste | Cream Flavour | Cheddar Flavour | Dairy Sweet Flavour | Dairy Fat Flavour | Fruity (estery) Flavour | Off-Flavour | Astringent Aftertaste |
|---|
| Cheddar | 1.83 | 1.49 | 2.21 | 1.83 | 2.28 | 2.63 | 2.62 | 0.29 | 1.48 | −1.42 | 0.28 | 0.22 | −0.47 | −0.31 | 0.85 | 2.43 | 0.67 | 1.25 | −0.27 | −1.22 | −0.65 |
| Processed | 0.13 | 0.09 | 0.15 | 0.08 | 0.14 | 0.50 | 0.20 | −0.25 | 0.29 | −0.21 | −0.05 | −0.01 | 0.00 | −0.03 | 0.06 | 0.18 | 0.03 | 0.07 | −0.08 | −0.07 | 0.00 |
| Plant 1 | −0.27 | −0.22 | −0.33 | −0.27 | −0.34 | −0.39 | −0.39 | −0.04 | −0.22 | 0.21 | −0.04 | −0.03 | 0.07 | 0.05 | −0.13 | −0.36 | −0.10 | −0.19 | 0.04 | 0.18 | 0.10 |
| Plant 2 | −0.23 | −0.19 | −0.28 | −0.23 | −0.29 | −0.34 | −0.33 | −0.04 | −0.19 | 0.18 | −0.04 | −0.03 | 0.06 | 0.04 | −0.11 | −0.31 | −0.09 | −0.16 | 0.03 | 0.16 | 0.08 |
| Plant 3 | −0.20 | −0.16 | −0.24 | −0.20 | −0.25 | −0.29 | −0.29 | −0.03 | −0.16 | 0.16 | −0.03 | −0.02 | 0.05 | 0.03 | −0.09 | −0.27 | −0.07 | −0.14 | 0.03 | 0.14 | 0.07 |
| Plant 4 | −1.53 | −1.24 | −1.84 | −1.53 | −1.91 | −2.20 | −2.19 | −0.24 | −1.24 | 1.18 | −0.24 | −0.18 | 0.40 | 0.26 | −0.71 | −2.04 | −0.56 | −1.05 | 0.22 | 1.02 | 0.55 |
| Plant 5 | −0.98 | −0.79 | −1.17 | −0.97 | −1.21 | −1.40 | −1.40 | −0.15 | −0.79 | 0.75 | −0.15 | −0.12 | 0.25 | 0.17 | −0.45 | −1.30 | −0.36 | −0.67 | 0.14 | 0.65 | 0.35 |
Table 10.
p-Values of beta coefficients (figures shaded in green and red represent positive and negative significant correlations [+/− (p < 0.05)] respectively, for the seonsory data (hedonic and descriptive) for block-style products.
Table 10.
p-Values of beta coefficients (figures shaded in green and red represent positive and negative significant correlations [+/− (p < 0.05)] respectively, for the seonsory data (hedonic and descriptive) for block-style products.
| | Liking of Appearance | Liking of Aroma | Liking of Flavour | Liking of Texture | Overall Acceptability | Colour | Cheddar Aroma | Firmness in Mouth | Pasty Texture | Crumbly Texture | Sweet Taste | Salt Taste | Sour Taste | Bitter Taste | Cream Flavour | Cheddar Flavour | Dairy Sweet Flavour | Dairy Fat Flavour | Fruity (estery) Flavour | Off-Flavour | Astringent Aftertaste |
|---|
| Cheddar | 0.00 | 0.00 | 0.00 | 0.00 | 0.00 | 0.25 | 0.00 | 0.00 | 0.20 | 0.75 | 0.61 | 0.08 | 0.11 | 0.65 | 0.02 | 0.00 | 0.14 | 0.00 | 0.43 | 0.00 | 0.23 |
| Processed | 0.12 | 0.33 | 0.01 | 0.38 | 0.06 | 0.00 | 0.01 | 0.00 | 0.00 | 0.00 | 0.72 | 0.69 | 0.06 | 0.10 | 0.30 | 0.00 | 0.68 | 0.24 | 0.07 | 0.17 | 0.51 |
| Plant 1 | 0.55 | 0.64 | 0.57 | 0.73 | 0.59 | 0.07 | 0.49 | 0.40 | 0.33 | 0.68 | 0.56 | 0.94 | 0.78 | 0.90 | 0.82 | 0.51 | 0.96 | 0.84 | 0.74 | 0.72 | 0.79 |
| Plant 2 | 0.62 | 0.99 | 0.00 | 0.00 | 0.00 | 0.00 | 0.53 | 0.02 | 0.02 | 0.38 | 0.97 | 0.37 | 0.84 | 0.42 | 0.10 | 0.19 | 0.87 | 0.46 | 0.96 | 0.03 | 0.26 |
| Plant 3 | 0.80 | 0.56 | 0.20 | 0.24 | 0.12 | 0.36 | 0.49 | 0.13 | 0.37 | 0.50 | 0.10 | 0.36 | 0.12 | 0.29 | 0.92 | 0.64 | 0.68 | 0.56 | 0.69 | 0.58 | 0.32 |
| Plant 4 | 0.02 | 0.06 | 0.07 | 0.19 | 0.08 | 0.00 | 0.00 | 0.00 | 0.71 | 0.01 | 0.00 | 0.61 | 0.00 | 0.11 | 0.36 | 0.00 | 0.06 | 0.00 | 0.38 | 0.53 | 0.05 |
| Plant 5 | 0.08 | 0.09 | 0.01 | 0.02 | 0.01 | 0.00 | 0.00 | 0.15 | 0.02 | 0.34 | 0.33 | 0.65 | 0.05 | 0.28 | 0.61 | 0.01 | 0.64 | 0.35 | 0.92 | 0.35 | 0.38 |
Table 11.
Beta coefficient values for the seonsory data (hedonic and descriptive) for slice-style dairy and plant-based cheese analogues.
Table 11.
Beta coefficient values for the seonsory data (hedonic and descriptive) for slice-style dairy and plant-based cheese analogues.
| | Liking of Appearance | Liking of Aroma | Liking of Flavour | Liking of Texture | Overall Acceptability | Colour | Cheddar Aroma | Firmness in Mouth | Pasty Texture | Crumbly Texture | Sweet Taste | Salt Taste | Sour Taste | Bitter Taste | Cream Flavour | Cheddar Flavour | Dairy Sweet Flavour | Dairy Fat Flavour | Fruity (estery) Flavour | Off-Flavour | Astringent Aftertaste |
|---|
| Cheddar | 1.98 | 2.44 | 2.95 | 3.12 | 3.19 | −3.35 | 2.04 | 0.77 | 0.31 | −0.35 | 0.29 | 0.21 | 0.97 | 0.43 | 0.73 | 2.09 | 0.80 | 0.75 | 0.46 | −1.89 | −0.24 |
| Processed | −0.49 | −0.60 | −0.72 | −0.76 | −0.78 | 0.82 | −0.50 | −0.19 | −0.07 | 0.09 | −0.07 | −0.05 | −0.24 | −0.11 | −0.18 | −0.51 | −0.20 | −0.18 | −0.11 | 0.46 | 0.06 |
| Plant 1 | 0.33 | 0.41 | 0.49 | 0.52 | 0.53 | −0.56 | 0.34 | 0.13 | 0.05 | −0.06 | 0.05 | 0.04 | 0.16 | 0.07 | 0.12 | 0.35 | 0.13 | 0.13 | 0.08 | −0.32 | −0.04 |
| Plant 2 | −0.69 | −0.84 | −1.02 | −1.08 | −1.11 | 1.16 | −0.71 | −0.27 | −0.11 | 0.12 | −0.10 | −0.07 | −0.33 | −0.15 | −0.25 | −0.72 | −0.28 | −0.26 | −0.16 | 0.66 | 0.08 |
| Plant 3 | 0.33 | 0.41 | 0.50 | 0.52 | 0.54 | −0.56 | 0.34 | 0.13 | 0.05 | −0.06 | 0.05 | 0.04 | 0.16 | 0.07 | 0.12 | 0.35 | 0.14 | 0.13 | 0.08 | −0.32 | −0.04 |
| Plant 4 | −0.19 | −0.24 | −0.28 | −0.30 | −0.31 | 0.32 | −0.20 | −0.07 | −0.03 | 0.03 | −0.03 | −0.02 | −0.09 | −0.04 | −0.07 | −0.20 | −0.08 | −0.07 | −0.04 | 0.18 | 0.02 |
| Plant 5 | 0.32 | 0.40 | 0.48 | 0.51 | 0.52 | −0.54 | 0.33 | 0.13 | 0.05 | −0.06 | 0.05 | 0.03 | 0.16 | 0.07 | 0.12 | 0.34 | 0.13 | 0.12 | 0.07 | −0.31 | −0.04 |
| Plant 6 | −1.10 | −1.36 | −1.64 | −1.73 | −1.77 | 1.86 | −1.13 | −0.43 | −0.17 | 0.20 | −0.16 | −0.12 | −0.54 | −0.24 | −0.40 | −1.16 | −0.45 | −0.42 | −0.25 | 1.05 | 0.13 |
| Plant 7 | −0.47 | −0.58 | −0.70 | −0.74 | −0.75 | 0.79 | −0.48 | −0.18 | −0.07 | 0.08 | −0.07 | −0.05 | −0.23 | −0.10 | −0.17 | −0.49 | −0.19 | −0.18 | −0.11 | 0.45 | 0.06 |
Table 12.
p-Values of beta coefficients (figures shaded in green and red represented positive and negative significant correlations [+/− (p < 0.05)], respectively, for the seonsory data (hedonic and descriptive) for slice-style products.
Table 12.
p-Values of beta coefficients (figures shaded in green and red represented positive and negative significant correlations [+/− (p < 0.05)], respectively, for the seonsory data (hedonic and descriptive) for slice-style products.
| | Liking of Appearance | Liking of Aroma | Liking of Flavour | Liking of Texture | Overall Acceptability | Colour | Cheddar Aroma | Firmness in Mouth | Pasty Texture | Crumbly Texture | Sweet Taste | Salt Taste | Sour Taste | Bitter Taste | Cream Flavour | Cheddar Flavour | Dairy Sweet Flavour | Dairy Fat Flavour | Fruity (estery) Flavour | Off-Flavour | Astringent Aftertaste |
|---|
| Cheddar | 0.00 | 0.00 | 0.00 | 0.00 | 0.00 | 0.00 | 0.00 | 0.08 | 0.09 | 0.93 | 0.62 | 0.21 | 0.00 | 0.19 | 0.03 | 0.00 | 0.06 | 0.01 | 0.25 | 0.00 | 0.87 |
| Processed | 0.01 | 0.53 | 0.73 | 0.11 | 0.99 | 0.00 | 0.24 | 0.00 | 0.00 | 0.00 | 0.84 | 0.50 | 0.82 | 0.00 | 0.33 | 0.36 | 0.33 | 0.06 | 0.51 | 0.34 | 0.11 |
| Plant 1 | 0.40 | 0.21 | 0.21 | 0.71 | 0.27 | 0.00 | 0.83 | 0.82 | 0.43 | 0.14 | 0.69 | 0.63 | 0.20 | 0.25 | 0.53 | 0.26 | 0.37 | 0.88 | 0.33 | 0.08 | 0.24 |
| Plant 2 | 0.07 | 0.82 | 0.04 | 0.07 | 0.07 | 0.00 | 0.72 | 0.10 | 0.04 | 0.10 | 0.91 | 0.48 | 0.03 | 0.10 | 0.35 | 0.09 | 0.55 | 0.41 | 0.09 | 0.50 | 0.58 |
| Plant 3 | 0.07 | 0.61 | 0.46 | 0.43 | 0.50 | 0.00 | 0.81 | 0.21 | 0.31 | 0.95 | 0.65 | 0.78 | 0.90 | 0.81 | 0.83 | 0.93 | 0.70 | 0.76 | 0.86 | 0.69 | 0.92 |
| Plant 4 | 0.18 | 0.02 | 0.05 | 0.34 | 0.04 | 0.00 | 0.10 | 0.04 | 0.04 | 0.05 | 0.62 | 0.63 | 0.78 | 0.09 | 0.59 | 0.56 | 0.08 | 0.14 | 0.32 | 0.02 | 0.10 |
| Plant 5 | 0.10 | 0.49 | 0.30 | 0.46 | 0.40 | 0.00 | 1.00 | 0.61 | 0.54 | 0.59 | 0.67 | 0.62 | 0.70 | 0.92 | 0.73 | 0.81 | 0.50 | 0.83 | 0.98 | 0.52 | 0.68 |
| Plant 6 | 0.01 | 0.00 | 0.00 | 0.01 | 0.00 | 0.00 | 0.71 | 0.47 | 0.47 | 0.05 | 0.52 | 0.53 | 0.44 | 0.60 | 0.90 | 0.78 | 0.13 | 0.87 | 0.98 | 0.05 | 0.33 |
| Plant 7 | 0.47 | 0.01 | 0.01 | 0.03 | 0.00 | 0.00 | 0.00 | 0.18 | 0.02 | 0.24 | 0.70 | 0.24 | 0.53 | 0.20 | 0.19 | 0.02 | 0.14 | 0.05 | 0.37 | 0.03 | 0.23 |


