2.1. Methods: The Rasch Model
The decision to adopt the Rasch model in this study stems from its unique ability to produce objective and unbiased measurements of latent traits—an attribute not fully ensured by more complex psychometric models, including other Item Response Theory (IRT) approaches. Specifically, the Rasch model upholds what Georg Rasch termed specific objectivity: the ability to compare individuals independently of the specific items administered, and to compare items independently of the sample of respondents. This sample- and test-independent calibration is made possible by the mathematical structure of the model, which imposes strict constraints on item–person interactions. When the data fit the model, item difficulty and person ability estimates become invariant, allowing the construction of linear, unidimensional, and interpretable scales that are generalized across different populations and instruments. In contrast, other IRT models introduce parameters such as item discrimination or guessing, which may improve model fit but compromise measurement invariance. These models are effective for predicting responses but fall short of the objectivity standards required for valid measurement in the scientific sense.
Another critical advantage of the Rasch model lies in its capacity to ensure unbiased estimation of both item and person parameters. This is because the model defines the probability of a response solely as a function of the difference between a person’s latent trait level and an item’s location on the same continuum. As a result, item estimates remain unaffected by the respondent sample, and person measures are independent of the specific item set—provided those items fit the model. In contrast, classical test theory and most IRT models are sample-dependent, meaning item statistics and person scores can vary with the composition of the sample or test content. The Rasch model, by eliminating these dependencies, offers a robust framework for achieving truly objective, sample-free measurement—critical when the goal is to construct valid and generalizable scales of latent constructs such as consumer attitudes. By eliminating such dependencies, the Rasch model enables researchers to achieve truly objective measurement, allowing individuals and items to be located on a common, linear scale without contamination from sample- or test-specific characteristics. This level of objectivity is especially critical when the goal is to develop generalizable and interpretable measures of psychological or behavioral constructs, such as consumer attitudes.
Lastly, Rasch models are measurement frameworks that utilize binary or ordinal data to develop a metric for the latent variable of interest for each individual surveyed [
13]. In our investigation, we aim to establish a linear gauge of consumers’ inclination toward purchasing kiwifruits, using the ratings provided by respondents for associated items. Various Rasch models are accessible based on the characteristics of the variables. If there are two ordered categories, the Dichotomous Rasch model, as proposed by [
14], is applicable [
15]. On the other hand, for higher ordered categories, the Rating Scale model introduced by Andrich (1978) [
16] and the Partial Credit model developed by Masters (1982) [
17] are more suitable. We utilized the Rating Scale model:
N represents the total number of individuals surveyed, while J denotes the number of items assessed. The variable Xij, which takes values from 1 to K, represents the response of individual i to item j. The parameter αi reflects the individual’s level of proficiency or their positive inclination towards the subject under consideration, while βj signifies the complexity of the item or the level of challenge it presents, measured on the same scale as the underlying trait. Additionally, τk represents a ‘threshold’ indicating the level of difficulty associated with endorsing category k, which remains consistent across all items. Higher αi values suggest a greater tendency for individuals to respond with higher scores, while lower αi values indicate a higher likelihood of lower scores. Similarly, higher βj values suggest that individuals are less likely to provide high scores for item j, whereas lower βj values indicate a greater likelihood of high scores. Within this framework, τk, where k ranges from 2 to K, serves as a ‘threshold’ measuring the difficulty of endorsing category k. This threshold, known as the Andrich Threshold [
18], is expected to follow an ascending order, as further elaborated.
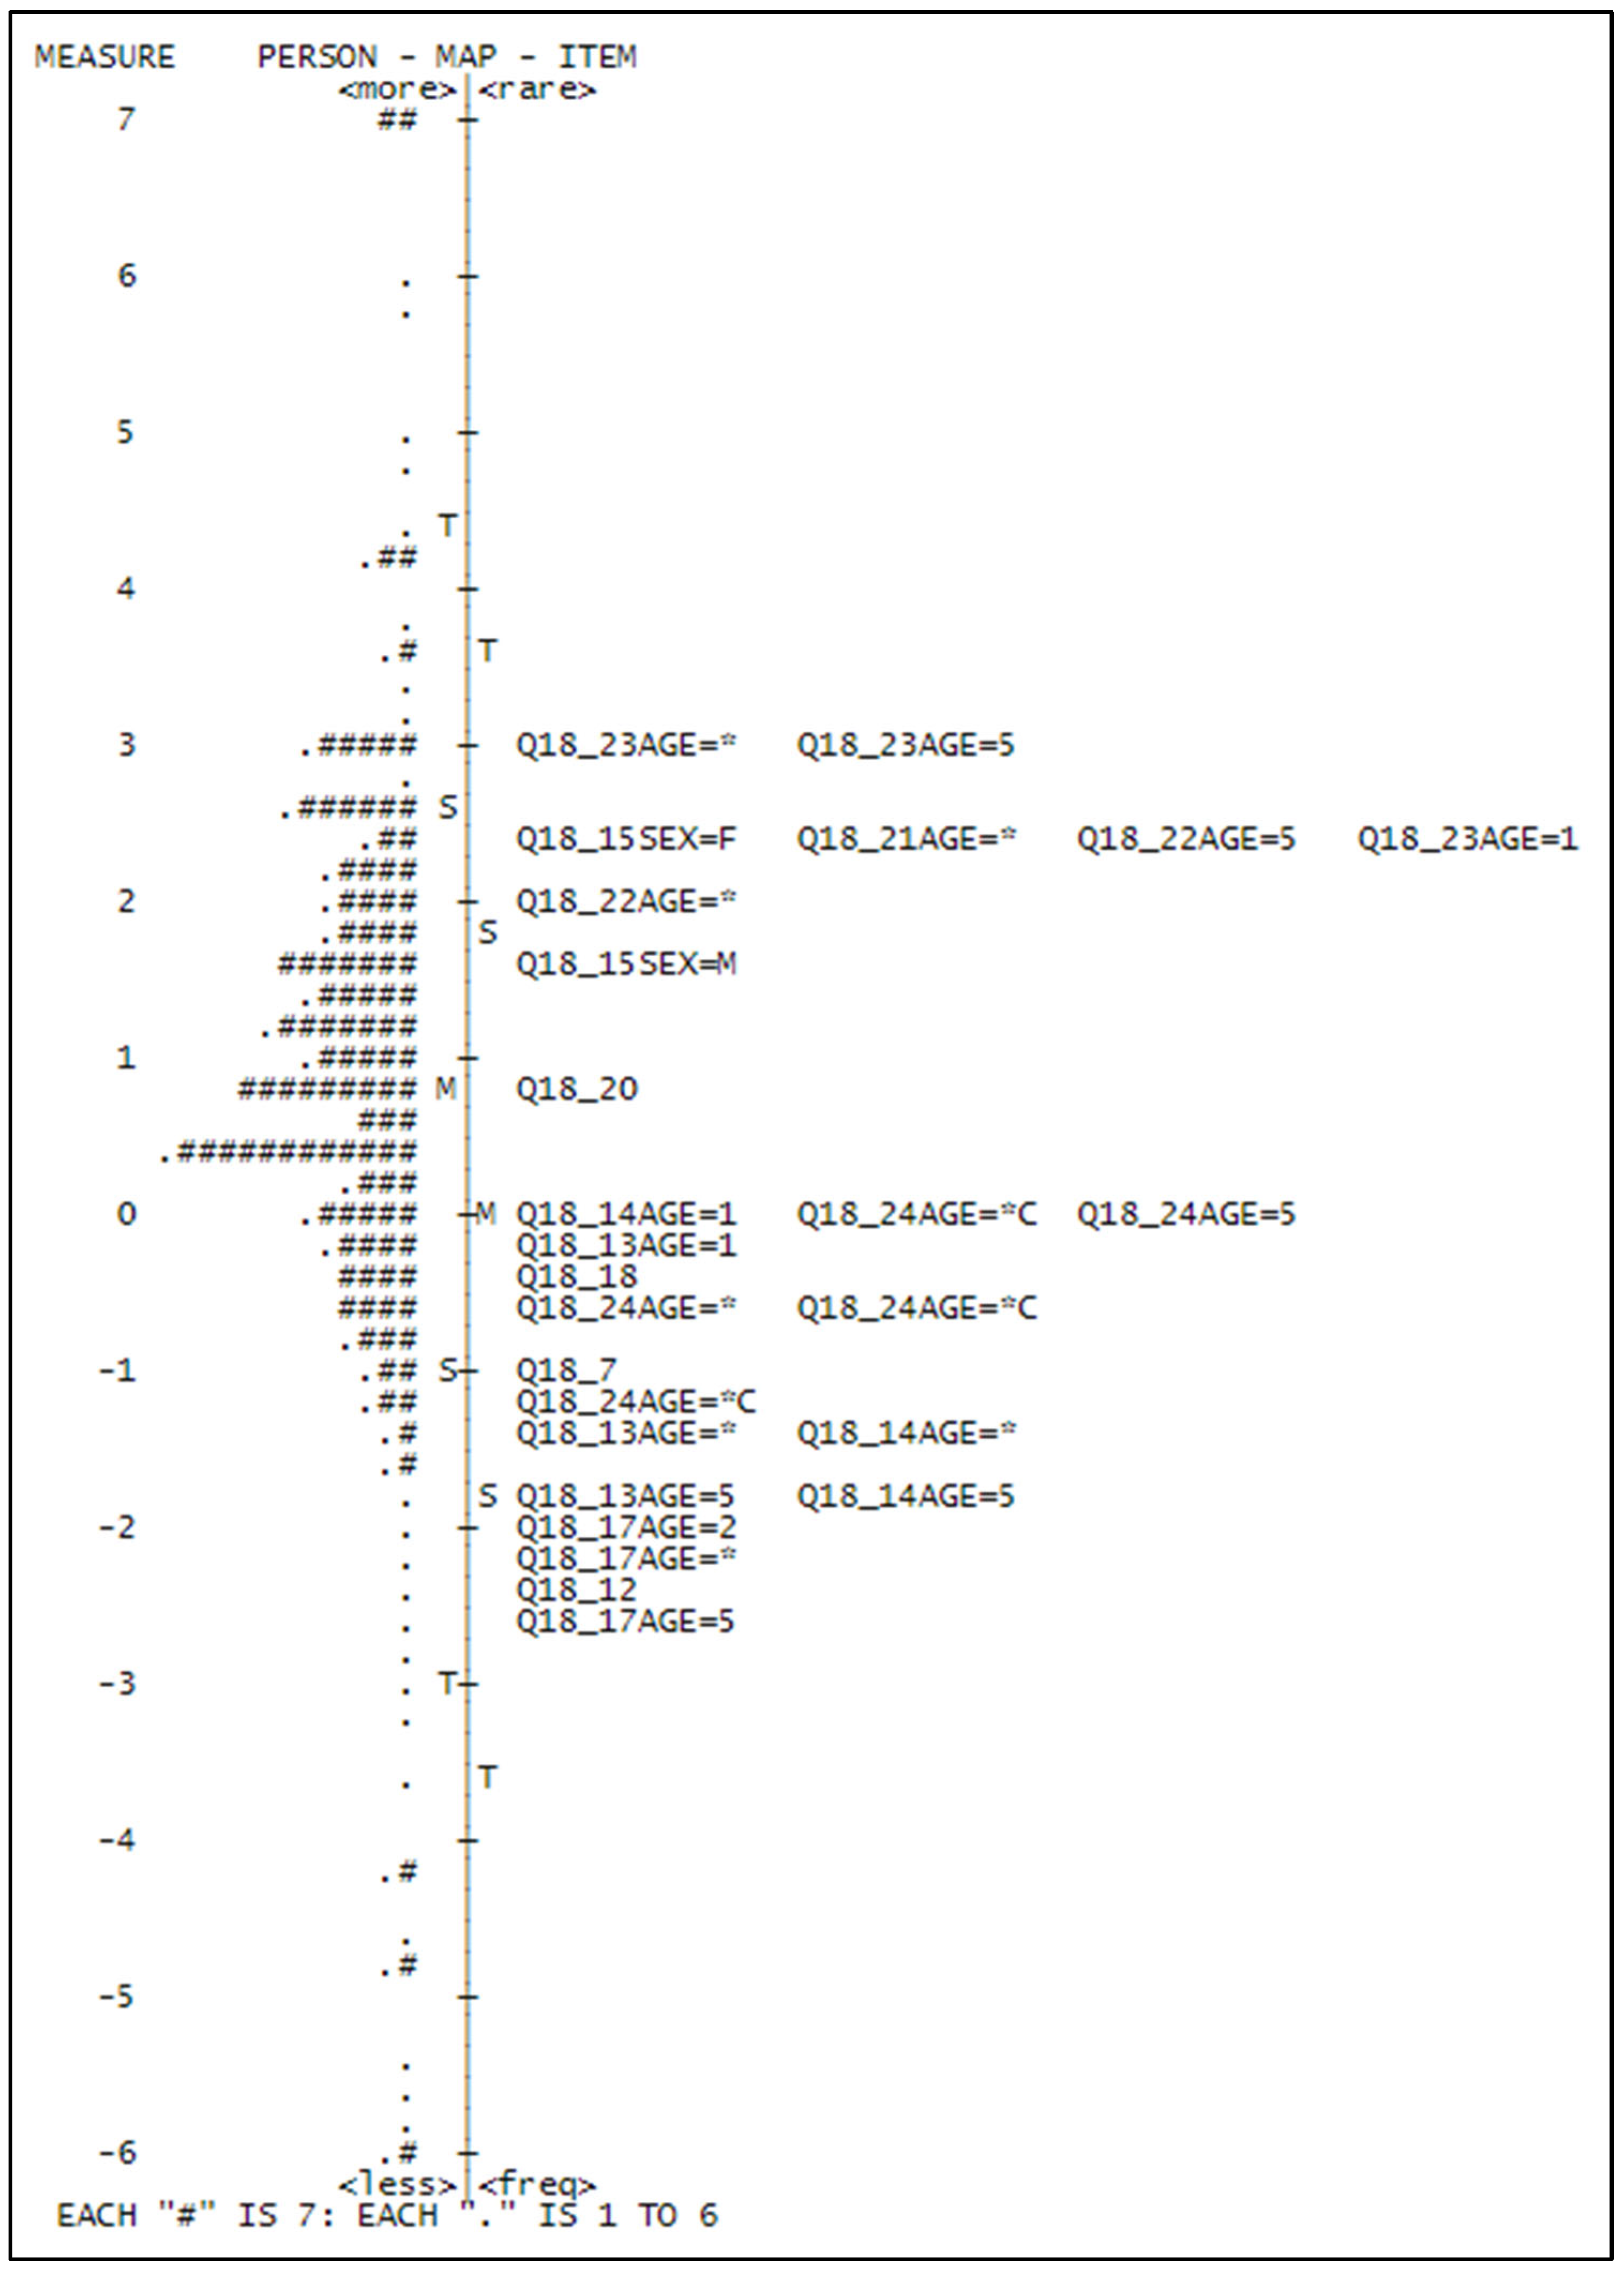
In essence, individuals with a higher estimated attitude αi are expected to assign higher scores across all items compared to those with less positive attitudes. Similarly, items with higher βj values (indicating greater difficulty in endorsement) are anticipated to receive lower scores compared to items with lower difficulty [
13]. This property is a fundamental aspect of Rasch models known as “Specific Objectivity” [
19,
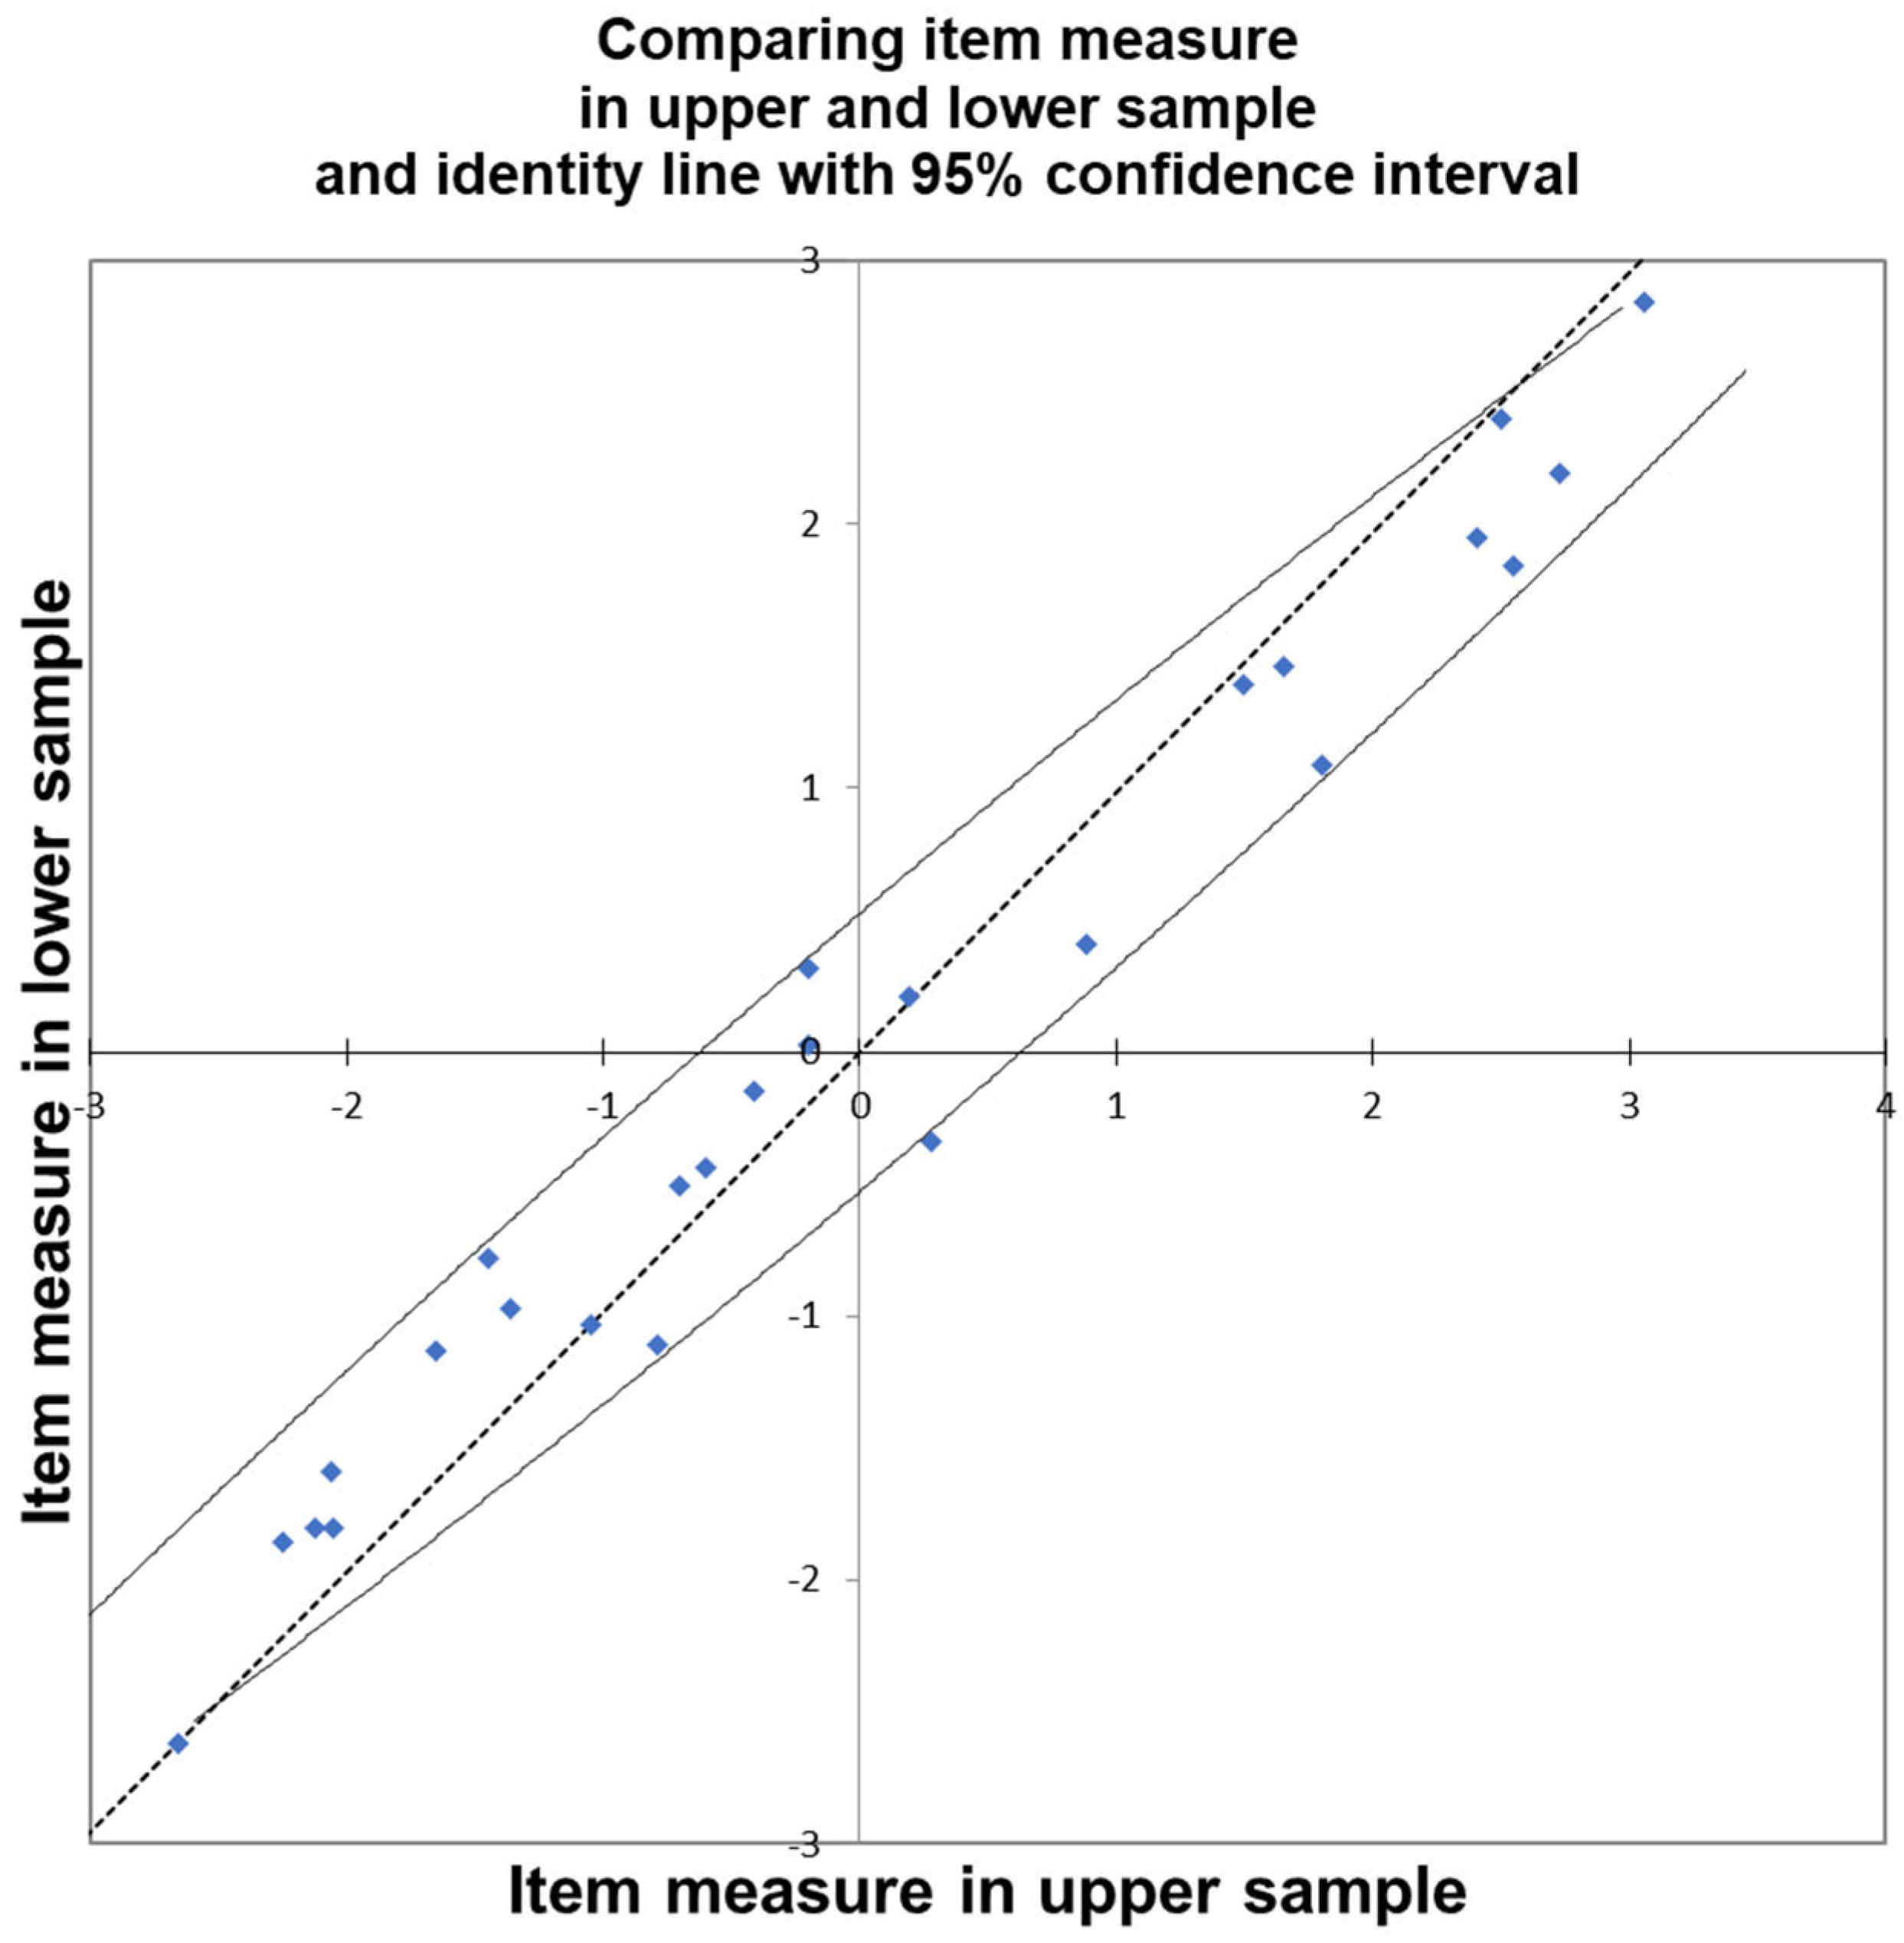
20]. Specific Objectivity asserts that measures derived from a measurement model should remain uninfluenced by variations in the distribution of item difficulties and individual abilities. Research indicates that when dividing the original sample into subsets based on varying levels of positive attitudes, the estimated difficulty parameters (βj) computed on these subsets are statistically indistinguishable. In the Rasch model, the estimates of individual attitudes should remain consistent whether derived from the full sample or a reduced one—any discrepancies may signal data issues or model misfit (e.g., miscoding or misinterpreted scales). This reflects two key properties:
Person-free Test Calibration (item parameters don’t depend on the sample) and
Item-free Person Measurement (person measures don’t depend on the specific items used). Importantly, the model does not require normally distributed parameters, and attitude estimates across different item sets should align within acceptable error margins. Evaluating the extent to which the data align with the Rasch model’s optimal theoretical characteristics represents the primary challenge in the analysis. The data underwent analysis using Winsteps (
www.winsteps.com), a widely utilized software for Rasch Analysis [
21,
22]. To gauge the compatibility of the data with the model and its underlying assumptions, the correlation coefficient between the observed empirical data (Xij ∈{1, 2, …, K}) and the Rasch measures obtained in the initial run of the estimation program was examined. These correlations were computed for both items and individuals.
Positive correlations between item responses and estimated parameters are expected under the Rasch model: individuals with more positive attitudes should assign higher scores to easier-to-endorse items. Thus, negative or very low correlations signal potential issues such as coding errors (e.g., reversed scoring) or random responding. In such cases, items may need to be excluded or recorded. Similarly, at the person level, low correlations between responses and item parameters indicate inattentive or inconsistent answering, justifying respondent exclusion.
In our dataset, 25–40% of responses across dimensions showed problematic correlations and were excluded to avoid bias in parameter estimation. This step reflects a standard quality control procedure—not manipulation—to ensure the validity of the measures.
Additionally, extreme scorers—those who consistently gave the lowest or highest possible ratings (e.g., always “1” or always “4”)—were removed. While such patterns indicate very strong attitudes, they result in undefined or truncated estimates. Their presence suggests that the items were either too easy or too difficult to capture meaningful variance, and ideally, new items should be added to better target the dimension of interest. However, our survey design did not allow for this adjustment. Extreme scores affected 10–20% of the sample, depending on the dimension.
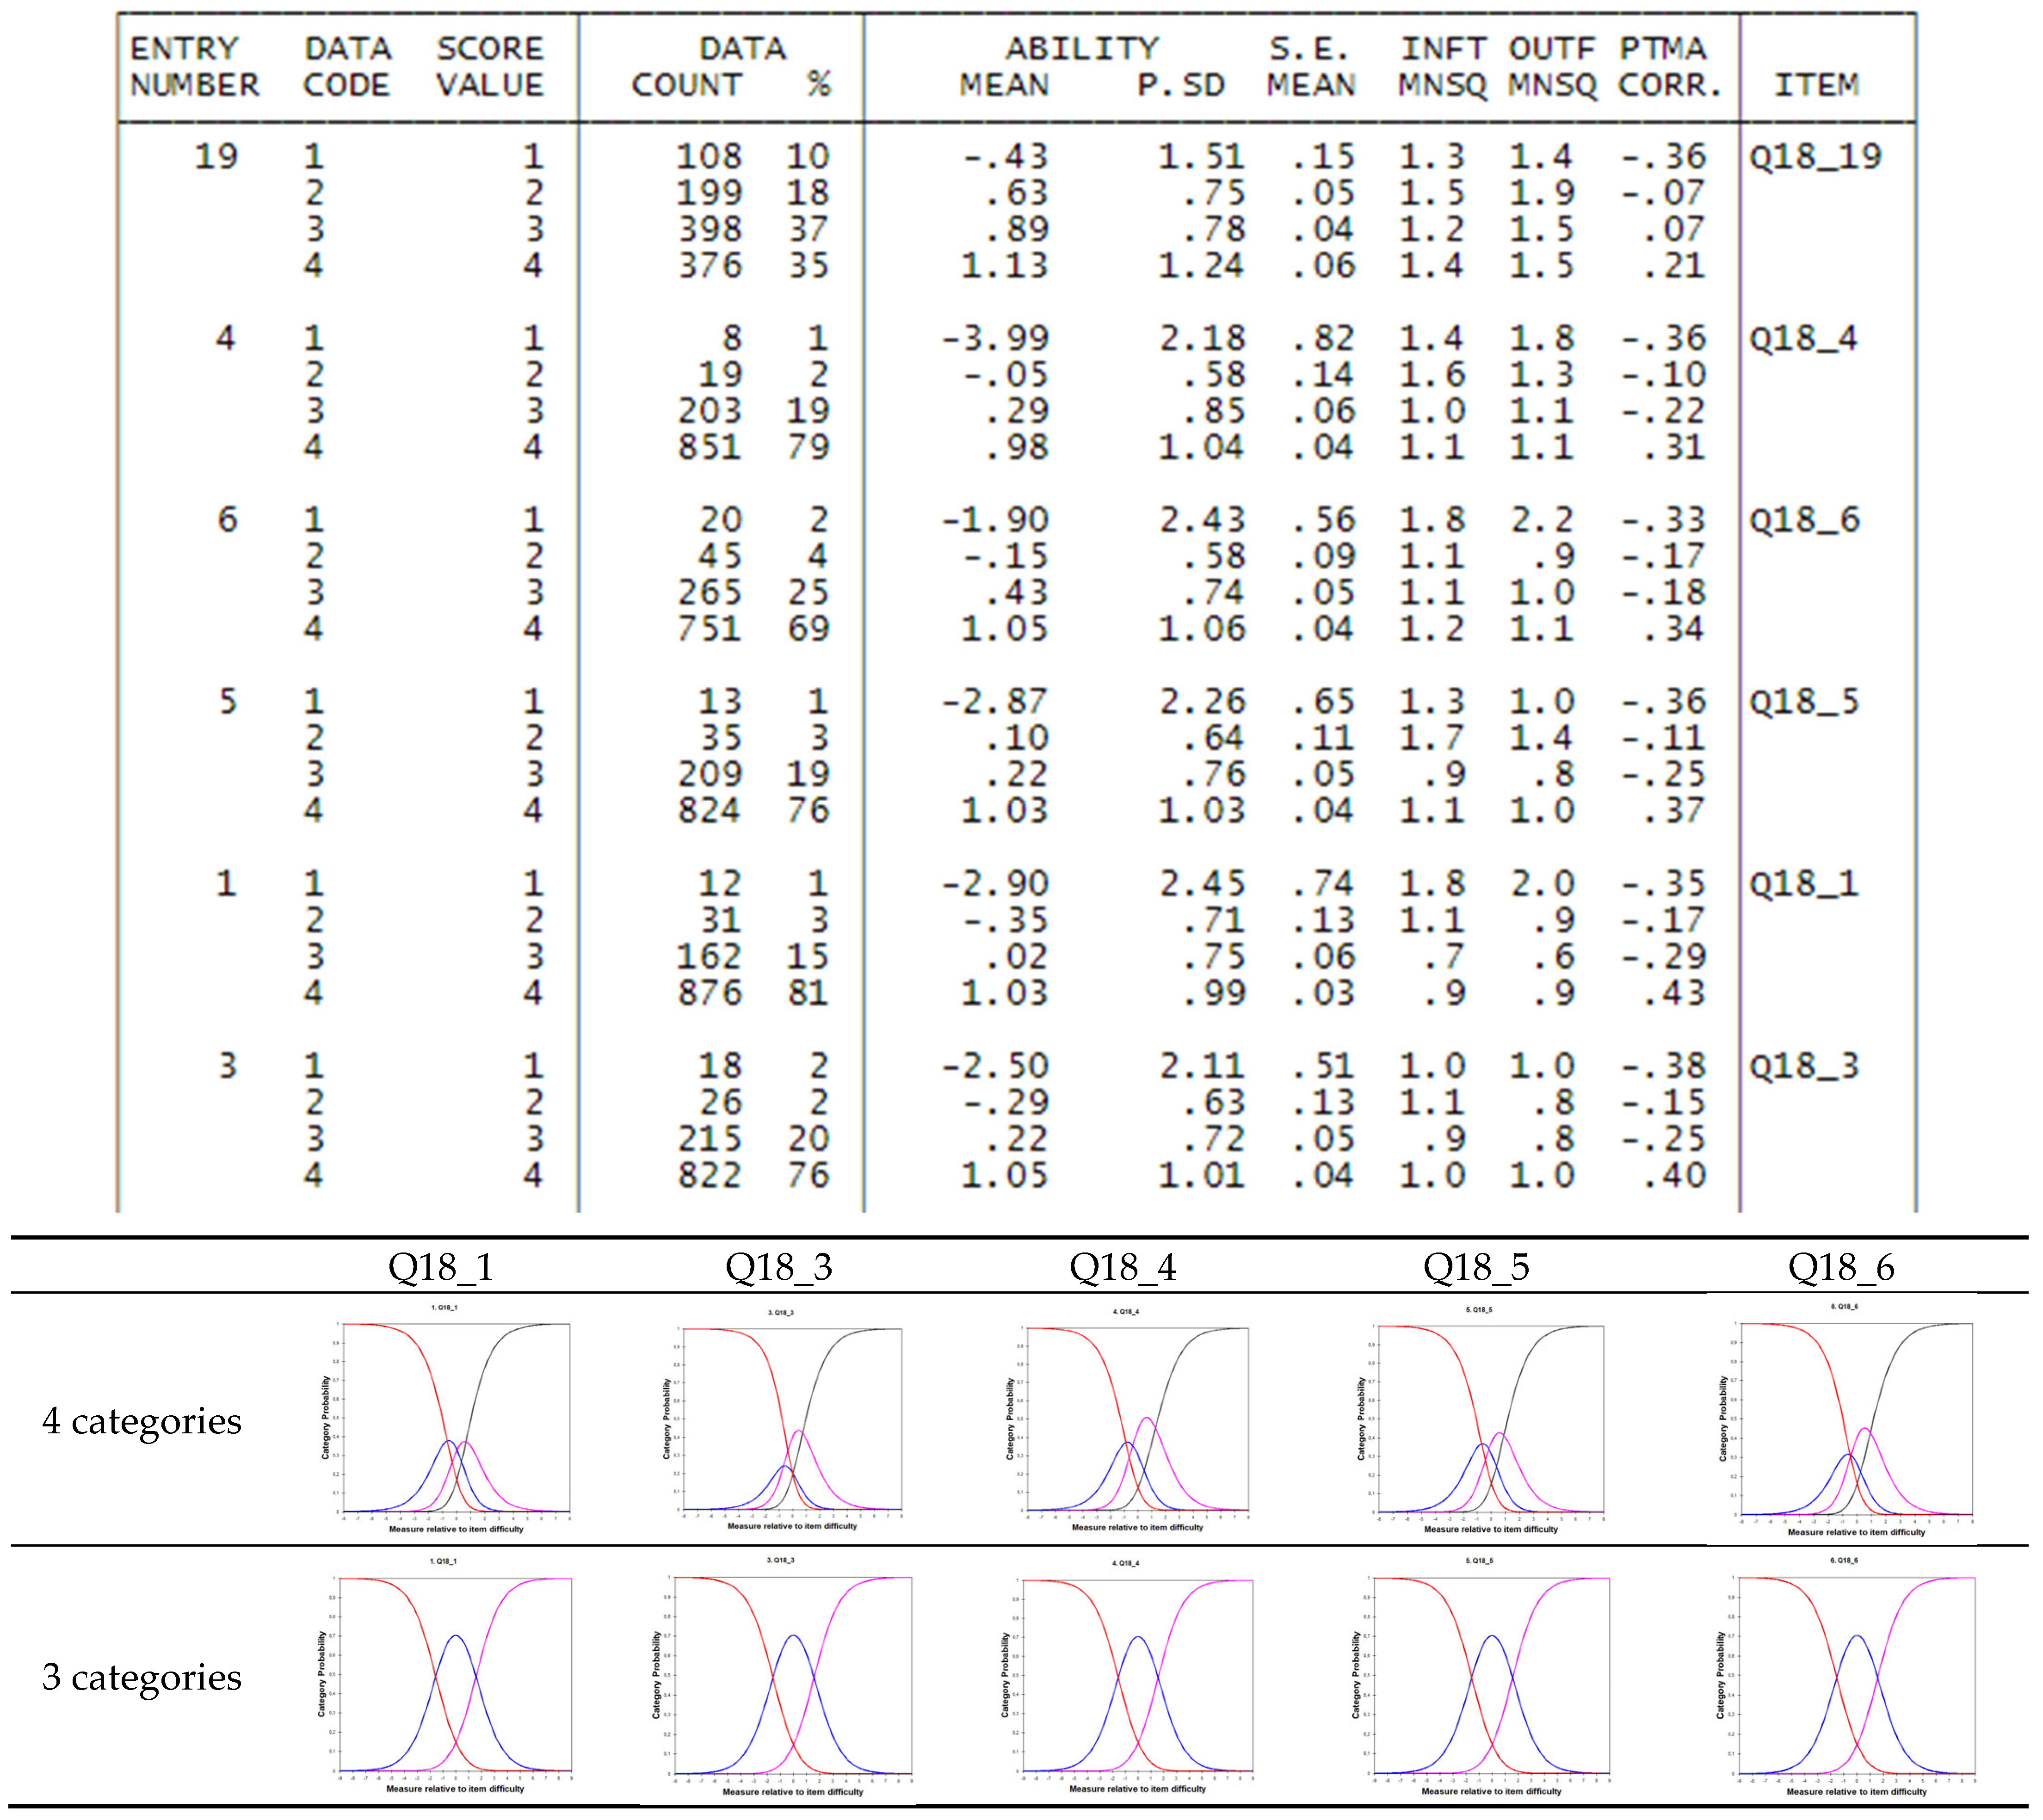
Further data exclusions were informed by item and person fit statistics, which are discussed in a later section. Once the Rasch model is fitted, it’s essential to verify that the scoring categories (e.g., 1, 2, 3, 4) reflect a meaningful progression in both item endorsement and person attitude levels. Ideally, higher scores should correspond to higher average attitudes, consistent with the model’s assumptions.
Discontent with this assumption, such as observing a higher average attitude for score 2 compared to score 3, would indicate that respondents may have reversed or inconsistently applied scores 2 and 3. In this scenario, merging these two scores into a single category would be necessary. The Andrich Threshold
τk [
23] offers additional insights into the coherent or incoherent use of category measures. In instances of inverted use, where the scores are not in ascending order, a common resolution involves reducing the number of categories by combining adjacent ones with closely aligned average attitudes or Andrich Thresholds.
Another crucial element in assessing fit involves examining the potential breach of the local independence hypothesis [
24,
25] and multidimensionality [
23]. Regarding the first issue, attention is directed to the correlation of standardized residuals. A low correlation (<0.70) implies the absence of a violation of the local independence hypothesis. On the contrary, a correlation > 0.70 indicates that certain pairs of items share almost identical meanings. In such cases, eliminating one of the items becomes necessary to adhere to the local independence hypothesis.
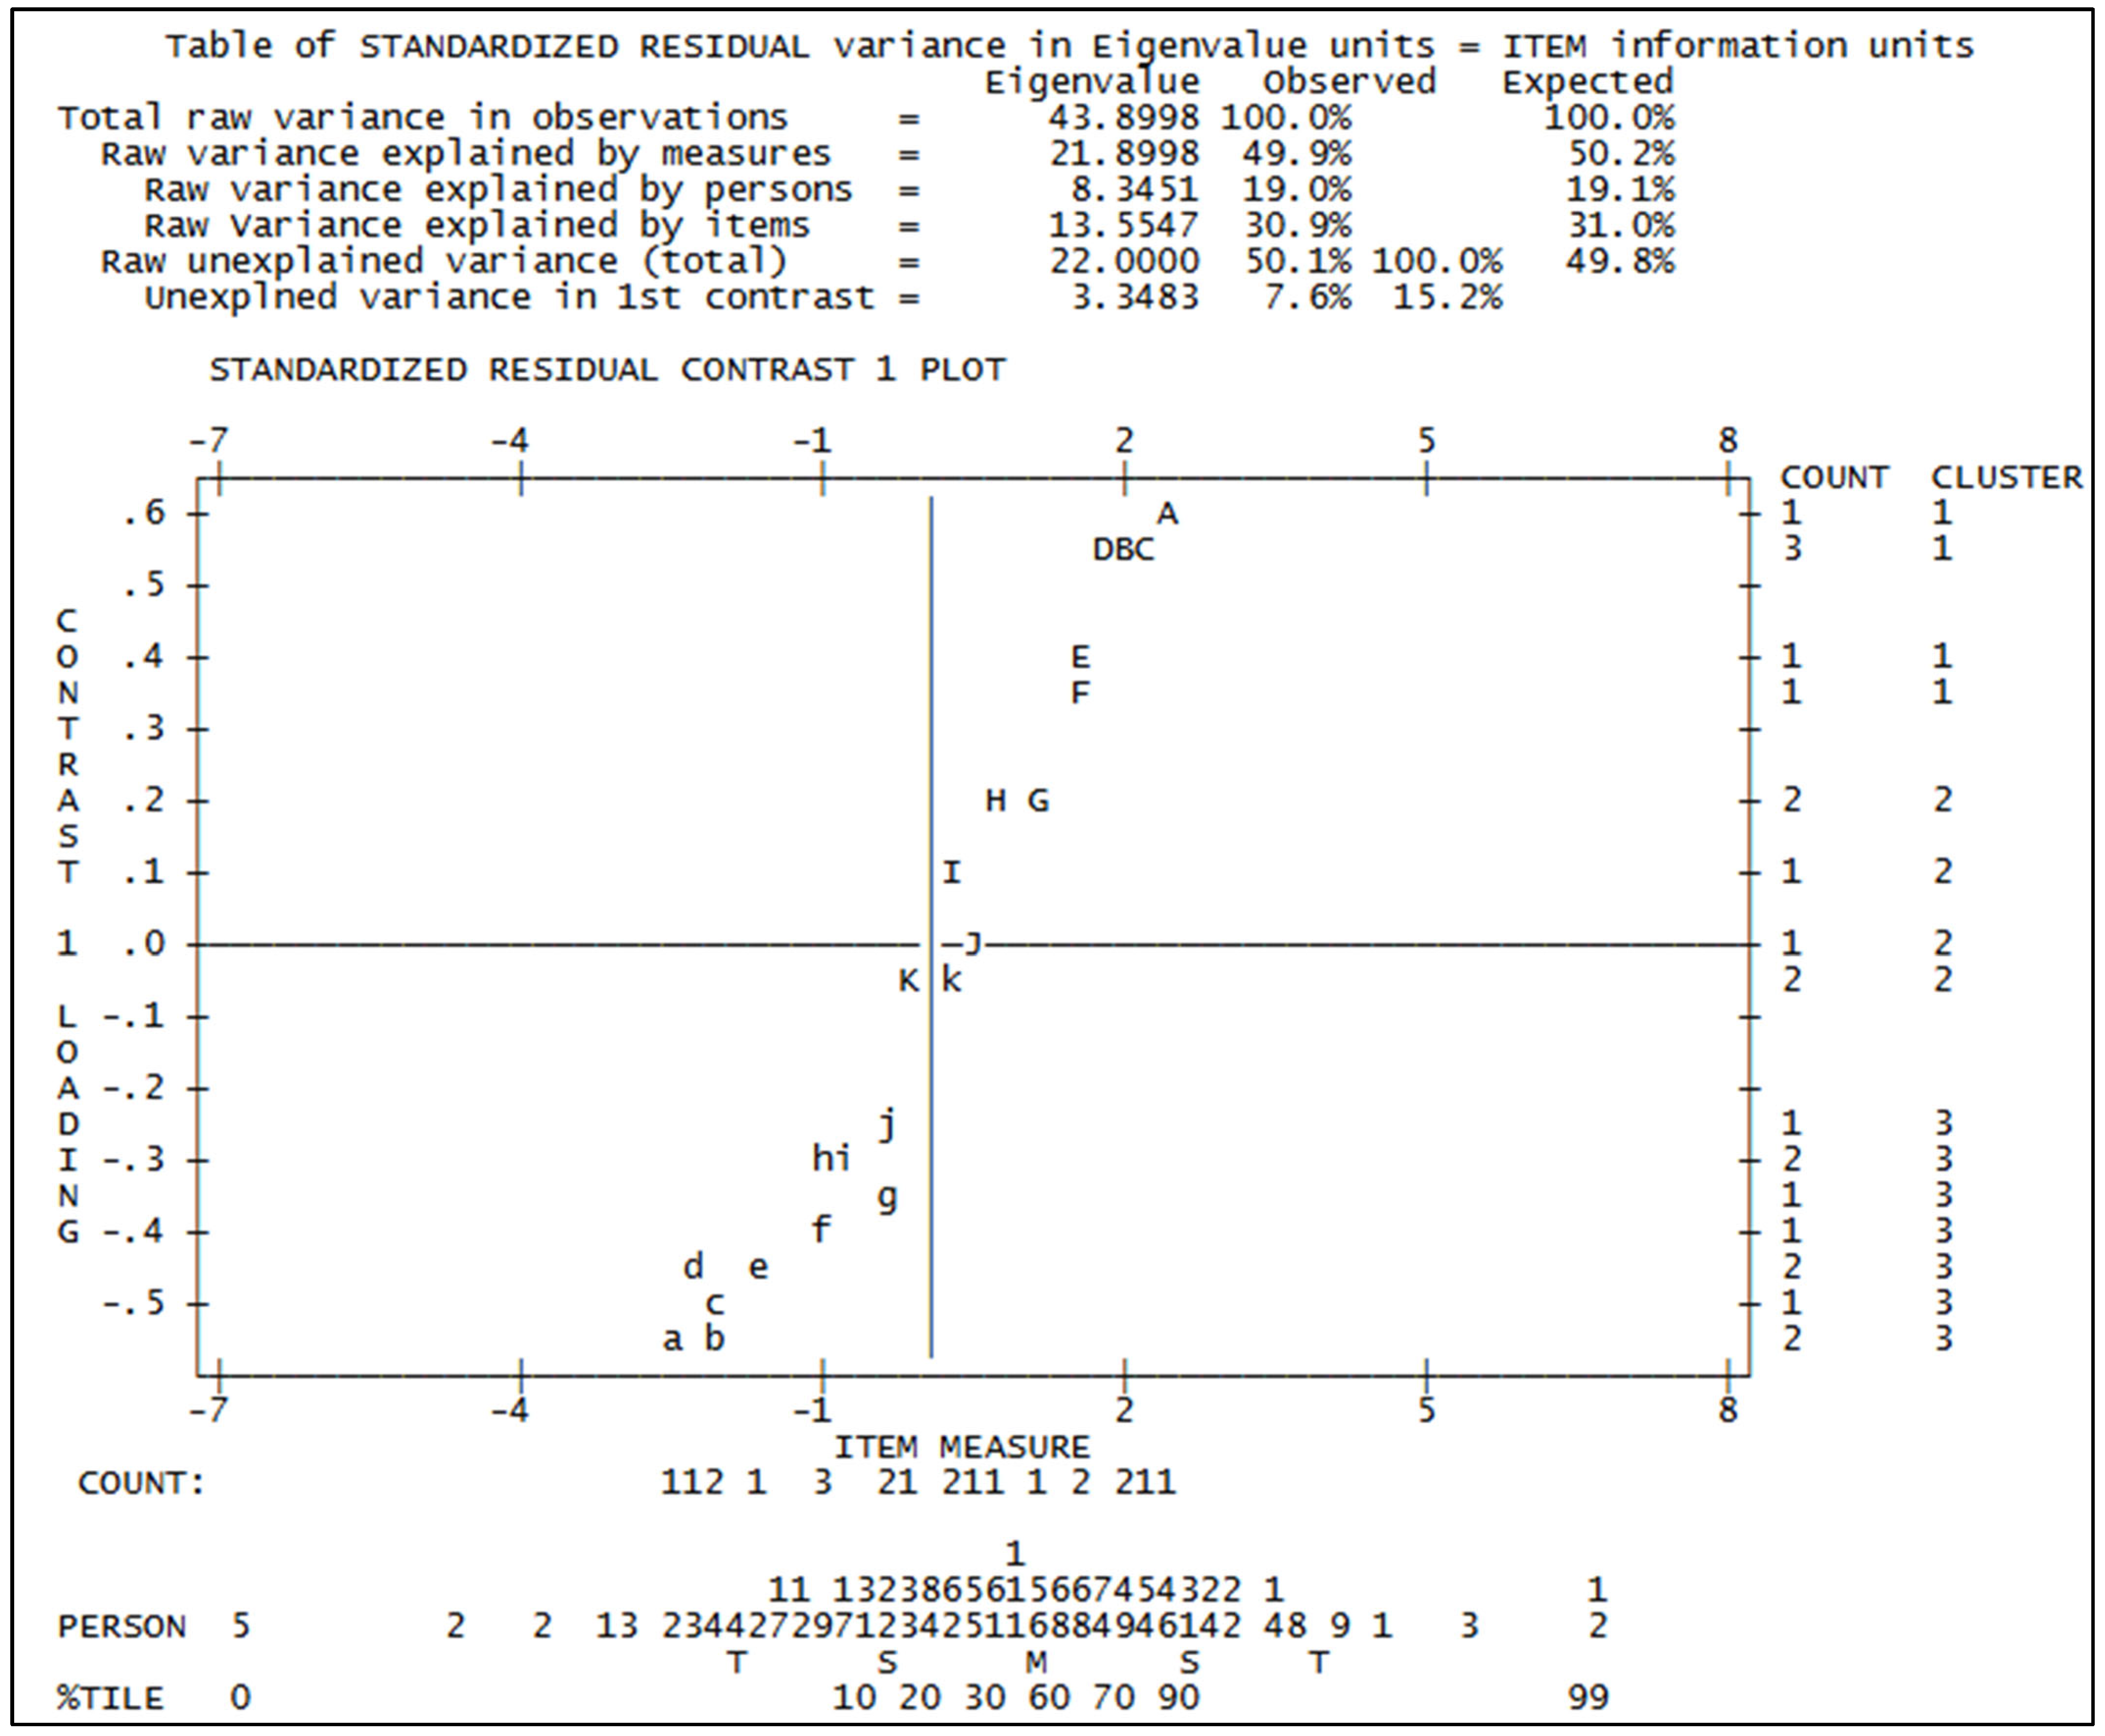
As for the second issue, within a dataset conforming to the Rasch model, the overall variability is influenced by both the model itself and residual variability stemming from random factors. The Rasch “Principal Component Analysis (PCA) of residuals” is employed to identify patterns within the data attributed to randomness. This identified pattern represents the “unexpected” portion of the data, which might arise from various factors, including the possible existence of multiple dimensions in the dataset [
26,
27].
In the Rasch model, Principal Component Analysis (PCA) of residuals is used to detect potential secondary dimensions by identifying patterns of shared unpredictability among items. This involves analyzing the correlation matrix of item residuals to find any contrasts—principal components that may influence response behavior.
A key indicator is the strength of the first contrast, measured by its eigenvalue. If this value is around 2 or less, the data can be considered unidimensional. However, a significantly higher eigenvalue suggests multidimensionality. In such cases, items are grouped based on their loadings, and the Rasch model is applied separately to each cluster to explore possible distinct latent traits. Following the guidance of Linacre (2011) [
23], if these correlations approach 1, it indicates that the items can be viewed as belonging to a single dimension. Conversely, if the correlations are exceedingly low (<0.30), it may be advisable to partition the items and exclude those that appear incongruent with the dimension of interest.
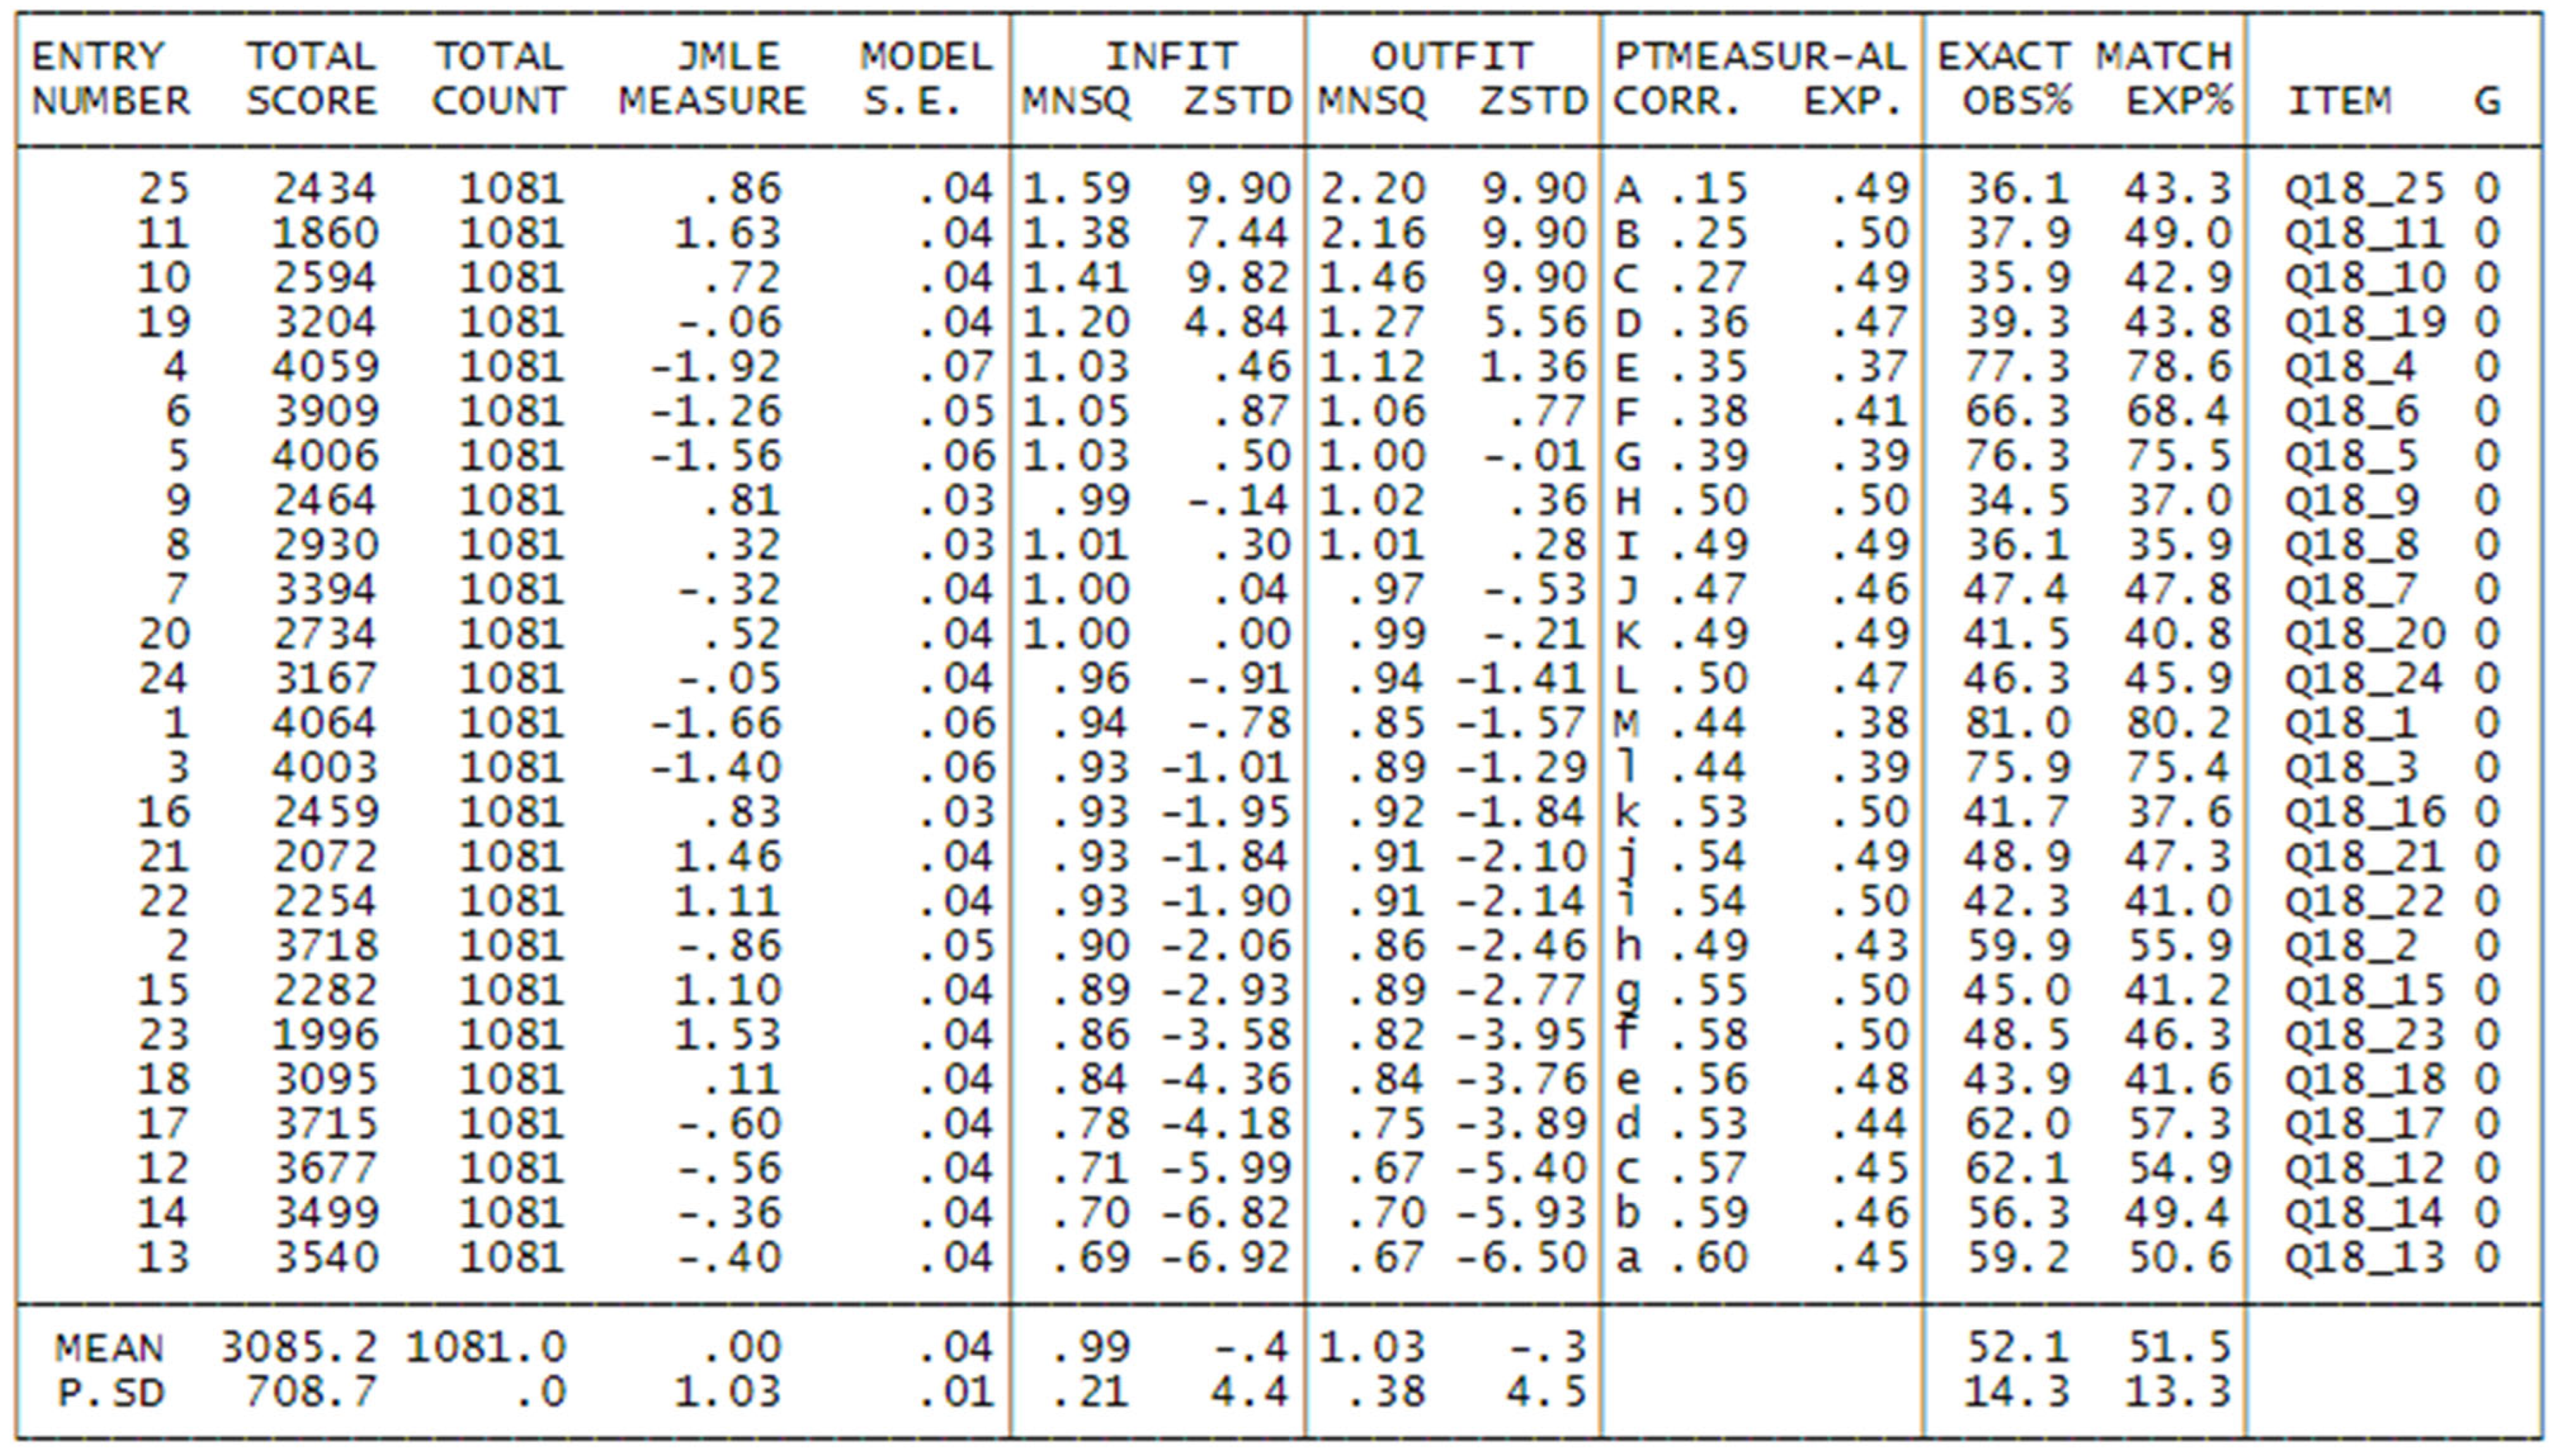
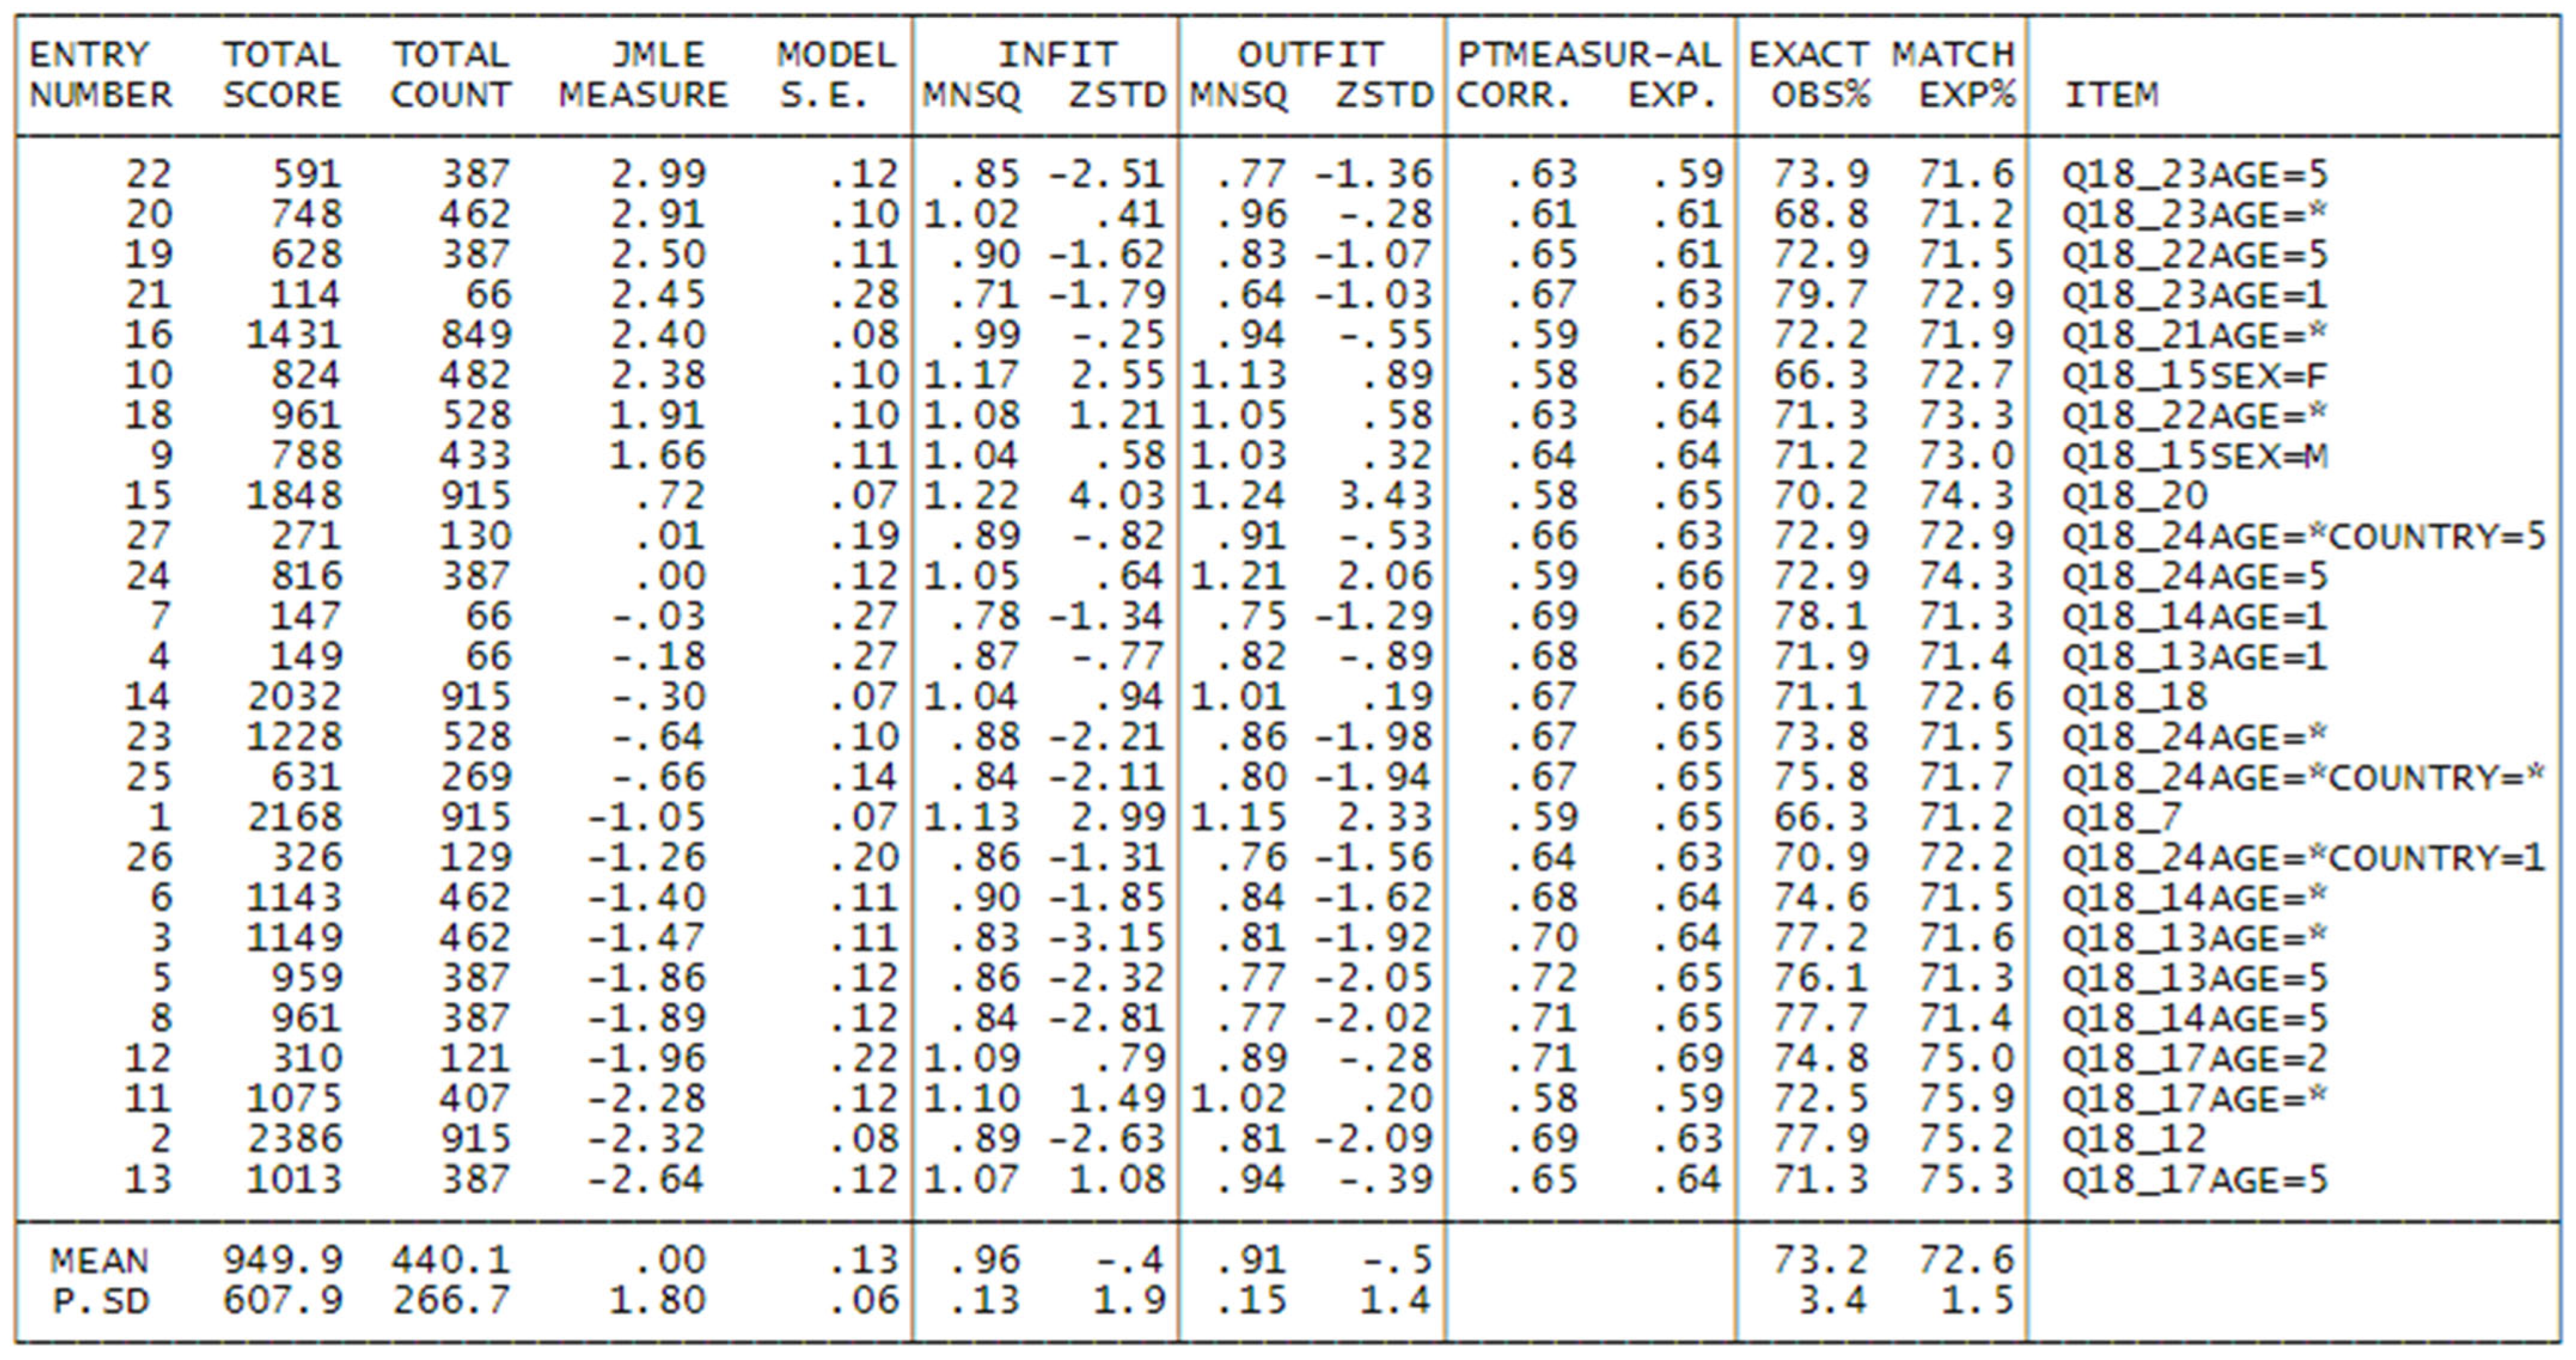
After addressing and resolving these concerns, an examination of fit statistics will provide an assessment of the extent to which participants and items align with our expectations derived from the model. These fit statistics essentially offer a summary of all the residuals, representing the disparities between observed responses and anticipated responses, for each item and individual. The resulting values can range from zero to infinity. Values exceeding 1 signify greater variability than anticipated, whereas values below 1 suggest lower variability than estimated. Values around 1 indicate that the data align reasonably well with the model.
The fit statistics are categorized into two groups: a weighted category referred to as Infit and an unweighted category known as Outfit. For recommended practice intervals, [
21] provide guidelines, and in our analysis, we adhered to Linacre’s (2011) [
23] suggestions, specifically in the range of 0.5–1.5 for items. Participants who do not conform to the expected fit should be excluded from the model to enhance the validity of the obtained results. In our approach, we opted to retain individuals with Infit or Outfit < 3. Individuals with higher fit values are likely to have responded at random, as may happen in such a kind of survey.
Subsequently, an evaluation of the overall fit of the model is conducted, with a focus on the reliability and separation indexes for both items and individuals. Reliability values > 0.80 and separation values > 3 serve as indicators of a well-fitting scale. These values signify how effectively this group of respondents has distributed responses across the items along the measurement of the test, thereby defining a meaningful dimension.
