
Enhancement of Anti-Staling Properties of Rice Bread Through Fermentation Rice Flour with Three Lactic Acid Bacteria


Abstract
1. Introduction
2. Materials and Methods
2.1. Materials
2.2. Preparation of Fermented Rice Flour and Rice Bread (RB)
2.2.1. Microorganisms Culture
2.2.2. Preparation of Fermented Rice Flour
2.3. Production Process of Fermented Rice Bread
2.4. RB Crumbs Moisture
2.5. Low-Field NMR (LF-NMR)
2.6. Specific Loaf Volume (SLV)
2.7. Determination of Porosity
2.8. Determination of Sensory Evaluation
2.9. Statistical Analysis
3. Results and Discussions
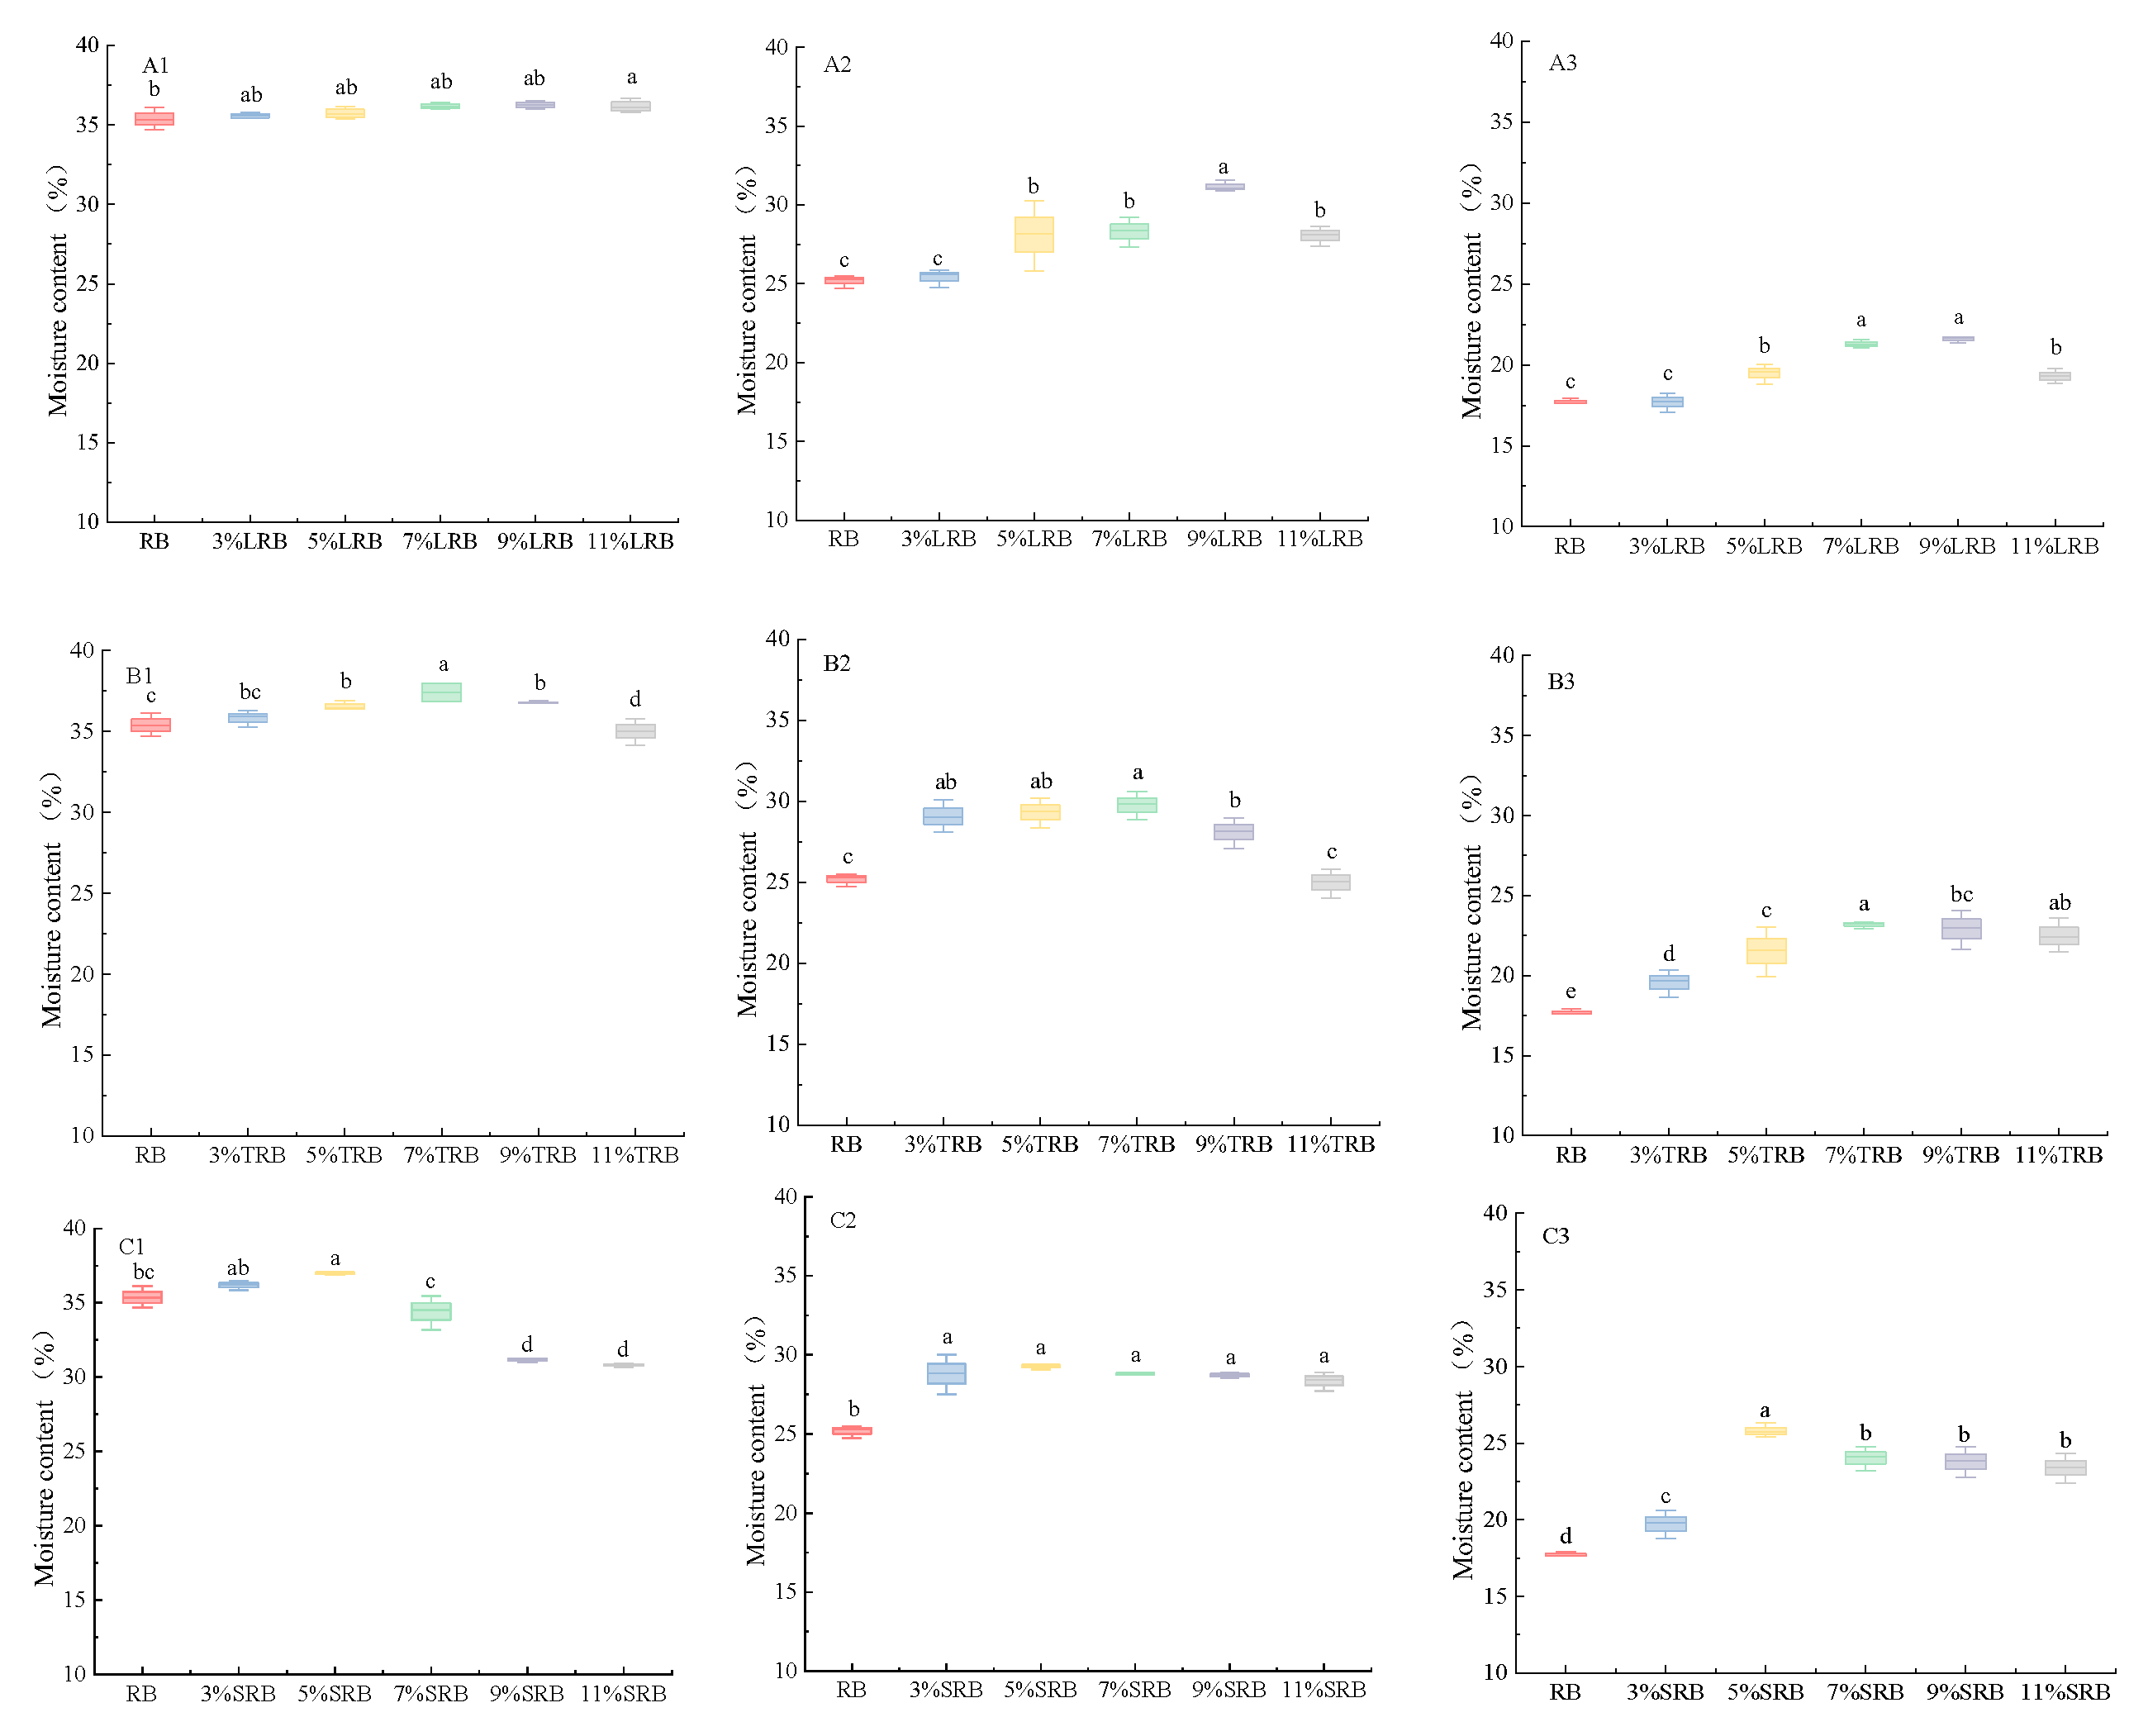
3.1. Moisture Content
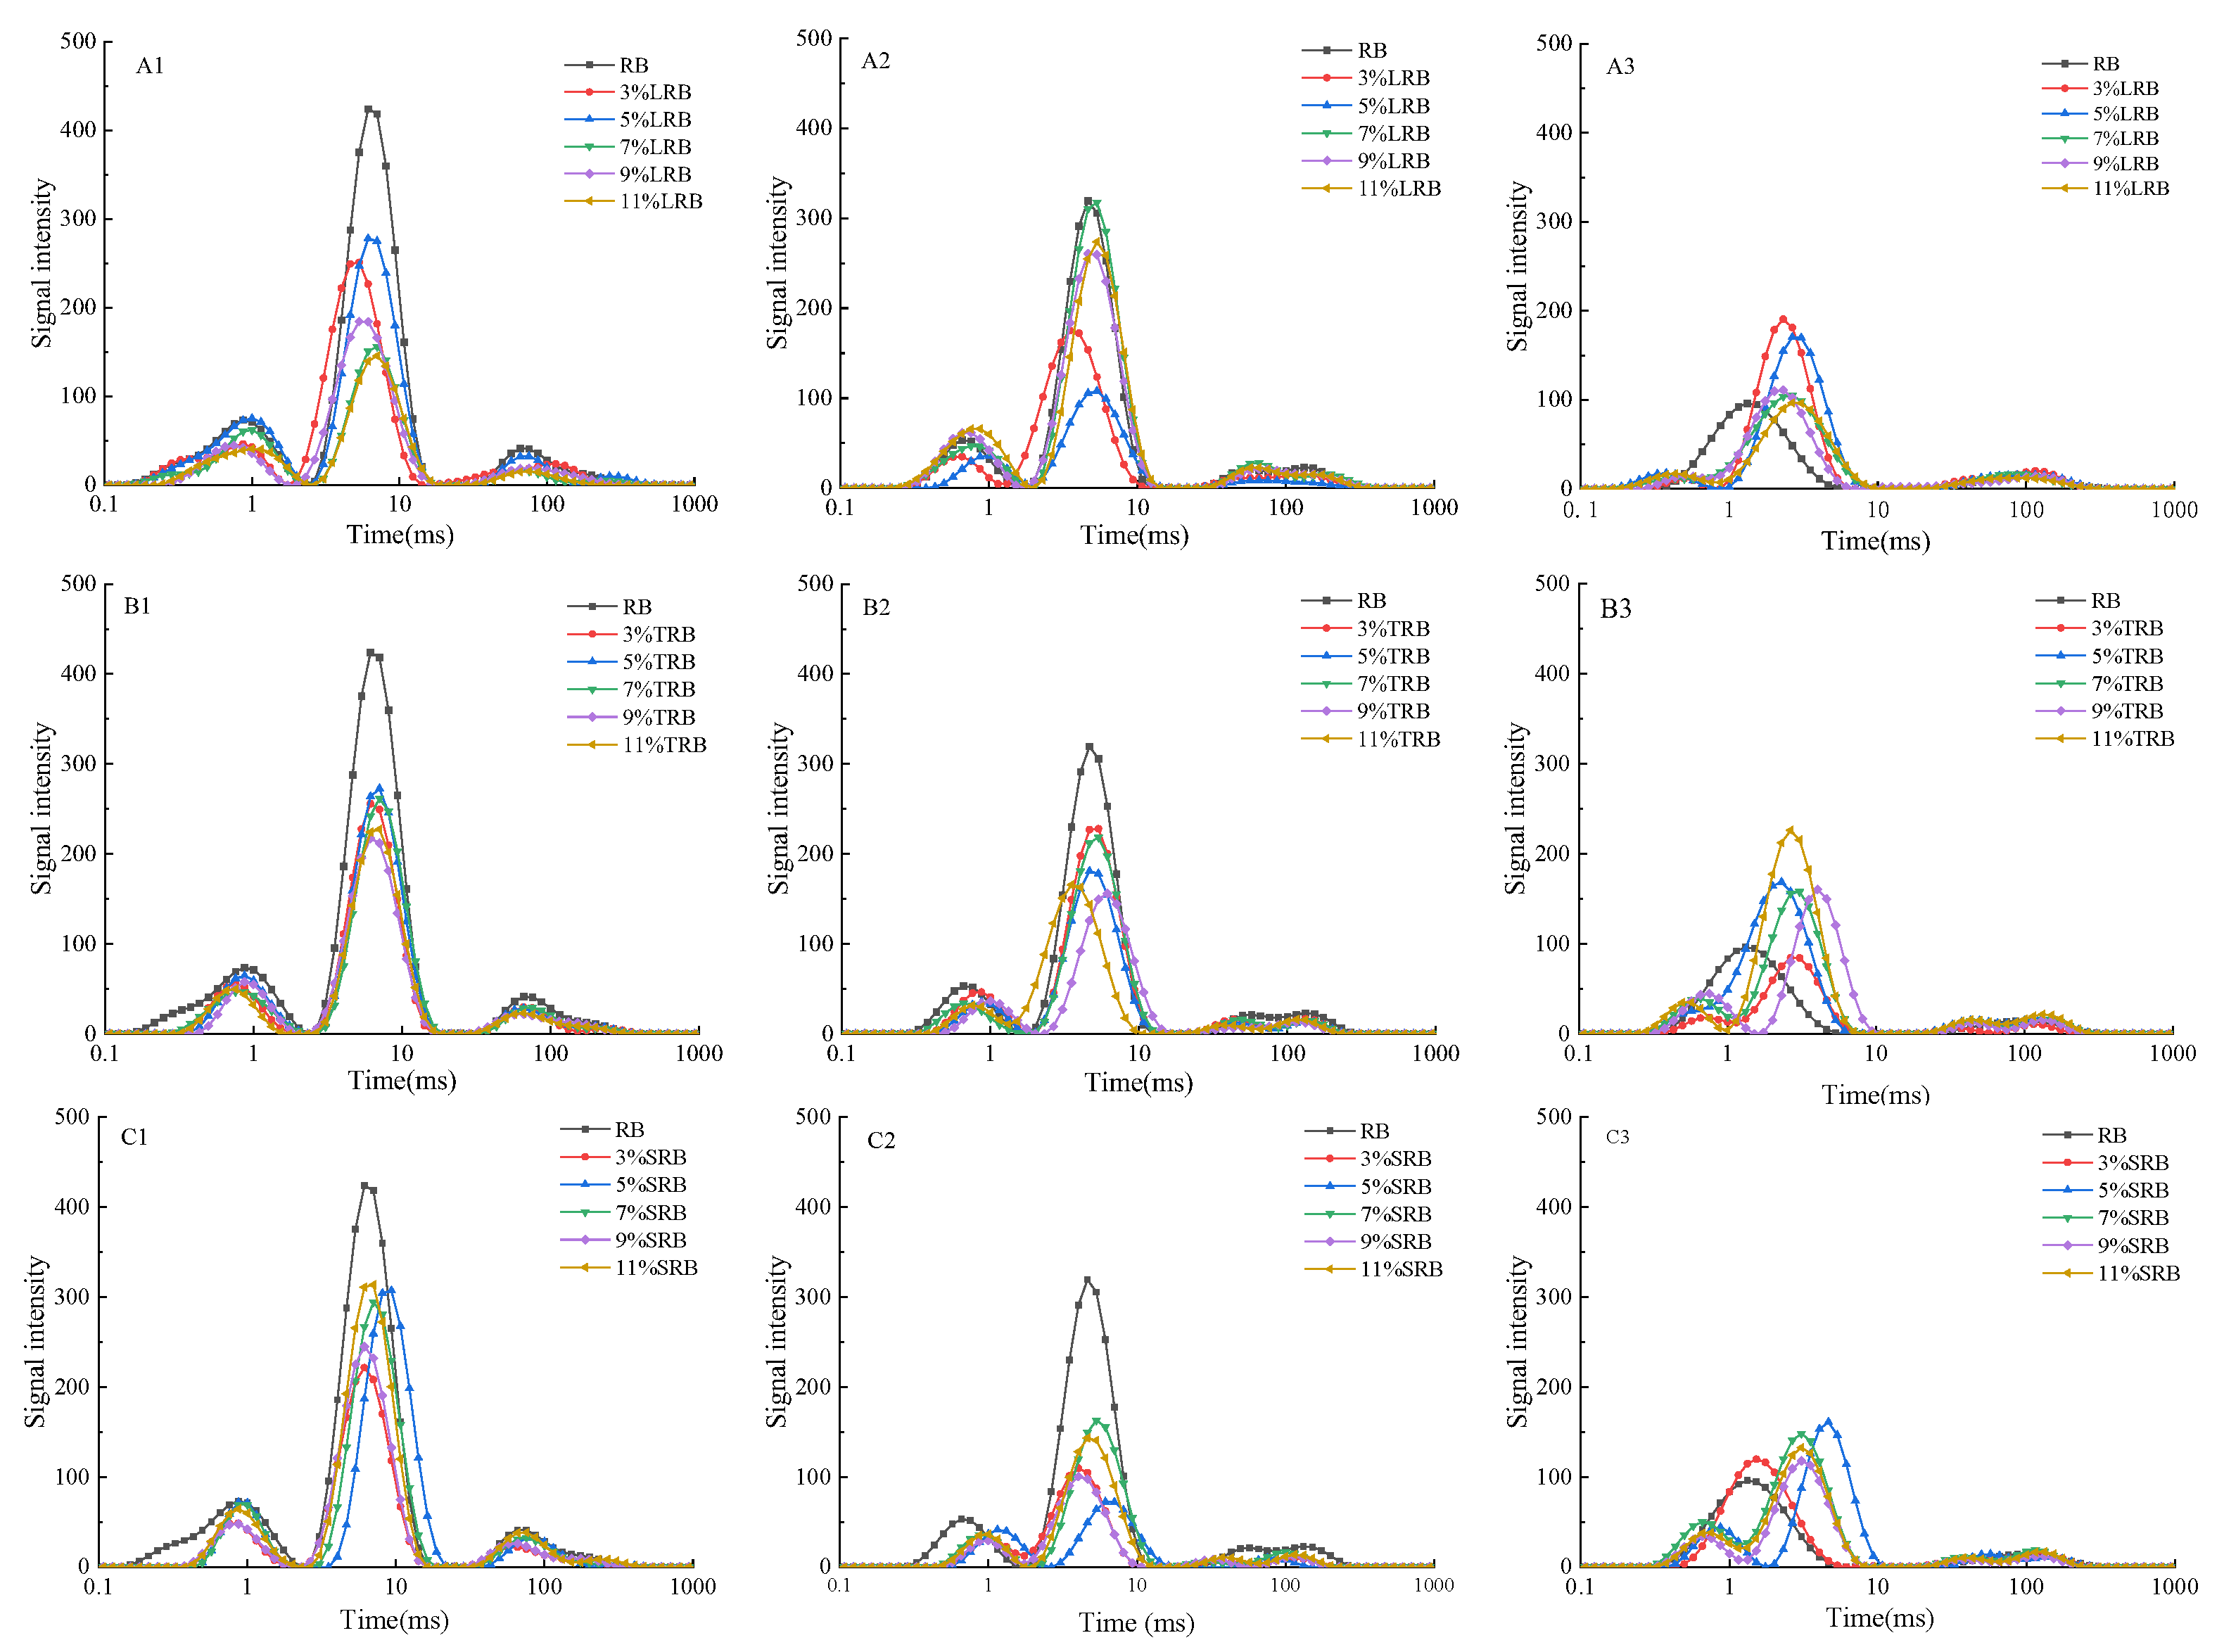
3.2. Water Migration
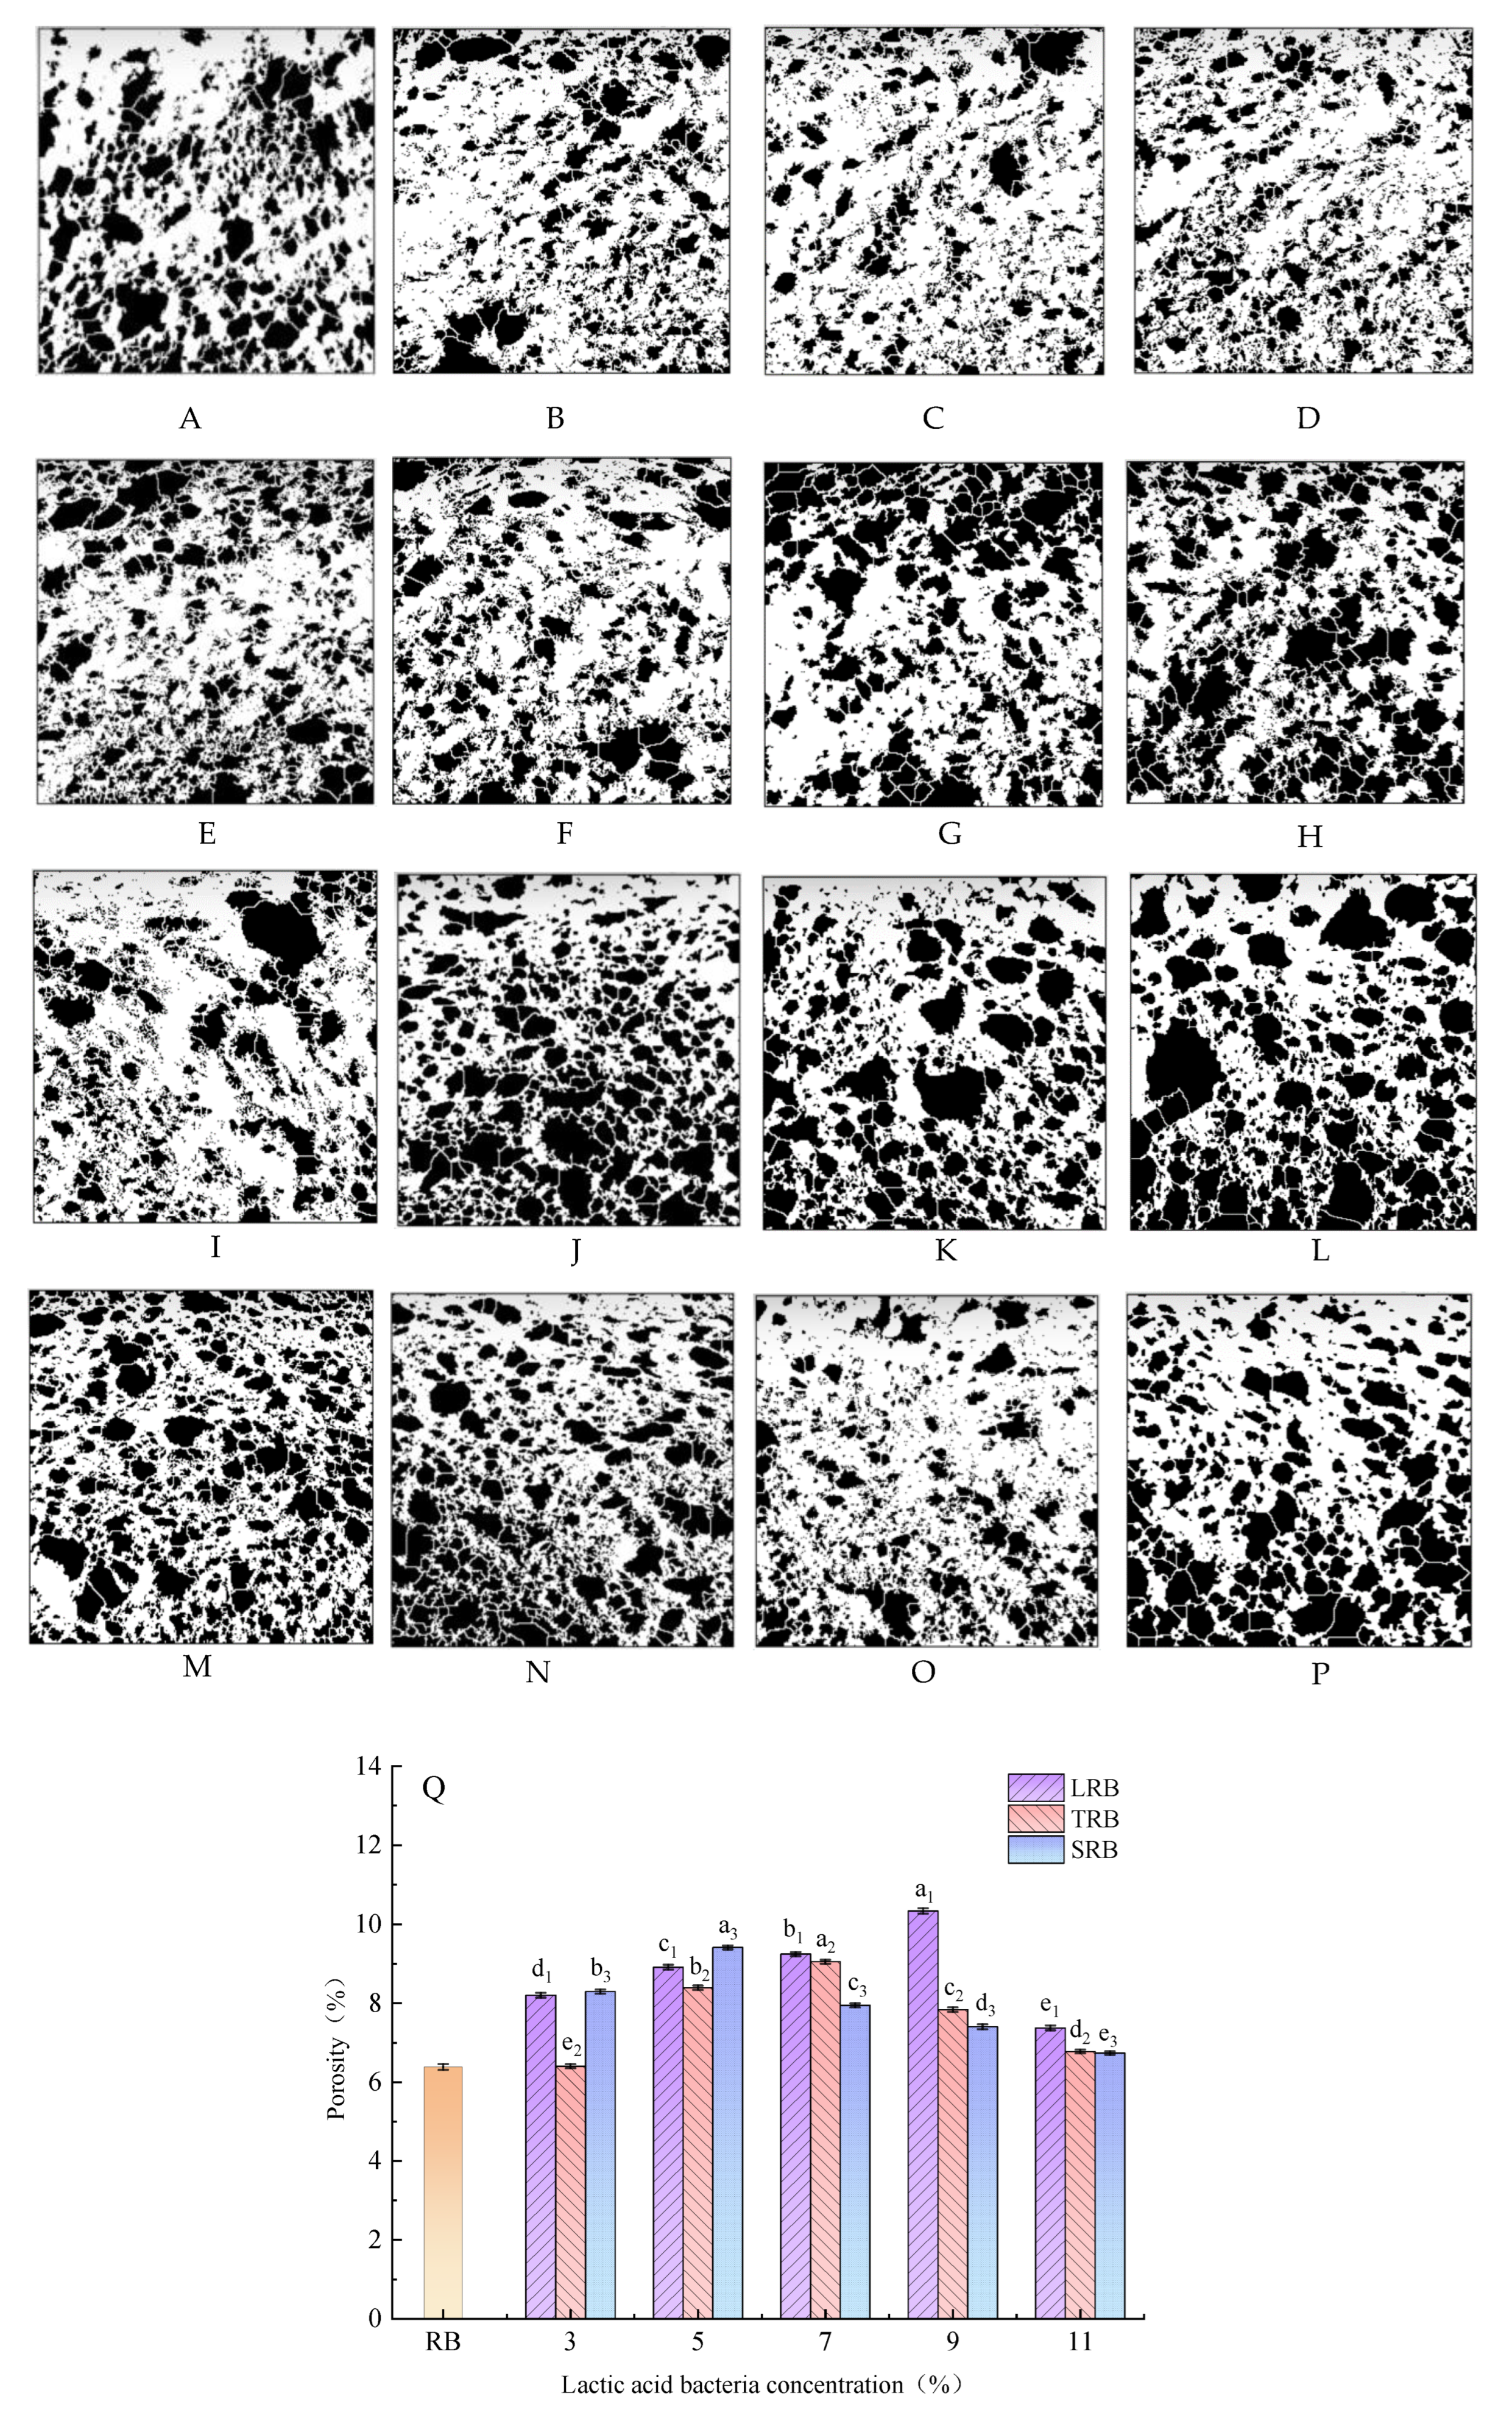
3.3. Porosity
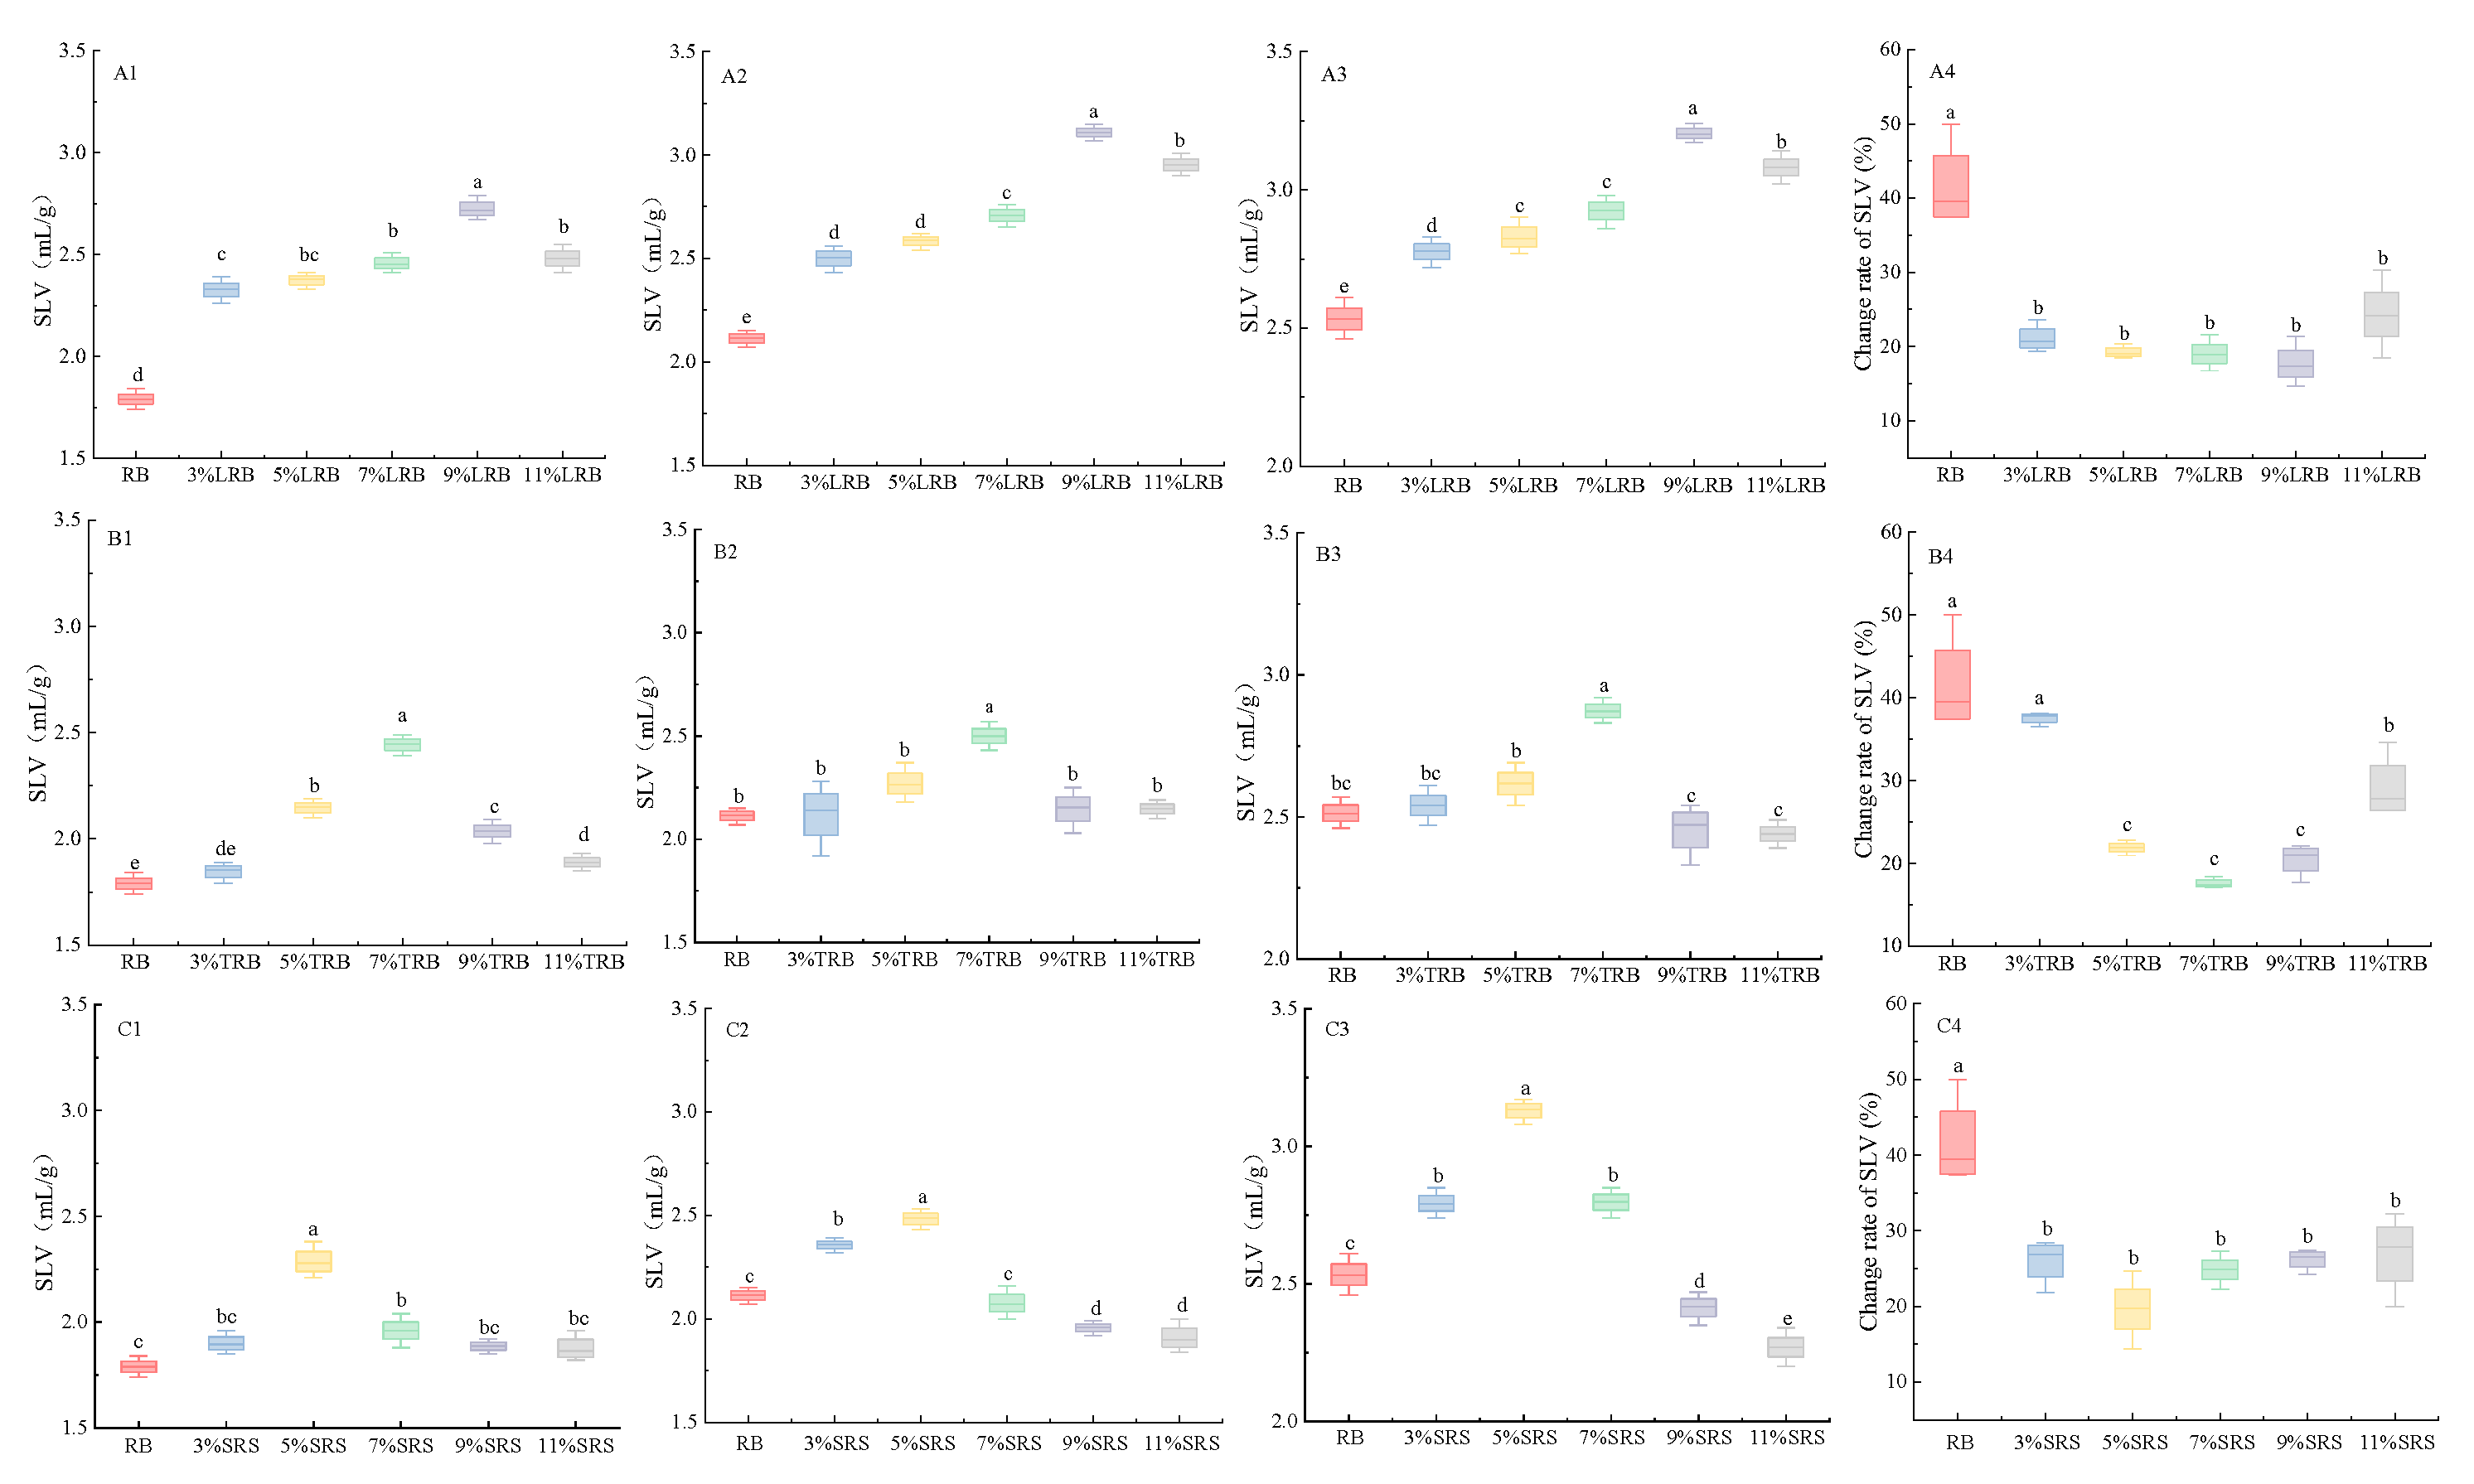
3.4. SLV
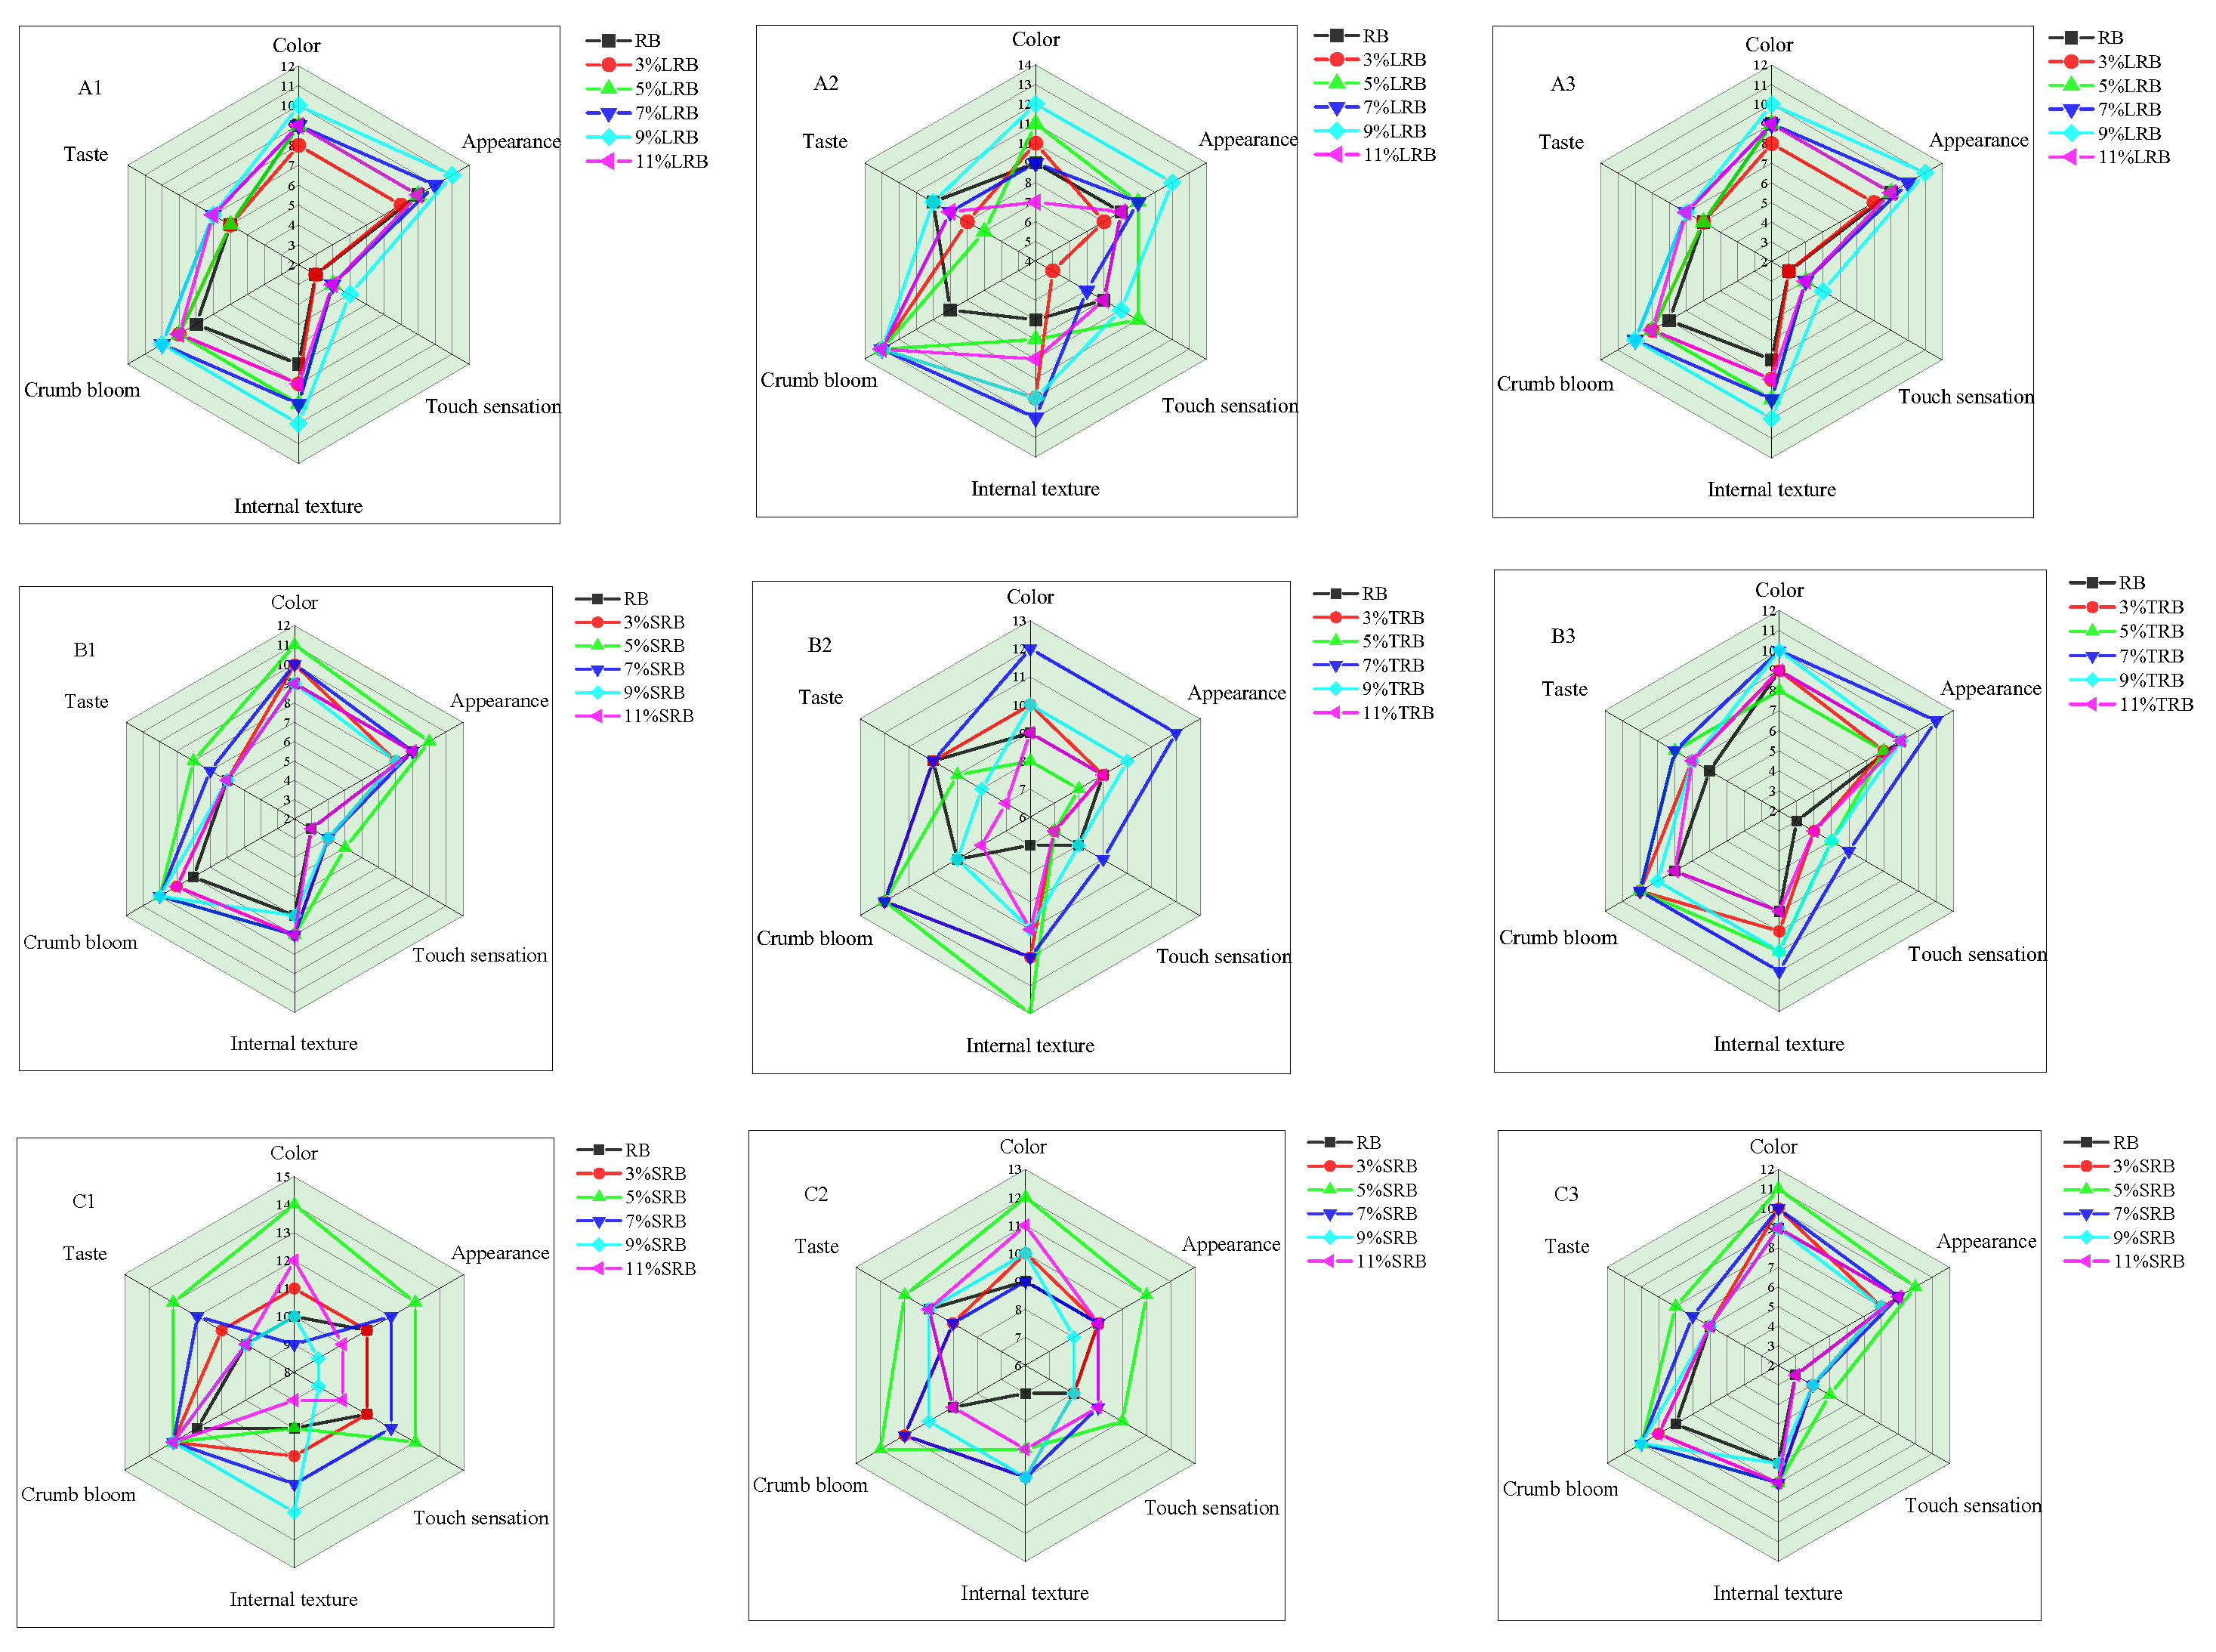
3.5. Sensory Evaluation
4. Conclusions
Author Contributions
Funding
Institutional Review Board Statement
Informed Consent Statement
Data Availability Statement
Conflicts of Interest
References
- Geng, D.-H.; Tang, N.; Zhang, X.; Zhao, M.; Jia, X.; Cheng, Y. Insights into the textural properties and starch digestibility on rice noodles as affected by the addition of maize starch and rice starch. LWT 2022, 173, 114265. [Google Scholar] [CrossRef]
- Honda, Y.; Saito, Y.; Katsumi, N.; Nishikawa, M.; Takagi, H. Physicochemical properties of starch in rice flour with different hardening rates of glutinous rice cake (mochi). J. Cereal Sci. 2023, 112, 103687. [Google Scholar] [CrossRef]
- Itagi, H.B.; Sartagoda, K.J.D.; Gupta, N.; Pratap, V.; Roy, P.; Tiozon, R.N., Jr.; Regina, A.; Sreenivasulu, N. Enriched nutraceuticals in gluten-free whole grain rice cookies with alternative sweeteners. LWT 2023, 186, 115245. [Google Scholar] [CrossRef]
- Sivaramakrishnan, H.P.; Senge, B.; Chattopadhyay, P. Rheological properties of rice dough for making rice bread. J. Food Eng. 2004, 62, 37–45. [Google Scholar] [CrossRef]
- Ouyang, J.; Wang, C.; Huang, Q.; Guan, Y.; Zhu, Z.; He, Y.; Jiang, G.; Xiong, Y.; Li, X. Correlation between in vitro starch digestibility and starch structure/physicochemical properties in rice. Int. J. Biol. Macromol. 2024, 263, 130316. [Google Scholar] [CrossRef]
- Ma, M.; Mu, T.; Sun, H.; Zhou, L. Evaluation of texture, retrogradation enthalpy, water mobility, and anti-staling effects of enzymes and hydrocolloids in potato steamed bread. Food Chem. 2022, 368, 130686. [Google Scholar] [CrossRef] [PubMed]
- Zhang, M.; Xiao, S.; Gong, A.; Liu, X.; Wu, Y.; Du, J.; Ding, W.; Fu, Y.; Wang, X. Effect of lactosucrose on the evaluation of visual appearance, texture, water mobility, microstructure and inhibition of staling in wheat bread. Int. J. Food Sci. Technol. 2022, 57, 3862–3871. [Google Scholar] [CrossRef]
- Hayes, A.M.; Okoniewska, M.; Martinez, M.M.; Zhao, B.; Hamaker, B.R. Investigating the potential of slow-retrograding starches to reduce staling in soft savory bread and sweet cake model systems. Food Res. Int. 2020, 138, 109745. [Google Scholar] [CrossRef]
- Ai, J.; Witt, T.; Cowin, G.; Dhital, S.; Turner, M.S.; Stokes, J.R.; Gidley, M.J. Anti-staling of high-moisture starchy food: Effect of hydrocolloids, emulsifiers and enzymes on mechanics of steamed-rice cakes. Food Hydrocoll. 2018, 83, 454–464. [Google Scholar] [CrossRef]
- Liu, S.; Sun, H.; Nagassa, M.; He, X.; Pei, H.; Gao, L.; Li, X.; He, S. Enhancing bread anti-staling with glucose-derived Maillard reaction products: In-depth analysis of starches, gluten networks, and moisture status. Food Chem. 2024, 455, 139760. [Google Scholar] [CrossRef] [PubMed]
- Yunos, N.S.H.M.; Hafid, H.S.; Omar, F.N.; Mohammed, M.A.P.; Wakisaka, M.; Mustapha, N.A.; Baharuddin, A.S. Microwave-assisted treatment for the improvement of rice flour properties and rice flour bread quality. Int. J. Food Sci. Technol. 2024, 59, 9157–9169. [Google Scholar] [CrossRef]
- Zhang, N.; Wang, H.; Korma, S.A.; An, P.; Li, L. Improvement of anti-staling ability and flavor characterization of whole-wheat bread by Lactobacillus amylolyticus L6 fermentation. Food Biosci. 2025, 65, 106076. [Google Scholar] [CrossRef]
- Xu, Z.; Xu, D.; Jin, Y.; Zhang, H.; Wu, F.; Zhang, J.; Xu, X. Processing properties of wheat dough mediated by proteoglycan extracted from the liquid fermented Ganoderma Lucidum. Food Biosci. 2024, 63, 105602. [Google Scholar] [CrossRef]
- Mygdalia, A.S.; Nouska, C.; Hatzikamari, M.; Biliaderis, C.G.; Lazaridou, A. A sourdough process based on fermented chickpea extract as leavening and anti-staling agent for improving the quality of gluten-free breads. Food Res. Int. 2022, 159, 111593. [Google Scholar] [CrossRef]
- Shompoosang, S.; Marui, J.; Varichanan, P.; Dueramae, S.; Panthavee, W. Improving the texture and color of khanomjeen, a Thai fermented rice noodle, using a modified rice fermentation method. Food Sci. Technol. Res. 2022, 28, 95–103. [Google Scholar] [CrossRef]
- Chittrakhani, C.; Songsermpong, S.; Trevanich, S.; Sukor, R. Effect of Levilactobacillus brevis TISTR 860 and Lactiplantibacillus plantarum TISTR 951 on gamma-aminobutyric acid content in fermented rice flour and rice noodles (Kanomjeen). Int. J. Food Sci. Technol. 2022, 57, 3410–3418. [Google Scholar] [CrossRef]
- American Association of Cereal Chemists (AACC). Approved methods of the AACC, 10th ed.; Cereals & Grains Association: Saint Paul, MN, USA, 2000. [Google Scholar]
- Jafari, M.; Koocheki, A.; Milani, E. Physicochemical and sensory properties of extruded sorghum–wheat composite bread. J. Food Meas. Charact. 2017, 12, 370–377. [Google Scholar] [CrossRef]
- Chaquilla-Quilca, G.; Islas-Rubio, A.R.; Vásquez-Lara, F.; Salcedo-Sucasaca, L.; Silva-Paz, R.J.; Luna-Valdez, J.G. Chemical, physical, and sensory properties of bread with popped amaranth flour. Pol. J. Food Nutr. Sci. 2024, 74, 137–146. [Google Scholar] [CrossRef]
- Jia, X.; Chen, Z.; Pan, Q.; Wang, Z.; Guo, C.; Jin, W.; Shen, W. Effect of extruded wheat bran on the volatility and physical–chemical properties of bread during frozen storage. Cereal Chem. 2024, 101, 847–857. [Google Scholar] [CrossRef]
- Zhang, Y.; Yang, T.; Zhou, J.; Yu, J.; Wang, J.; Qiang, S.; Wang, Y.; Li, S.; Chen, Y. Effect of water content on rice starch gel during retrogradation. Starch-Starke 2024, 76, 2200268. [Google Scholar] [CrossRef]
- Illueca, F.; Moreno, A.; Calpe, J.; Nazareth, T.d.M.; Dopazo, V.; Meca, G.; Quiles, J.M.; Luz, C. Bread biopreservation through the addition of lactic acid bacteria in sourdough. Foods 2023, 12, 864. [Google Scholar] [CrossRef]
- Chiodetti, M.; Monica, S.; Bancalari, E.; Bottari, B.; Fuso, A.; Prandi, B.; Tedeschi, T.; Carini, E. Effect of fermentation with selected lactic acid bacteria strains on the molecular and technological properties of sorghum batters. Food Chem. 2025, 484, 144350. [Google Scholar] [CrossRef]
- Dou, X.; Ren, X.; Zheng, Q.; He, Y.; Lv, M.; Liu, L.; Yang, P.; Hao, Y.; Chen, F.; Tang, X. Effects of lactic acid bacteria fermentation on the physicochemical properties of rice flour and rice starch and on the anti-staling of rice bread. Foods 2023, 12, 3818. [Google Scholar] [CrossRef]
- Hou, L.; Zhao, B.; Fu, S.; Liu, T.; Liu, X.; Li, H. Effects of curdlan on the quality of frozen steamed bread: Quality changes, water state and starch crystallinity. Int. J. Food Sci. Technol. 2024, 59, 6611–6618. [Google Scholar] [CrossRef]
- Wang, H.; Han, P.; Zhang, P.; Li, Y. Influence of yeast concentrations and fermentation durations on the physical properties of white bread. LWT 2024, 198, 116063. [Google Scholar] [CrossRef]
- Azizi, S.; Azizi, M.H. Evaluation of producing gluten-free bread by utilizing amaranth and lipase and protease enzymes. J. Food Sci. Technol. 2023, 60, 2213–2222. [Google Scholar] [CrossRef]
- Shang, J.; Xie, S.; Yang, S.; Duan, B.; Liu, L.; Meng, X. Steamed multigrain bread prepared from dough fermented with lactic acid bacteria and its effect on type 2 diabetes. Foods 2023, 12, 2319. [Google Scholar] [CrossRef]
- Hu, Y.; Zhang, J.; Wang, S.; Liu, Y.; Li, L.; Gao, M. Lactic acid bacteria synergistic fermentation affects the flavor and texture of bread. J. Food Sci. 2022, 87, 1823–1836. [Google Scholar] [CrossRef] [PubMed]
- Sha, H.Y.; Wang, Q.Q.; Li, Z.J. Comparison of the effect of exopolysaccharide-producing lactic acid bacteria from sourdough on dough characteristics and steamed bread quality. Int. J. Food Sci. Technol. 2022, 58, 378–386. [Google Scholar] [CrossRef]
- Yang, Q.; Rutherfurd-Markwick, K.; Mutukumira, A.N. Identification of dominant lactic acid bacteria and yeast in rice sourdough produced in New Zealand. Curr. Res. Food Sci. 2021, 4, 729–736. [Google Scholar] [CrossRef] [PubMed]
- Xing, X.; Suo, B.; Yang, Y.; Li, Z.; Nie, W.; Ai, Z. Application of lactobacillus as adjunct cultures in wheat dough fermentation. J. Food Sci. 2019, 84, 842–847. [Google Scholar] [CrossRef] [PubMed]
- Ketabi, A.; Soleimanian-Zad, S.; Kadivar, M.; Sheikh-Zeinoddin, M. Production of microbial exopolysaccharides in the sourdough and its effects on the rheological properties of dough. Food Res. Int. 2008, 41, 948–951. [Google Scholar] [CrossRef]
- Korakli, M.; Rossmann, A.; Gänzle, M.G.; Vogel, R.F. Sucrose metabolism and exopolysaccharide production in wheat and rye sourdoughs by Lactobacillus sanfranciscensis. J. Agric. Food Chem. 2001, 49, 5194–5200. [Google Scholar] [CrossRef]
- Thomas, R.M.; Falegan, C.R.; Olojede, A.O.; Oludipe, E.O.; Awarun, O.D.; Daodu, G.O. Nutritional and sensory quality of Ofada rice sourdough bread made with selected lactic acid bacteria strains. Heliyon 2023, 9, e20828. [Google Scholar] [CrossRef] [PubMed]
- Dan, H.; Gu, Z.; Li, C.; Fang, Z.; Hu, B.; Wang, C.; Chen, S.; Tang, X.; Ren, Y.; Wu, W.; et al. Effect of fermentation time and addition amount of rice sourdoughs with different microbial compositions on the physicochemical properties of three gluten-free rice breads. Food Res. Int. 2022, 161, 111889. [Google Scholar] [CrossRef] [PubMed]

| Storage Day | Sample | T2/ms | Relative Peak Area/% | ||||
|---|---|---|---|---|---|---|---|
| T21/ms | T22/ms | T23/ms | A21/% | A22/% | A23/% | ||
| 1d | RB | 0.87 ± 0.00 bc | 6.14 ± 0.00 b | 65.79 ± 7.18 a | 16.30 ± 1.97 c | 75.84 ± 2.62 a | 7.87 ± 0.65 a |
| 3%LRB | 0.87 ± 0.00 bc | 5.34 ± 0.00 c | 71.51 ± 37.65 c | 18.93 ± 0.76 c | 73.78 ± 1.76 a | 7.29 ± 2.32 a | |
| 5%LRB | 0.96 ± 0.08 ab | 6.14 ± 0.00 b | 69.08 ± 5.69 a | 25.06 ± 1.25 b | 67.79 ± 1.14 b | 7.14 ± 0.13 a | |
| 7%LRB | 1.00 ± 0.00 a | 7.05 ± 0.00 a | 65.79 ± 0.00 a | 29.33 ± 2.81 a | 64.07 ± 2.40 c | 6.60 ± 0.41 a | |
| 9%LRB | 0.83 ± 0.07 c | 5.60 ± 0.46 c | 63.36 ± 10.64 a | 29.91 ± 1.19 c | 62.55 ± 0.68 a | 7.54 ± 1.87 a | |
| 11%LRB | 1.00 ± 0.00 a | 7.05 ± 0.00 a | 72.36 ± 5.69 a | 26.20 ± 1.64 b | 65.90 ± 1.56 bc | 7.89 ± 0.13 a | |
| 4d | RB | 0.69 ± 0.06 cd | 4.64 ± 0.00 b | 57.22 ± 0.00 b | 13.40 ± 0.36 c | 80.79 ± 0.22 a | 5.81 ± 0.43 a |
| 3%LRB | 0.55 ± 0.11 d | 3.51 ± 0.00 c | 113.34 ± 32.65 a | 12.50 ± 1.55 c | 79.67 ± 2.16 b | 7.82 ± 3.52 a | |
| 5%LRB | 0.96 ± 0.08 a | 5.34 ± 0.00 a | 72.85 ± 12.23 b | 13.30 ± 1.39 a | 78.10 ± 1.59 c | 8.60 ± 0.32 a | |
| 7%LRB | 0.87 ± 0.12 ab | 5.34 ± 0.00 a | 62.94 ± 4.95 b | 14.09 ± 0.34 c | 79.08 ± 0.40 c | 6.83 ± 0.73 a | |
| 9%LRB | 0.76 ± 0.11 bc | 5.11 ± 0.40 a | 60.08 ± 4.95 b | 18.48 ± 1.18 b | 74.64 ± 0.82 d | 6.88 ± 1.96 a | |
| 11%LRB | 0.83 ± 0.07 abc | 5.34 ± 0.00 a | 62.94 ± 4.95 b | 17.73 ± 0.30 a | 75.70 ± 0.55 dc | 6.57 ± 0.38 a | |
| 7d | RB | 0.52 ± 0.00 b | 3.33 ± 0.00 a | 100.00 ± 0.00 b | 0.06 ± 0.02 d | 85.72 ± 0.05 a | 14.22 ± 0.64 a |
| 3%LRB | 0.48 ± 0.04 b | 2.31 ± 0.00 c | 111.38 ± 22.82 a | 2.54 ± 2.15 c | 87.11 ± 3.06 a | 10.35 ± 4.40 ab | |
| 5%LRB | 0.42 ± 0.07 b | 2.79 ± 0.23 b | 121.46 ± 18.59 a | 6.97 ± 0.43 b | 83.57 ± 2.39 ab | 9.46 ± 2.01 b | |
| 7%LRB | 0.48 ± 0.08 b | 2.66 ± 0.00 b | 100.65 ± 14.01 a | 7.41 ± 2.78 ab | 79.94 ± 1.27 bc | 12.64 ± 1.60 ab | |
| 9%LRB | 0.43 ± 0.12 b | 2.21 ± 0.17 c | 114.98 ± 0.00 a | 9.50 ± 1.83 b | 77.02 ± 1.80 bc | 13.48 ± 0.04 ab | |
| 11%LRB | 0.45 ± 0.04 b | 2.66 ± 0.00 b | 96.31 ± 16.17 a | 8.37 ± 2.00 a | 79.94 ± 2.35 c | 11.69 ± 2.05 ab | |
| Storage Day | Sample | T2/ms | Relative Peak Area/% | ||||
|---|---|---|---|---|---|---|---|
| T21/ms | T22/ms | T23/ms | A21/% | A22/% | A23/% | ||
| 1d | RB | 0.87 ± 0.00 ab | 6.14 ± 0.00 a | 65.79 ± 0.00 b | 16.30 ± 1.97 c | 75.84 ± 2.62 a | 7.87 ± 0.65 a |
| 3%TRB | 0.76 ± 0.00 c | 6.14 ± 0.00 a | 65.79 ± 0.00 b | 16.55 ± 0.07 b | 75.27 ± 0.16 a | 8.18 ± 0.17 c | |
| 5%TRB | 0.91 ± 0.08 a | 7.05 ± 0.00 a | 65.79 ± 0.00 b | 17.85 ± 0.16 a | 73.62 ± 0.74 cd | 8.53 ± 0.58 bc | |
| 7%TRB | 0.79 ± 0.07 bc | 7.05 ± 0.00 a | 75.65 ± 0.00 a | 16.57 ± 0.35 b | 74.31 ± 0.26 bc | 9.12 ± 0.58 b | |
| 9%TRB | 0.87 ± 0.00 ab | 6.14 ± 0.00 a | 62.94 ± 4.95 b | 16.64 ± 0.18 b | 72.92 ± 0.24 d | 10.44 ± 0.06 a | |
| 11%TRB | 0.76 ± 0.00 c | 7.05 ± 0.20 a | 69.08 ± 5.69 ab | 15.71 ± 0.58 c | 75.01 ± 0.57 ab | 9.28 ± 0.59 b | |
| 4d | RB | 0.69 ± 0.06 c | 4.64 ± 0.00 a | 57.22 ± 0.00 b | 13.40 ± 0.36 c | 80.79 ± 0.22 a | 5.81 ± 0.43 a |
| 3%TRB | 0.87 ± 0.00 ab | 5.34 ± 0.00 a | 47.61 ± 3.74 b | 14.59 ± 0.40 ab | 80.44 ± 0.45 b | 4.97 ± 0.26 a | |
| 5%TRB | 0.83 ± 0.07 abc | 4.64 ± 0.00 a | 45.45 ± 3.74 b | 14.06 ± 0.59 b | 81.20 ± 0.47 ab | 4.74 ± 0.12 a | |
| 7%TRB | 0.76 ± 0.11 bc | 5.34 ± 0.15 a | 49.77 ± 0.00 b | 12.07 ± 0.58 c | 82.79 ± 0.20 a | 5.15 ± 0.41 a | |
| 9%TRB | 0.96 ± 0.08 a | 6.14 ± 0.00 a | 71.51 ± 37.65 b | 15.34 ± 0.40 a | 78.30 ± 1.64 c | 6.36 ± 2.03 a | |
| 11%TRB | 0.76 ± 0.00 bc | 3.51 ± 0.00 a | 120.72 ± 9.94 a | 11.79 ± 0.22 c | 82.32 ± 0.69 a | 5.89 ± 0.61 a | |
| 7d | RB | 0.52 ± 0.00 b | 3.33 ± 0.00 a | 100.00 ± 0.00 b | 0.06 ± 0.02 d | 85.72 ± 0.05 a | 14.22 ± 0.64 a |
| 3%TRB | 0.76 ± 0.00 b | 2.92 ± 0.23 c | 120.72 ± 9.94 a | 15.49 ± 1.17 b | 77.21 ± 1.28 b | 7.31 ± 0.64 a | |
| 5%TRB | 0.63 ± 0.05 c | 2.92 ± 0.23 c | 145.39 ± 11.43 a | 8.99 ± 0.56 c | 83.14 ± 0.02 ab | 7.87 ± 0.57 a | |
| 7%TRB | 0.53 ± 0.08 d | 2.31 ± 0.00 d | 138.79 ± 11.43 a | 20.07 ± 1.31 b | 73.69 ± 1.25 b | 6.25 ± 0.11 bc | |
| 9%TRB | 0.72 ± 0.06 b | 4.04 ± 0.00 b | 107.20 ± 43.28 a | 19.57 ± 0.80 a | 74.55 ± 0.86 c | 5.88 ± 0.09 c | |
| 11%TRB | 0.52 ± 0.04 d | 2.66 ± 0.00 c | 145.39 ± 11.43 a | 10.32 ± 0.57 c | 83.11 ± 0.56 ab | 6.57 ± 0.14 b | |
| Storage Day | Sample | T2 /ms | Relative Peak Area/% | ||||
|---|---|---|---|---|---|---|---|
| T21/ms | T22/ms | T23/ms | A21/% | A22/% | A23/% | ||
| 1d | RB | 0.87 ± 0.00 ab | 6.14 ± 0.00 c | 65.79 ± 0.00 b | 16.30 ± 1.97 c | 75.84 ± 2.62 a | 7.87 ± 0.65 a |
| 3%SRB | 0.87 ± 0.00 ab | 6.14 ± 0.00 c | 60.45 ± 9.25 b | 15.39 ± 0.26 a | 75.96 ± 1.15 a | 8.65 ± 1.38 a | |
| 5%SRB | 0.96 ± 0.08 a | 9.33 ± 0.00 a | 86.97 ± 0.00 a | 15.51 ± 0.21 a | 76.47 ± 0.14 a | 8.02 ± 0.09 a | |
| 7%SRB | 0.91 ± 0.08 ab | 7.05 ± 0.00 b | 72.36 ± 5.69 b | 15.32 ± 0.17 a | 75.80 ± 0.62 a | 8.88 ± 0.45 a | |
| 9%SRB | 0.79 ± 0.07 b | 6.14 ± 0.00 c | 65.79 ± 0.00 b | 14.67 ± 0.31 b | 76.73 ± 0.42 a | 8.59 ± 0.19 a | |
| 11%SRB | 0.83 ± 0.07 ab | 6.75 ± 0.53 b | 69.08 ± 5.69 b | 14.64 ± 0.39 b | 76.31 ± 0.43 a | 9.10 ± 0.29 a | |
| 4d | RB | 0.69 ± 0.06 c | 4.64 ± 0.00 c | 57.22 ± 0.00 c | 13.40 ± 0.36 c | 80.79 ± 0.22 a | 5.81 ± 0.43 bc |
| 3%SRB | 1.00 ± 0.00 b | 4.04 ± 0.00 c | 115.72 ± 6.11 b | 17.21 ± 1.26 b | 77.62 ± 1.55 ab | 5.16 ± 0.29 c | |
| 5%SRB | 0.911 ± 0.10 a | 3.94 ± 0.53 a | 86.97 ± 0.00 b | 31.93 ± 0.86 a | 61.65 ± 0.92 c | 6.42 ± 0.12 ab | |
| 7%SRB | 0.96 ± 0.08 b | 5.34 ± 0.00 b | 121.46 ± 8.59 a | 16.19 ± 1.30 b | 78.41 ± 0.26 a | 5.40 ± 1.04 bc | |
| 9%SRB | 1.00 ± 0.00 b | 4.24 ± 0.35 c | 100.65 ± 4.01 b | 17.58 ± 1.06 b | 75.71 ± 0.68 b | 6.71 ± 0.66 a | |
| 11% SRB | 0.91 ± 0.08 b | 4.64 ± 0.00 c | 114.98 ± 0.00 b | 15.92 ± 1.25 b | 78.14 ± 1.32 a | 5.93 ± 0.15 ab | |
| 7d | RB | 0.52 ± 0.00 b | 3.33 ± 0.00 a | 100.00 ± 0.00 b | 0.06 ± 0.02 d | 85.72 ± 0.05 a | 14.22 ± 0.64 a |
| 3%SRB | 1.52 ± 0.00 a | 9.79 ± 0.81 a | 126.45 ± 9.94 a | 0.48 ± 0.11 c | 91.37 ± 4.33 a | 8.15 ± 4.39 a | |
| 5%SRB | 0.71 ± 0.07 c | 3.04 ± 0.00 b | 54.74 ± 4.30 c | 18.98 ± 0.45 b | 74.88 ± 0.51 b | 6.14 ± 0.06 a | |
| 7%SRB | 0.72 ± 0.06 c | 3.05 ± 0.00 c | 133.05 ± 8.52 a | 18.79 ± 7.57 a | 73.90 ± 38.32 c | 7.31 ± 0.85 a | |
| 9%SRB | 0.72 ± 0.06 c | 3.05 ± 0.00 c | 114.96 ± 0.00 ab | 17.64 ± 0.06 b | 75.39 ± 0.56 b | 6.97 ± 0.55 a | |
| 11%SRB | 0.72 ± 0.06 c | 3.05 ± 0.00 c | 132.19 ± 0.00 a | 19.34 ± 2.18 b | 73.84 ± 2.02 b | 6.82 ± 0.62 a | |
Disclaimer/Publisher’s Note: The statements, opinions and data contained in all publications are solely those of the individual author(s) and contributor(s) and not of MDPI and/or the editor(s). MDPI and/or the editor(s) disclaim responsibility for any injury to people or property resulting from any ideas, methods, instructions or products referred to in the content. |
© 2025 by the authors. Licensee MDPI, Basel, Switzerland. This article is an open access article distributed under the terms and conditions of the Creative Commons Attribution (CC BY) license (https://creativecommons.org/licenses/by/4.0/).
Share and Cite
Wang, Z.; Yuan, Z.; Dou, X.; Yang, W.; Zhang, H.; Zhang, Y.; Chen, F.; Hao, Y. Enhancement of Anti-Staling Properties of Rice Bread Through Fermentation Rice Flour with Three Lactic Acid Bacteria. Foods 2025, 14, 2674. https://doi.org/10.3390/foods14152674
Wang Z, Yuan Z, Dou X, Yang W, Zhang H, Zhang Y, Chen F, Hao Y. Enhancement of Anti-Staling Properties of Rice Bread Through Fermentation Rice Flour with Three Lactic Acid Bacteria. Foods. 2025; 14(15):2674. https://doi.org/10.3390/foods14152674
Chicago/Turabian StyleWang, Zhiqi, Zhaosen Yuan, Xinlai Dou, Wanshan Yang, Huining Zhang, Yue Zhang, Fenglian Chen, and Yanling Hao. 2025. "Enhancement of Anti-Staling Properties of Rice Bread Through Fermentation Rice Flour with Three Lactic Acid Bacteria" Foods 14, no. 15: 2674. https://doi.org/10.3390/foods14152674
APA StyleWang, Z., Yuan, Z., Dou, X., Yang, W., Zhang, H., Zhang, Y., Chen, F., & Hao, Y. (2025). Enhancement of Anti-Staling Properties of Rice Bread Through Fermentation Rice Flour with Three Lactic Acid Bacteria. Foods, 14(15), 2674. https://doi.org/10.3390/foods14152674