
Optimizing the Extraction of Polyphenols from Different Edible Lichens Using Response Surface Methodology and the Determination of Their Mineral and Antibacterial Properties

 , ,
, ,  ,
, 
Abstract
1. Introduction
2. Materials and Methods
2.1. Chemicals and Reagents
2.2. Lichen Collection and Identification
2.3. Preparation of the Lichen Extracts
2.4. Experimental Design
2.5. Assessment of Total Phenolic Content and Antioxidant Capacity
2.6. Phenolic Profile of the Optimized Lichen Extracts
2.7. Mineral Analysis
2.8. GC–MS Analysis
2.9. Antibacterial Activity
2.10. Statistical Analysis
3. Results and Discussion
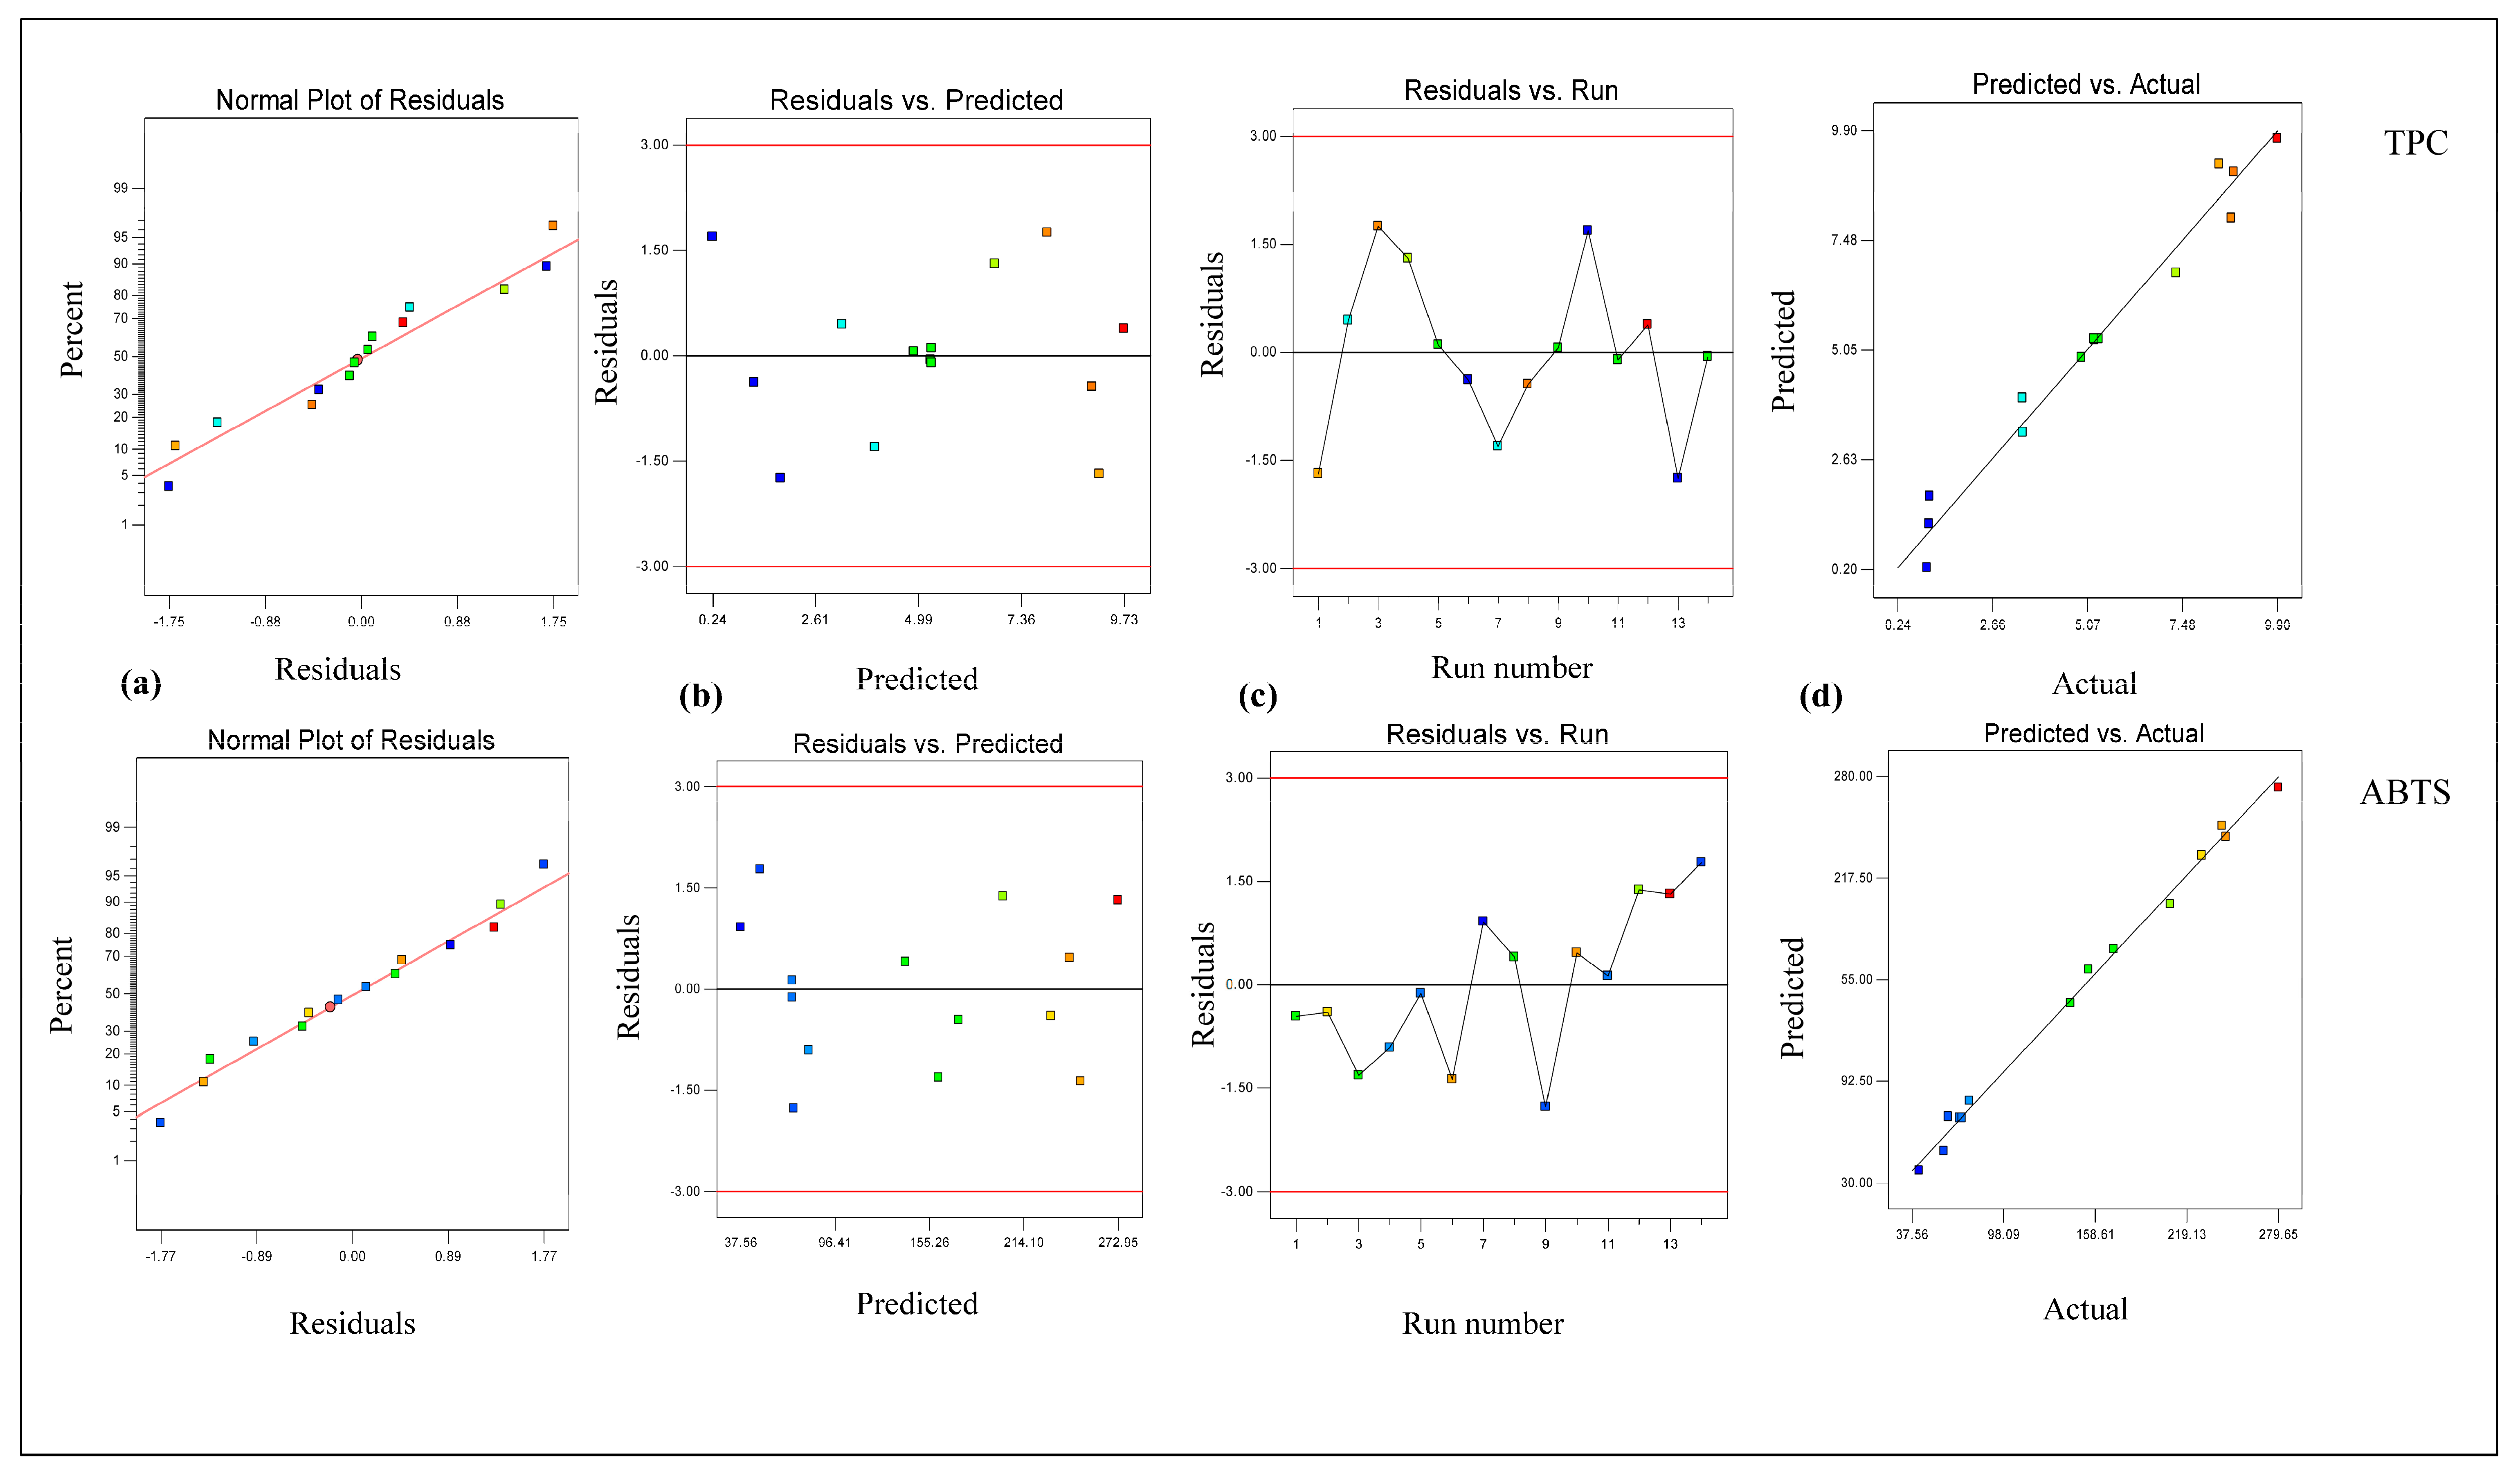
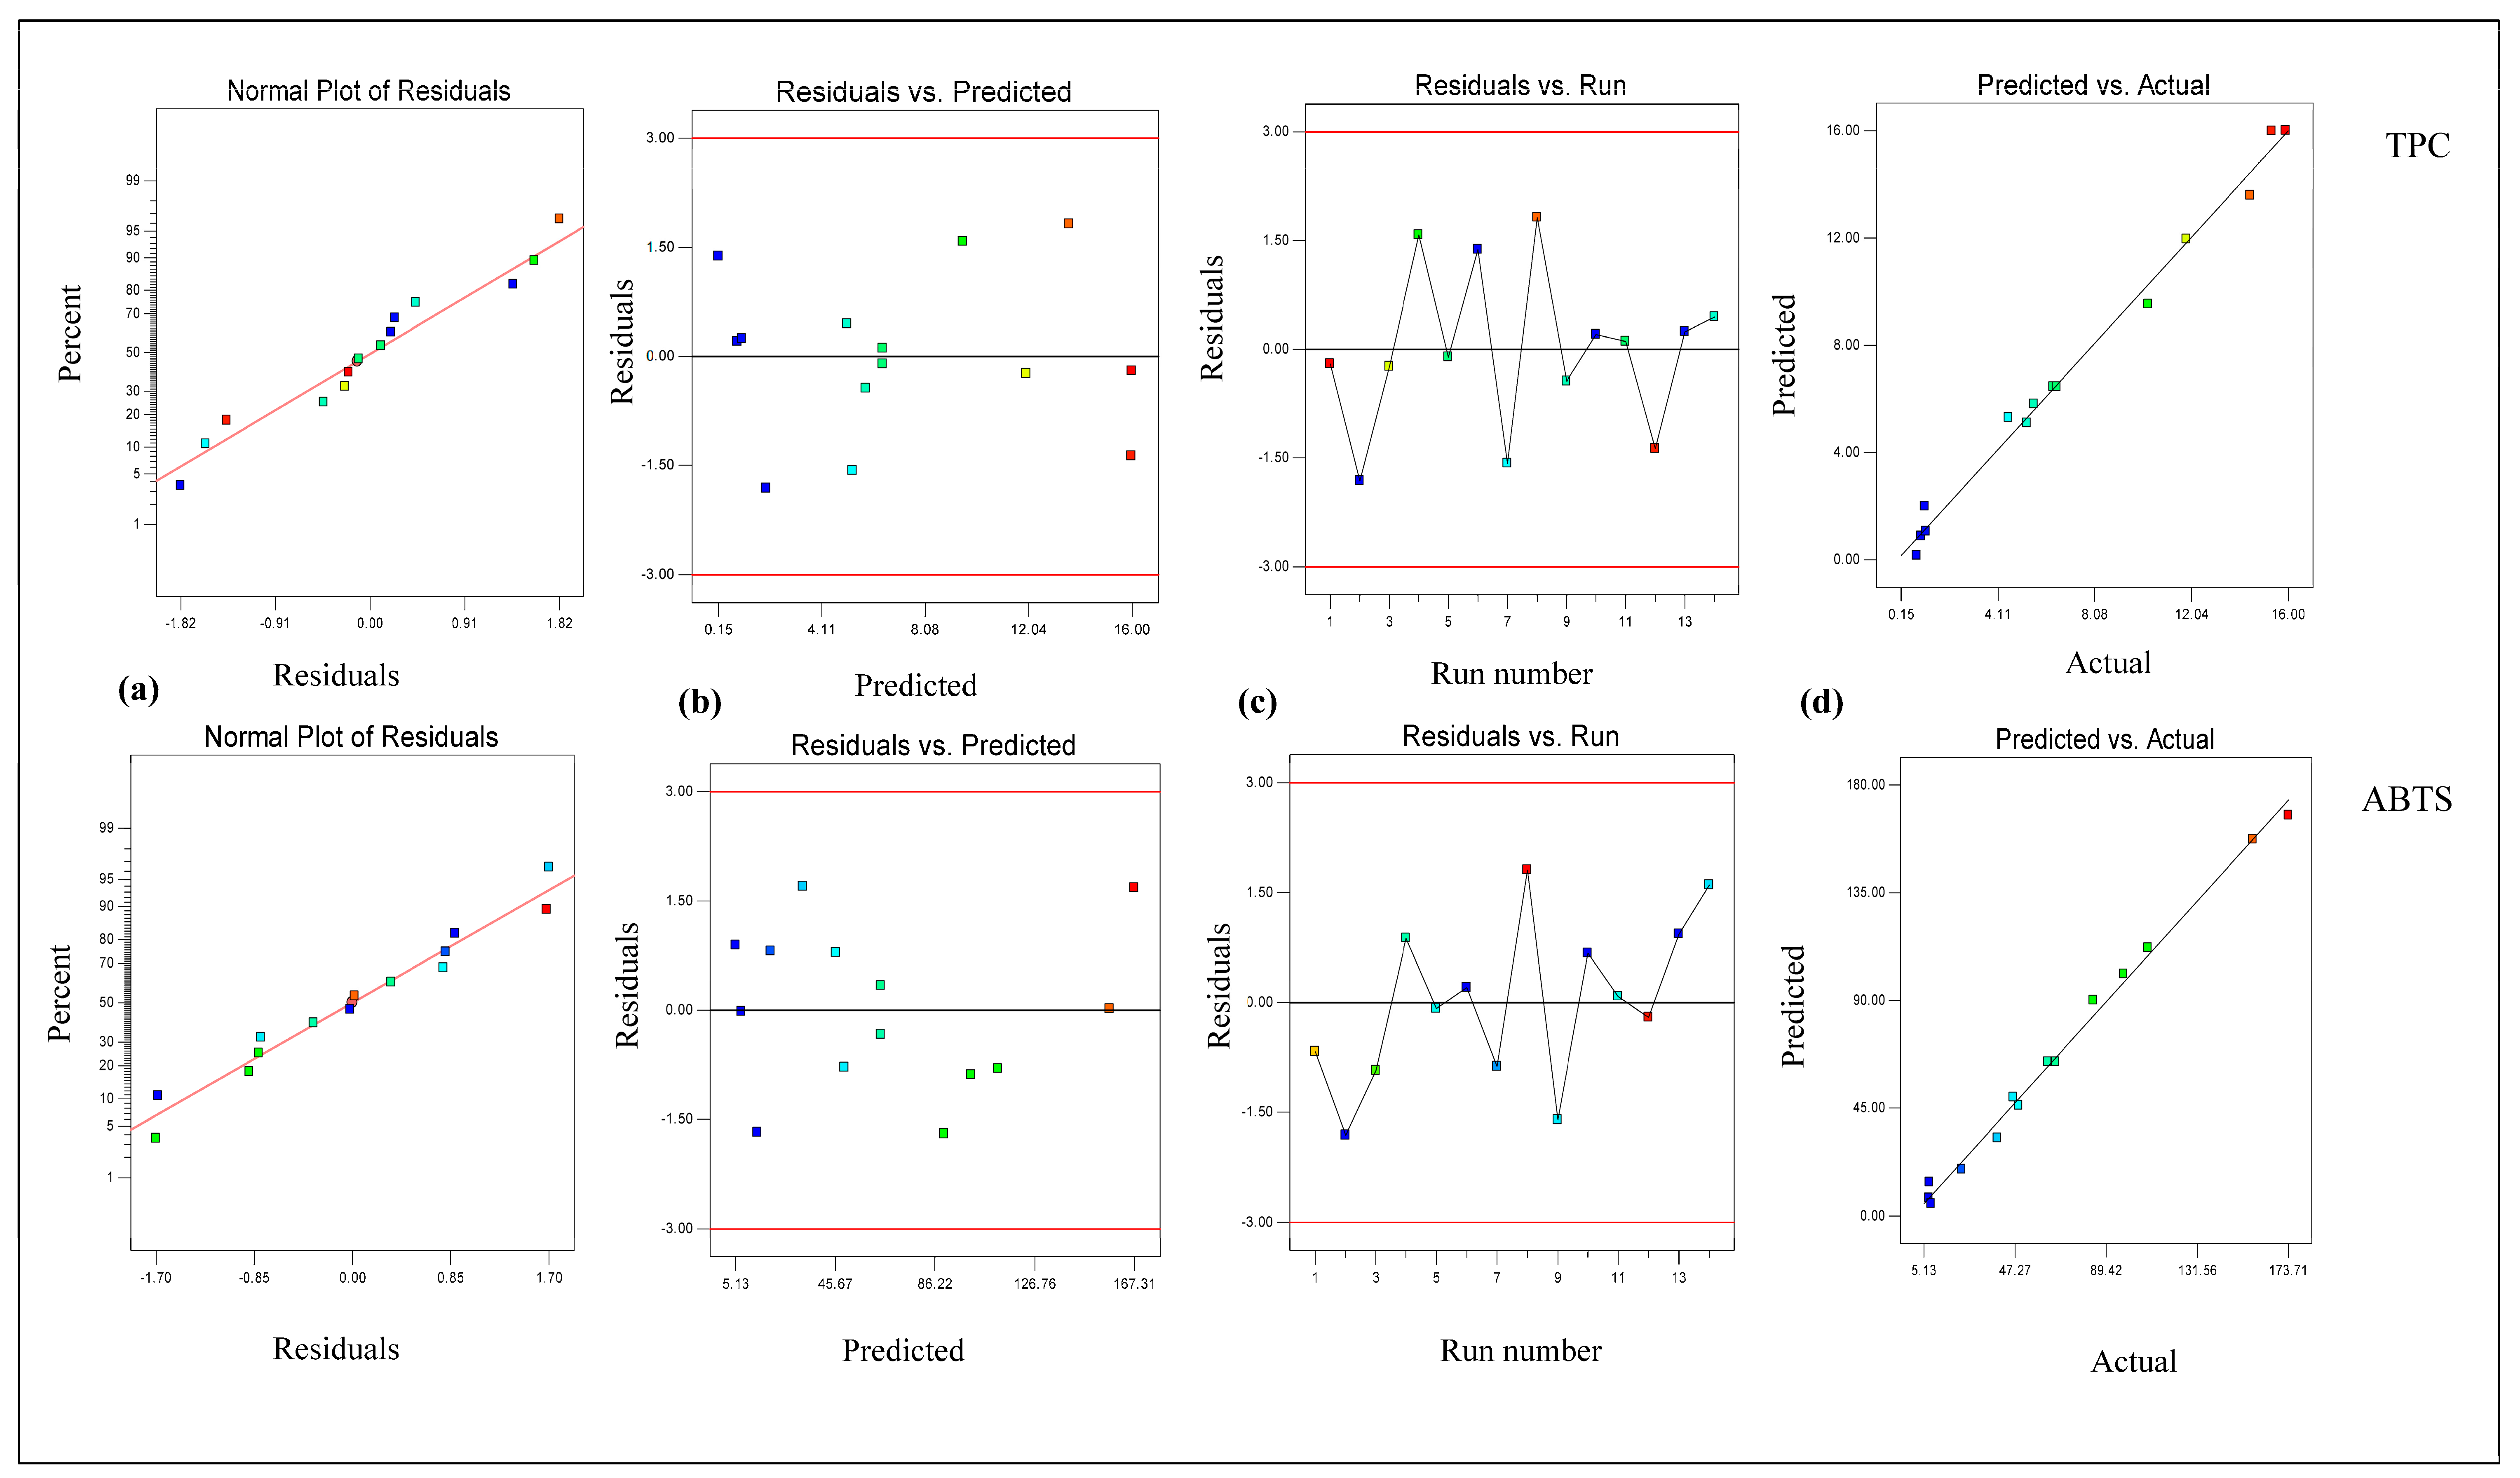
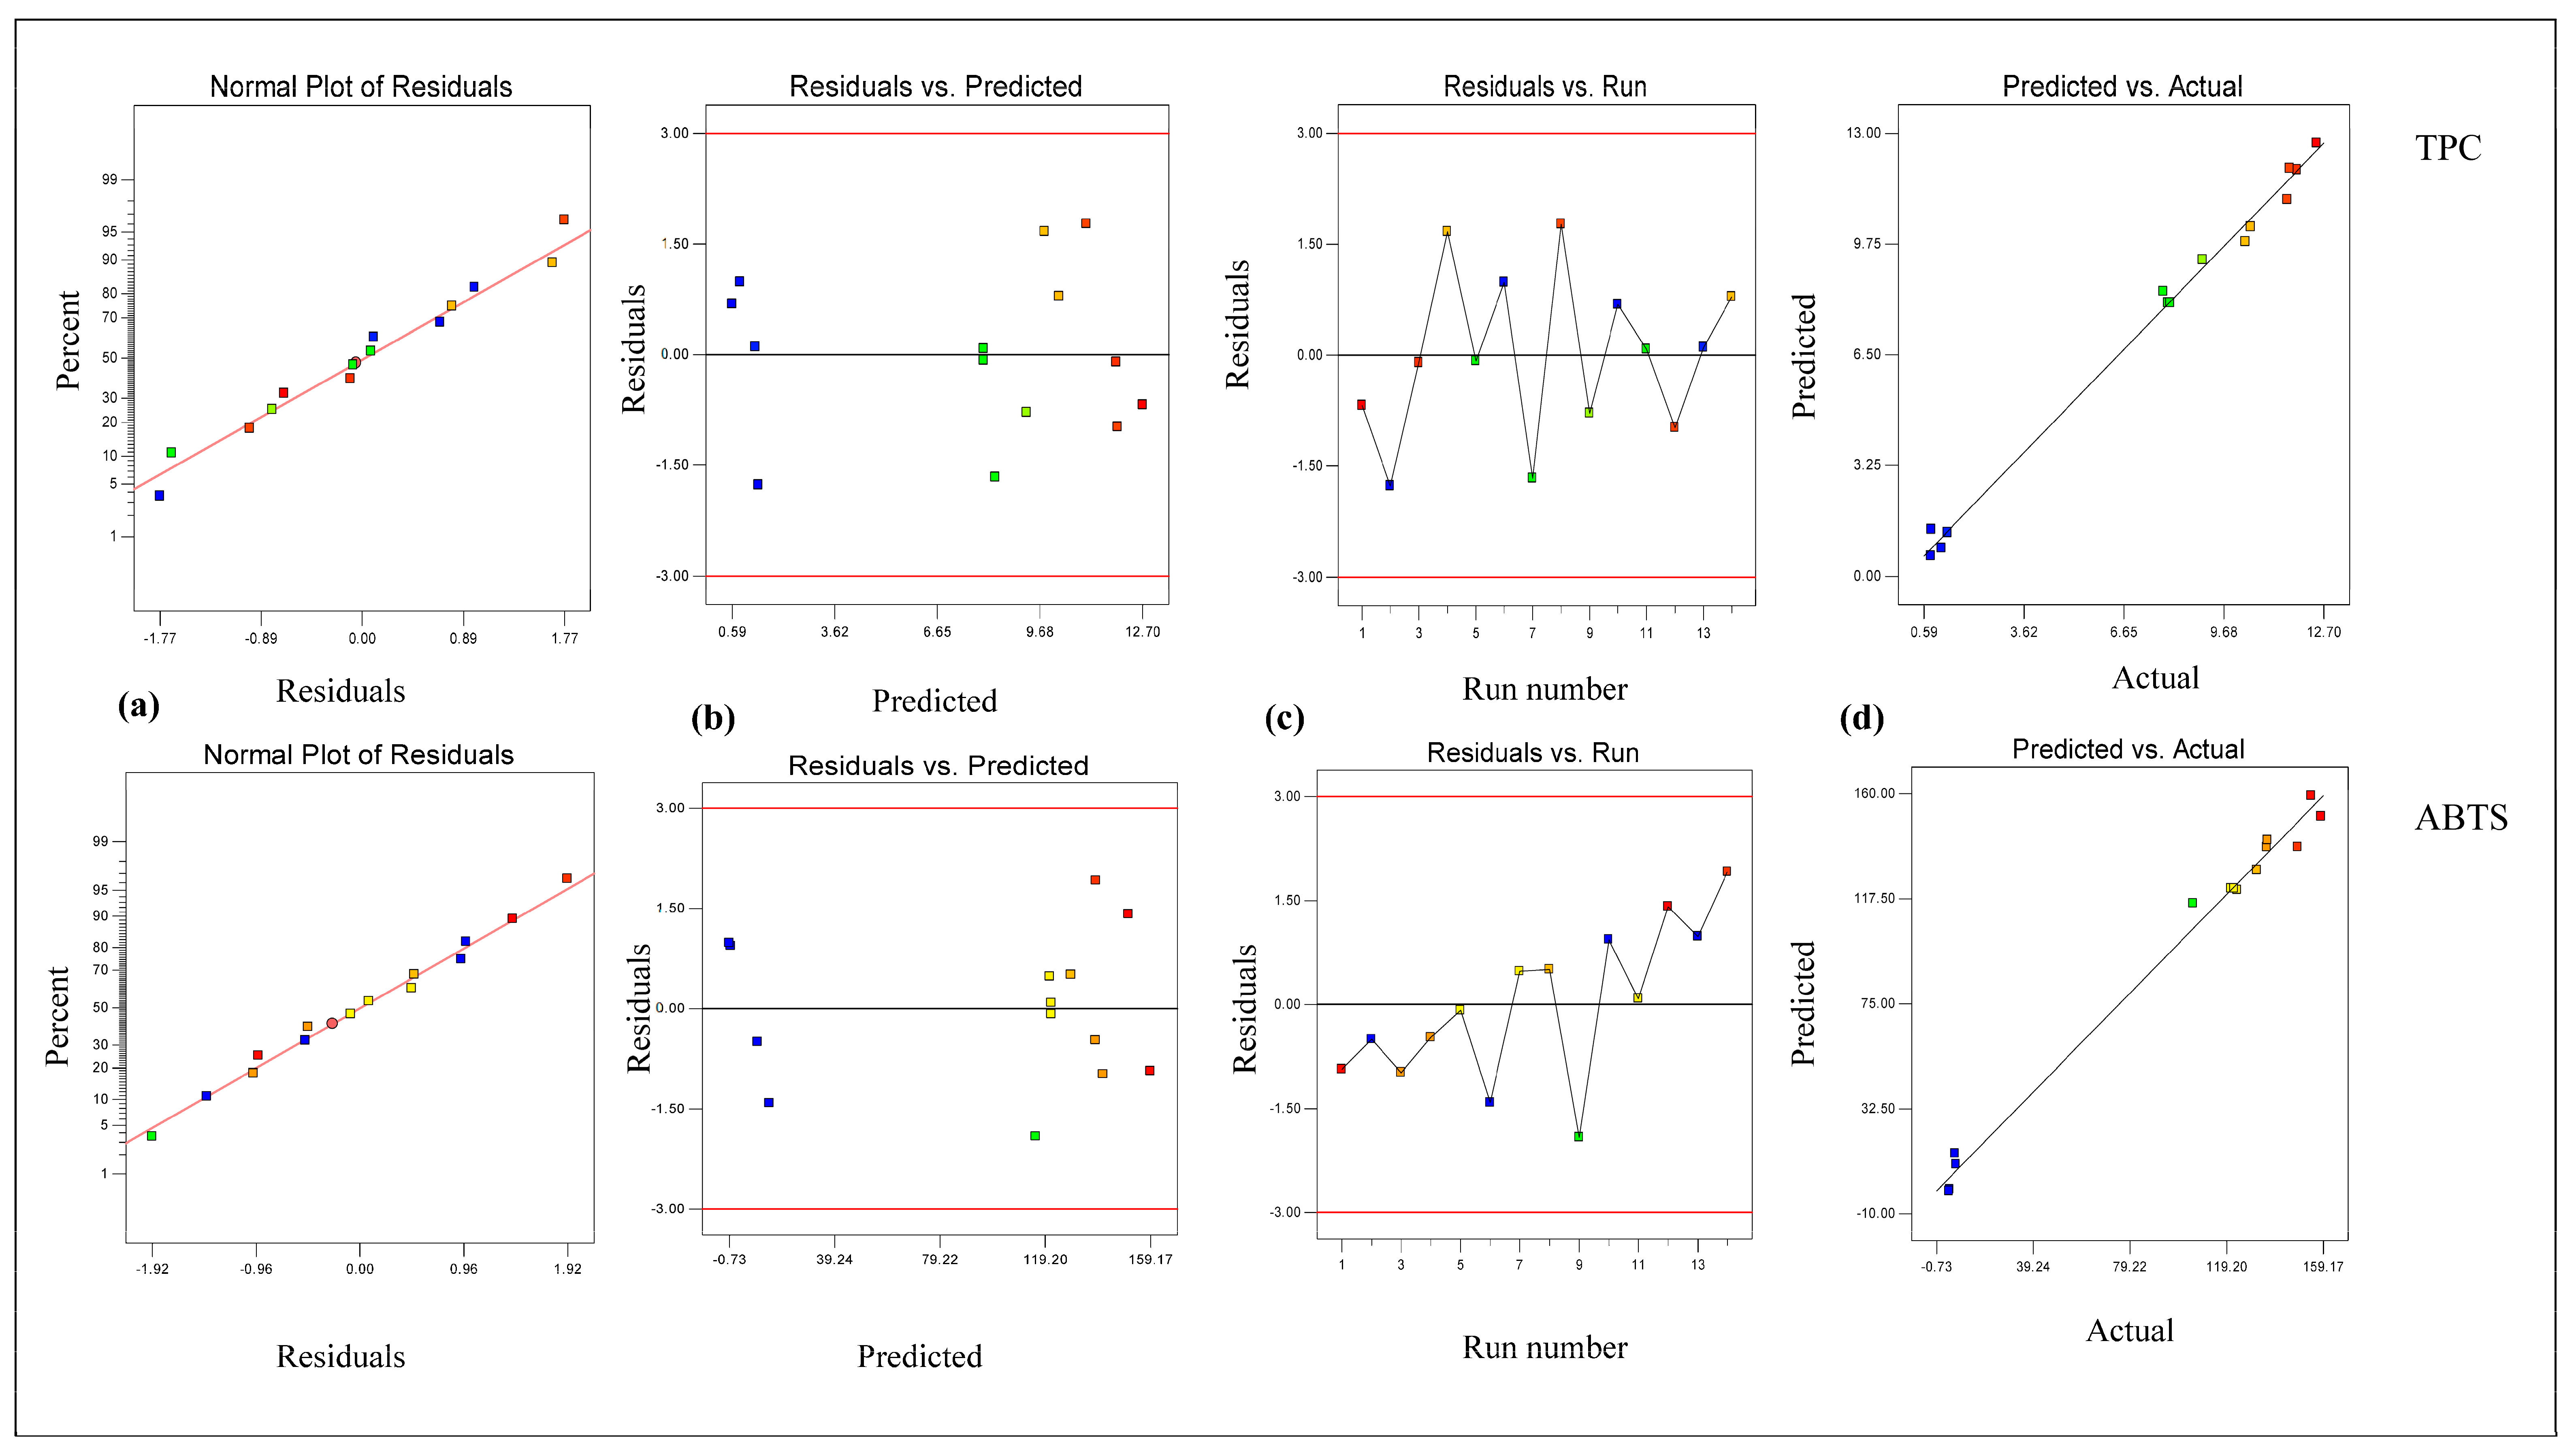
3.1. Modeling and Optimization via RSM Model
3.2. Antioxidant Capacities of the Optimized Lichen Extracts
3.3. Phytochemical Compositions of the Optimized Lichen Extracts
3.4. Mineral Contents of Lichen Samples
3.5. Determination of the Volatile Composition of Lichen Extracts
3.6. Antibacterial Activity of the Optimized Lichen Extracts
4. Conclusions
Supplementary Materials
Author Contributions
Funding
Data Availability Statement
Acknowledgments
Conflicts of Interest
References
- da Silva, A.S.; de Oliveira Farias de Aguiar, J.C.R.; da Silva Nascimento, J.; Costa, E.C.S.; dos Santos, F.H.G.; Andrade de Araújo, H.D.; da Silva, N.H.; Pereira, E.C.; Martins, M.C.; Falcão, E.P.S.; et al. Larvicidal Activity and Docking Study of Ramalina Complanata and Cladonia Verticillaris Extracts and Secondary Metabolites against Aedes Aegypti. Ind. Crops Prod. 2023, 195, 116425. [Google Scholar] [CrossRef]
- Culberson, C.F.; Elix, J.A. Lichen Substances. Methods Plant Biochem. 1989, 1, 509–535. [Google Scholar] [CrossRef]
- Ibrahim, S.R.M.; Mohamed, G.A.; Al Haidari, R.A.; El-Kholy, A.A.; Zayed, M.F.; Khayat, M.T. Biologically Active Fungal Depsidones: Chemistry, Biosynthesis, Structural Characterization, and Bioactivities. Fitoterapia 2018, 129, 317–365. [Google Scholar] [CrossRef] [PubMed]
- Aoussar, N.; Laasri, F.E.; Bourhia, M.; Manoljovic, N.; Mhand, R.A.; Rhallabi, N.; Ullah, R.; Shahat, A.A.; Noman, O.M.; Nasr, F.A.; et al. Phytochemical Analysis, Cytotoxic, Antioxidant, and Andantibacterial Activities of Lichens. Evid.-Based Complement. Altern. Med. 2020, 2020, 8104538. [Google Scholar] [CrossRef] [PubMed]
- Aoussar, N.; Achmit, M.; Es-sadeqy, Y.; Vasiljević, P.; Rhallabi, N.; Ait Mhand, R.; Zerouali, K.; Manojlović, N.; Mellouki, F. Phytochemical Constituents, Antioxidant and Antistaphylococcal Activities of Evernia Prunastri (L.) Ach., Pseudevernia Furfuracea (L.) Zopf. and Ramalina Farinacea (L.) Ach. from Morocco. Arch. Microbiol. 2021, 203, 2887–2894. [Google Scholar] [CrossRef] [PubMed]
- Manojlović, N.T.; Rančić, A.B.; Décor, R.; Vasiljević, P.; Tomović, J. Determination of Chemical Composition and Antimicrobial, Antioxidant and Cytotoxic Activities of Lichens Parmelia Conspersa and Parmelia Perlata. J. Food Meas. Charact. 2021, 15, 686–696. [Google Scholar] [CrossRef]
- Popovici, V.; Bucur, L.; Popescu, A.; Schröder, V.; Costache, T.; Rambu, D.; Cucolea, I.E.; Gîrd, C.E.; Caraiane, A.; Gherghel, D.; et al. Antioxidant and Cytotoxic Activities of Usnea Barbata (L.) f.h. Wigg. Dry Extracts in Different Solvents. Plants 2021, 10, 909. [Google Scholar] [CrossRef] [PubMed]
- Goncu, B.; Sevgi, E.; Hancer, C.K.; Gokay, G.; Ozten, N. Differential Anti-Proliferative and Apoptotic Effects of Lichen Species on Human Prostate Carcinoma Cells. PLoS ONE 2020, 15, e0238303. [Google Scholar] [CrossRef]
- Thakur, M.; Kasi, I.K.; Islary, P.; Bhatti, S.K. Nutritional and Health-Promoting Effects of Lichens Used in Food Applications. Curr. Nutr. Rep. 2023, 12, 555–566. [Google Scholar] [CrossRef] [PubMed]
- Zhao, Y.; Wang, M.; Xu, B. A Comprehensive Review on Secondary Metabolites and Health-Promoting Effects of Edible Lichen. J. Funct. Foods 2021, 80, 104283. [Google Scholar] [CrossRef]
- Rethinavelu, G.; Manoharan, L.; Krishnamoorthy, S.; Baskaran, N.; Sivanandham, V. Edible Lichens and Its Unique Bioactives: A Review of Its Pharmacological and Food Applications. Food Humanit. 2023, 1, 1598–1609. [Google Scholar] [CrossRef]
- Güvenç, A.; Küpeli Akkol, E.; Süntar, I.; Keleş, H.; Yildiz, S.; Çaliş, I. Biological Activities of Pseudevernia Furfuracea (L.) Zopf Extracts and Isolation of the Active Compounds. J. Ethnopharmacol. 2012, 144, 726–734. [Google Scholar] [CrossRef] [PubMed]
- Emsen, B.; Togar, B.; Turkez, H.; Aslan, A. Effects of Two Lichen Acids Isolated from Pseudevernia Furfuracea (L.) Zopf in Cultured Human Lymphocytes. Z. Naturforsch. Sect. C J. Biosci. 2018, 73, 303–312. [Google Scholar] [CrossRef] [PubMed]
- Yusuf, M. A Review on Trends and Opportunity in Edible Lichens. In Lichen-Derived Products: Extraction and Applications; Wiley: Hoboken, NJ, USA, 2020; pp. 189–201. [Google Scholar]
- Gülçin, I.; Oktay, M.; Küfrevioǧlu, Ö.I.; Aslan, A. Determination of Antioxidant Activity of Lichen Cetraria islandica (L) Ach. J. Ethnopharmacol. 2002, 79, 325–329. [Google Scholar] [CrossRef] [PubMed]
- Ismail, B.B.; Pu, Y.; Guo, M.; Ma, X.; Liu, D. LC-MS/QTOF Identification of Phytochemicals and the Effects of Solvents on Phenolic Constituents and Antioxidant Activity of Baobab (Adansonia digitata) Fruit Pulp. Food Chem. 2019, 277, 279–288. [Google Scholar] [CrossRef] [PubMed]
- Kalra, R.; Conlan, X.A.; Areche, C.; Dilawari, R.; Goel, M. Metabolite Profiling of the Indian Food Spice Lichen, Pseudevernia Furfuracea Combined with Optimised Extraction Methodology to Obtain Bioactive Phenolic Compounds. Front. Pharmacol. 2021, 12, 629695. [Google Scholar] [CrossRef] [PubMed]
- Ranković, B.; Mišić, M.; Sukdolak, S. Antimicrobial Activity of Extracts of the Lichens Cladonia Furcata, Parmelia Caperata, Parmelia Pertusa, Hypogymnia Physodes and Umbilicaria Polyphylla. Br. J. Biomed. Sci. 2007, 64, 143–148. [Google Scholar] [CrossRef] [PubMed]
- Ranković, B.; Mišić, M. The Antimicrobial Activity of the Lichen Substances of the Lichens Cladonia Furcata, Ochrolechia Androgyna, Parmelia Caperata and Parmelia Conspresa. Biotechnol. Biotechnol. Equip. 2008, 22, 1013–1016. [Google Scholar] [CrossRef]
- Majchrzak-Celińska, A.; Kleszcz, R.; Studzińska-Sroka, E.; Łukaszyk, A.; Szoszkiewicz, A.; Stelcer, E.; Jopek, K.; Rucinski, M.; Krajka-Kuźniak, V.; Cielecka-Piontek, J. Lichen Secondary Metabolites Inhibit the Wnt/β-Catenin Pathway in Glioblastoma Cells and Improve the Anticancer Effects of Temozolomide. Cells 2022, 11, 1084. [Google Scholar] [CrossRef] [PubMed]
- Singh, G.; Calchera, A.; Merges, D.; Valim, H.; Otte, J.; Schmitt, I.; Dal Grande, F. A Candidate Gene Cluster for the Bioactive Natural Product Gyrophoric Acid in Lichen-Forming Fungi. Microbiol. Spectr. 2022, 10, e00109-22. [Google Scholar] [CrossRef] [PubMed]
- Ren, M.; Jiang, S.; Wang, Y.; Pan, X.; Pan, F.; Wei, X. Discovery and Excavation of Lichen Bioactive Natural Products. Front. Microbiol. 2023, 14, 1177123. [Google Scholar] [CrossRef] [PubMed]
- Zambare, V.P.; Christopher, L.P. Biopharmaceutical Potential of Lichens. Pharm. Biol. 2012, 50, 778–798. [Google Scholar] [CrossRef] [PubMed]
- Shrestha, G.; St. Clair, L.L. Lichens: A Promising Source of Antibiotic and Anticancer Drugs. Phytochem. Rev. 2013, 12, 229–244. [Google Scholar] [CrossRef]
- Tas, I.; Yildirim, A.B.; Ozkan, E.; Ozyigitoglu, G.C.; Yavuz, M.Z.; Turker, A.U. Biological Evaluation and Phytochemical Profiling of Some Lichen Species. Acta Aliment. 2019, 48, 457–465. [Google Scholar] [CrossRef]
- Ghitescu, R.E.; Volf, I.; Carausu, C.; Bühlmann, A.M.; Gilca, I.A.; Popa, V.I. Optimization of Ultrasound-Assisted Extraction of Polyphenols from Spruce Wood Bark. Ultrason. Sonochem. 2015, 22, 535–541. [Google Scholar] [CrossRef] [PubMed]
- Cebi, N.; Sagdic, O.; Basahel, A.M.; Balubaid, M.A.; Taylan, O.; Yaman, M.; Yilmaz, M.T. Modeling and Optimization of Ultrasound-Assisted Cinnamon Extraction Process Using Fuzzy and Response Surface Models. J. Food Process Eng. 2019, 42, e12978. [Google Scholar] [CrossRef]
- Karimah, Q.; Darmawan, D.A.; Naufal, W.M.; Putri, D.O.A.; Syakirina, D.; Carolina, D.F.; Venny; Hapsari, P.Z.; Rahmaniar, W.; Pradita, A.L.; et al. Enhancing Essential Oil Yields from Citronella (Cymbopogon winterianus) and Rosemary (Salvia rosmarinus): An Ultrasonication-Assisted Extraction Approach Using Response Surface Methodology. Sep. Sci. Technol. 2025, 2025, 1733–1748. [Google Scholar] [CrossRef]
- Dincer, C.A.; Gokalp, C.; Getiren, B.; Yildiz, A.; Yildiz, N. Supercritical Carbon Dioxide Extraction of Usnea longissima (L.) Ach.: Optimization by Box-Behnken Design (BBD). Turk. J. Chem. 2021, 45, 1248–1256. [Google Scholar] [CrossRef] [PubMed]
- Liu, X.; Luo, G.; Wang, L.; Yuan, W. Optimization of Antioxidant Extraction from Edible Brown Algae Ascophyllum Nodosum Using Response Surface Methodology. Food Bioprod. Process. 2019, 114, 205–215. [Google Scholar] [CrossRef]
- Yang, B.; Zhang, M.; Weng, H.; Xu, Y.; Zeng, L. Optimization of Ultrasound Assisted Extraction (UAE) of Kinsenoside Compound from Anoectochilus roxburghii (Wall.) Lindl by Response Surface Methodology (RSM). Molecules 2020, 25, 193. [Google Scholar] [CrossRef] [PubMed]
- Smith, C.W.; Aptroot, A.; Coppins, B.J.; Fletcher, A.; Gilbert, O.L.; James, P.W.; Wolseley, P.A. Lichens of Great Britain and Ireland; The British Lichen Society: London, UK, 2009. [Google Scholar]
- Singleton, V.L.; Orthofer, R.; Lamuela-Raventós, R.M. Analysis of Total Phenols and Other Oxidation Substrates and Antioxidants by Means of Folin-Ciocalteu Reagent. Methods Enzymol. 1999, 299, 152–178. [Google Scholar] [CrossRef]
- Re, R.; Pellegrini, N.; Proteggente, A.; Pannala, A.; Yang, M.; Evans, C.R. Antioxidant Actvity Applying an Improved ABTS Radical Cation Decolorization Assay. Free Radic. Biol. Med. 1999, 26, 1231–1237. [Google Scholar] [CrossRef] [PubMed]
- Brand-Williams, W.; Cuvelier, M.E.; Berset, C. Use of a Free Radical Method to Evaluate Antioxidant Activity. LWT Food Sci. Technol. 1995, 28, 25–30. [Google Scholar] [CrossRef]
- Apak, R.; Güçlü, K.; Özyürek, M.; Karademir, S.E. Novel Total Antioxidant Capacity Index for Dietary Polyphenols and Vitamins C and E, Using Their Cupric Ion Reducing Capability in the Presence of Neocuproine: CUPRAC Method. J. Agric. Food Chem. 2004, 52, 7970–7981. [Google Scholar] [CrossRef] [PubMed]
- Ozkan, K.; Karadag, A.; Sagdic, O. The Effects of Different Drying Methods on the in Vitro Bioaccessibility of Phenolics, Antioxidant Capacity, Minerals and Morphology of Black ‘Isabel’ Grape. LWT 2022, 158, 113185. [Google Scholar] [CrossRef]
- Muthu, S.; Murugan, M.; Rajendran, K.; Ponnusamy, P. An Assessment of Proximate Composition, Antioxidant Activities and LC/MS Based Phytochemical Profiling of Some Lichen Species Collected from Western Ghats of Southern Part of India. Jordan J. Biol. Sci. 2021, 14, 647–661. [Google Scholar] [CrossRef]
- Shiromi, P.S.A.I.; Hewawasam, R.P.; Jayalal, R.G.U.; Rathnayake, H.; Wijayaratne, W.M.D.G.B.; Wanniarachchi, D. Chemical Composition and Antimicrobial Activity of Two Sri Lankan Lichens, Parmotrema Rampoddense, and Parmotrema Tinctorum against Methicillin-Sensitive and Methicillin-Resistant Staphylococcus Aureus. Evid.-Based Complement. Altern. Med. 2021, 2021, 9985325. [Google Scholar] [CrossRef] [PubMed]
- Paudel, B.; Bhattarai, H.D.; Lee, J.S.; Hong, S.G.; Shin, H.W.; Yim, J.H. Antibacterial Potential of Antarctic Lichens against Human Pathogenic Gram-Positive Bacteria. Phyther. Res. 2008, 22, 1269–1271. [Google Scholar] [CrossRef] [PubMed]
- Bilgin, M.; Elhussein, E.A.A.; Özyürek, M.; Güçlü, K.; Şahin, S. Optimizing the Extraction of Polyphenols from Sideritis Montana L. Using Response Surface Methodology. J. Pharm. Biomed. Anal. 2018, 158, 137–143. [Google Scholar] [CrossRef] [PubMed]
- Ozcan, B.; Sagdic, O.; Karasu, S.; Ozkan, K.; Akcicek, A. Optimization of Phenolic Compounds Extraction from Purple Basil Leaf by Conventional and Microwave Assisted Extraction Methods. Lat. Am. Appl. Res. 2021, 51, 285–292. [Google Scholar] [CrossRef]
- Tas, I.; Yildirim, A.B.; Ozkan, E.; Ozyigitoglu, G.C.; Yavuz, M.Z.; Turker, A.U. Evaluation of Pharmaceutical Potential and Phytochemical Analysis of Selected Traditional Lichen Species. Farmacia 2021, 69, 1101–1106. [Google Scholar] [CrossRef]
- Stojković, D.; Živković, J.; Bolevich, S.; Bolevich, S.; Zengin, G.; Gašić, U.; Soković, M. Chemical Profiling and In Vitro Evaluation of Bioactive Properties of Evernia Prunastri Extract: Implications for Therapeutic Applications. Plants 2025, 14, 583. [Google Scholar] [CrossRef] [PubMed]
- Anaya-Esparza, L.M.; Ramos-Aguirre, D.; Zamora-Gasga, V.M.; Yahia, E.; Montalvo-González, E. Optimization of Ultrasonic-Assisted Extraction of Phenolic Compounds from Justicia Spicigera Leaves. Food Sci. Biotechnol. 2018, 27, 1093–1102. [Google Scholar] [CrossRef] [PubMed]
- Capanoglu, E.; Kamiloglu, S.; Ozkan, G.; Apak, R. 13 Evaluation of Antioxidant Activity/Capacity Measurement Methods for Food Products. In Measurement of Antioxidant Activity & Capacity: Recent Trends and Applications; Wiley: Hoboken, NJ, USA, 2018. [Google Scholar]
- Sarikurkcu, C.; Kocak, M.S.; Calapoglu, M.; Ocal, C.; Tepe, B. Biological and Phytochemical Evaluation: Pseudevernia Furfuracea as an Alternative Multifunctional Agent. J. Funct. Foods 2016, 24, 11–17. [Google Scholar] [CrossRef]
- Kolayli, S.; Kucuk, M.; Duran, C.; Candan, F.; Dincer, B. Chemical and Antioxidant Properties of Laurocerasus officinalis Roem. (Cherry Laurel) Fruit Grown in the Black Sea Region. J. Agric. Food Chem. 2003, 51, 7489–7494. [Google Scholar] [CrossRef] [PubMed]
- Yildiz, Ü.C.; Kiliç, C.; Gürgen, A.; Yildiz, S. Possibility of Using Lichen and Mistletoe Extracts as Potential Natural Wood Preservative. Maderas Cienc. Tecnol. 2020, 22, 179–188. [Google Scholar] [CrossRef]
- Sepúlveda, B.; Cornejo, A.; Bárcenas-pérez, D.; Cheel, J.; Areche, C. Two New Fumarprotocetraric Acid Lactones Identified and Characterized by UHPLC-PDA/ESI/ORBITRAP/MS/MS from the Antarctic Lichen Cladonia Metacorallifera. Separations 2022, 9, 41. [Google Scholar] [CrossRef]
- Singh, S.; Upreti, D.K.; Lehri, A.; Shukla, V.; Niranjan, A.; Paliwal, A.K. Assessment of Antioxidant Potential and Related Structural Diversity of Polyphenols in Indian Foliose Lichens. Cryptogam Biodivers. Assess. 2019, 4, 1–18. [Google Scholar] [CrossRef]
- Emsen, B.; Ozdemir, O.; Engin, T.; Togar, B.; Cavusoglu, S.; Turkez, H. Inhibition of Growth of U87MG Human Glioblastoma Cells by Usnea Longissima Ach. An. Acad. Bras. Cienc. 2019, 91, e20180994. [Google Scholar] [CrossRef] [PubMed]
- Emsen, B.; Kolukisa, A.L. Cytogenetic and Oxidative Effects of Three Lichen Extracts on Human Peripheral Lymphocytes. Z. Naturforsch. Sect. C J. Biosci. 2021, 76, 291–299. [Google Scholar] [CrossRef] [PubMed]
- Emsen, B. The Antioxidant and Antigenotoxic Potential of Peltigera Canina and Umbilicaria Nylanderiana Based on Their Phenolic Profile. Farmacia 2019, 67, 912–921. [Google Scholar] [CrossRef]
- Velmala, S.; Myllys, L.; Goward, T.; Holien, H.; Halonen, P. Taxonomy of Bryoria Section Implexae (Parmeliaceae, Lecanoromycetes) in North America and Europe, Based on Chemical, Morphological and Molecular Data. Ann. Bot. Fenn. 2014, 51, 345–371. [Google Scholar] [CrossRef]
- Kosanić, M.; Manojlović, N.; Janković, S.; Stanojković, T.; Ranković, B. Evernia Prunastri and Pseudoevernia Furfuraceae Lichens and Their Major Metabolites as Antioxidant, Antimicrobial and Anticancer Agents. Food Chem. Toxicol. 2013, 53, 112–118. [Google Scholar] [CrossRef] [PubMed]
- Vinayaka, K.S.; Kekuda, T.R.P.; Kumar, K.A.R.; Pavithra, G.M.; Junaid, S.; Rakesh, K.N.; Dileep, N. Analysis of Mineral Elements of the Lichen Usnea Pictoides G. Awasthi by ICP-OES. Int. J. Chem. Sci. 2013, 11, 589–1594. [Google Scholar]
- Kekuda, T.R.P.; Vinayaka, K.S.; Swathi, D.; Suchitha, Y.; Venugopal, T.M.; Mallikarjun, N. Mineral Composition, Total Phenol Content and Antioxidant Activity of a Macrolichen Everniastrum cirrhatum (Fr.) Hale (Parmeliaceae). J. Chem. 2011, 8, 1886–1894. [Google Scholar] [CrossRef]
- Storeheier, P.V.; Mathiesen, S.D.; Tyler, N.J.C.; Olsen, M.A. Nutritive Value of Terricolous Lichens for Reindeer in Winter. Lichenologist 2002, 34, 247–257. [Google Scholar] [CrossRef]
- Mokhtar, M.B.; Din, L.B.; Lazim, N.A.M.; Uzir, R.I.R.; Idris, R.; Othman, Y. Determination of Trace Elements in Malaysian Lichens as Potential Indicators for Pollution by Using Inductive Couple Plasma Emission Spectrophotometry. Malays. J. Anal. Sci. 2006, 10, 185–188. [Google Scholar]
- Elkhateeb, W.A.; Daba, G.M. Occurrence of Terpenes, Polyketides, and Tannins in Some Japanese Lichens and Green Mosses. Egypt. Pharm. J. 2020, 19, 216–223. [Google Scholar] [CrossRef]
- Shen, B.; Hohmann, S.; Jensen, R.G.; Bohnert, H.J. Roles of Sugar Alcohols in Osmotic Stress Adaptation. Replacement of Glycerol by Mannitol and Sorbitol in Yeast. Plant Physiol. 1999, 121, 45–52. [Google Scholar] [CrossRef] [PubMed]
- Fontaniella, B.; Vicente, C.; Legaz, M.E. The Cryoprotective Role of Polyols in Lichens: Effects on the Redistribution of RNase in Evernia Prunastri Thallus during Freezing. Plant Physiol. Biochem. 2000, 38, 621–627. [Google Scholar] [CrossRef]
- Dahlman, L.; Persson, J.; Näsholm, T.; Palmqvist, K. Carbon and Nitrogen Distribution in the Green Algal Lichens Hypogymnia Physodes and Platismatia Glauca in Relation to Nutrient Supply. Planta 2003, 217, 41–48. [Google Scholar] [CrossRef] [PubMed]
- Patange, A.; Boehm, D.; Bueno-Ferrer, C.; Cullen, P.J.; Bourke, P. Controlling Brochothrix Thermosphacta as a Spoilage Risk Using In-Package Atmospheric Cold Plasma. Food Microbiol. 2017, 66, 48–54. [Google Scholar] [CrossRef] [PubMed]
- Lewis, D.; Smith, D.C. Sugar Alcohols (Polyols) in Fungi and Green Plants. I. Distribution, Physiology and Metabolism. New Phytol. 1967, 66, 143–184. [Google Scholar] [CrossRef]
- Un, H.; Ugan, R.A. The Inhibitory Effects of Olivetol on Cell Proliferation and Invasion of SHSY-5Y Neuroblastoma Cells. Kafkas J. Med. Sci. 2021, 11, 57–62. [Google Scholar] [CrossRef]
- Yamamoto, Y.; Watanabe, A. Fatty Acid Composition of Lichens and Their Phyco-and Mycobionts. J. Gen. Appl. Microbiol. 1974, 20, 83–86. [Google Scholar] [CrossRef]
- Reis, R.A.; Iacomini, M.; James Gorin, P.A.; De Souza, L.M.; Grube, M.; Cortes Cordeiro, L.M.; Sassaki, G.L. Fatty Acid Composition of the Tropical Lichen Teloschistes Flavicans and Its Cultivated Symbionts. FEMS Microbiol. Lett. 2005, 247, 1–6. [Google Scholar] [CrossRef] [PubMed]
- Schlenk, H.; Gellerman, J.L. Arachidonic, 5, 11, 14, 17-Eicosatetraenoic and Related Acids in Plants-Identification of Unsaturated Fatty Acids. J. Am. Oil Chem. Soc. 1965, 42, 504–511. [Google Scholar] [CrossRef]
- Dembitsky, V.M.; Rezanka, T.; Bychek, I.A. Seasonal Variability of Lipids and Fatty Acids in the Tree-Growing Lichen Xanthoria Parientina L. J. Exp. Bot. 1994, 45, 403–408. [Google Scholar] [CrossRef]
- Piervittori, R.; Alessio, F.; Usai, L.; Maffei, M. Seasonal Variations in Lipids of Xanthoria Parietina Growing at High Elevations. Phytochemistry 1995, 40, 717–723. [Google Scholar] [CrossRef]
- Appendino, G.; Gibbons, S.; Giana, A.; Pagani, A.; Grassi, G.; Stavri, M.; Smith, E.; Rahman, M.M. Antibacterial Cannabinoids from Cannabis Sativa: A Structure-Activity Study. J. Nat. Prod. 2008, 71, 1427–1430. [Google Scholar] [CrossRef] [PubMed]
- Shcherbakova, A.; Strömstedt, A.A.; Göransson, U.; Gnezdilov, O.; Turanov, A.; Boldbaatar, D.; Kochkin, D.; Ulrich-Merzenich, G.; Koptina, A. Antimicrobial and Antioxidant Activity of Evernia Prunastri Extracts and Their Isolates. World J. Microbiol. Biotechnol. 2021, 37, 1–14. [Google Scholar] [CrossRef] [PubMed]
- Aslan, A.; Güllüce, M.; Sökmen, M.; Adigüzel, A.; Sahin, F.; Özkan, H. Antioxidant and Antimicrobial Properties of the Lichens Cladonia Foliacea, Dermatocarpon Miniatum, Everinia Divaricata, Evernia Prunastri, and Neofuscella Pulla. Pharm. Biol. 2006, 44, 247–252. [Google Scholar] [CrossRef]
- Sahin, S.; Oran, S.; Sahinturk, P.; Demir, C.; Ozturk, S. Ramalina Lichens and Their Major Metabolites as Possible Natural Antioxidant and Antimicrobial Agents. J. Food Biochem. 2015, 39, 471–477. [Google Scholar] [CrossRef]
- Cobanoglu, G.; Sesal, C.; Gokmen, B.; Cakar, S. Evaluation of the Antimicrobial Properties of Some Lichens. South West. J. Hortic. Biol. Environ. 2010, 1, 153–158. [Google Scholar]
- Tiwari, P.; Rai, H.; Upreti, D.K.; Trivedi, S.; Shukla, P. Assessment of Antifungal Activity of Some Himalayan Foliose Lichens Against Plant Pathogenic Fungi. Am. J. Plant Sci. 2011, 2, 841–846. [Google Scholar] [CrossRef]
- Cansaran, D.; Kahya, D.; Yurdakulol, E.; Atakol, O. Identification and Quantitation of Usnic Acid from the Lichen Usnea Species of Anatolia and Antimicrobial Activity. Z. Naturforsch. Sect. C J. Biosci. 2006, 61, 773–776. [Google Scholar] [CrossRef] [PubMed]
- Kumar, P.; Nayaka, S.; Verma, T.; Niranjan, A.; Upreti, D.K. Comparative Analysis of Antimicrobial, Antioxidant Activities and Phytochemicals of Himalayan Lichens. Biomass Convers. Biorefinery 2025, 15, 5361–5381. [Google Scholar] [CrossRef]
- Kosanić, M.; Ranković, B. Antioxidant and Antimicrobial Properties of Some Lichens and Their Constituents. J. Med. Food 2011, 14, 1624–1630. [Google Scholar] [CrossRef] [PubMed]
- Marijana, K.; Branislav, R.; Slobodan, S. Antimicrobial Activity of the Lichen Lecanora Frustulosa and Parmeliopsis Hyperopta and Their Divaricatic Acid and Zeorin Constituents. J. Microbiol. 2010, 4, 885–890. [Google Scholar]
- Tas, I.; Han, J.; Park, S.Y.; Yang, Y.; Zhou, R.; Gamage, C.D.B.; Van Nguyen, T.; Lee, J.Y.; Choi, Y.J.; Yu, Y.H.; et al. Physciosporin Suppresses the Proliferation, Motility and Tumourigenesis of Colorectal Cancer Cells. Phytomedicine 2019, 56, 10–20. [Google Scholar] [CrossRef] [PubMed]


| Species | Province | Altitude (m) | Collection Date |
|---|---|---|---|
| Bryoria fuscescens | Uludağ/Bursa | 1772 | 7 October 2021 |
| Evernia divaricata | Uludağ/Bursa | 1772 | 7 October 2021 |
| Evernia prunastri | Kartepe/Sakarya | 750 | 28 August 2021 |
| Lobaria pulmonaria | Kartepe/Sakarya | 1111 | 11 June 2021 |
| Pseudevernia furfuracea | Uludağ/Bursa | 1216 | 6 October 2021 |
| TPC | ABTS | |||||||||
|---|---|---|---|---|---|---|---|---|---|---|
| B. fuscescens | ||||||||||
| Regression Coefficients | Sum of Squares | Df | Mean Square | F-Value | p-Value | Sum of Squares | Df | Mean Square | F-Value | p-Value |
| Model 1 | 101.61 | 9 | 11.29 | 17.69 | 0.0070, significant | 36,274.55 | 9 | 4030.51 | 69.43 | 0.0005, significant |
| X1—Temperature | 9.33 | 1 | 9.33 | 14.62 | 0.0187 | 1453.83 | 1 | 1453.83 | 25.04 | 0.0075 |
| X2—Time | 1.04 | 1 | 1.04 | 1.63 | 0.2702 | 1851.45 | 1 | 1851.45 | 31.89 | 0.0048 |
| X3—Ethanol conc. | 81.78 | 1 | 81.78 | 128.15 | 0.0003 | 30,154.76 | 1 | 30,154.76 | 519.46 | <0.0001 |
| X1X2 | 0.03 | 1 | 0.03 | 0.05 | 0.8264 | 184.63 | 1 | 184.63 | 3.18 | 0.1491 |
| X1X3 | 7.87 | 1 | 7.87 | 12.34 | 0.0246 | 863.41 | 1 | 863.41 | 14.87 | 0.0182 |
| X2X3 | 0.42 | 1 | 0.42 | 0.66 | 0.4620 | 624.93 | 1 | 624.93 | 10.77 | 0.0305 |
| X1 2 | 0.54 | 1 | 0.54 | 0.85 | 0.4081 | 324.50 | 1 | 324.50 | 5.59 | 0.0773 |
| X2 2 | 0.35 | 1 | 0.35 | 0.55 | 0.5004 | 0.50 | 1 | 0.50 | 0.01 | 0.9304 |
| X3 2 | 0.01 | 1 | 0.01 | 0.02 | 0.8900 | 595.43 | 1 | 595.43 | 10.26 | 0.0328 |
| Residual | 2.55 | 4 | 0.64 | 232.20 | 4 | 58.05 | ||||
| Lack of Fit | 2.40 | 3 | 0.80 | 5.41 | 0.3036, not significant | 225.68 | 3 | 75.23 | 11.5415 | 0.2123, not significant |
| Pure Error | 0.15 | 1 | 0.15 | 6.52 | 1 | 6.52 | ||||
| Cor Total | 104.16 | 13 | 36,506.75 | 13 | ||||||
| R2 | 0.9755 | 0.9936 | ||||||||
| Adj—R2 | 0.9204 | 0.9793 | ||||||||
| TPC | ABTS | |||||||||
| E. divaricata | ||||||||||
| Regression coefficients | Sum of squares | Df | Mean square | F-value | p-value | Sum of squares | Df | Mean square | F-value | p-value |
| Model 1 | 388.92 | 9.00 | 43.21 | 48.22 | 0.0010, significant | 168,477.33 | 9 | 18,719.70 | 36.49 | 0.0017, significant |
| X1—Temperature | 6.21 | 1.00 | 6.21 | 6.93 | 0.0580 | 3.50 | 1 | 3.50 | 0.01 | 0.9381 |
| X2—Time | 12.18 | 1.00 | 12.18 | 13.59 | 0.0211 | 3064.95 | 1 | 3064.95 | 5.97 | 0.0709 |
| X3—Ethanol conc. | 356.93 | 1.00 | 356.93 | 398.26 | <0.0001 | 149,222.67 | 1 | 149,222.67 | 290.87 | <0.0001 |
| X1X2 | 3.87 | 1.00 | 3.87 | 4.32 | 0.1062 | 16.28 | 1 | 16.28 | 0.03 | 0.8673 |
| X1X3 | 0.42 | 1.00 | 0.42 | 0.47 | 0.5309 | 936.07 | 1 | 936.07 | 1.82 | 0.2481 |
| X2X3 | 2.44 | 1.00 | 2.44 | 2.73 | 0.1740 | 1841.28 | 1 | 1841.28 | 3.59 | 0.1311 |
| X1 2 | 0.52 | 1.00 | 0.52 | 0.59 | 0.4869 | 1.44 | 1 | 1.44 | 0.00 | 0.9603 |
| X2 2 | 0.57 | 1.00 | 0.57 | 0.64 | 0.4692 | 596.01 | 1 | 596.01 | 1.16 | 0.3418 |
| X3 2 | 5.10 | 1.00 | 5.10 | 5.69 | 0.0756 | 11,015.95 | 1 | 11,015.95 | 21.47 | 0.0098 |
| Residual | 3.58 | 4.00 | 0.90 | 2052.11 | 4 | 513.03 | ||||
| Lack of Fit | 3.57 | 3.00 | 1.19 | 116.40 | 0.0680, not significant | 2048.62 | 3 | 682.87 | 195.96 | 0.0525, not significant |
| Pure Error | 0.01 | 1.00 | 0.01 | 3.4848 | 1 | 3.48 | ||||
| Cor Total | 392.50 | 13.00 | 170,529.44 | 13 | ||||||
| R2 | 0.9908 | 0.9880 | ||||||||
| Adj—R2 | 0.9703 | 0.9609 | ||||||||
| TPC | ABTS | |||||||||
| E. prunastri | ||||||||||
| Regression coefficients | Sum of squares | Df | Mean square | F-value | p-value | Sum of squares | Df | Mean square | F-value | p-value |
| Model 1 | 118.13 | 9 | 13.13 | 17.07 | 0.0075, significant | 90,207.35 | 9 | 10,023.04 | 96.31 | 0.0003, significant |
| X1—Temperature | 4.98 | 1 | 4.98 | 6.48 | 0.0636 | 233.52 | 1 | 233.52 | 2.24 | 0.2085 |
| X2—Time | 2.82 | 1 | 2.82 | 3.67 | 0.1281 | 2023.39 | 1 | 2023.39 | 19.44 | 0.0116 |
| X3—Ethanol conc. | 107.82 | 1 | 107.82 | 141.04 | 0.0003 | 12,836.04 | 1 | 12,836.04 | 123.34 | 0.0004 |
| X1X2 | 0.08 | 1 | 0.08 | 0.11 | 0.7588 | 1.66 | 1 | 1.66 | 0.02 | 0.9055 |
| X1X3 | 1.98 | 1 | 1.98 | 2.57 | 0.1839 | 496.98 | 1 | 496.98 | 4.78 | 0.0942 |
| X2X3 | 0.33 | 1 | 0.33 | 0.43 | 0.5475 | 70.95 | 1 | 70.95 | 0.68 | 0.4554 |
| X1 2 | 0.03 | 1 | 0.03 | 0.04 | 0.8432 | 952.91 | 1 | 952.91 | 9.16 | 0.0389 |
| X2 2 | 0.05 | 1 | 0.05 | 0.07 | 0.8109 | 155.26 | 1 | 155.26 | 1.49 | 0.2890 |
| X3 2 | 0.01 | 1 | 0.01 | 0.01 | 0.9158 | 66,753.37 | 1 | 66,753.37 | 641.42 | <0.0001 |
| Residual | 3.08 | 4 | 0.77 | 416.29 | 4 | 104.07 | ||||
| Lack of Fit | 3.05 | 3 | 1.02 | 39.41 | 0.1164, not significant | 414.61 | 3 | 138.20 | 82.53696151 | 0.0807, not significant |
| Pure Error | 0.03 | 1 | 0.03 | 1.67 | 1 | 1.67 | ||||
| Cor Total | 121.20 | 13 | 90,623.63 | 13 | ||||||
| R2 | 0.9746 | 0.9954 | ||||||||
| Adj—R2 | 0.9175 | 0.9851 | ||||||||
| TPC | ABTS | |||||||||
| L. pulmonaria | ||||||||||
| Regression coefficients | Sum of squares | Df | Mean square | F-value | p-value | Sum of squares | Df | Mean square | F-value | p-value |
| Model 1 | 91.07 | 9 | 10.12 | 6.57 | 0.0427, significant | 11.788.45 | 9 | 1309.83 | 25.15 | 0.0036, significant |
| X1—Temperature | 1.20 | 1 | 1.20 | 0.78 | 0.4268 | 101.15 | 1 | 101.15 | 1.94 | 0.2359 |
| X2—Time | 1.49 | 1 | 1.49 | 0.97 | 0.3807 | 35.77 | 1 | 35.77 | 0.69 | 0.4539 |
| X3—Ethanol conc. | 8.56 | 1 | 8.56 | 5.56 | 0.0778 | 667.51 | 1 | 667.51 | 12.82 | 0.0232 |
| X1X2 | 1.51 | 1 | 1.51 | 0.98 | 0.3779 | 307.13 | 1 | 307.13 | 5.90 | 0.0721 |
| X1 X3 | 0.48 | 1 | 0.48 | 0.31 | 0.6071 | 0.11 | 1 | 0.11 | 0.00 | 0.9652 |
| X2X3 | 3.37 | 1 | 3.37 | 2.19 | 0.2132 | 7.58 | 1 | 7.58 | 0.15 | 0.7222 |
| X1 2 | 3.94 | 1 | 3.94 | 2.56 | 0.1851 | 3.61 | 1 | 3.61 | 0.07 | 0.8054 |
| X2 2 | 1.13 | 1 | 1.13 | 0.74 | 0.4391 | 49.63 | 1 | 49.63 | 0.95 | 0.3843 |
| X3 2 | 61.32 | 1 | 61.32 | 39.82 | 0.0032 | 10,210.40 | 1 | 10,210.40 | 196.02 | 0.0002 |
| Residual | 6.16 | 4 | 1.54 | 208.35 | 4 | 52.09 | ||||
| Lack of Fit | 6.04 | 3 | 2.01 | 16.6072 | 0.1780, not significant | 207.96 | 3 | 69.32 | 177.4777978 | 0.0551, not significant |
| Pure Error | 0.12 | 1 | 0.12 | 0.39 | 1 | 0.39 | ||||
| Cor Total | 97.23 | 13 | 11,996.80 | 13 | ||||||
| R2 | 0.9367 | 0.9826 | ||||||||
| Adj—R2 | 0.8941 | 0.9436 | ||||||||
| TPC | ABTS | |||||||||
| P. furfuracea | ||||||||||
| Regression coefficients | Sum of squares | Df | Mean square | F-value | p-value | Sum of squares | Df | Mean square | F-value | p-value |
| Model 1 | 265.29 | 9 | 29.48 | 77.75 | 0.0004, significant | 48,709.72 | 9 | 5412.19 | 48.38 | 0.0010, significant |
| X1—Temperature | 2.94 | 1 | 2.94 | 7.76 | 0.0495 | 808.75 | 1 | 808.75 | 7.23 | 0.0547 |
| X2—Time | 0.12 | 1 | 0.12 | 0.32 | 0.6009 | 15.62 | 1 | 15.62 | 0.14 | 0.7277 |
| X3—Ethanol conc. | 237.56 | 1 | 237.56 | 626.62 | <0.0001 | 38,764.59 | 1 | 38,764.59 | 346.50 | <0.0001 |
| X1X2 | 0.46 | 1 | 0.46 | 1.22 | 0.3318 | 7.19 | 1 | 7.19 | 0.06 | 0.8124 |
| X1X3 | 0.19 | 1 | 0.19 | 0.51 | 0.5135 | 99.49 | 1 | 99.49 | 0.89 | 0.3991 |
| X2X3 | 0.04 | 1 | 0.04 | 0.11 | 0.7547 | 152.68 | 1 | 152.68 | 1.36 | 0.3076 |
| X1 2 | 1.44 | 1 | 1.44 | 3.79 | 0.1234 | 18.23 | 1 | 18.23 | 0.16 | 0.7071 |
| X2 2 | 1.75 | 1 | 1.75 | 4.63 | 0.0979 | 59.68 | 1 | 59.68 | 0.53 | 0.5056 |
| X3 2 | 16.31 | 1 | 16.31 | 43.01 | 0.0028 | 7849.48 | 1 | 7849.48 | 70.16 | 0.0011 |
| Residual | 1.52 | 4 | 0.38 | 447.50 | 4 | 111.87 | ||||
| Lack of Fit | 1.51 | 3 | 0.50 | 210.9378 | 0.0506, not significant | 446.68 | 3 | 148.89 | 182.5703 | 0.0543, not significant |
| Pure Error | 0.00 | 1 | 0.00 | 0.82 | 1 | 0.82 | ||||
| Cor Total | 266.80 | 13 | 49,157.21 | 13 | ||||||
| R2 | 0.9943 | 0.9909 | ||||||||
| Adj—R2 | 0.9815 | 0.9704 | ||||||||
| Optimal Level of Process Parameters | Optimized Values (Predicted Values) | Experimental Values | |||||
|---|---|---|---|---|---|---|---|
| Temperature (°C) | Time (min) | Ethanol Conc. (%) | TPC mg GAE/g dw | ABTS µmol TE/g dw | TPC mg GAE/g dw | ABTS µmol TE/g dw | |
| B. fuscescens | 40 | 19.34 | 80 | 10.92 | 189.11 | 11.89 ± 0.05 | 188.92 ± 0.80 |
| E. divaricata | 32.23 | 20 | 80 | 15.90 | 311.85 | 15.17 ± 0.13 | 311.38 ± 5.29 |
| E. prunastri | 37.02 | 20 | 80 | 9.89 | 204.50 | 10.97 ± 0.12 | 209.24 ± 0.97 |
| L. pulmonaria | 25 | 20 | 49.49 | 11.52 | 81.11 | 11.73 ± 0.13 | 80.33 ± 0.58 |
| P. furfuracea | 38.04 | 19.63 | 79.57 | 12.62 | 163.75 | 12.08 ± 0.15 | 165.98 ± 1.79 |
| B. fuscescens | E. divaricata | E. prunastri | L. pulmonaria | P. furfuracea | |
|---|---|---|---|---|---|
| Gallic acid | 18.02 ± 0.18 a | 16.17 ± 0.07 c | 16.29 ± 0.02 bc | 15.99 ± 0.16 d | 16.47 ± 0.16 b |
| Protocatechuic acid | 12.16 ± 0.02 b | nd | 11.81 ± 0.17 c | 16.47 ± 0.41 a | 11.71 ± 0.04 c |
| Catechin | 42.52 ± 0.24 a | 10.08 ± 1.96 b | nd | 3.42 ± 0.08 c | nd |
| P-hydroxybenzoic acid | nd | 3.38 ± 0.04 b | 6.74 ± 0.24 a | 3.03 ± 0.08 c | 0.59 ± 0.02 d |
| Syringic acid | 1.22 ± 0.02 b | 0.57 ± 0.05c | 1.66 ± 0.09 b | 5.76 ± 0.36 a | nd |
| Ellagic acid | nd | nd | 4.18 ± 0.17 d | 31.77 ± 0.48 a | 10.56 ± 0.43 b |
| M-coumaric acid | 1.70 ± 0.06 c | 1.05 ± 0.10 d | 5.47 ± 0.47 a | 4.47 ± 0.05 b | nd |
| O-coumaric acid | 0.33 ± 0.03 d | 4.01 ± 0.88 a | 2.43 ± 0.21 b | 0.40 ± 0.07 c | nd |
| Chrysin | 19.42 ± 0.45 a | 0.70 ± 0.04 d | nd | 10.33 ± 0.03 b | 2.63 ± 0.17 c |
| Caffeic acid | 3.04 ± 0.07 b | 2.53 ± 0.06 c | 2.97 ± 0.06 bc | 5.47 ± 0.03 a | 2.53 ± 0.03 c |
| P-coumaric acid | 0.31 ± 0.01 b | 0.38 ± 0.01 ab | nd | 0.21 ± 0.04 c | 0.40 ± 0.01 a |
| Ferulic acid | 1.27 ± 0.09 b | 0.93 ± 0.01 d | 1.03 ± 0.06 bc | 2.34 ± 0.04 a | 0.98 ± 0.09 c |
| Myricetin | 21.93 ± 1.37 a | nd | nd | 20.01 ± 0.06 b | 20.24 ± 0.15 b |
| Quercetin | 10.58 ± 0.01 a | 10.06 ± 0.17 a | 9.79 ± 0.01 bc | 9.57 ± 0.04 c | 9.94 ± 0.46 b |
| Kaempferol | 3.83 ± 0.01 b | 4.82 ± 0.01 a | 3.71 ± 0.03 c | 3.81 ± 0.05 b | 3.70 ± 0.02 c |
| Chlorogenic acid | 39.59 ± 0.15 a | 1.38 ± 0.21 b | 0.59 ± 0.06 c | 1.37 ± 0.16 b | 0.51 ± 0.05 c |
| Rutin | 0.68 ± 0.01 c | 1.15 ± 0.04 b | nd | 0.32 ± 0.06 d | 1.31 ± 0.03 a |
| Sinapic acid | 0.55 ± 0.04 b | nd | nd | 1.87 ± 0.12 a | 0.27 ± 0.01 c |
| Evernic acid | nd | 1350.77 ± 71.30 b | 1587.08 ± 11.33 a | nd | nd |
| Usnic acid | nd | 16.05 ± 0.85 b | 18.86 ± 0.13 a | nd | nd |
| Stictic acid | nd | nd | nd | 908.92 ± 28.36 b | nd |
| Fumarprotocetraric acid | 790.60 ± 17.78 a | nd | nd | nd | nd |
| Physodic acid | nd | nd | nd | nd | 351.41 ± 1.02 a |
| atranorin | nd | nd | nd | nd | 974.40 ± 1.17 a |
| B. fuscescens | E. divaricata | E. prunastri | L. pulmonaria | P. furfuracea | |
|---|---|---|---|---|---|
| Mg | 1.07 ± 0.12 b | 1.21 ± 0.10 b | 124.70 ± 4.07 a | 118.77 ± 3.46 a | 1.28 ± 0.10 b |
| Ca | 22.62 ± 0.37 c | 30.54 ± 0.49 c | 701.94 ± 6.29 a | 546.58 ± 8.91 b | 41.58 ± 0.29 c |
| Na | 0.19 ± 0.03 c | nd | 4.17 ± 0.35 b | 5.05 ± 0.29 a | nd |
| K | 6.50 ± 0.22 c | 6.04 ± 0.15 c | 247.36 ± 6.19 b | 539.45 ± 16.60 a | 9.11 ± 0.14 c |
| P | 1.09 ± 0.07 c | 1.58 ± 0.12 c | 86.42 ± 0.47 b | 126.63 ± 4.97 a | 2.05 ± 0.18 c |
| Fe | 0.60 ± 0.01 c | 1.15 ± 0.13 c | 152.14 ± 1.95a | 84.06 ± 0.64 b | 1.43 ± 0.14 c |
| Zn | nd | nd | 2.04 ± 0.11 b | 2.88 ± 0.27 a | nd |
| Mn | 0.18 ± 0.01 c | 0.21 ± 0.03 c | 12.06 ± 0.38 b | 20.95 ± 0.29 a | 0.12 ± 0.01 c |
| Evernia divaricata | ||
|---|---|---|
| Retention Time | Name of Compound | % of Area |
| 5.369 | Cis-Ocimene | 0.72 |
| 7.327 | Bornylene | 0.92 |
| 7.403 | 1,8-Cineole | 0.33 |
| 9.566 | Cyclopentasiloxane, Decamethyl- | 1.02 |
| 12.274 | Dodecamethylcyclohexasiloxane | 0.52 |
| 14.591 | Tetradecamethylcycloheptasıloxane | 0.22 |
| 14.727 | 1-Ethoxy-2-Methoxy-4-Methylbenzene | 20.88 |
| 15.482 | 1,3-Benzenediol, 5-Pentyl- (Olivetol) | 59.17 |
| 15.990 | 4H-Pyran-4-One, 2,6-Dimethyl- | 0.11 |
| 16.729 | Cis-9-Tetradecen-1-Ol | 0.58 |
| 18.268 | 5,6-Dimethoxy-1-İndanone | 9.36 |
| 18.375 | Octadecamethylcyclononasıloxane | 0.67 |
| 19.779 | N-Hexadecanoic Acid | 1.58 |
| 19.927 | Eıcosamethylcyclodecasıloxane | 0.83 |
| 21.354 | Tetracosamethylcyclododecasıloxane | 0.49 |
| 22.643 | Octadecamethylcyclononasıloxane | 0.43 |
| 23.829 | 1H-Purin-6-Amine, [(2-Fluorophenyl)Methyl]-(CAS) | 0.58 |
| 25.035 | Tetracosamethylcyclododecasıloxane | 0.45 |
| 28.431 | Squalene | 1.08 |
| 42.419 | Glycerıne-1-Oleate-3-Palmıtate | 0.06 |
| Bryoria fuscescens | ||
| Retention time | Name of Compound | % of Area |
| 3.075 | Propene 3,3,3-D3 | 0.4 |
| 3.177 | Formamide, N-(2-Methylpropyl)-(CAS) N-Isobutylformamide | 0.28 |
| 7.135 | L-Limonene | 0.31 |
| 8.525 | Hexanal (CAS) N-Hexanal | 0.3 |
| 9.501 | Cyclopentasiloxane, Decamethyl-(CAS) Dimethylsiloxane Pentamer | 0.35 |
| 14.366 | 1-Dodecanol (CAS) N-Dodecanol | 0.46 |
| 14.75 | 1-Ethoxy-2-Methoxy-4-Methylbenzene | 0.45 |
| 15.210 | 4-Cyano-2,2,5,5-Tetramethyl-3-İmidazoline-3-Oxide-1-Oxile | 0.34 |
| 15.320 | Dipropyl Hydroxybutanedioate | 0.42 |
| 15.506 | Benzaldehyde, 2,4-Dihydroxy-6-Methyl-(CAS) 2,4-Dihydroxy-6-Methylbenzaldehyde | 16.61 |
| 15.670 | 1-Heptanethiol (Cas) Heptylthiol | 2.53 |
| 15.890 | Hexyl 2-Methylbutanoate | 13.89 |
| 16.113 | Ribitol | 35.61 |
| 16.730 | Cis-9-Tetradecen-1-Ol | 1.09 |
| 17,331 | Benzoic Acid, 2,4-Dihydroxy-3,6-Dimethyl-, Methyl Ester (CAS) Methyl 2,4-Dihydroxy-3,6-Dimethylbenzoate | 0.29 |
| 17,601 | Cyclohexene, 1-(3-Ethoxy-1-Propenyl)-, (Z)-(CAS) CIS-1-(1-CYCLOHEXENYL)-3-ETHOXYPROPENE | 0.69 |
| 17.71 | Tetradecanoic Acid (CAS) Myristic Acid | 0.55 |
| 17.78 | Ethyl 2,4-Dihydroxy-6-Methylbenzoate | 0.69 |
| 18.398 | Isopropyl Myristate | 0.33 |
| 18.749 | Barbatolic Acid | 6.35 |
| 19.524 | 1,4,8-Dodecatriene, (E,E,E)-(Cas) | 0.32 |
| 19.6 | Ethanol, 2-(9-Octadecenyloxy)-, (Z)-(CAS) 2-CIS-9-OCTADECENYLOXY ETHANOL | 0.55 |
| 19.781 | N-Hexadecanoic Acid | 2.5 |
| 20.01 | Phthalıd, 4,6-Dımethoxy- | 0.46 |
| 20.11 | Hexadecanoic Acid, Ethyl Ester (CAS) Ethyl Palmitate | 0.27 |
| 20.547 | 5-Hydroxymethyl-1,1,4a-Trımethyl-6-Methylene-Decahydro-Naphthalen-2-Ol | 0.33 |
| 21.271 | (E)-Phytol | 0.34 |
| 21.451 | 9,12-Octadecadienoic Acid (Z,Z)- | 1.86 |
| 21.489 | Octadec-9-Enoıc Acıd | 3.97 |
| 21.679 | Octadecanoic Acid | 1.34 |
| 22.86 | Cyclohept-4-Enecarboxylıc Acıd | 0.43 |
| 24.396 | Benzoesaeure, 5-Methyl-2-Trımethylsılyloxy-, Trımethylsılylester | 0.27 |
| 24.701 | Hexadecanoic Acid, 2-Hydroxy-1-(Hydroxymethyl)Ethyl Ester (CAS) 2-Monopalmitin | 0.33 |
| 25.075 | 1,2-Benzenedicarboxylic Acid, Diisooctyl Ester | 0.4 |
| 26.889 | Octadecanoic Acid, 2,3-Dihydroxypropyl Ester (CAS) 1-Monostearin | 2.65 |
| 27.287 | 1,2-Benzenedicarboxylic Acid, Dioctyl Ester (CAS) Dioctyl Phthalate | 0.42 |
| 27.49 | 1,3(2H,9bh)-Dibenzofurandione, 2,6-Diacetyl-7,9-Dihydroxy-8,9b-Dimethyl-(CAS) Usno | 0.54 |
| 28.43 | Squalene | 0.34 |
| 38.542 | D-Mannıtol, 1-Decylsulfonyl- | 0.4 |
| 42.28 | Cyclotrisiloxane, Hexamethyl- | 0.34 |
| Pseudevernia furfuracea | ||
| Retention Time | Name of Compound | % of Area |
| 9.527 | Cyclopentasiloxane, Decamethyl-(CAS) Dimethylsiloxane Pentamer | 0.23 |
| 12.268 | Cyclohexasiloxane, Dodecamethyl-(CAS) Dodecamethylcyclohexasiloxane | 0.15 |
| 14.015 | Xanthosine (CAS) Xanthine Riboside | 0.35 |
| 15.435 | 2-Ethyl-Norborneol | 0.37 |
| 15.56 | 1,2-Ethanediol, 1-(2-Phenyl-1,3,2-Dioxaborolan-4-Yl)-, [S-(R*,R*)]-(CAS) L-THREIT, 1,2-O-(PHENYLBORANDIYL)- | 0.64 |
| 15.605 | Ribitol | 0.65 |
| 15.735 | 1-Methylcyclohexanol | 2.35 |
| 15.825 | D-Mannitol | 2.62 |
| 15.89 | L-Arabinitol | 2.41 |
| 15.93 | Pentane-1,2,3,4,5-Pentaol | 1.19 |
| 15.965 | Myo Inosıtols | 1.69 |
| 16.105 | D-Mannitol | 7.21 |
| 16.244 | D-Mannitol | 9.48 |
| 16.345 | 2,5-Dimethyl-4-Hydroxy-3-Hexanone | 8.19 |
| 16.387 | Ribitol | 3.6 |
| 16.495 | Ribitol | 20.2 |
| 16.727 | 1,13-Tetradecadiene | 0.9 |
| 17.252 | 1,3-Benzenediol, 4-Hexyl-(CAS) Oxana | 1.15 |
| 17.321 | Benzoic Acid, 2,4-Dihydroxy-3,6-Dimethyl-, Methyl Ester (CAS) Methyl 2,4-Dihydroxy-3,6-Dimethylbenzoate | 3.05 |
| 17.805 | 1,3-Benzenediol, 5-Pentyl- | 4.24 |
| 17.98 | 5,6-Decanediol (CAS) | 0.26 |
| 18.377 | Octadecamethylcyclononasıloxane | 0.16 |
| 18.563 | Neophytadıene | 0.12 |
| 19.521 | 1,4,8-Dodecatriene, (E,E,E)-(CAS) | 1 |
| 19.594 | 3,6-Octadecadienoic Acid, Methyl Ester (CAS) METHYL 3,6-OCTADECADIENOATE | 0.58 |
| 19.779 | N-Hexadecanoic Acid | 3.86 |
| 21.27 | Phytol Isomer | 0.51 |
| 21.449 | 9,12-Octadecadienoic Acid (Z,Z)- | 4.12 |
| 21.516 | 9,12,15-Octadecatrienoic Acid, Methyl Ester, (Z,Z,Z)- | 6.9 |
| 21.673 | Octadecanoic Acid | 1.16 |
| 22.862 | Atis-16-Ene, (5.Beta.,8.Alpha.,9.Beta.,10.Alpha.,12.Alpha.)- (CAS) Atiserene | 0.14 |
| 23.148 | 2,6-Dı-Tert-Butyl-Octahydro-Azulene-3a,8-Dıol | 2.3 |
| 23.384 | 7-Isopropyl-10-Methyl-1,5-Dıoxaspıro [5.5]Undecan-2,4-Dione | 0.14 |
| 23.505 | Benzyl Alectoronate | 2.82 |
| 23.68 | 6,8-Dıoxabıcyclo(3.2.1)Octan-3.Beta.-Ol | 0.19 |
| 24.317 | 1-Phenanthrenecarboxylic Acid, 1,2,3,4,4a,9,10,10a-Octahydro-1,4a-Dimethyl-7-(1-Methylethyl)-, [1R-(1.Alpha.,4a.Beta.,10a.Alpha | 0.17 |
| 24.69 | Hexadecanoic Acid, 2-Hydroxy-1-(Hydroxymethyl)Ethyl Ester (CAS) 2-Monopalmitin | 0.81 |
| 25.56 | 4,7-Methanoisobenzofuran-1-Ol, 1,3,3a,4,7,7a-Hexahydro- (CAS) 2,2-DIMETHYL-1-(3-OXO-BUT-1-ENYL)-CYCLOPENTANECARBALDEHYDE | 0.45 |
| 26.87 | Octadecanoic Acid, 2,3-Dihydroxypropyl Ester | 3.64 |
| Evernia prunastri | ||
| Retention Time | Name of Compound | % of Area |
| 7.188 | Dl-Limonene | 0.1 |
| 7.263 | 1,8-Cineole | 0.12 |
| 9.512 | Cyclopentasiloxane, Decamethyl-(CAS) Dimethylsiloxane Pentamer | 0.26 |
| 12.257 | Cyclohexasiloxane, Dodecamethyl- | 0.34 |
| 12.312 | 3-Methoxy-2-Methylphenol | 5.82 |
| 13.067 | 3,5-Dihydroxytoluene | 32.53 |
| 13.435 | 2-Methoxy-5-Methyl Pyrazıne | 0.4 |
| 13.495 | 3,5-Dihydroxytoluene | 0.22 |
| 14.583 | Tetradecamethylcycloheptasıloxane | 0.22 |
| 15.7 | S-Methyl-L-Cysteine | 0.18 |
| 15.76 | Ribitol (CAS) Adonit | 0.37 |
| 15.875 | Sorbitol | 1.41 |
| 15.92 | Ribitol | 0.71 |
| 16 | D-Arabitol | 2.06 |
| 16.085 | Sorbitol | 3.17 |
| 16.145 | D-Arabitol | 2.46 |
| 16.319 | Ribitol (CAS) Adonit | 8.83 |
| 16.355 | Pentane-1,2,3,4,5-Pentaol | 2.96 |
| 16.432 | Ribitol (CAS) Adonit | 9.22 |
| 16.717 | Oleyl Alcohol | 0.35 |
| 16.804 | Methyl Ester Of 2-Hydroxy-4-Methoxy-6-Methyl-Benzoic Acid | 6.2 |
| 17.296 | Benzoic Acid, 2,4-Dihydroxy-3,6-Dimethyl-, Methyl Ester (CAS) Methyl 2,4-Dihydroxy-3,6-Dimethylbenzoate | 1.62 |
| 17.59 | Benzoic Acid, 2-Hydroxy-4-Methoxy-3,6-Dimethyl-, 4-Carboxy-3-Hydroxy-5-Methylphenyl Ester (CAS). Beta.-Resorcylic Acid, 6-Methy | 0.28 |
| 18.367 | Octadecamethylcyclononasıloxane | 0.14 |
| 19.511 | 1,4,8-Dodecatriene, (E,E,E)-(CAS) | 0.5 |
| 19.59 | Tetradecadien-4,9 Ol-1 | 0.16 |
| 19.765 | Pentadecanoic Acid | 2.61 |
| 19.919 | Eıcosamethylcyclodecasıloxane | 0.23 |
| 20.963 | 1-Eicosanol (CAS) N-Eicosanol | 0.39 |
| 21.259 | Phytol | 0.28 |
| 21.438 | 9,12-Octadecadienoic Acid (Z,Z)- | 3.89 |
| 21.478 | Octadec-9-Enoıc Acıd | 3.3 |
| 21.506 | 11,14,17-Eicosatrienoic Acid, Methyl Ester (CAS) METHYL-11,14,17-EICOSATRIENOATE | 3.72 |
| 21.663 | Octadecanoic Acid | 1.05 |
| 22.081 | Acetic Acid, Octadecyl Ester | 0.59 |
| 22.782 | 1-Octadecanol (CAS) Stenol | 0.09 |
| 24.681 | Hexadecanoic Acid, 2-Hydroxy-1-(Hydroxymethyl)Ethyl Ester (CAS) 2-Monopalmitin | 0.58 |
| 25.061 | 1,2-Benzenedicarboxylic Acid, Bis(2-Ethylhexyl) Ester (CAS) Bis(2-Ethylhexyl) Phthalate | 0.19 |
| 26.859 | Octadecanoic Acid, 2-Hydroxy-1-(Hydroxymethyl)Ethyl Ester (CAS) 2-Monostearin | 1.71 |
| 27.428 | Usnic Acid | 0.74 |
| Lobaria pulmonaria | ||
| Retention Time | Name of Compound | % of Area |
| 9.224 | 5-Heptenoic Acid, Ethyl Ester, (E)-(CAS) ETHYL TRANS 5-HEPTENOATE | 0.21 |
| 12.256 | Cyclohexasiloxane, Dodecamethyl- | 0.26 |
| 12.375 | 3-Methoxy-2-Methylphenol | 0.32 |
| 12.432 | Methyl 2-Oxo-5-Cycloheptene Carboxylate | 0.49 |
| 13.975 | P-Mentha-6,8-Dien-2-One, Semicarbazone (CAS) CARVONE SEMICARBAZONE | 0.19 |
| 14.582 | Tetradecamethylcycloheptasıloxane | 0.22 |
| 15.215 | 3,3-Dimethyl-1,4-Diphenylazetidin-2-İmine | 0.21 |
| 15.27 | D-Mannitol | 0.28 |
| 15.345 | Sorbitol | 0.76 |
| 16.255 | D-Mannitol | 51.09 |
| 16.315 | Ribitol | 16.59 |
| 16.617 | Hexadecamethylcyclooctasıloxane | 1.2 |
| 16.715 | 1-Piperazinecarboxylic Acid, Ethyl Ester | 0.7 |
| 16.82 | Spiro[5.5]Undec-8-En-1-One (CAS) Spiro[5.5]Undec-2-En-7-One | 0.48 |
| 16.925 | Sorbitol | 0.44 |
| 18.032 | (-)-Loliolide | 0.17 |
| 18.365 | Octadecamethylcyclononasıloxane | 0.2 |
| 19.595 | 9,12,15-Octadecatrienoic Acid, Methyl Ester, (Z,Z,Z)- | 0.44 |
| 19.765 | N-Hexadecanoic Acid | 2.53 |
| 19.919 | Eıcosamethylcyclodecasıloxane | 0.73 |
| 20.089 | Hexadecanoic Acid, Ethyl Ester (CAS) Ethyl Palmitate | 0.19 |
| 21.344 | Tetracosamethylcyclododecasıloxane | 0.18 |
| 21.436 | 9,12-Octadecadienoic Acid (Z,Z)- | 2.72 |
| 21.475 | Octadec-9-Enoıc Acıd | 6.93 |
| 21.694 | Ethyl Linoleate | 3.34 |
| 21.737 | Ethyl Oleate | 4.71 |
| 22.631 | Octadecamethylcyclononasıloxane | 0.27 |
| 23.817 | Eıcosamethylcyclodecasıloxane | 0.25 |
| 24.031 | 2-Propen-1-One, 1,3-Diphenyl- | 0.2 |
| 24.686 | Hexadecanoic Acid, 2-Hydroxy-1-(Hydroxymethyl)Ethyl Ester (CAS) 2-Monopalmitin | 0.32 |
| 25.026 | 1H-Purin-6-Amine, [(2-Fluorophenyl)Methyl]-(CAS) | 0.42 |
| 26.504 | Tetracosamethylcyclododecasıloxane | 0.28 |
| 26.866 | Octadecanoic Acid, 2,3-Dihydroxypropyl Ester | 0.42 |
| 28.402 | 1H-Purin-6-Amine, [(2-Fluorophenyl)Methyl]-(CAS) | 0.25 |
| 30.911 | Eıcosamethylcyclodecasıloxane | 0.47 |
| 34.295 | Eıcosamethylcyclodecasıloxane | 0.51 |
| 38.86 | Cyclobuta[1,2:3,4]Dicyclooctene, Hexadecahydro-, (6a.Alpha.,6b.Alpha.,12a.Alpha.,12b.Alpha.)-(CAS) TRICYCLO[8.6.0.0(2,9)]HEXAD | 0.34 |
| 38.926 | 1H-Purin-6-Amine, [(2-Fluorophenyl)Methyl]-(CAS) | 0.36 |
| 40.61 | Acetamide, N,N′-[(3.Beta.)-18-Hydroxypregn-5-Ene-3,20-Diyl]Bis- (CAS) 3.BETA.,20-BIS(ACETYLAMINO)-5-PREGNEN-18-OL | 0.16 |
| 43.773 | 9-Nonylphenyl-3,6,9-Trioxanonanol, Mix of İsomers | 0.17 |
| Lichen Species | IC50 (mg/mL) | ||
|---|---|---|---|
| S. aureus (ATCC 25923) | E. coli O157: H7 (ATCC 33150) | S. typhimurium (ATCC 14028) | |
| E. divaricata | 0.63 ± 0.02 e | 0.88 ± 0.03 c | 0.88 ± 0.09 d |
| E. prunastri | 0.80 ± 0.10 c | 0.99 ± 0.09 b | 0.90 ± 0.04 d |
| L. pulmonaria | 1.68 ± 0.08 a | - | 1.88 ± 0.04 a |
| P. furfuracea | 0.75 ± 0.01 d | 0.88 ± 0.06 c | 0.89 ± 0.07 e |
| B. fuscescens | 1.01 ± 0.08 b | 1.27 ± 0.09 a | 0.99 ± 0.03 c |
| Streptomycin | 0.49 ± 0.01 f | 0.51 ± 0.07 d | 1.76 ± 0.04 b |
Disclaimer/Publisher’s Note: The statements, opinions and data contained in all publications are solely those of the individual author(s) and contributor(s) and not of MDPI and/or the editor(s). MDPI and/or the editor(s) disclaim responsibility for any injury to people or property resulting from any ideas, methods, instructions or products referred to in the content. |
© 2025 by the authors. Licensee MDPI, Basel, Switzerland. This article is an open access article distributed under the terms and conditions of the Creative Commons Attribution (CC BY) license (https://creativecommons.org/licenses/by/4.0/).
Share and Cite
Ozkan, K.; Bekiroglu, H.; Cebi, N.; Bozkurt, F.; Dere, S.; Ozdemir, H.; Arici, M.; Karasu, S.; Sagdic, O. Optimizing the Extraction of Polyphenols from Different Edible Lichens Using Response Surface Methodology and the Determination of Their Mineral and Antibacterial Properties. Foods 2025, 14, 2562. https://doi.org/10.3390/foods14152562
Ozkan K, Bekiroglu H, Cebi N, Bozkurt F, Dere S, Ozdemir H, Arici M, Karasu S, Sagdic O. Optimizing the Extraction of Polyphenols from Different Edible Lichens Using Response Surface Methodology and the Determination of Their Mineral and Antibacterial Properties. Foods. 2025; 14(15):2562. https://doi.org/10.3390/foods14152562
Chicago/Turabian StyleOzkan, Kubra, Hatice Bekiroglu, Nur Cebi, Fatih Bozkurt, Sevda Dere, Hilmi Ozdemir, Muhammet Arici, Salih Karasu, and Osman Sagdic. 2025. "Optimizing the Extraction of Polyphenols from Different Edible Lichens Using Response Surface Methodology and the Determination of Their Mineral and Antibacterial Properties" Foods 14, no. 15: 2562. https://doi.org/10.3390/foods14152562
APA StyleOzkan, K., Bekiroglu, H., Cebi, N., Bozkurt, F., Dere, S., Ozdemir, H., Arici, M., Karasu, S., & Sagdic, O. (2025). Optimizing the Extraction of Polyphenols from Different Edible Lichens Using Response Surface Methodology and the Determination of Their Mineral and Antibacterial Properties. Foods, 14(15), 2562. https://doi.org/10.3390/foods14152562