3.1. Physical Properties of Fruits
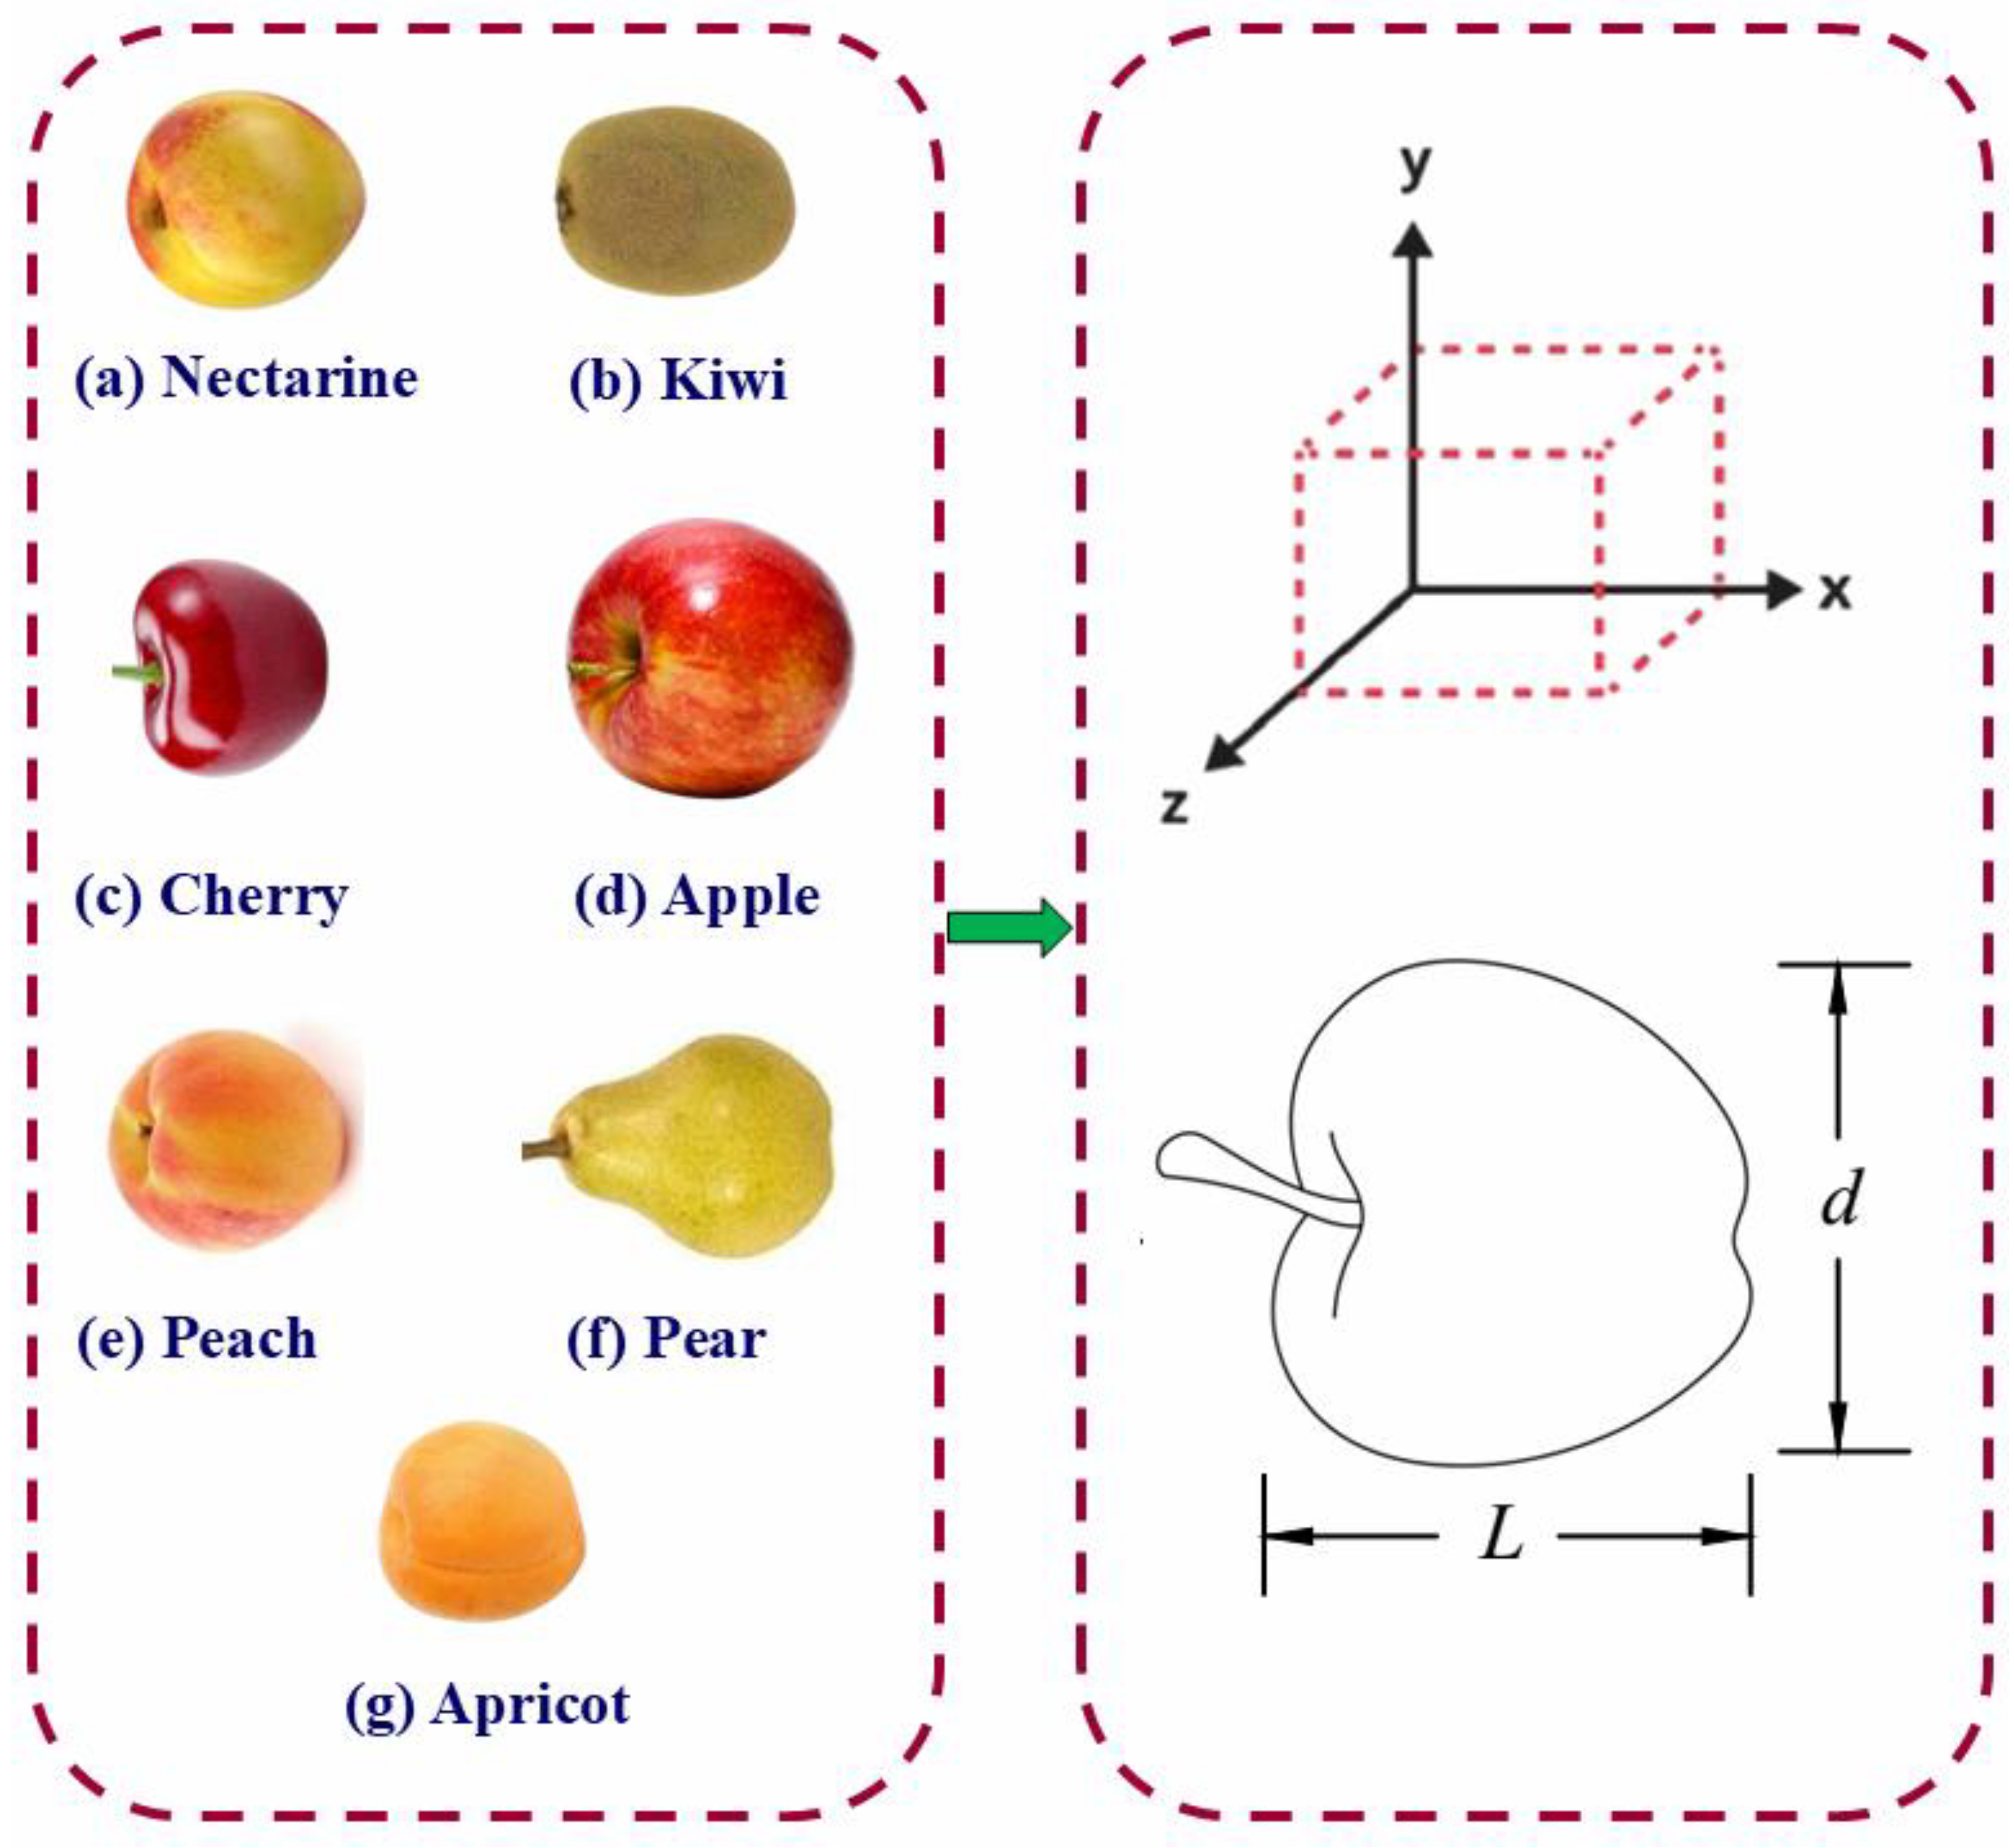
Table 1 presents the physical characteristics of seven commonly consumed fruit types, including nectarine, kiwi, cherry, apple, peach, pear, and apricot. The analysis included parameters such as length, diameter, flesh thickness, pit diameter, fruit mass, volume, true and bulk density, moisture content, geometric mean diameter, and sphericity. These are essential in assessing their physical and handling behavior during post-harvest operations.
For fruit dimensions, the length and diameter were key measurements in defining the general shape and size of the fruits. Apples and pears displayed the most considerable lengths among the tested fruits, with mean values of approximately 71.13 mm and 81.29 mm, respectively, indicating their elongated morphology, especially in the pear cultivar. Conversely, cherry had the shortest length (around 21.58 mm), consistent with its small, spherical nature. Fruit diameter followed a similar trend, with apples reaching a maximum average of 76.96 mm. Notably, nectarine and kiwi demonstrated very close values of length and diameter (e.g., nectarine: ~63.5 mm length and ~64.1 mm diameter), which support their near-spherical form. The sphericity values, calculated based on the geometric mean diameter, further confirmed this, with nectarine exhibiting a high sphericity (~1.00), indicating minimal deviation between the axial dimensions. At the same time, kiwi showed a relatively lower value (~0.89), suggesting more elongation. Flesh thickness (
Tf) is particularly significant for mechanical property studies, especially in determining fruit firmness and suitability for non-destructive testing. Among the fruits evaluated, nectarines had the highest average flesh thickness (~18.96 mm), followed by pears and apples (~12–12.7 mm). In contrast, cherries showed the lowest flesh thickness (~7.12 mm), reflecting their smaller size and higher pit-to-flesh ratio. These values are critical when considering consumer acceptability and potential peeling or slicing operations [
26,
27].
Regarding pit diameter (
dp), apples and peaches had values exceeding 22 mm, while cherries and kiwi had substantially smaller pits (below 15 mm). Notably, apples’ core diameter (22.97 mm) aligned closely with previous studies on ‘Golden Delicious’ and ‘Red Chief’ cultivars [
28]. This parameter influences the edible portion and is essential for evaluating bioyield and mechanical damage during coring. Apples exhibited the highest average fruit mass (~160.70 g), followed closely by pears and nectarines. Cherries, as expected, had the lowest mass (~7.84 g). These weight differences significantly affect packaging and transportation design. The volume measurements showed a proportional relationship with fruit mass, indicating consistent density across the fruit tissues. Notably, pear and apple fruits had the highest volumes (>165 cm
3), whereas cherries were again the smallest (~6.55 cm
3). True density values (
ρT), calculated as mass-to-volume ratios, revealed that cherries had the highest density (~1.21 g cm
−3), indicating a more compact structure, while apples had the lowest (~0.95 g cm
−3). These findings are consistent with recent observations in fruit characterization studies [
29,
30].
Bulk density (
ρb), which considers the voids between fruits in bulk storage or packaging, was generally lower across all fruit types, with a uniform value of ~0.60 g cm
−3 in apple, pear, peach, and apricot. Cherries again exhibited the highest bulk density (~0.55 g cm
−3), likely due to their small size allowing for denser packing. These values are essential for designing storage bins and optimizing load capacities in transportation [
31]. Moisture content (
MC) across all fruit types remained consistently high, ranging from approximately 83% to nearly 87%, reflecting the fruits’ fresh state at full ripeness. Peaches showed the highest average moisture content (~86.96%), corresponding to their soft texture and juicy characteristics. Conversely, nectarines and kiwis displayed slightly lower moisture levels (~83.3–83.8%), still within the acceptable range for fresh consumption but indicating more compact flesh. These findings align with previous assessments of post-harvest moisture variability in stone and pome fruits [
32]. Geometric mean diameter (
dg), calculated using the formula involving length and diameter, was highest in apples (~73.98 mm), followed by pears and nectarines. Cherries had the smallest geometric mean (~22.79 mm), supporting the morphological assessments. The geometric mean is particularly valuable for predicting rolling behavior on conveyor systems and aids in size grading processes [
33]. Sphericity (
S) provides insight into the degree of roundness of the fruits. Most fruits, including apples, peaches, and apricots, had high sphericity values (>1.00), indicating near-spherical shapes. Kiwi had the lowest sphericity (~0.89), suggesting an elongated structure. This characteristic is important in determining fruit orientation during automated handling or packaging. Recent studies have reported similar sphericity trends involving non-destructive imaging and shape recognition in fruits [
34]. Several of these physical properties influence the mechanical response and post-harvest behavior of the fruits. For instance, thicker pulp (
Tf) may allow greater energy absorption under compression, reducing rupture risk, while higher fruit mass and volume can affect stacking pressure tolerance during storage. Variations in density also reflect tissue compactness, which plays a role in firmness and deformation capacity.
Overall, the physical characteristics observed for these fruits provide critical inputs for designing handling, storage, and processing equipment. The moderate to high variability in some traits, such as pit diameter and flesh thickness, suggests that cultivar-specific adaptations may be necessary. Statistical analysis confirmed significant differences (p < 0.05) between the fruit types across most measured traits, reinforcing the importance of tailored post-harvest strategies for each fruit species.
3.2. Mechanical Properties of Fruits
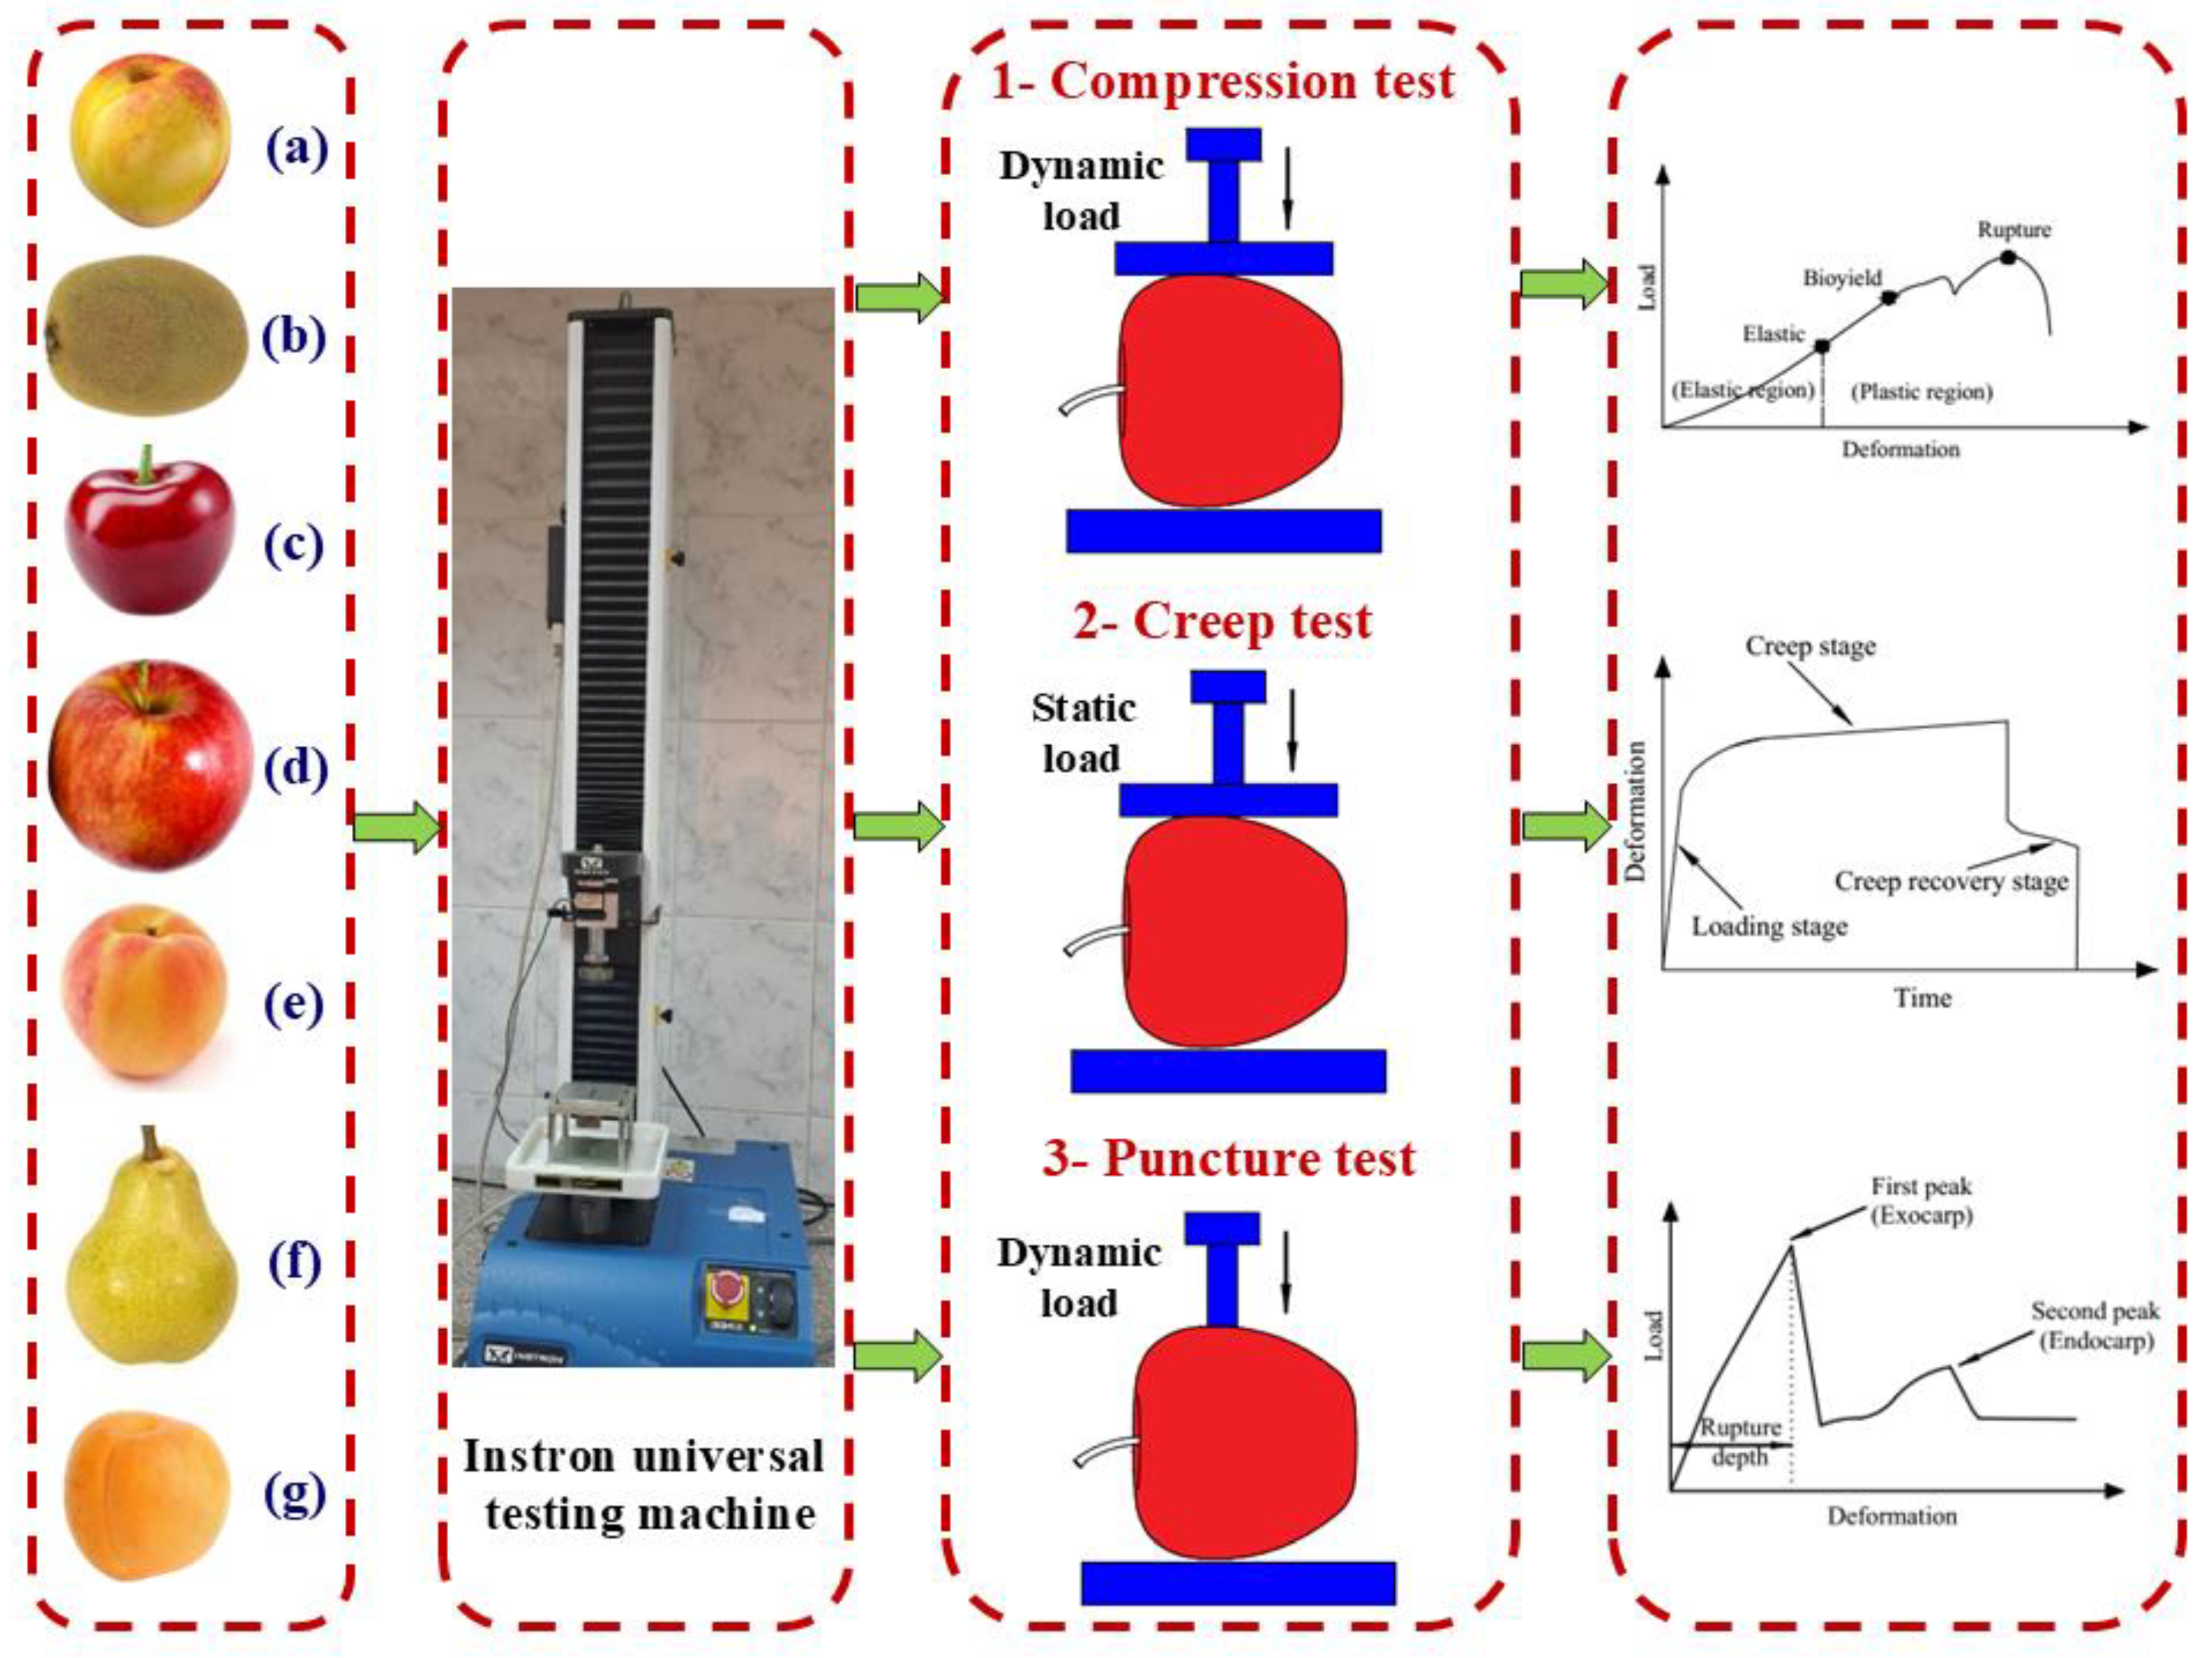
3.2.1. Fruit Compression Test
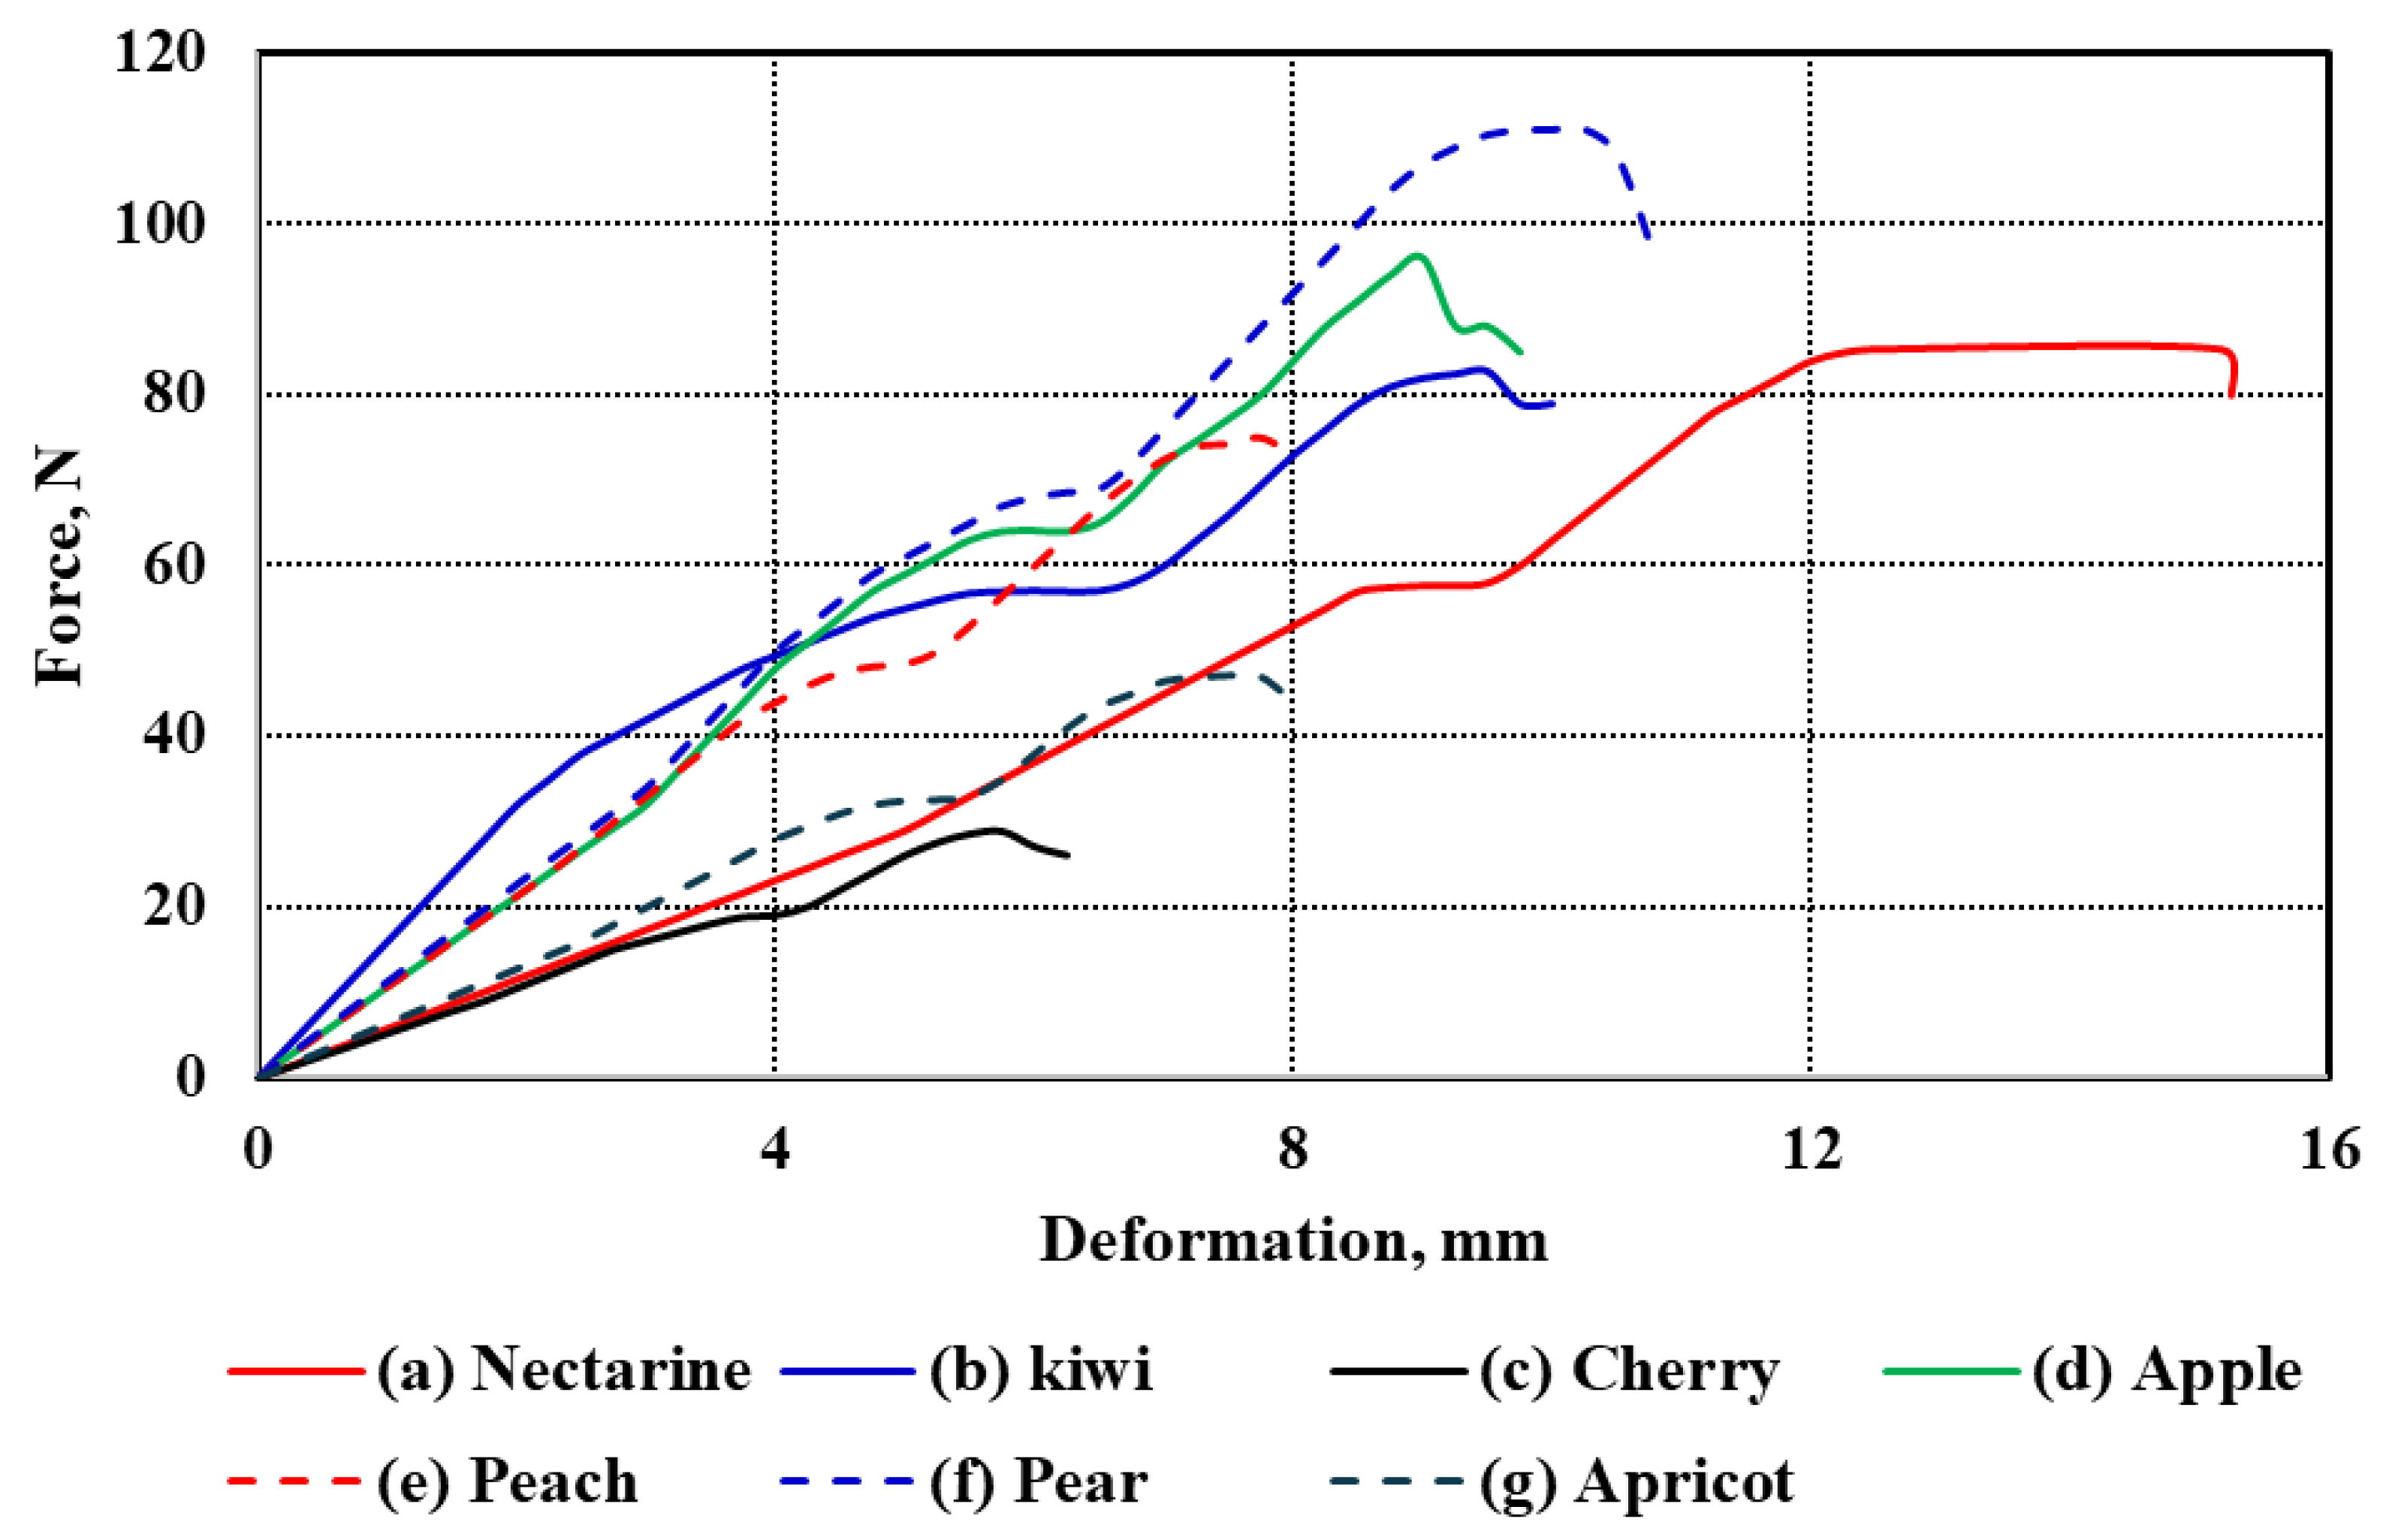
The force–deformation curves of the seven studied fruit types under uniaxial compression are illustrated in
Figure 3a–g. These curves represent the mechanical response of each fruit under compressive loading, revealing distinct patterns that reflect differences in tissue structure, firmness, and anatomical features. All curves follow a typical biological material response, starting with an initial elastic region, then a nonlinear plastic deformation phase, finally leading to rupture and fracture. While the general trend is consistent across the fruits, notable differences exist in the extent and shape of the deformation profiles.
Among all samples, cherry exhibited the lowest deformation values across all stages, which aligns with its small size and relatively thin flesh (Tf = 7.12 mm). In contrast, nectarine showed the highest deformation range, extending beyond 15 mm, consistent with its relatively large diameter (d = 64.11 mm) and moderate flesh thickness (Tf = 18.96 mm). Similarly, pear and apple, which have substantial sizes (L = 81.29 mm and 71.13 mm, respectively), demonstrated extended deformation curves, suggesting more gradual energy absorption before failure.
The kiwi and apricot curves exhibit intermediate behavior. Although kiwi has a smaller diameter (d = 50.24 mm) than nectarine and apple, its relatively thick flesh (Tf = 12.02 mm) appears to contribute to its moderate resistance to deformation. Despite having a smaller size (L = 36.17 mm, d = 36.37 mm), apricot still demonstrates appreciable deformation capacity, likely influenced by its moderately thick pericarp (Tf = 9.38 mm). On the other hand, peach, with a diameter comparable to nectarine (d = 65.21 mm), showed a shorter deformation span, which may be attributed to its lower flesh thickness (Tf = 9.25 mm) and potential structural differences in cell arrangement. Apple and pear exhibited the most extended rupture regions, reflecting their firm internal structure and high resistance to mechanical damage. Their deformation curves also show a more gradual decline after peak force, indicating a more ductile-like failure compared to the sharper drop observed in fruits like cherries and apricots. These differences are likely influenced by fruit size, geometry, and tissue composition, such as cell wall thickness, intercellular adhesion, and moisture content.
Overall, the observed differences in deformation behavior among the fruits can be attributed to the combined effects of morphological parameters—length (
L), diameter (
d), and flesh thickness (
Tf)—as summarized in
Table 1. Larger and thicker-fleshed fruits generally showed higher deformation capacities before rupture, whereas smaller and thinner-fleshed fruits exhibited earlier failure. These mechanical characteristics are critical for post-harvest handling, packaging, and processing decisions, where fruit resistance to mechanical stress directly impacts shelf life and market quality.
The mechanical parameters evaluated for the studied fruits, as presented in
Table 2, include bioyield force (
Fy), rupture force (
Fr), the ratio of rupture to bioyield force (
Rry), modulus of elasticity (
E), and the work required to rupture (
W). These properties reflect each fruit type’s texture, structural integrity, and resistance to mechanical damage. Bioyield force and rupture force showed noticeable variations among the fruits. Pear and apple recorded the highest values in both parameters, indicating a firmer and more resistant structure. In contrast, cherry and apricot had the lowest forces, highlighting their delicate texture. For example, the rupture force of the pear exceeded 110 N, while cherry registered values below 30 N, showing a clear contrast in mechanical strength. Nectarine, kiwi, and peach showed intermediate behavior, with rupture forces ranging from the mid-70s to mid-80s N, suggesting they possess moderate firmness compared to the two extremes. The ratio of rupture to bioyield force values for most fruits were relatively close, generally ranging from 1.45 to 1.62. Pear had the highest strain, indicating a greater ability to deform before rupture, while fruits such as kiwi and apricot showed slightly lower strain values. These results suggest that most fruits exhibited a certain level of elasticity before structural failure, although the extent of this elasticity varied slightly among them. The modulus of elasticity, reflecting the stiffness of fruit tissues, varied noticeably among the tested samples. Kiwi demonstrated the highest stiffness with an elasticity modulus of 0.72 MPa, followed by pear, apricot, and apple, all of which showed moderate values around 0.36–0.37 MPa.
In contrast, nectarine and peach exhibited lower stiffness values, approximately 0.28–0.29 MPa, while cherry remained on the lower end with a modulus of 0.40 MPa. These differences highlight the variation in structural firmness among fruits, which is influenced by their internal cellular composition and water content. The work required to rupture the fruit, representing the energy absorbed during deformation and fracture, followed trends consistent with the force values. Pear required the highest energy to rupture, with a value of around 0.72 kJ, while cherry absorbed the least energy, approximately 0.31 kJ. Apple and peach also required relatively high energy inputs, ranging between 0.58 and 0.65 kJ, suggesting that firmer fruits resist rupture more effectively. In contrast, apricots and nectarines required moderate energy inputs, reflecting their intermediate firmness.
Statistical analysis confirmed that differences among fruit types were significant across all mechanical parameters (Fy, Fr, Rry, E, and W). Pear consistently exhibited the highest values, significantly differing from most other fruits—particularly cherry and apricot—regarding bioyield force, rupture force, rupture-to-bioyield ratio, and energy to rupture. Apple also showed high mechanical strength and was statistically superior to softer fruits like cherry and apricot. However, it was not always significantly different from intermediate-texture fruits such as nectarine and peach. Nectarine and kiwi often appeared within the same statistical group, suggesting their mechanical properties are comparable, especially in bioyield force and rupture characteristics. In contrast, cherry and apricot consistently formed the lowest statistical groups across most parameters, confirming their relatively soft texture and vulnerability to mechanical damage.
These findings underline the broad mechanical diversity among fruit types. Firmer fruits like pear and apple, with higher resistance to rupture and energy absorption before failure, are better suited for handling and transport. Meanwhile, softer fruits such as cherries and apricots require more delicate post-harvest treatment to reduce mechanical injury and preserve quality.
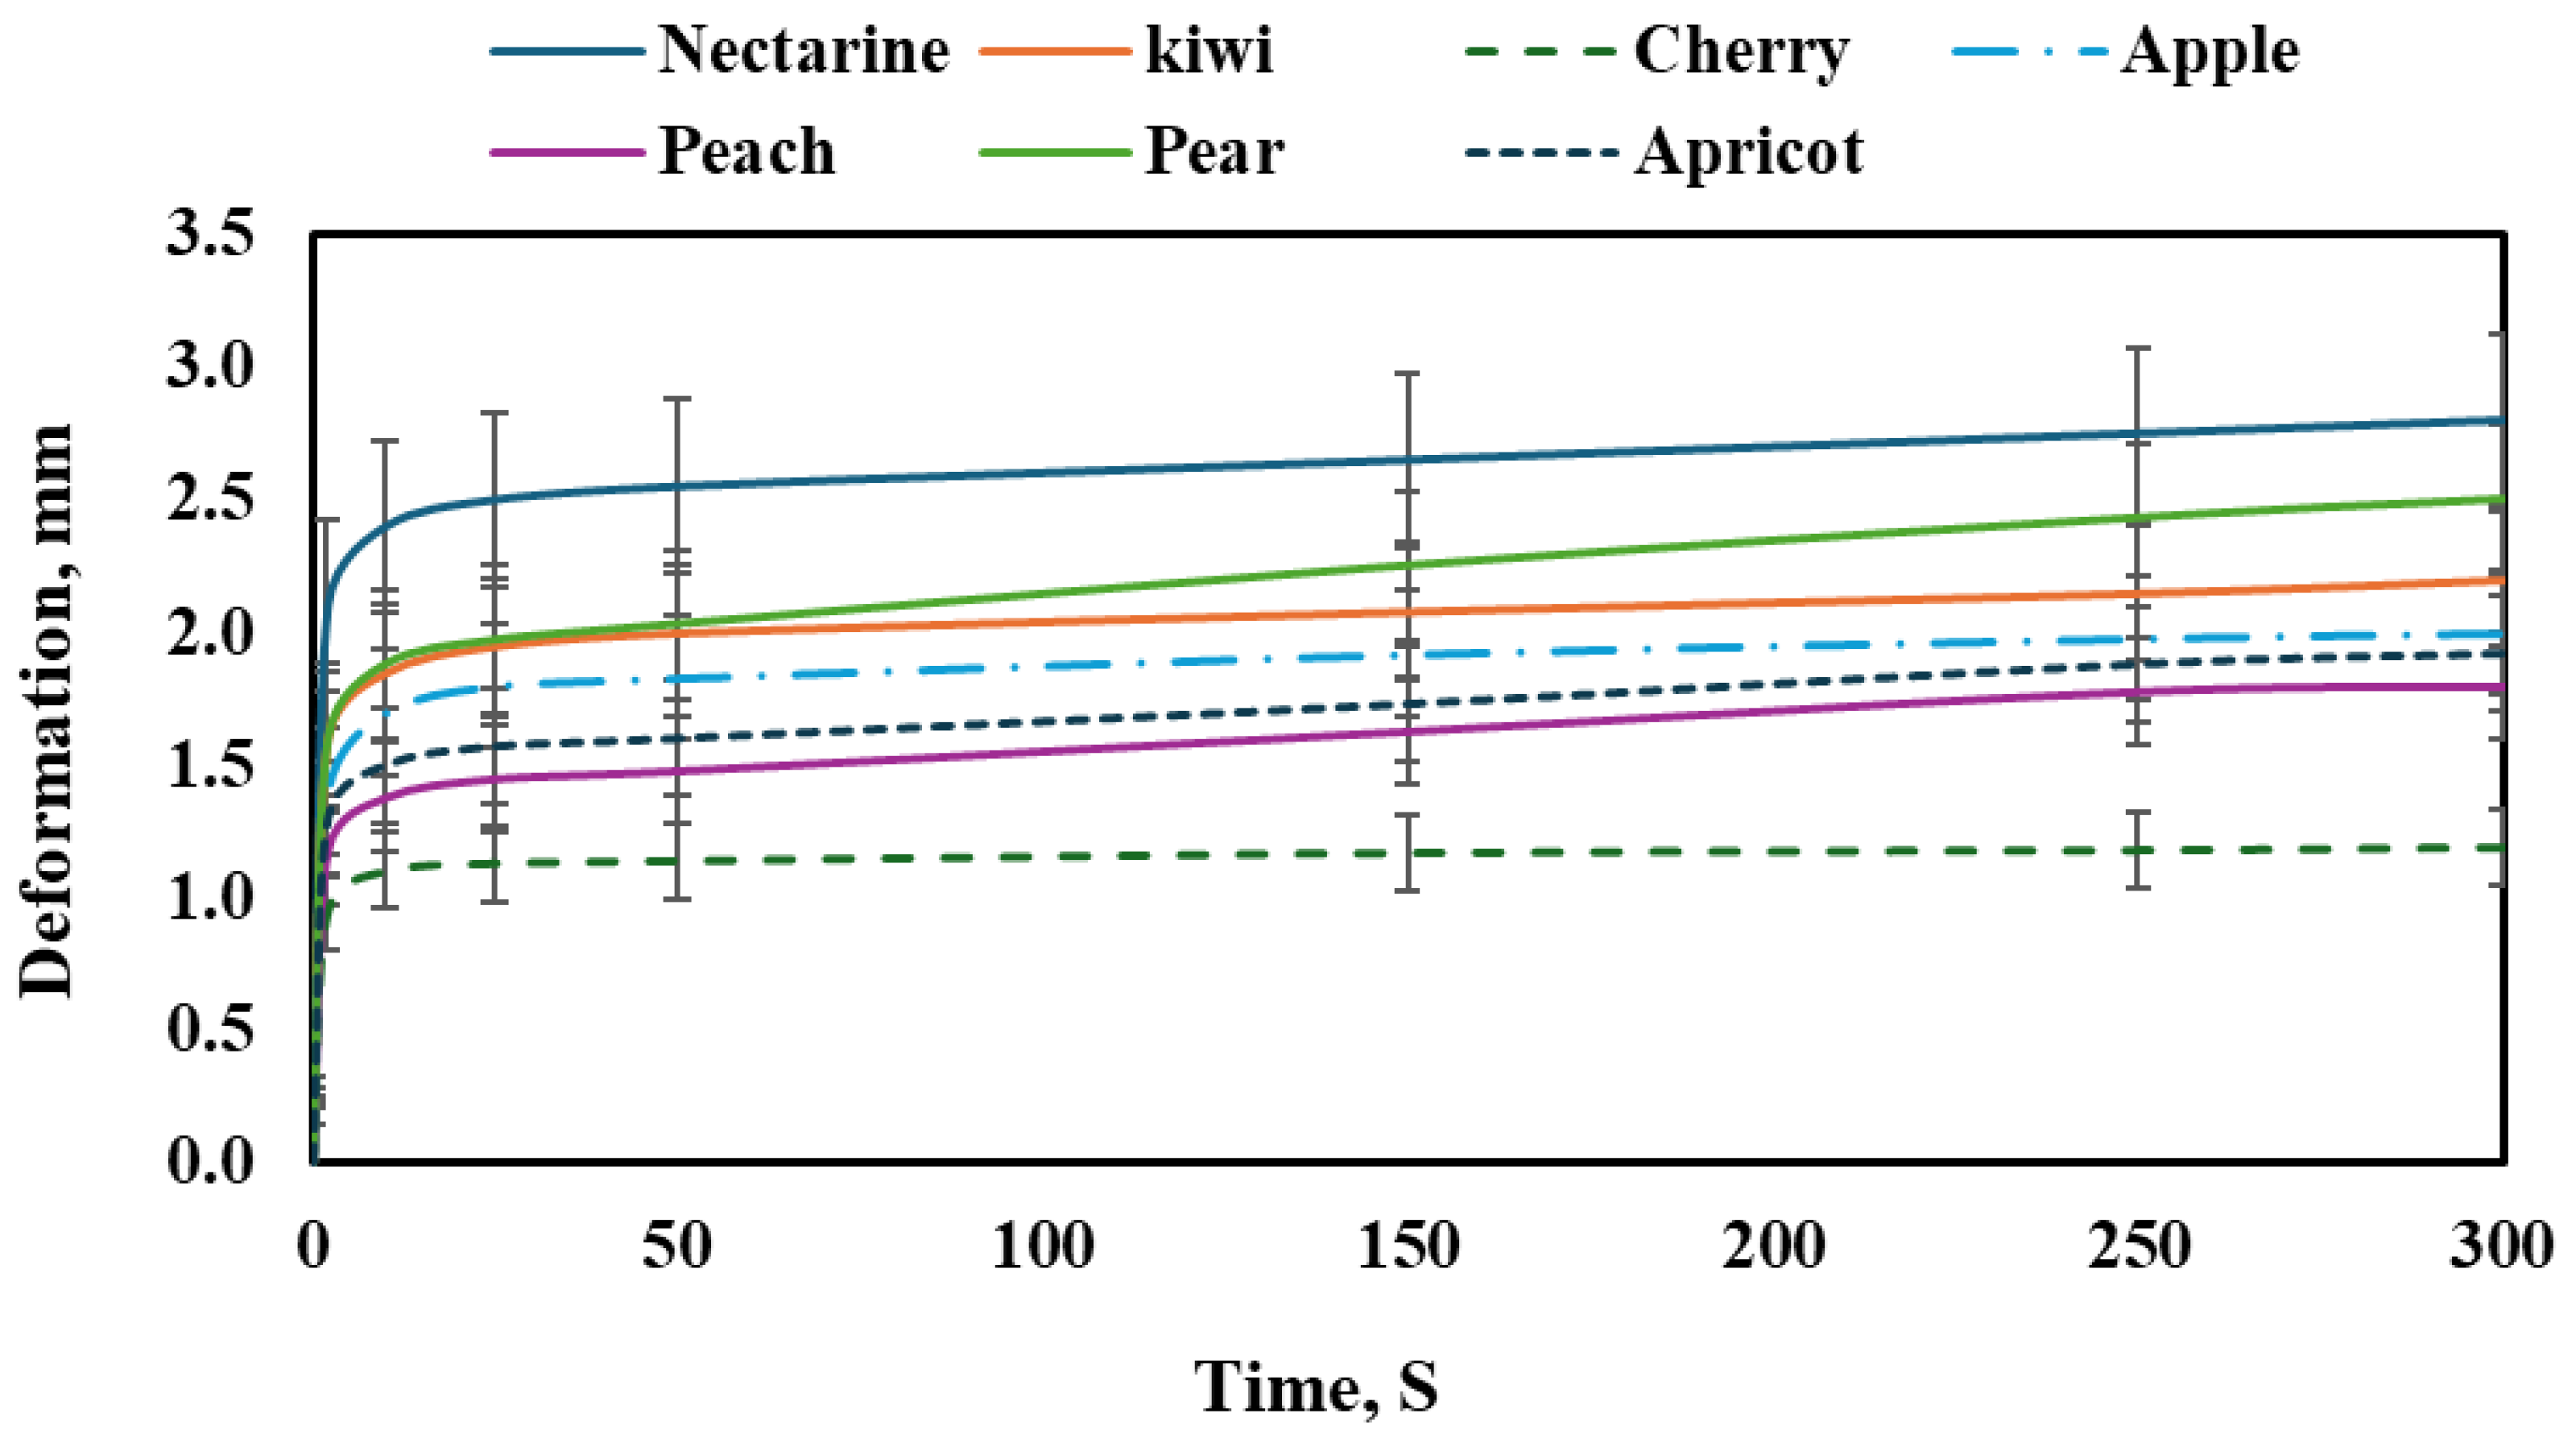
3.2.2. Fruit Creep Test
Figure 4 shows the creep behavior of different fruit types under a constant load over time. All fruits demonstrated a time-dependent increase in deformation, characteristic of viscoelastic materials. The general trend reveals an initial rapid deformation phase followed by a slower, more stable increase known as primary and secondary creep. However, the extent of deformation varied significantly between the fruits, indicating differences in tissue firmness, internal structure, and moisture content.
Nectarine exhibited the highest deformation among all tested fruits, reaching approximately 2.85 mm by the end of the test period. The curve shows a rapid initial increase, followed by a gradual but steady rise, indicating relatively soft tissue with sustained susceptibility to creep over time. This behavior suggests a low internal resistance to long-term deformation.
The kiwi followed a similar pattern but with slightly less overall deformation. Its final deformation was about 2.3 mm, and the curve remained stable after the initial sharp increase, reflecting a tissue that, while soft, begins to resist additional deformation beyond the primary phase. This suggests moderate firmness compared to nectarine.
The cherry demonstrated the lowest deformation of all fruits, reaching a maximum of only 1.25 mm. The creep curve rose sharply in the initial seconds but then flattened significantly, showing minimal deformation throughout the rest of the test. This behavior indicates a firmer tissue structure and higher resistance to creep, possibly due to dense skin and a strong internal matrix. The apple showed moderate creep behavior, with the deformation reaching around 2.1 mm. The curve exhibited a typical viscoelastic pattern, with a fast initial increase followed by a much slower rate. The apple’s relatively low creep compared to softer fruits suggests a balance between elasticity and tissue rigidity. The peach exhibited a deformation curve that reached approximately 1.9 mm at the end of the testing period. Its behavior was similar to the apple’s, although the final deformation was slightly lower. The initial phase showed a steep increase in strain, followed by stabilization, indicating soft but structured tissue.
The pear demonstrated one of the higher deformation values, with a final strain of about 2.6 mm. Its curve indicates sustained creep beyond the initial phase, suggesting a softer tissue structure than initially expected, possibly due to high moisture content or cellular degradation that allows greater deformation under stress. The apricot showed a final deformation close to 1.8 mm. The pattern followed the typical viscoelastic trend with a quick rise in the beginning, and then a slower, more stable increase. Its performance is in the moderate range, showing more resistance than nectarine and pear but less than cherry and apple.
Among all the fruits, certain varieties showed comparable behavior. For instance, nectarine and pear exhibited similarly high deformation values, indicating soft and less resistant tissues. On the other hand, cherry and apricot showed relatively low creep, suggesting firmer textures. Apple and peach displayed moderate creep behavior and can be considered mechanically similar in resistance to time-dependent deformation. These observed differences in creep deformation among the fruit types were statistically significant (p < 0.05), as confirmed by ANOVA.
These creep responses can be further interpreted considering the mechanical properties measured during compression testing (
Table 2). Since the applied load in the creep test was standardized at approximately 20% of each fruit’s average rupture force, the resulting deformations reflect the strength and how each tissue tolerates prolonged subcritical stress. The elastic modulus, rupture force, and required work to rupture are particularly relevant here, as they describe the tissue’s immediate resistance, rigidity, and energy absorption capacity.
Nectarine, which had a relatively low modulus of elasticity (0.28 MPa) and moderate rupture force (85.4 N), showed the highest creep deformation. This indicates limited structural stiffness and a pronounced susceptibility to progressive strain under constant load. A somewhat similar pattern was observed in pear, which, despite having the highest rupture force (111.1 N), had a moderate modulus of elasticity (0.36 MPa) but still underwent substantial creep. This apparent contradiction may be attributed to internal factors such as elevated turgor pressure or loosely packed tissue microstructure, which facilitate deformation over time. In contrast, cherry exhibited minimal creep deformation despite its low rupture (28.8 N) and bioyield (18.8 N) forces, along with a modest elastic modulus of 0.40 MPa. This suggests that factors beyond fundamental mechanical strength—such as cell compactness, cuticle thickness, or anatomical arrangement—play a significant role in resisting time-dependent deformation. Fruits such as apple and apricot, with similar elastic modulus values (0.36 and 0.37 MPa, respectively) and comparable rupture strengths, displayed creep behavior indicative of balanced firmness: not highly resistant, but also not prone to excessive deformation. Peach, with a slightly lower modulus (0.29 MPa), followed a similar trend, while kiwi, which had the highest modulus of elasticity (0.72 MPa), showed relatively restrained creep deformation, consistent with its greater tissue stiffness and structural integrity. Integrating creep data with compression-derived mechanical properties reveals a more nuanced understanding of fruit texture. While rupture force and elastic modulus offer insight into how fruits resist instantaneous loading, creep analysis uncovers how these tissues behave under prolonged mechanical stress. Such dual perspectives are essential for characterizing the viscoelastic nature of biological materials and have practical implications for post-harvest handling, packaging, and shelf-life prediction.
3.2.3. Fruit Puncture Test
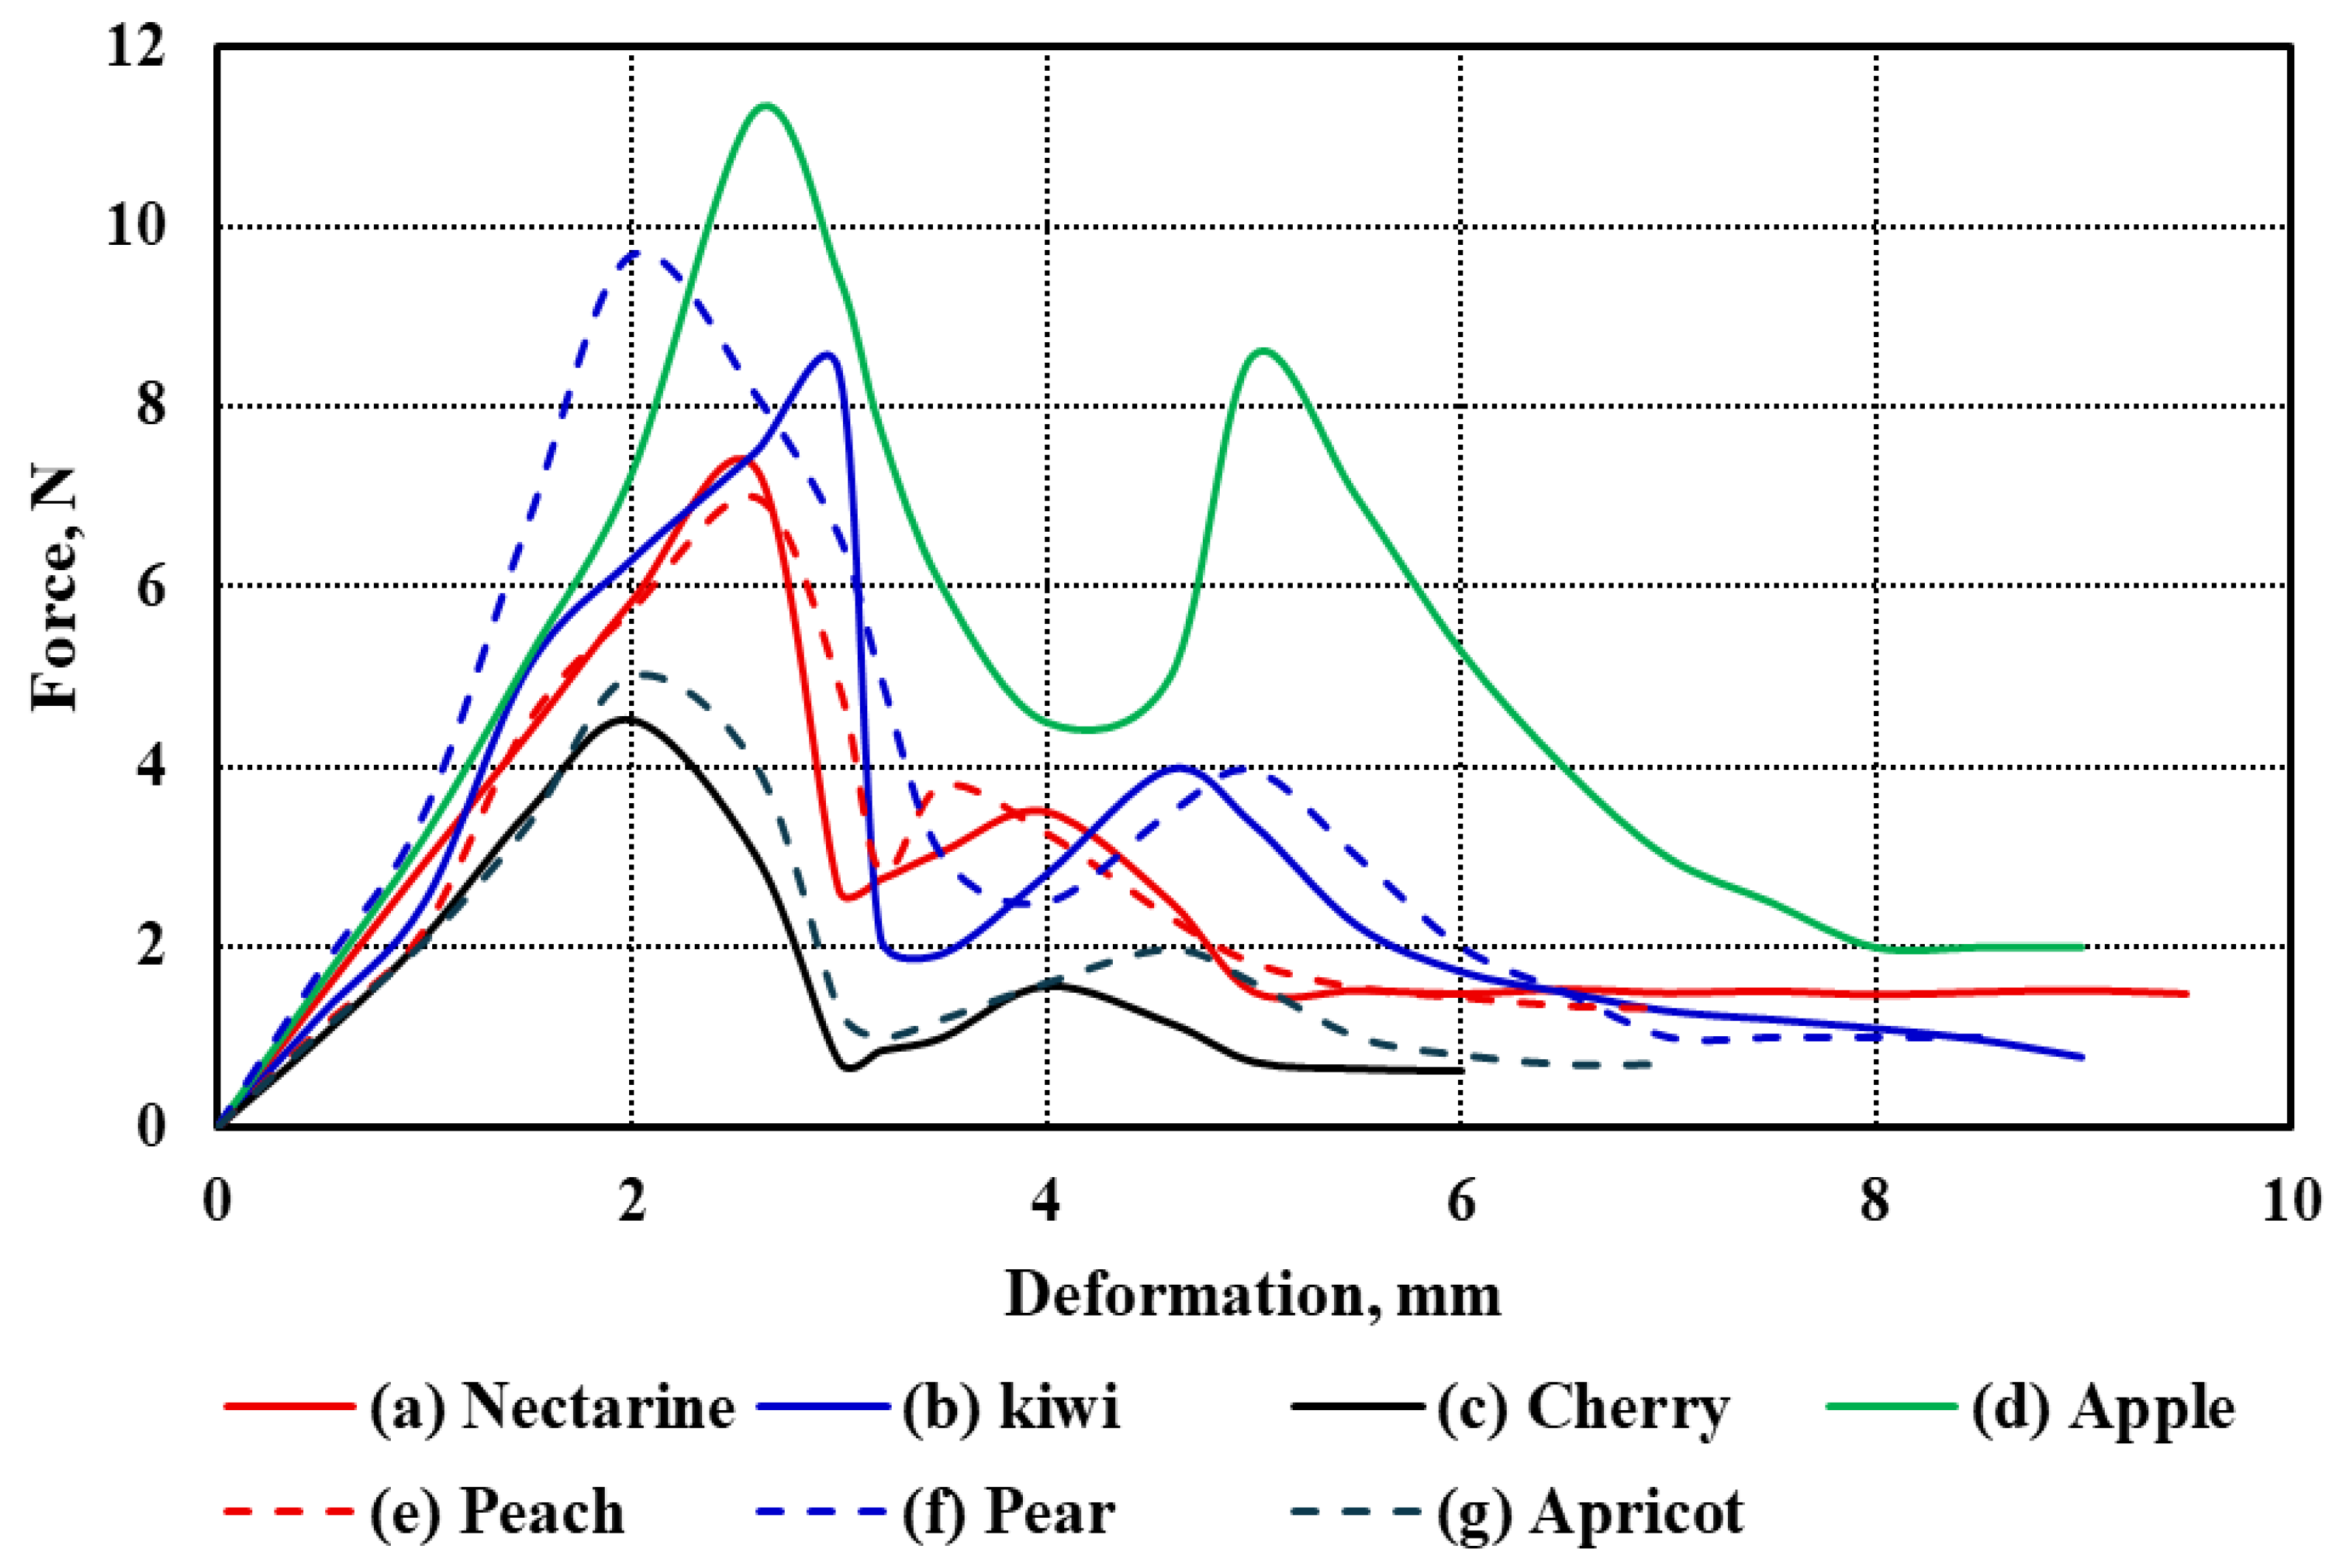
Figure 5 illustrates the fruit puncture behavior for the seven studied fruit types, showing both the puncture force and the corresponding deformation for the exocarp (outer skin) and endocarp (inner flesh around the seed or pit). The results highlight substantial differences in mechanical resistance and structural integrity across fruit types.
Apple exhibited the highest puncture force values among all tested fruits. The exocarp required a force of 11.3 N to puncture, with a deformation of 2.8 mm, indicating a tough and elastic outer skin. For the endocarp, the puncture force was also significantly high at 8.6 N, with a deformation of 4.8 mm. This reflects a consistent internal structure capable of resisting mechanical stress. The apple’s dense, turgid parenchyma and relatively thick cuticle contribute to its high resistance. These characteristics make apples more resilient during harvesting, transportation, and storage, reducing the risk of bruising. Pear showed a similar trend to apple in terms of mechanical strength. The exocarp puncture force was 9.7 N with 2.7 mm deformation, indicating considerable stiffness. The endocarp required 3.9 N and exhibited a 4.9 mm deformation. While the external layer shows strength close to that of the apple, the lower internal resistance and slightly greater deformation suggest a softer flesh. Pears, like apples, are classified as pome fruits, which explains the similarity in structural properties.
However, the increased softness of the endocarp may affect their susceptibility to internal bruising despite their tough skin. Kiwi displayed relatively high values of puncture resistance as well. The exocarp required a force of 8.4 N and deformed by 2.9 mm, while the endocarp needed 3.36 N with a deformation of 5.1 mm, which was the highest deformation among all fruits in the endocarp. This highlights a significant discrepancy between the firm outer skin and the soft, highly deformable interior. Kiwi’s endocarp comprises loosely packed, water-rich tissue, contributing to its high deformability. This duality indicates that while the skin offers good initial protection, the inner tissue is susceptible to pressure, requiring careful handling. Nectarine had a moderately resistant exocarp, requiring 7.1 N with a deformation of 2.6 mm. The endocarp, by contrast, needed only 2.9 N to puncture, with a deformation of 4.6 mm. These values suggest moderately firm skin and a relatively soft inner layer.
Nectarines, being stone fruits, have a thin cuticle and a juicy mesocarp, which can be easily damaged during handling. The moderate puncture resistance in both layers places nectarines in the middle range regarding mechanical vulnerability. Peach, closely related to nectarine, showed very similar puncture behavior. The exocarp puncture force was 7.0 N with 2.4 mm deformation, and the endocarp required 2.31 N with 4.5 mm deformation. These values suggest that peaches are only slightly softer than nectarines. Given their structural similarities—both are Prunus species with large pits and similar textures—the mechanical response is expectedly close. However, even slight differences in firmness can impact storage life and transportability.
Apricot demonstrated lower puncture force values compared to other stone fruits. The exocarp puncture force was 5.9 N with a deformation of 2.2 mm, while the endocarp required 1.9 N with 4.6 mm deformation. Although the deformation values are not significantly different from those of nectarine or peach, the lower force values indicate weaker tissue resistance. This makes apricots more prone to surface and internal damage, necessitating more delicate post-harvest handling conditions. Cherry had the lowest puncture resistance among all fruits. The exocarp required only 4.5 N with the least deformation at 1.9 mm. The endocarp showed the lowest force value (1.5 N) and a deformation of 4.1 mm. These results reflect the delicate structure of cherries, which have thin skin and very soft pulp. The small size and fragile tissue make cherries extremely sensitive to mechanical damage, often requiring specialized packaging and minimal handling.
Upon comparing the data, fruits such as apples and pears stand out for their high puncture resistance in both exocarp and endocarp, making them suitable for more extended storage and transport. In contrast, cherry and apricot are at the opposite end of the spectrum, with very low resistance, requiring careful handling. The stone fruits—nectarine, peach, and apricots—show similar deformation behavior but differ slightly in force values, with apricot being the weakest. Meanwhile, kiwi presents a unique case with a firm exterior but extremely soft interior, indicating a high risk of internal damage if mishandled. These observations are critical for post-harvest applications, as they inform decisions related to harvesting tools, packaging design, and transport methods tailored to each fruit’s mechanical profile.
3.3. PCA and Correlation Analysis of Physical–Mechanical Relationships
The principal component analysis (PCA) revealed clear patterns of association between the physical and mechanical properties of the examined fruits. The first two components explained a substantial portion of the total variance, allowing a meaningful interpretation of the relationships among traits. As shown in
Figure 6, size- and mass-related variables such as fruit length, diameter, mass, volume, and geometric mean diameter were closely aligned with mechanical strength indicators including rupture force, bioyield force, and the work required to rupture. This suggests that larger fruits with greater mass tend to exhibit higher mechanical resistance, likely due to their thicker peel and denser structural tissues which provide greater support under compression.
In contrast, internal characteristics such as moisture content and bulk density showed a distinct influence, particularly on properties related to elasticity and time-dependent deformation. Fruits with higher moisture content tend to exhibit lower rupture strength but increased flexibility, as water softens cell walls and reduces structural cohesion. This inverse relationship aligns with the contribution of moisture to the second principal component, where modulus of elasticity was also influential. Thus, while size enhances strength, water content modulates deformability.
Elastic modulus, unlike other force-related properties, showed limited association with size but was more strongly influenced by moisture, density, and tissue structure. This reflects the fact that elasticity arises from the internal cellular arrangement and hydration status rather than external dimensions alone. Similarly, creep behavior, although not a primary factor in the PCA, may be indirectly related to moisture and bulk density. Fruits with higher water content and less compact structure are more likely to exhibit time-dependent deformation under load due to weaker internal bonding.
These results highlight that the mechanical response of fruit tissue is not governed by a single attribute but by a combination of physical form, compositional features, and internal architecture. While mass and volume increase the force required to rupture the fruit, parameters such as moisture content and density shape the elastic and viscoelastic behavior. The spatial distribution of fruit types in
Figure 7 reinforces these interactions; for instance, apple, pear, and peach occupy regions corresponding to high mass and strength, whereas cherry and apricot are associated with lower structural resilience. Kiwi and nectarine exhibit intermediate behavior, reflecting moderate mechanical resistance and moisture-related flexibility.
Moreover, the relative positions of the fruit samples in the PCA plot offer insight into their overall similarity or divergence. Fruits that are located near each other in the PCA space—such as kiwi and nectarine—share comparable combinations of physical and mechanical traits. In contrast, distant placements—for example, between apple and apricot—indicate substantial differences in their structural properties. Therefore, PCA not only clarifies trait interactions but also serves as an effective tool for visually identifying groups of fruits with similar quality characteristics, which can inform classification, grading, and post-harvest handling decisions.
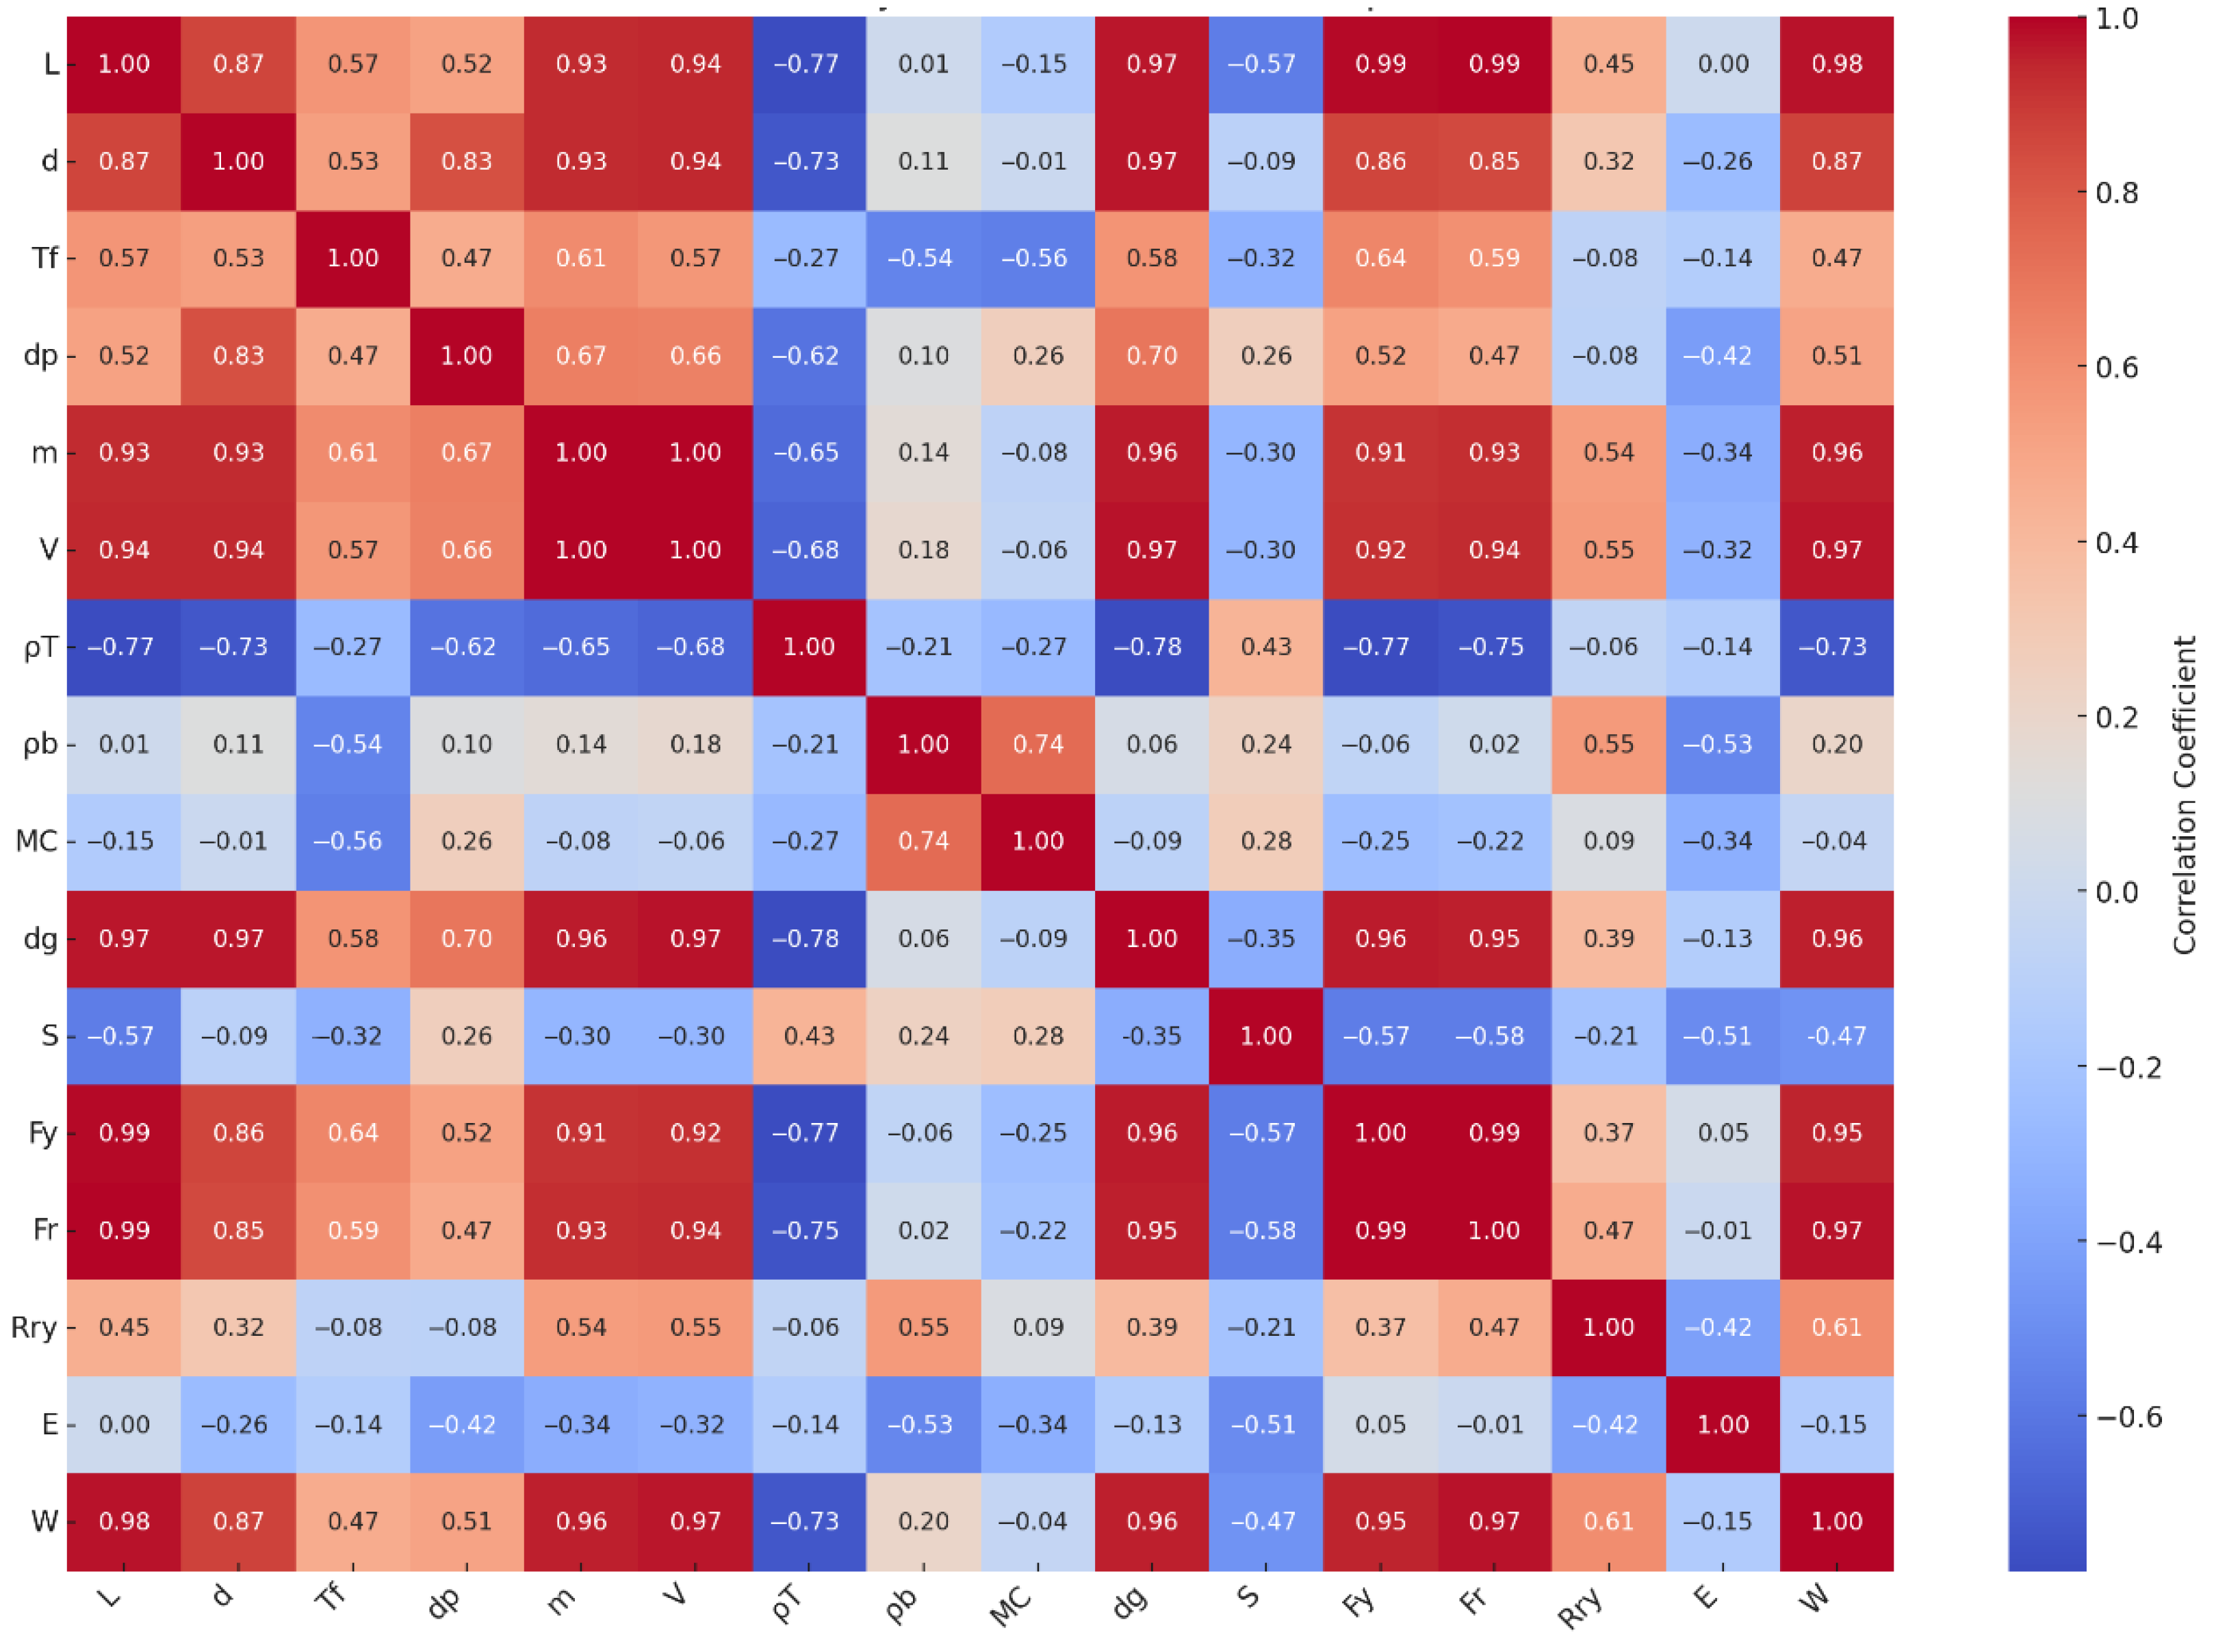
Additionally,
Figure 6 presents the correlation matrix between the physical and mechanical properties of the studied fruit types, offering a clear visualization of key interactions. To further explore these relationships, a Pearson correlation analysis was conducted across all fruits. The results revealed strong positive correlations between size-related physical attributes—such as fruit length (
L), diameter (
d), geometric mean diameter (
dg), and fruit mass (
m)—and mechanical strength indicators including bioyield force (
Fy), rupture force (
Fr), and the work required to rupture (
W). For example, fruit mass showed high correlation coefficients with
Fy (r = 0.91),
Fr (r = 0.93), and
W (r = 0.96), suggesting that heavier fruits possess a more robust structural resistance under compressive loading. Similarly, geometric attributes like
L and
dg were also closely linked to these force parameters (r > 0.85), supporting the notion that physical size substantially contributes to mechanical resilience. Moreover, moisture content (
MC) was found to negatively correlate with modulus of elasticity (
E) (r = –0.34), implying that fruits with higher water content tend to exhibit lower stiffness and are more prone to deformation, consistent with previously reported viscoelastic behavior. Bulk density (
ρb) also showed a moderate negative correlation with
E (r = –0.53), further indicating that lower-density tissues may deform more under sustained loads. Flesh thickness (
Tf), while moderately correlated with strength traits like
Fy (r = 0.64) and
Fr (r = 0.59), also plays a role in energy absorption capacity, as reflected in its relationship with
W (r = 0.47).
These findings quantitatively reinforce the mechanical interpretations derived from PCA and support the hypothesis that fruit mechanical behavior is governed not only by macroscopic dimensions but also by internal water content and structural compactness. The integration of univariate correlation analysis with multivariate PCA thus provides a more comprehensive understanding of the physical–mechanical interplay affecting post-harvest fruit quality.


 ,
, 


