
Comparative Analysis of Cost, Energy Efficiency, and Environmental Impact of Pulsed Electric Fields and Conventional Thermal Treatment with Integrated Heat Recovery for Fruit Juice Pasteurization
 ,
,  ,
, 
Abstract
1. Introduction
2. Materials and Methods
2.1. PEF Operating Conditions
2.2. Model Description
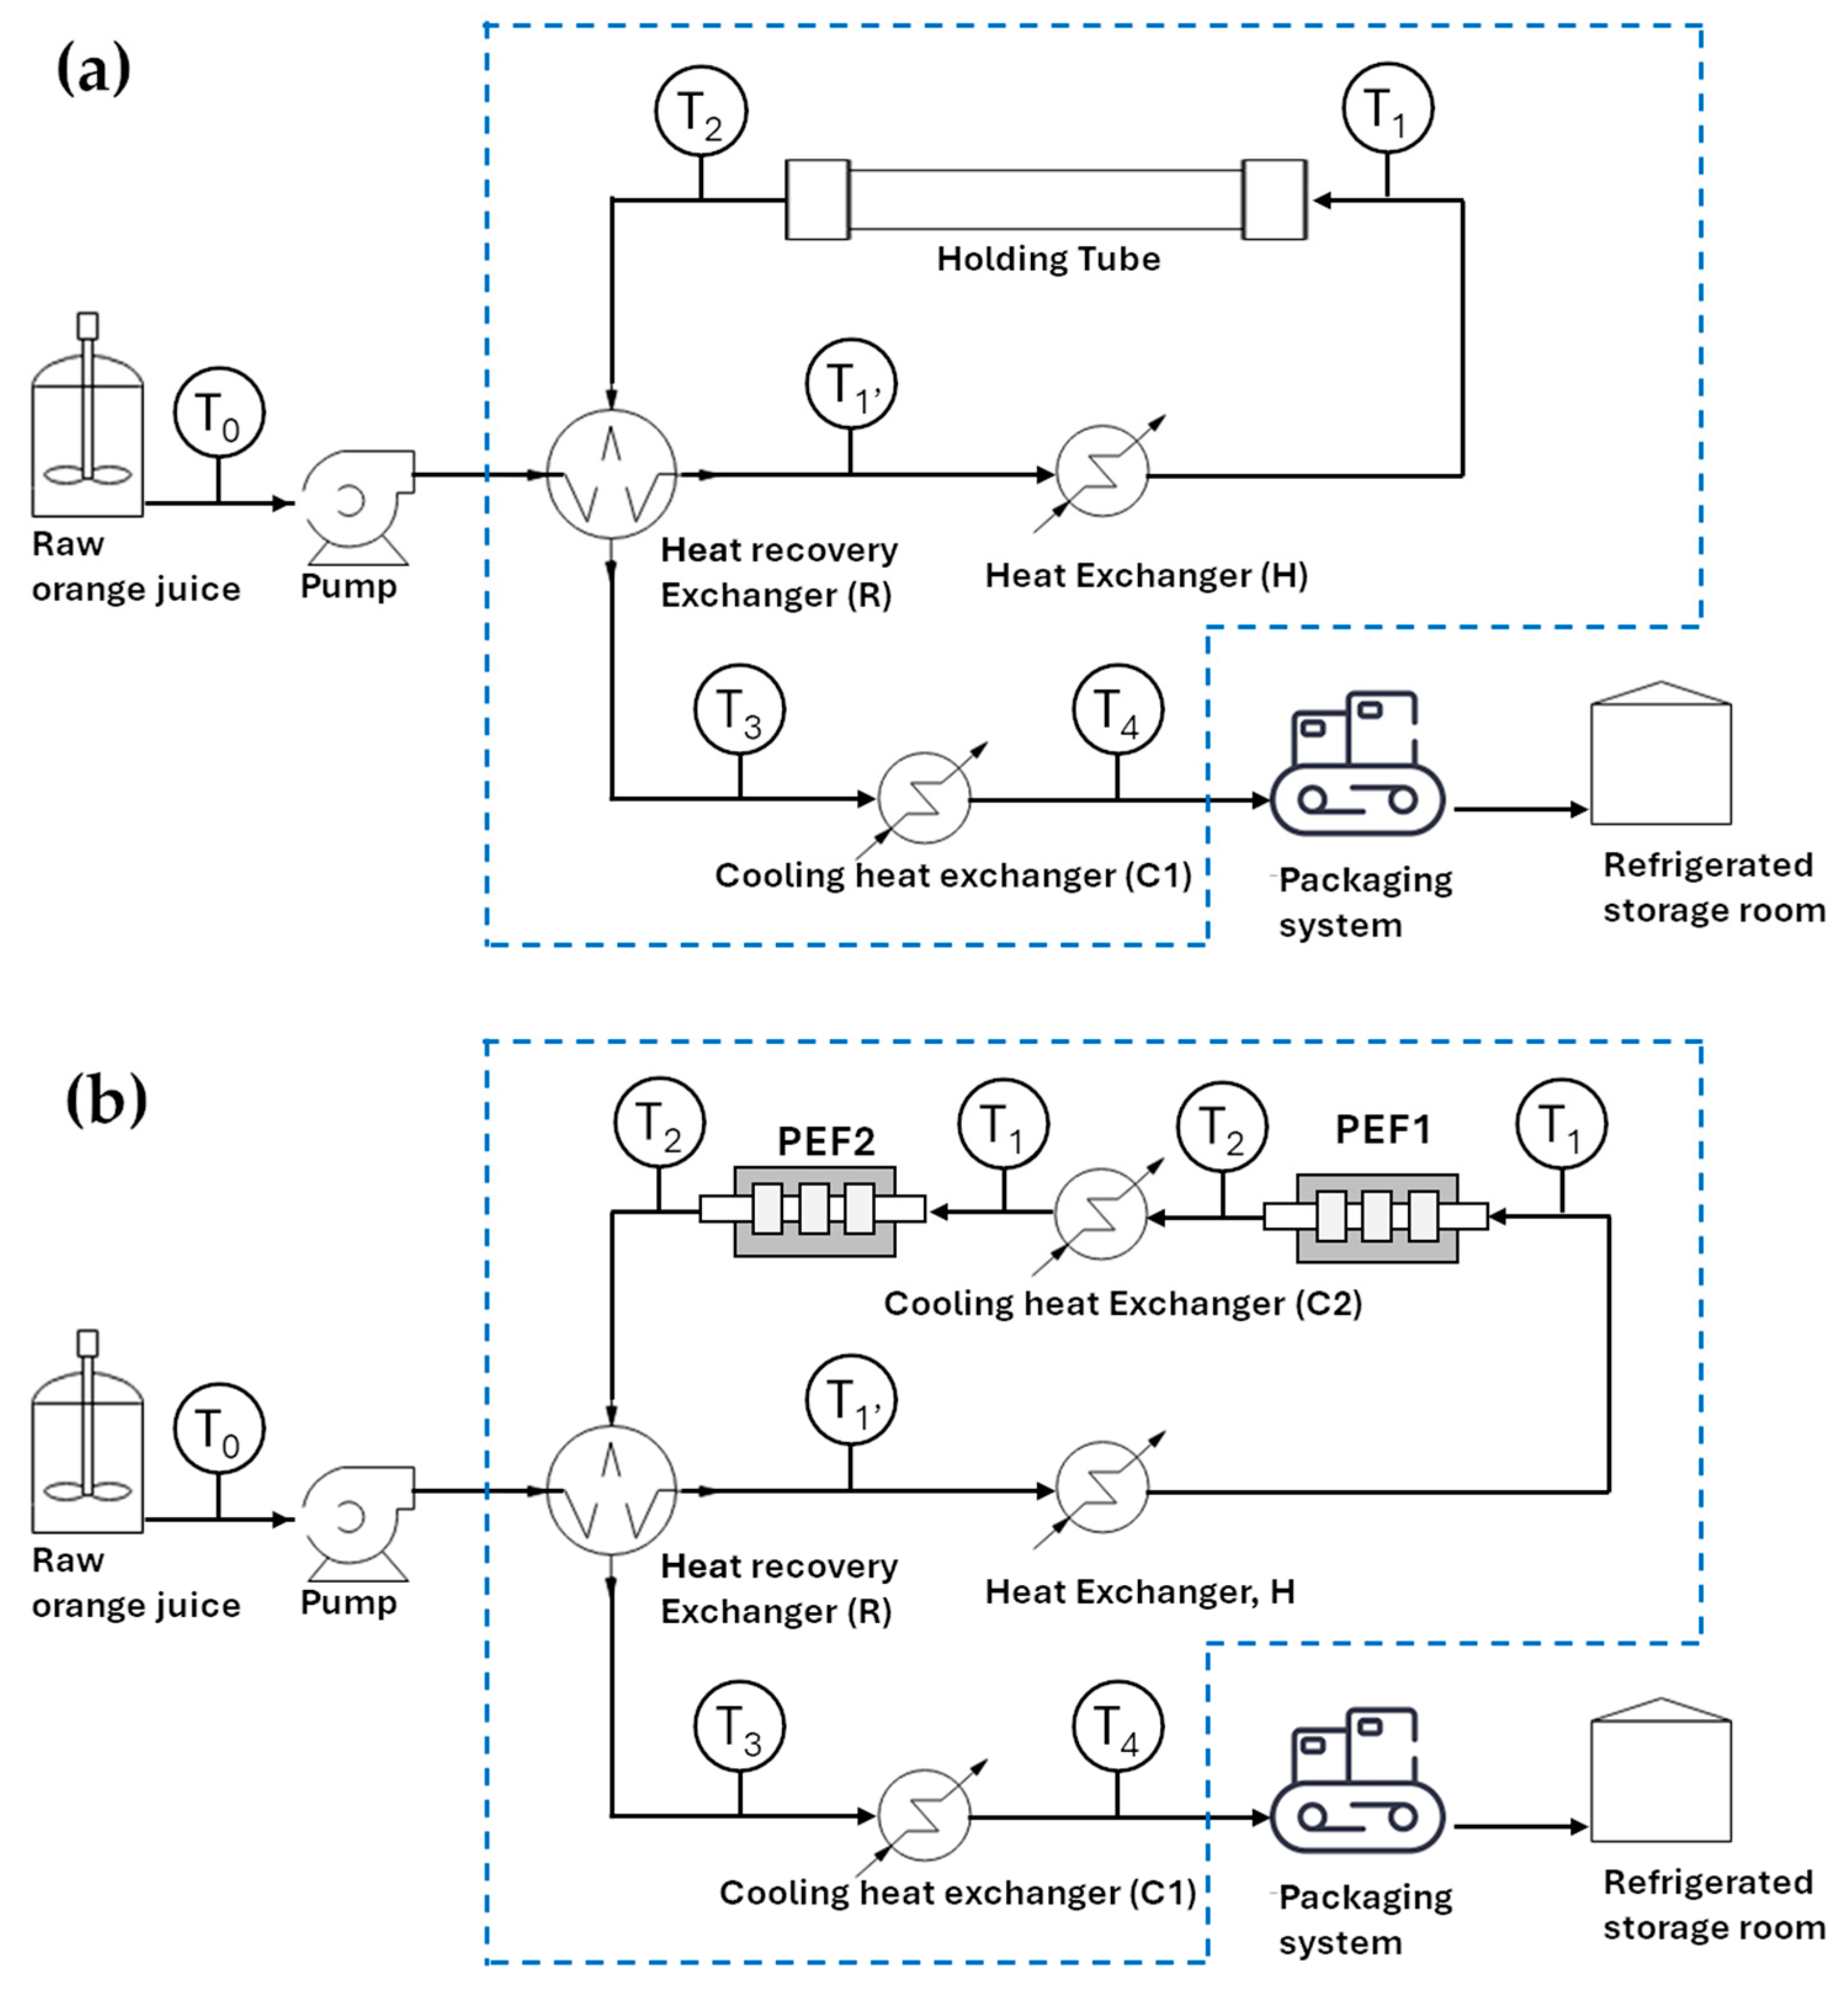
2.2.1. Systems Description for the Pasteurization Process of Fruit Juice
2.2.2. Cost Analysis and Energetic Scenario
2.3. Environmental Impact Analysis
2.3.1. Greenhouse Gas GHG Emissions Assessment
2.3.2. Life Cycle Assessment
3. Results
3.1. Effect of Combined PEF–Moderate Heating on Microbial Inactivation
3.2. Evaluation of Energy and Water Consumption and Environmental Impact in the Pasteurization Process
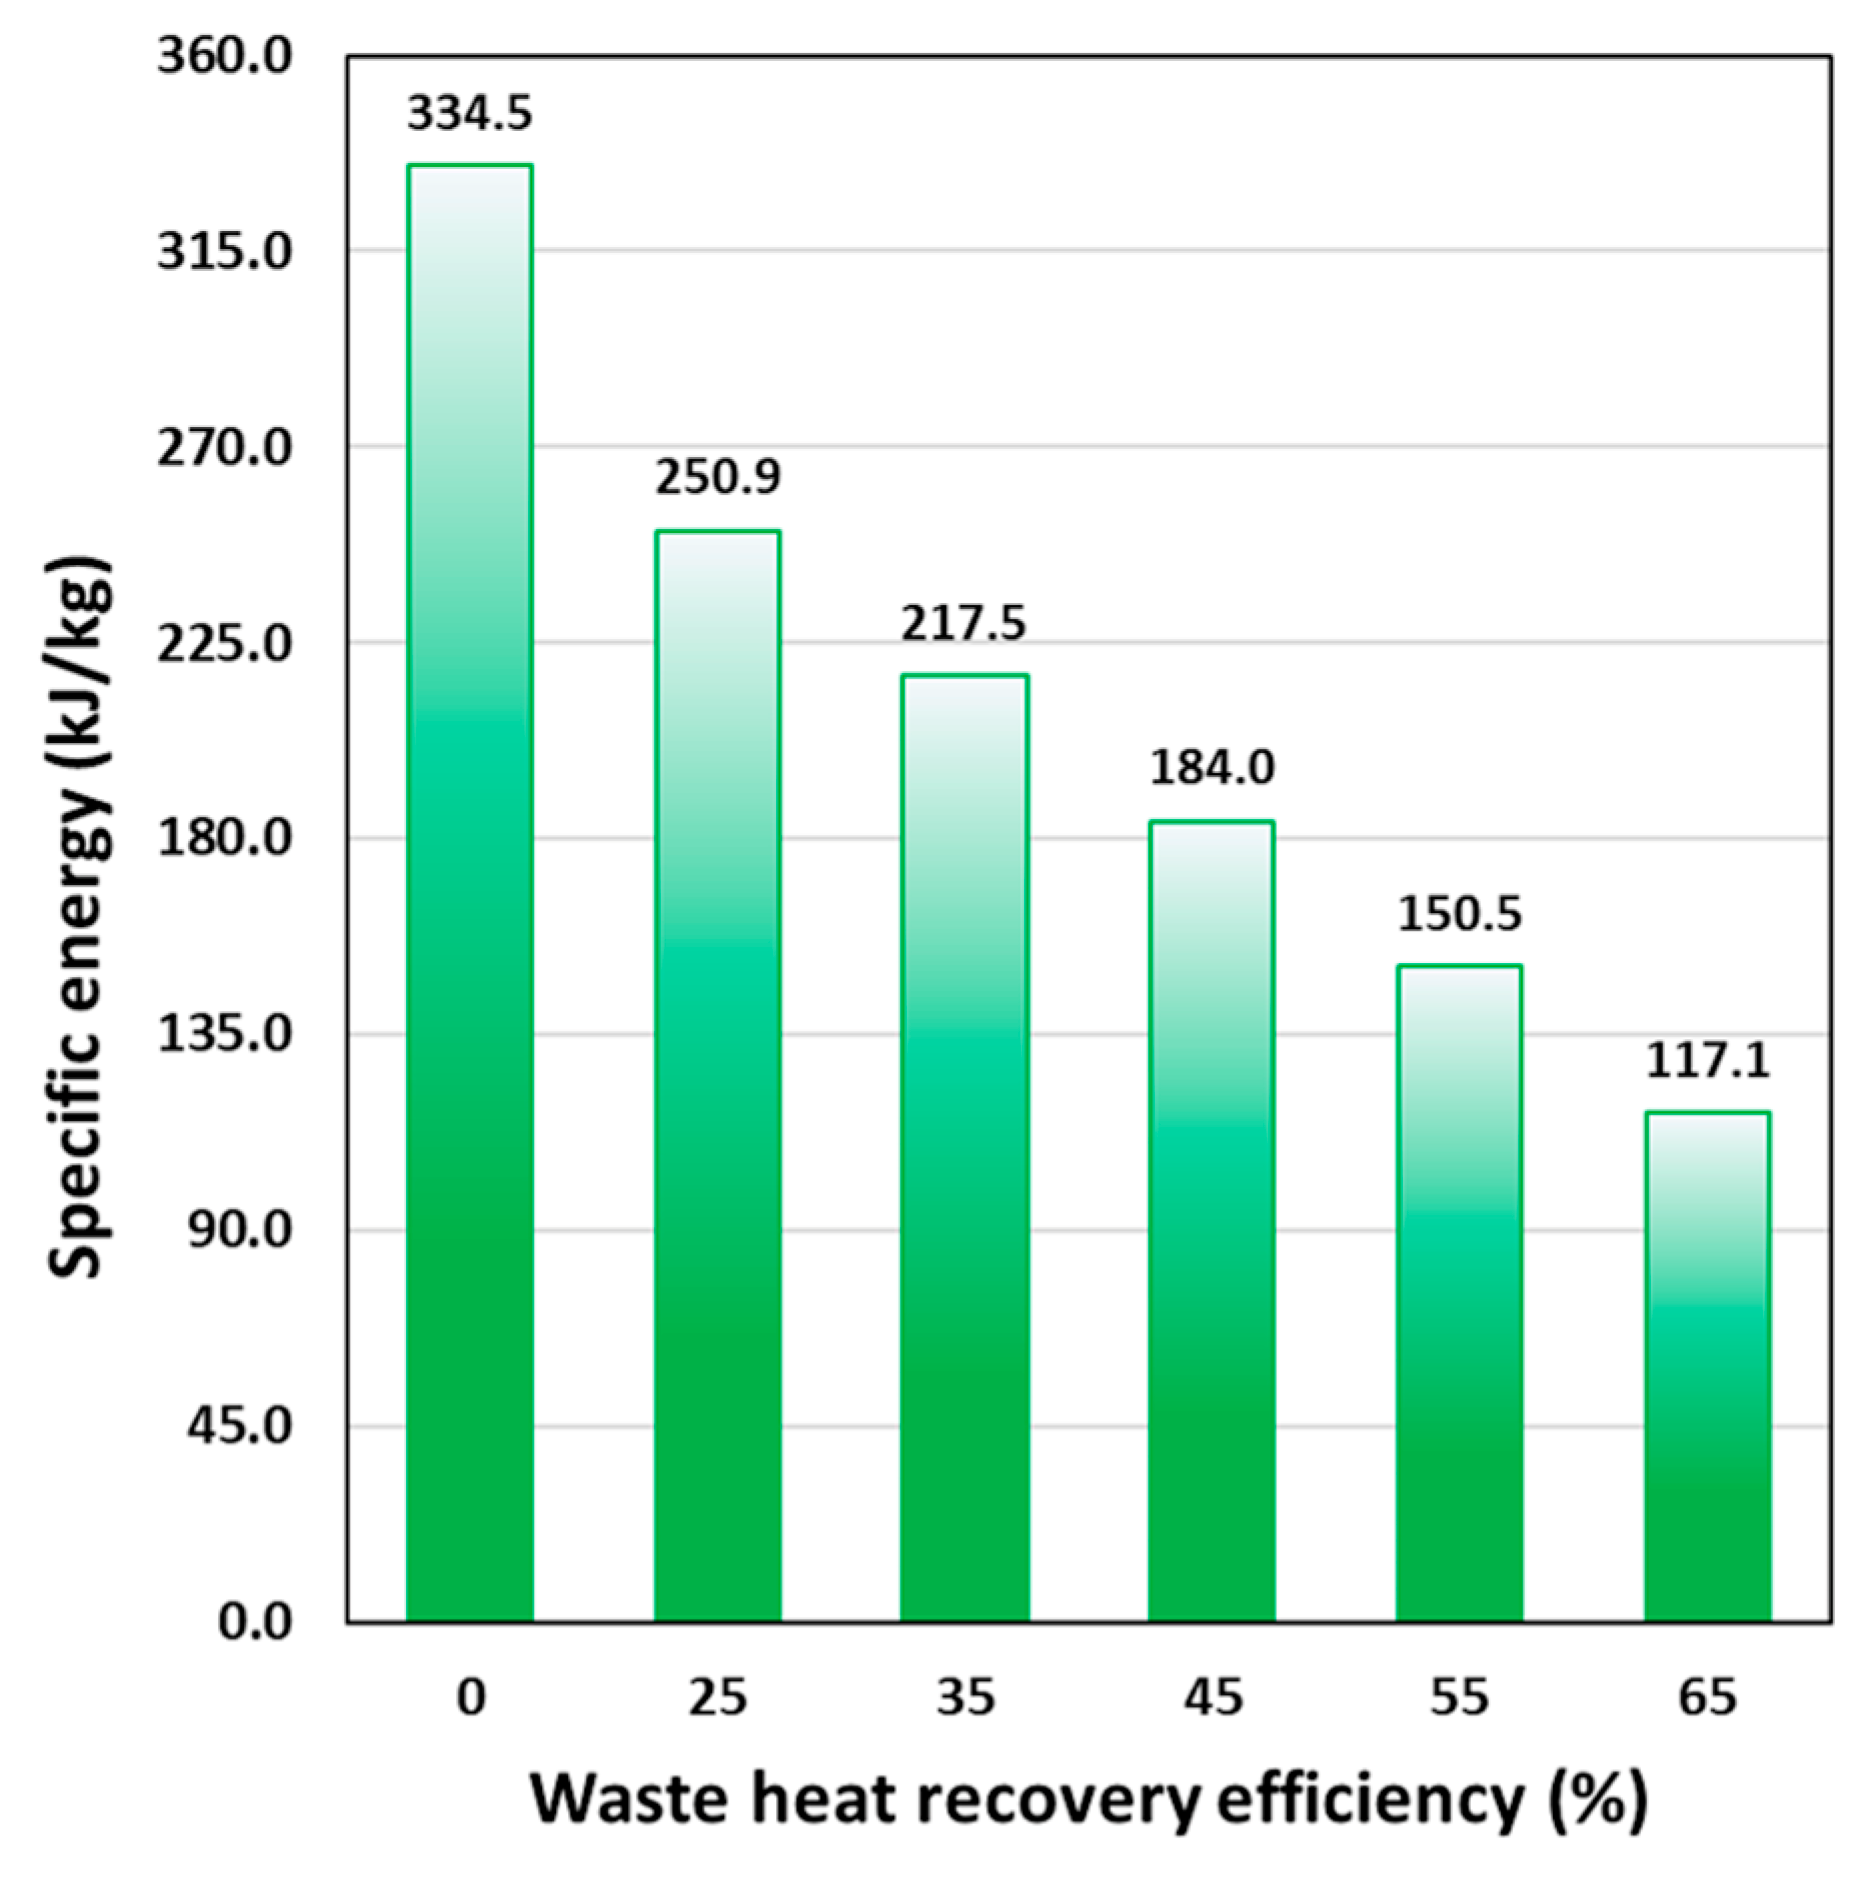
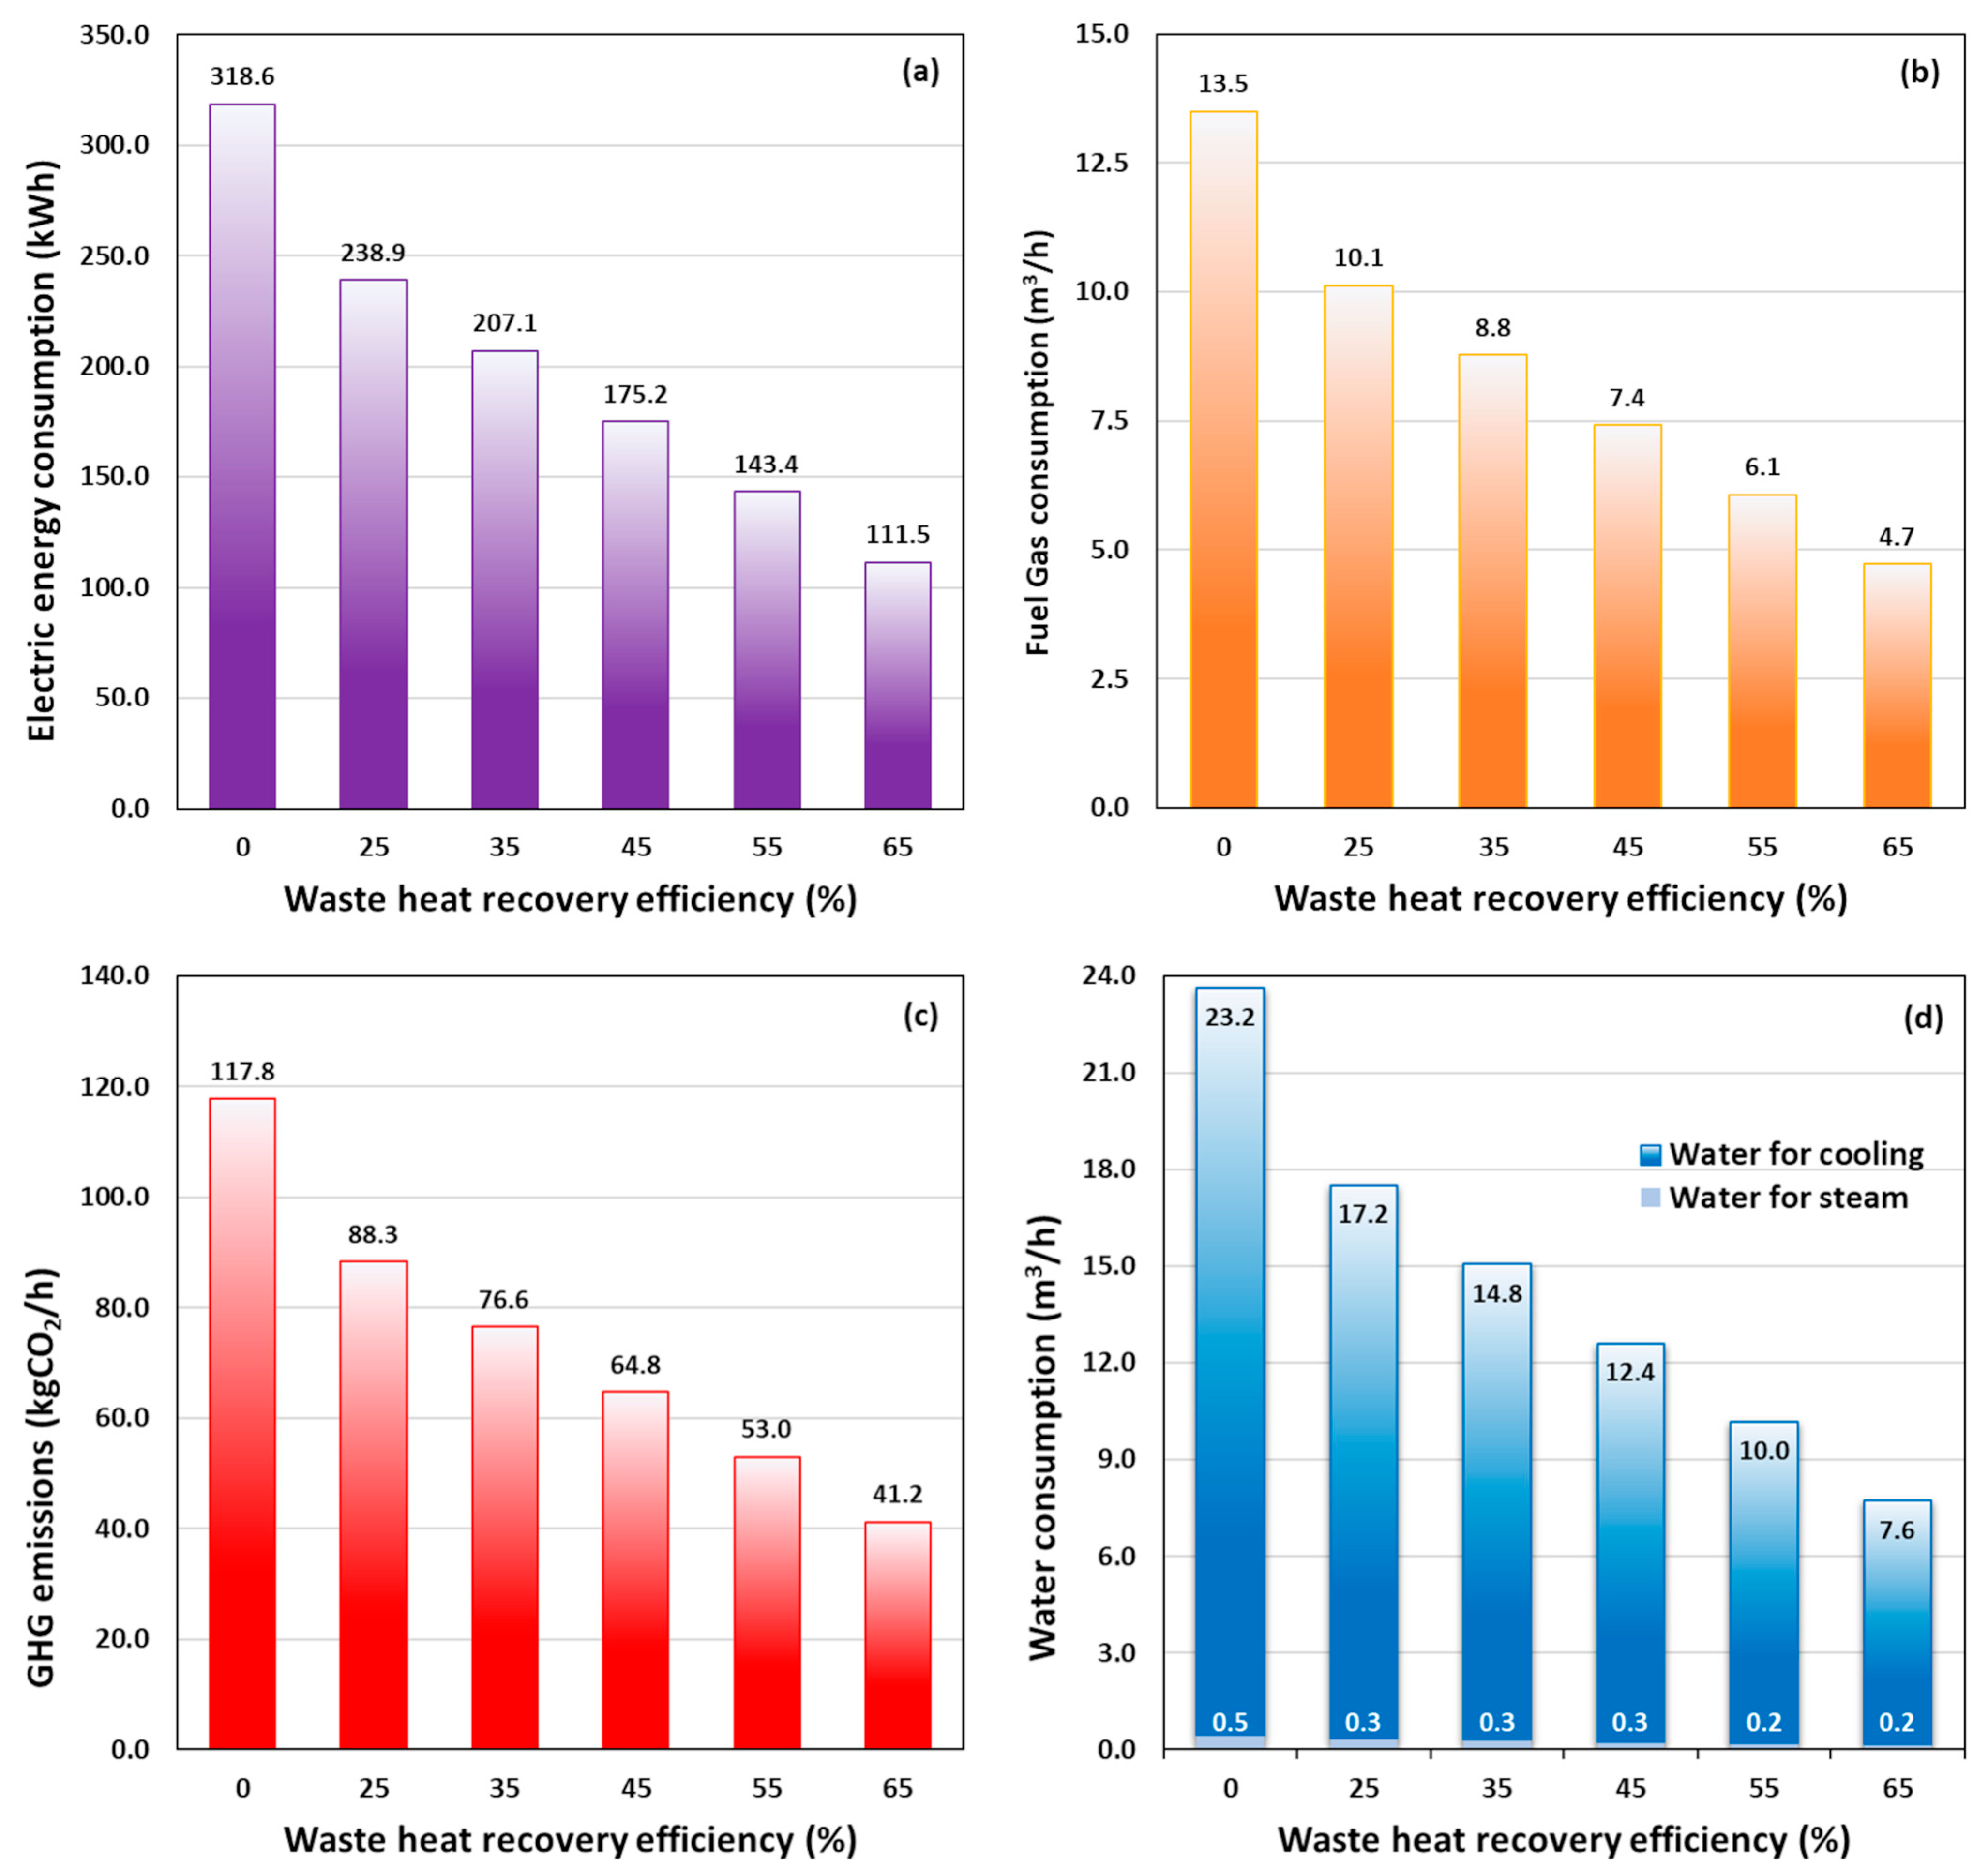
3.2.1. HTST Process
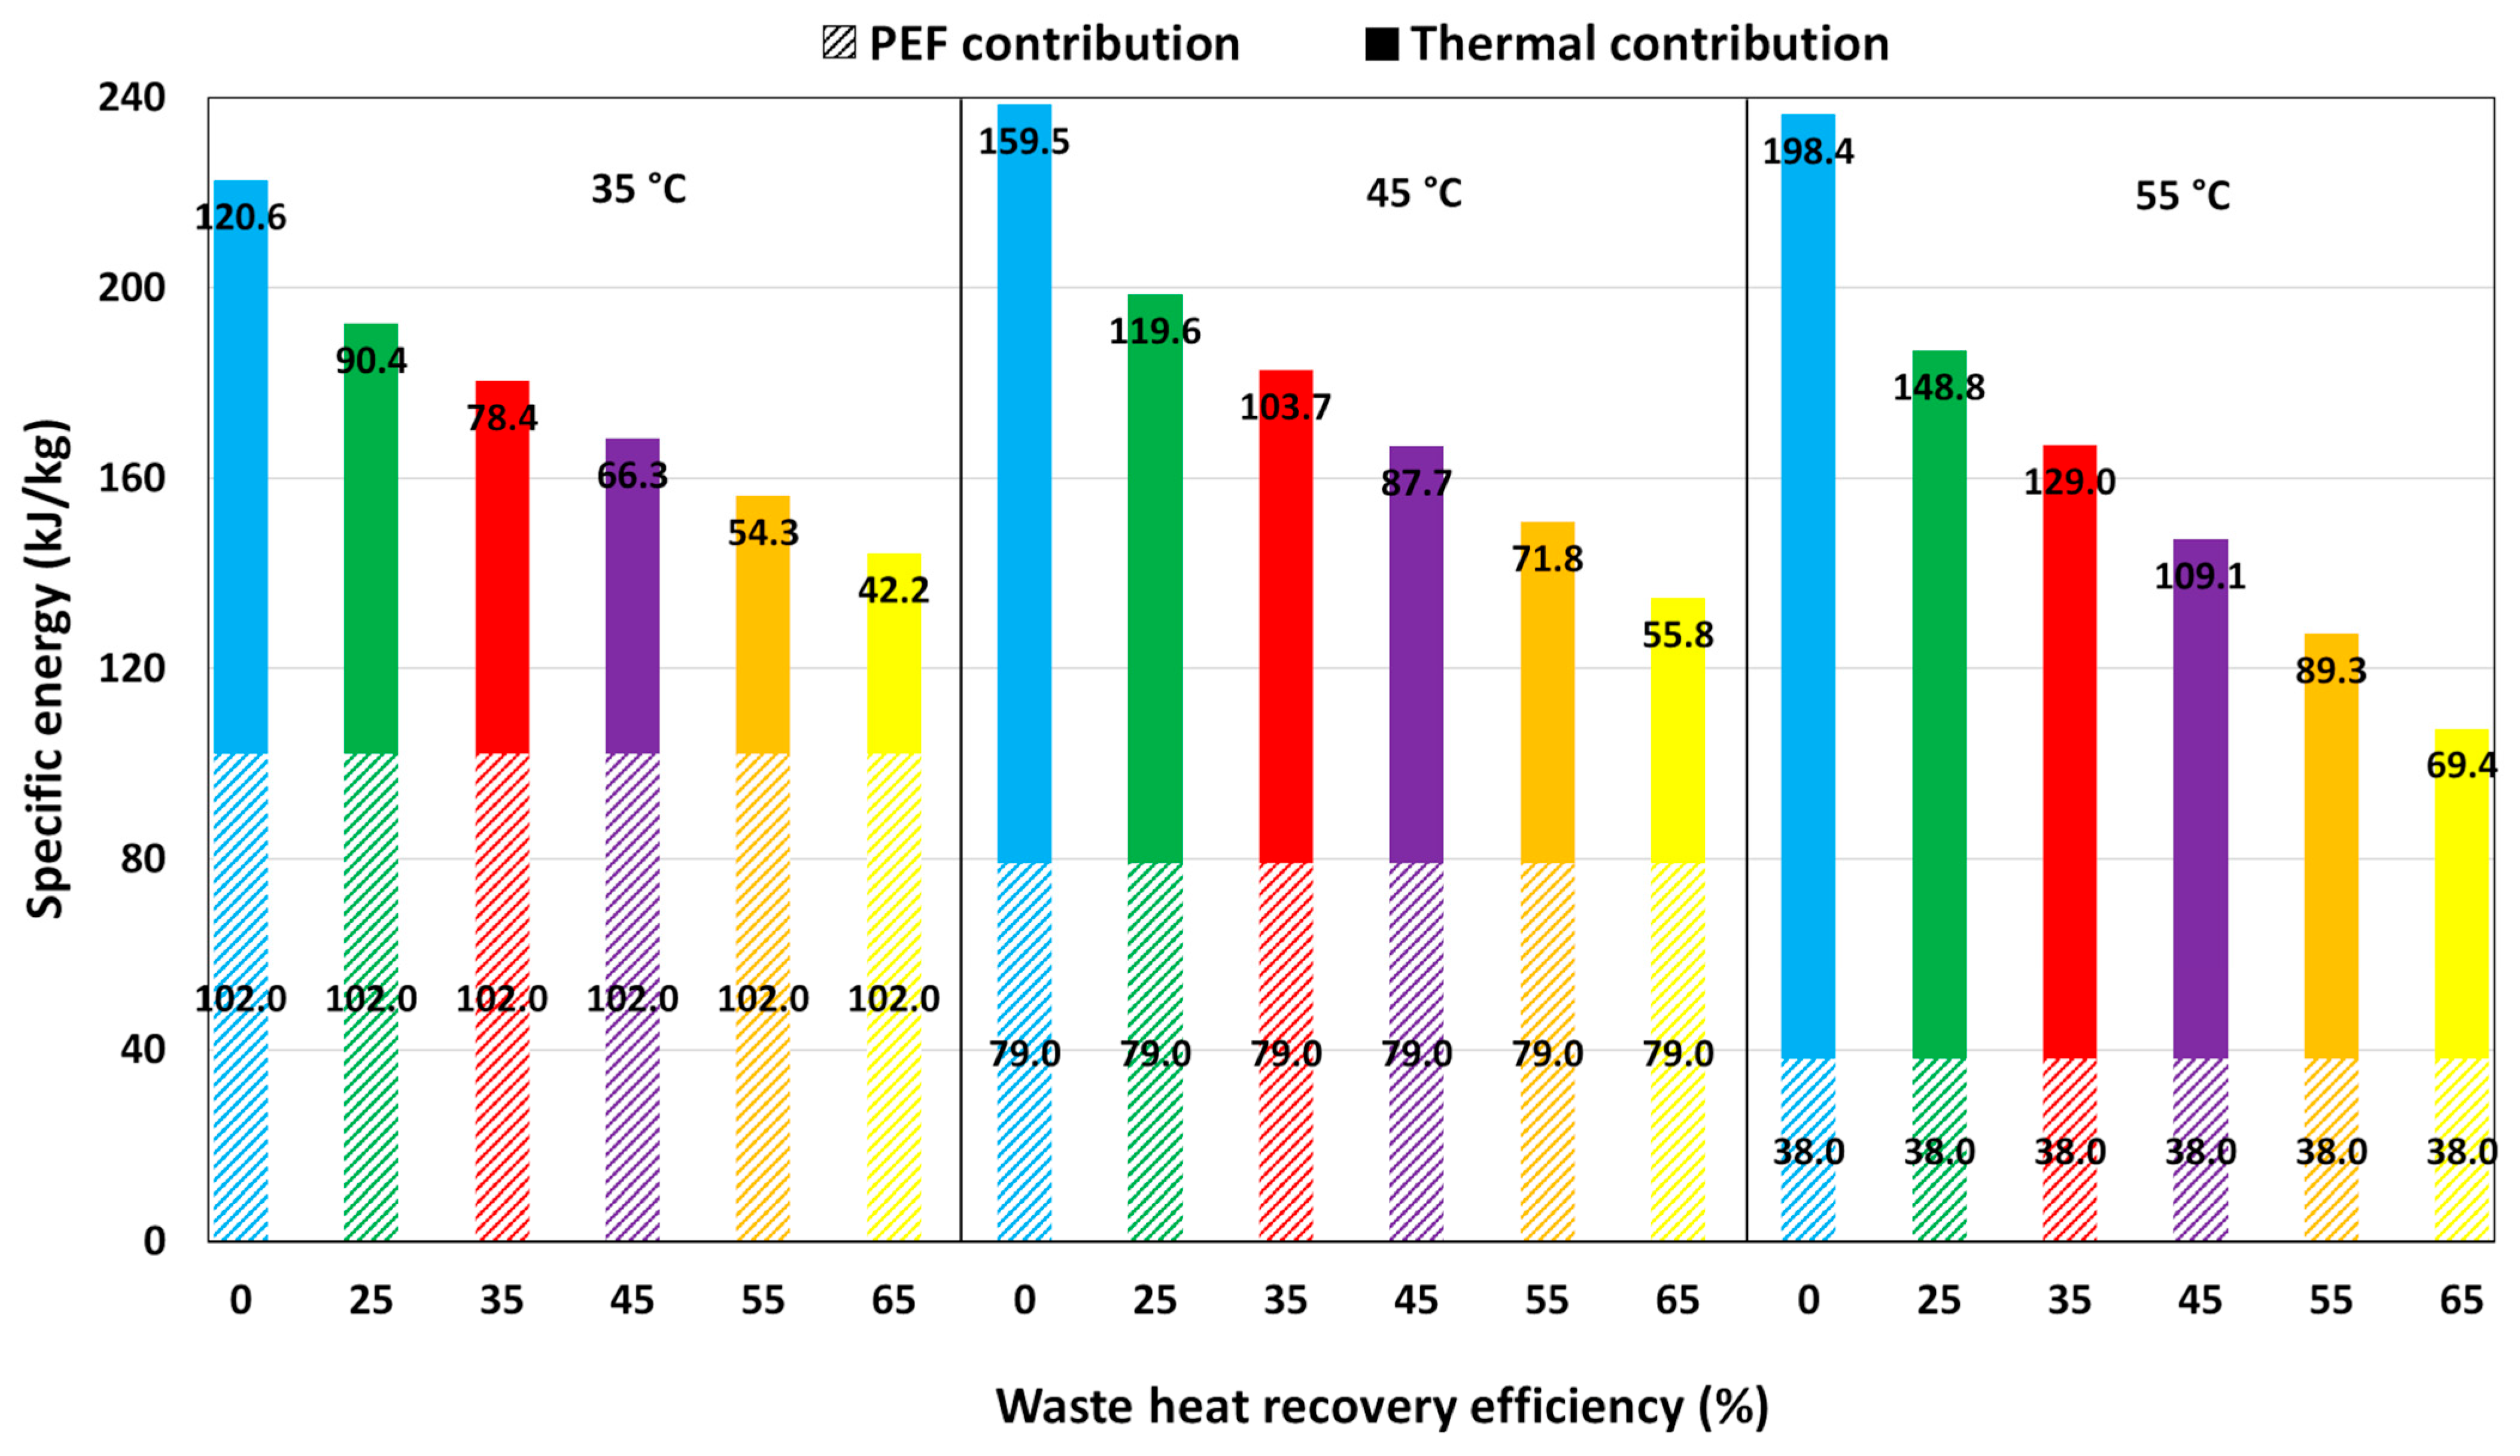
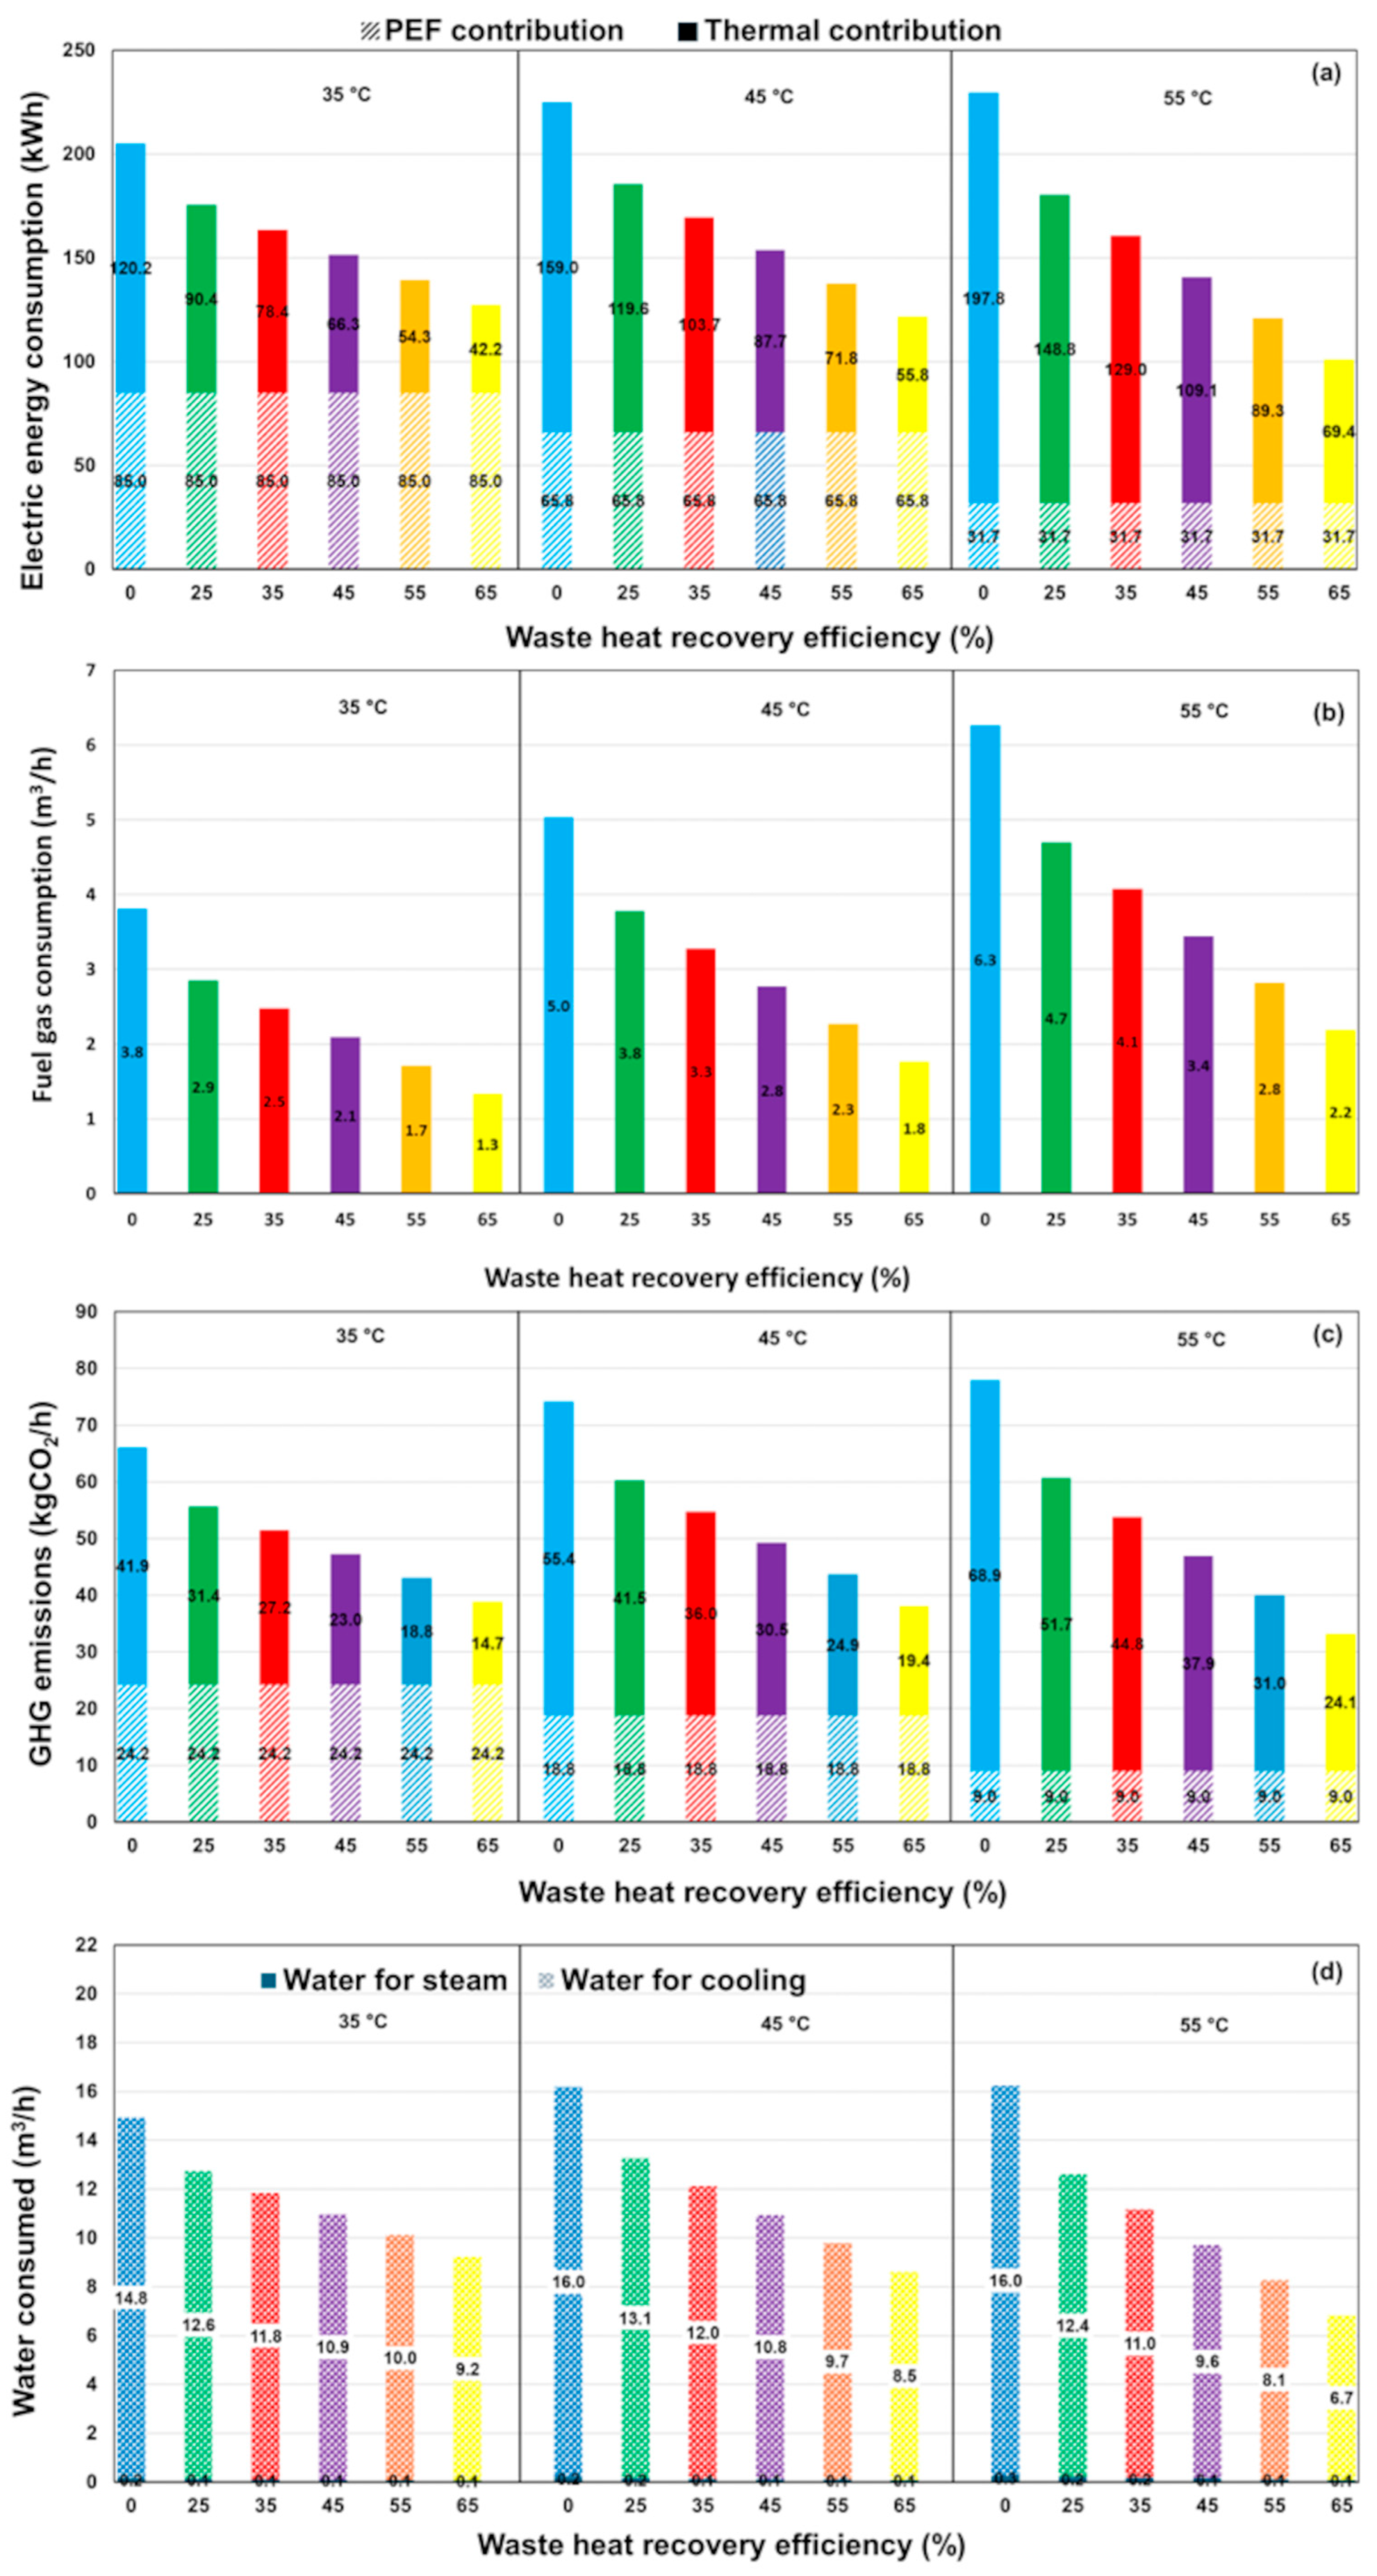
3.2.2. PEF Process
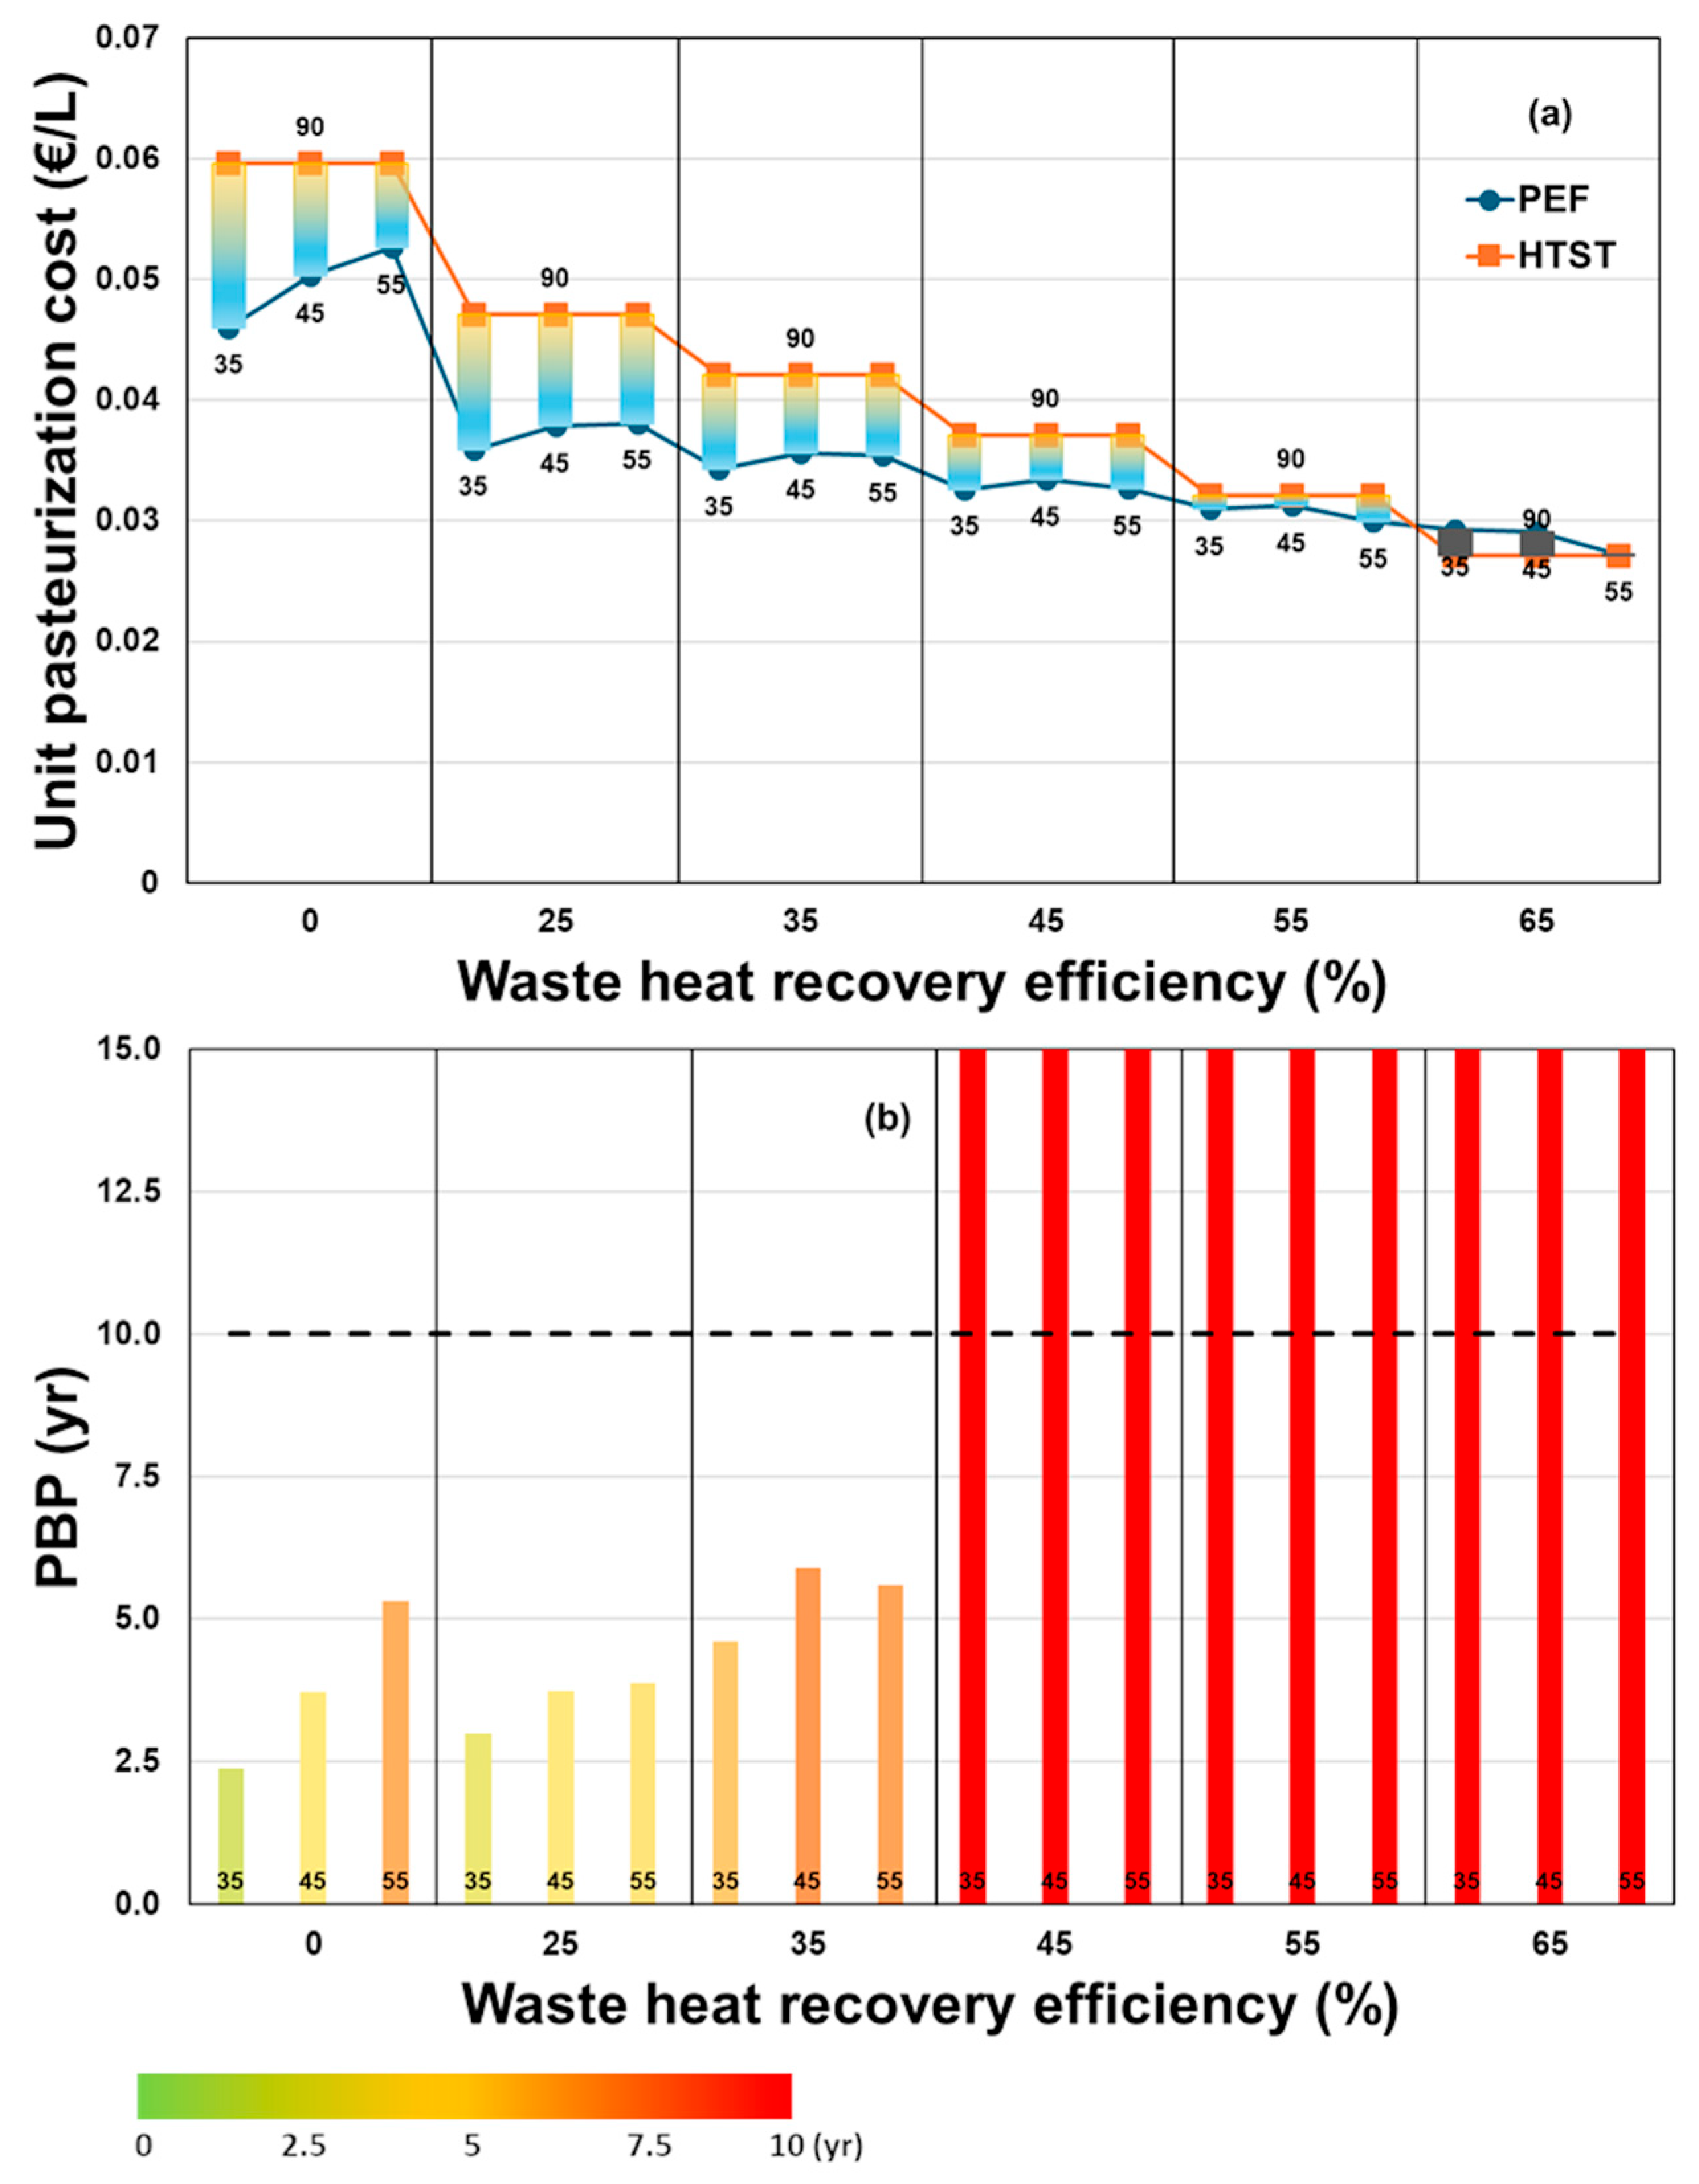
3.3. Cost Analysis
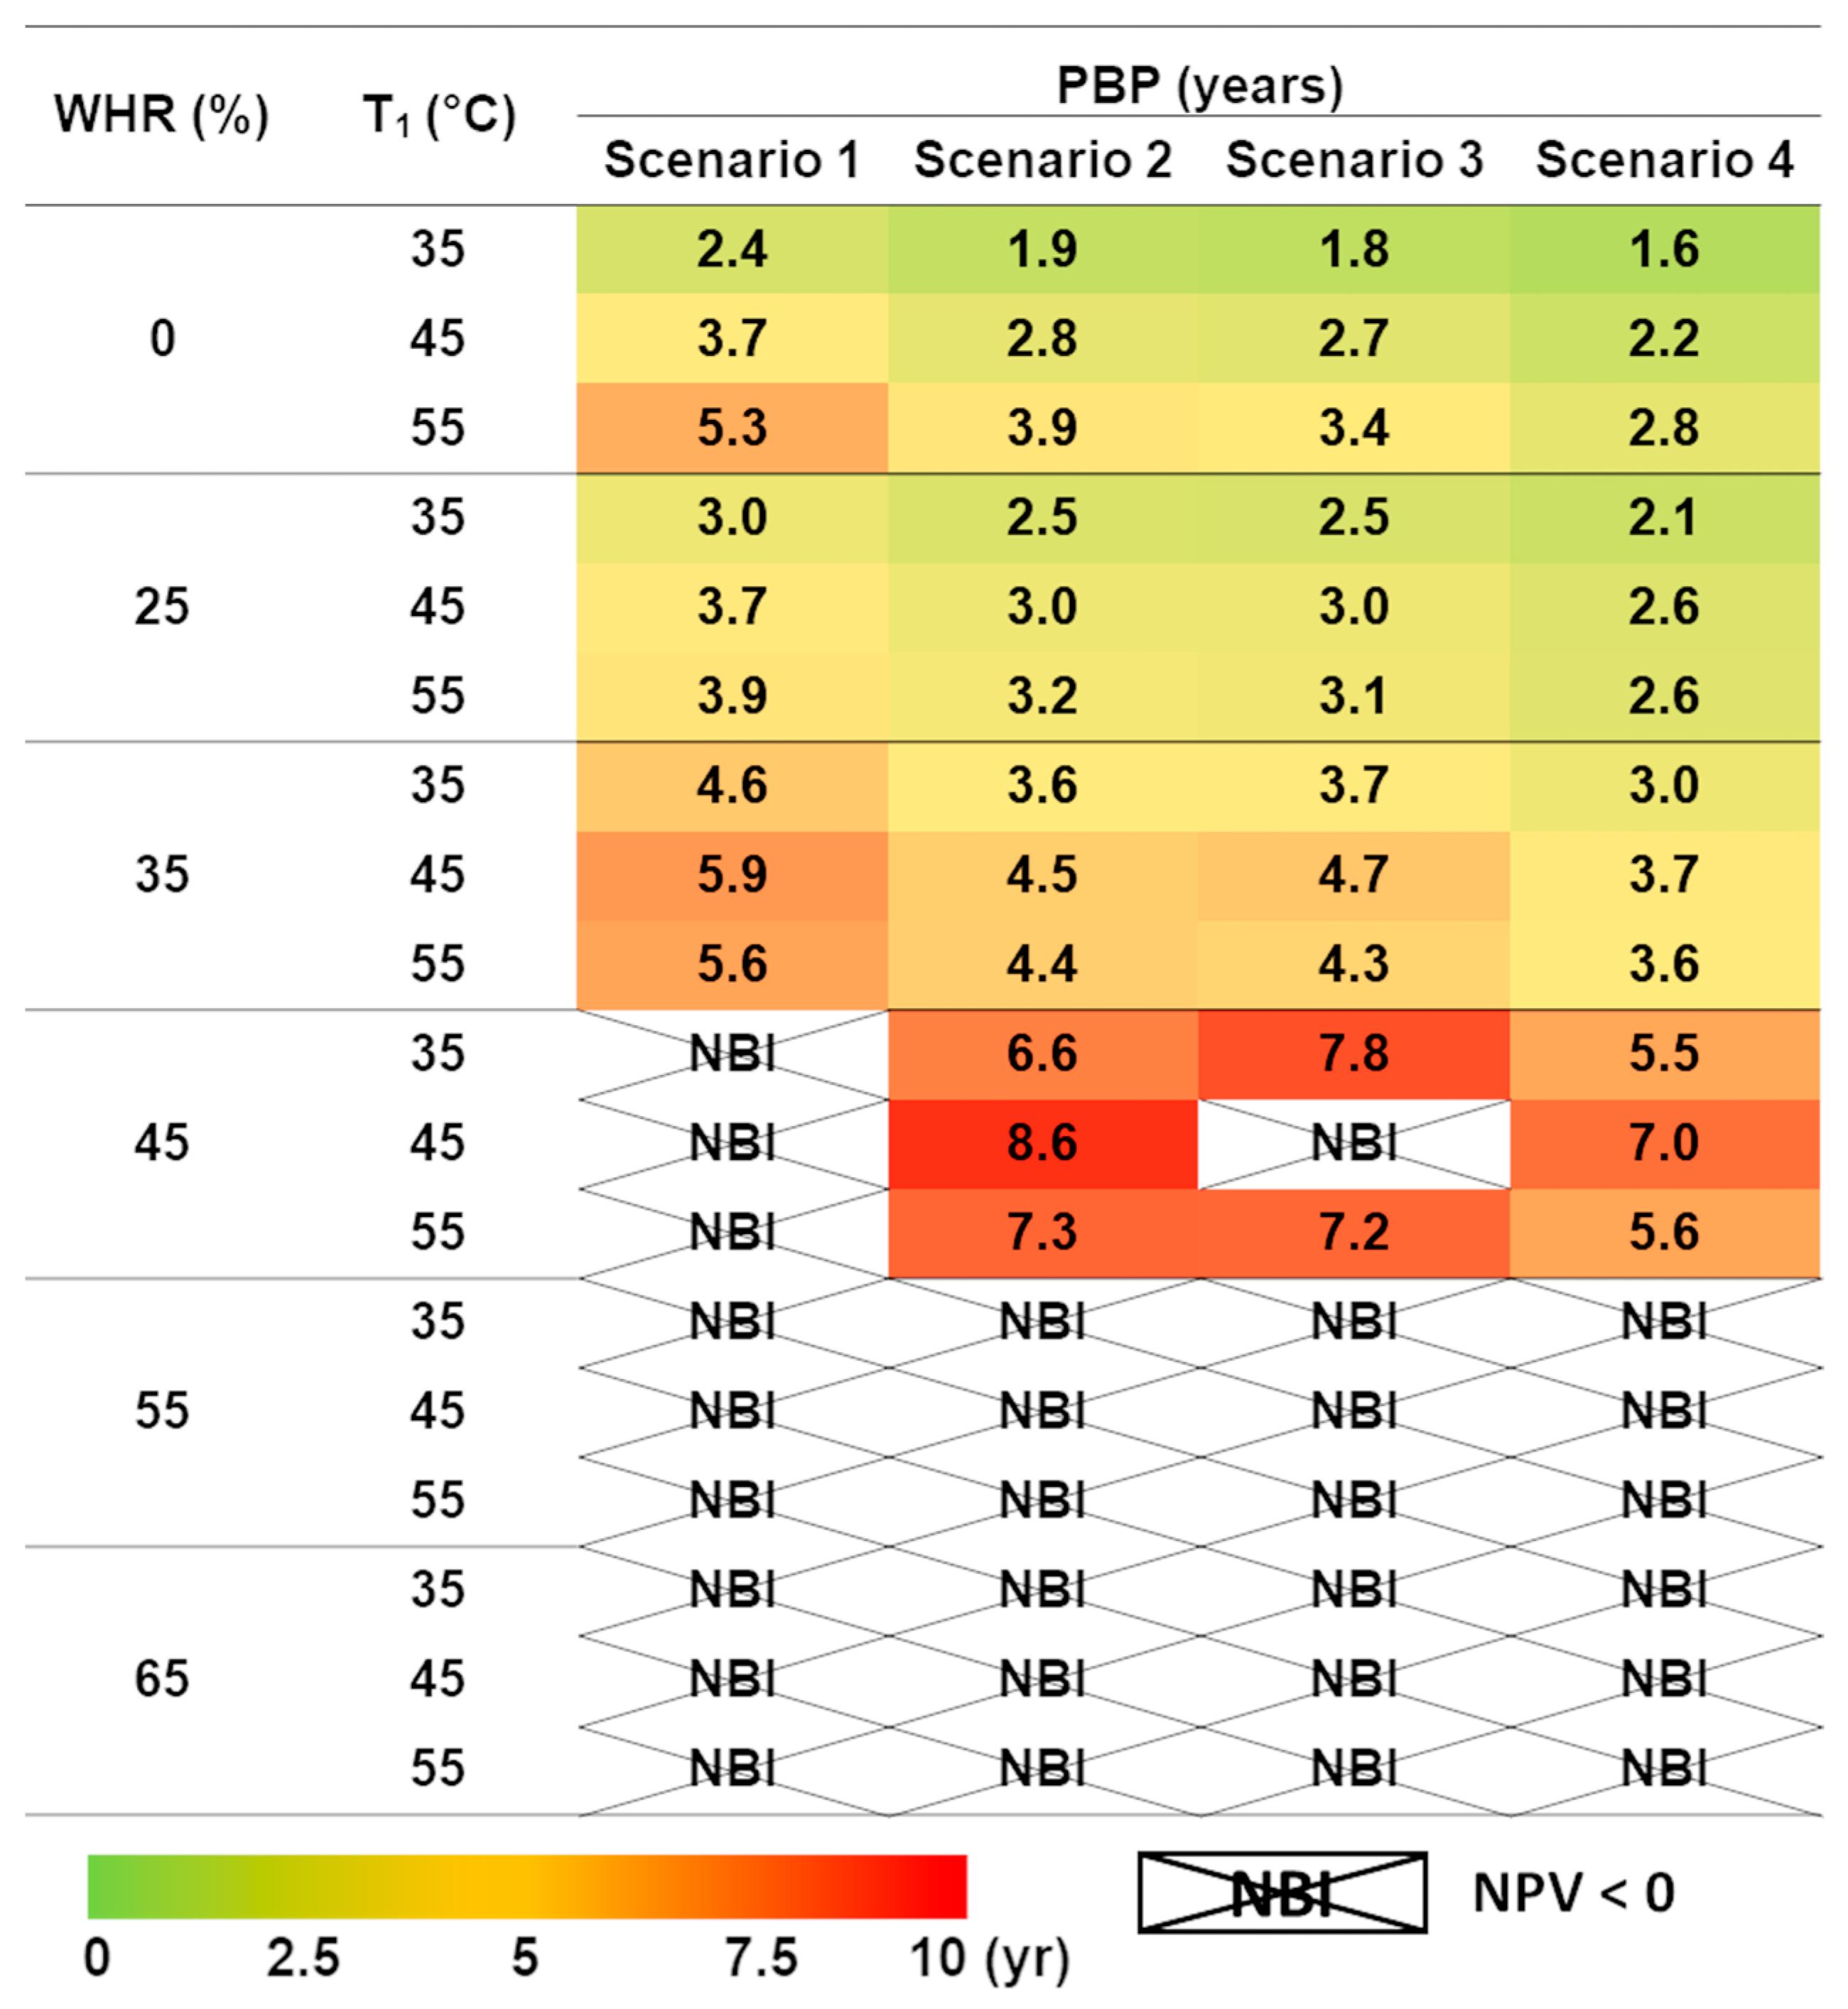
3.4. Energy Cost Sensitivity Analysis
3.5. Environmental Impacts of Orange Juice Pasteurization Methods
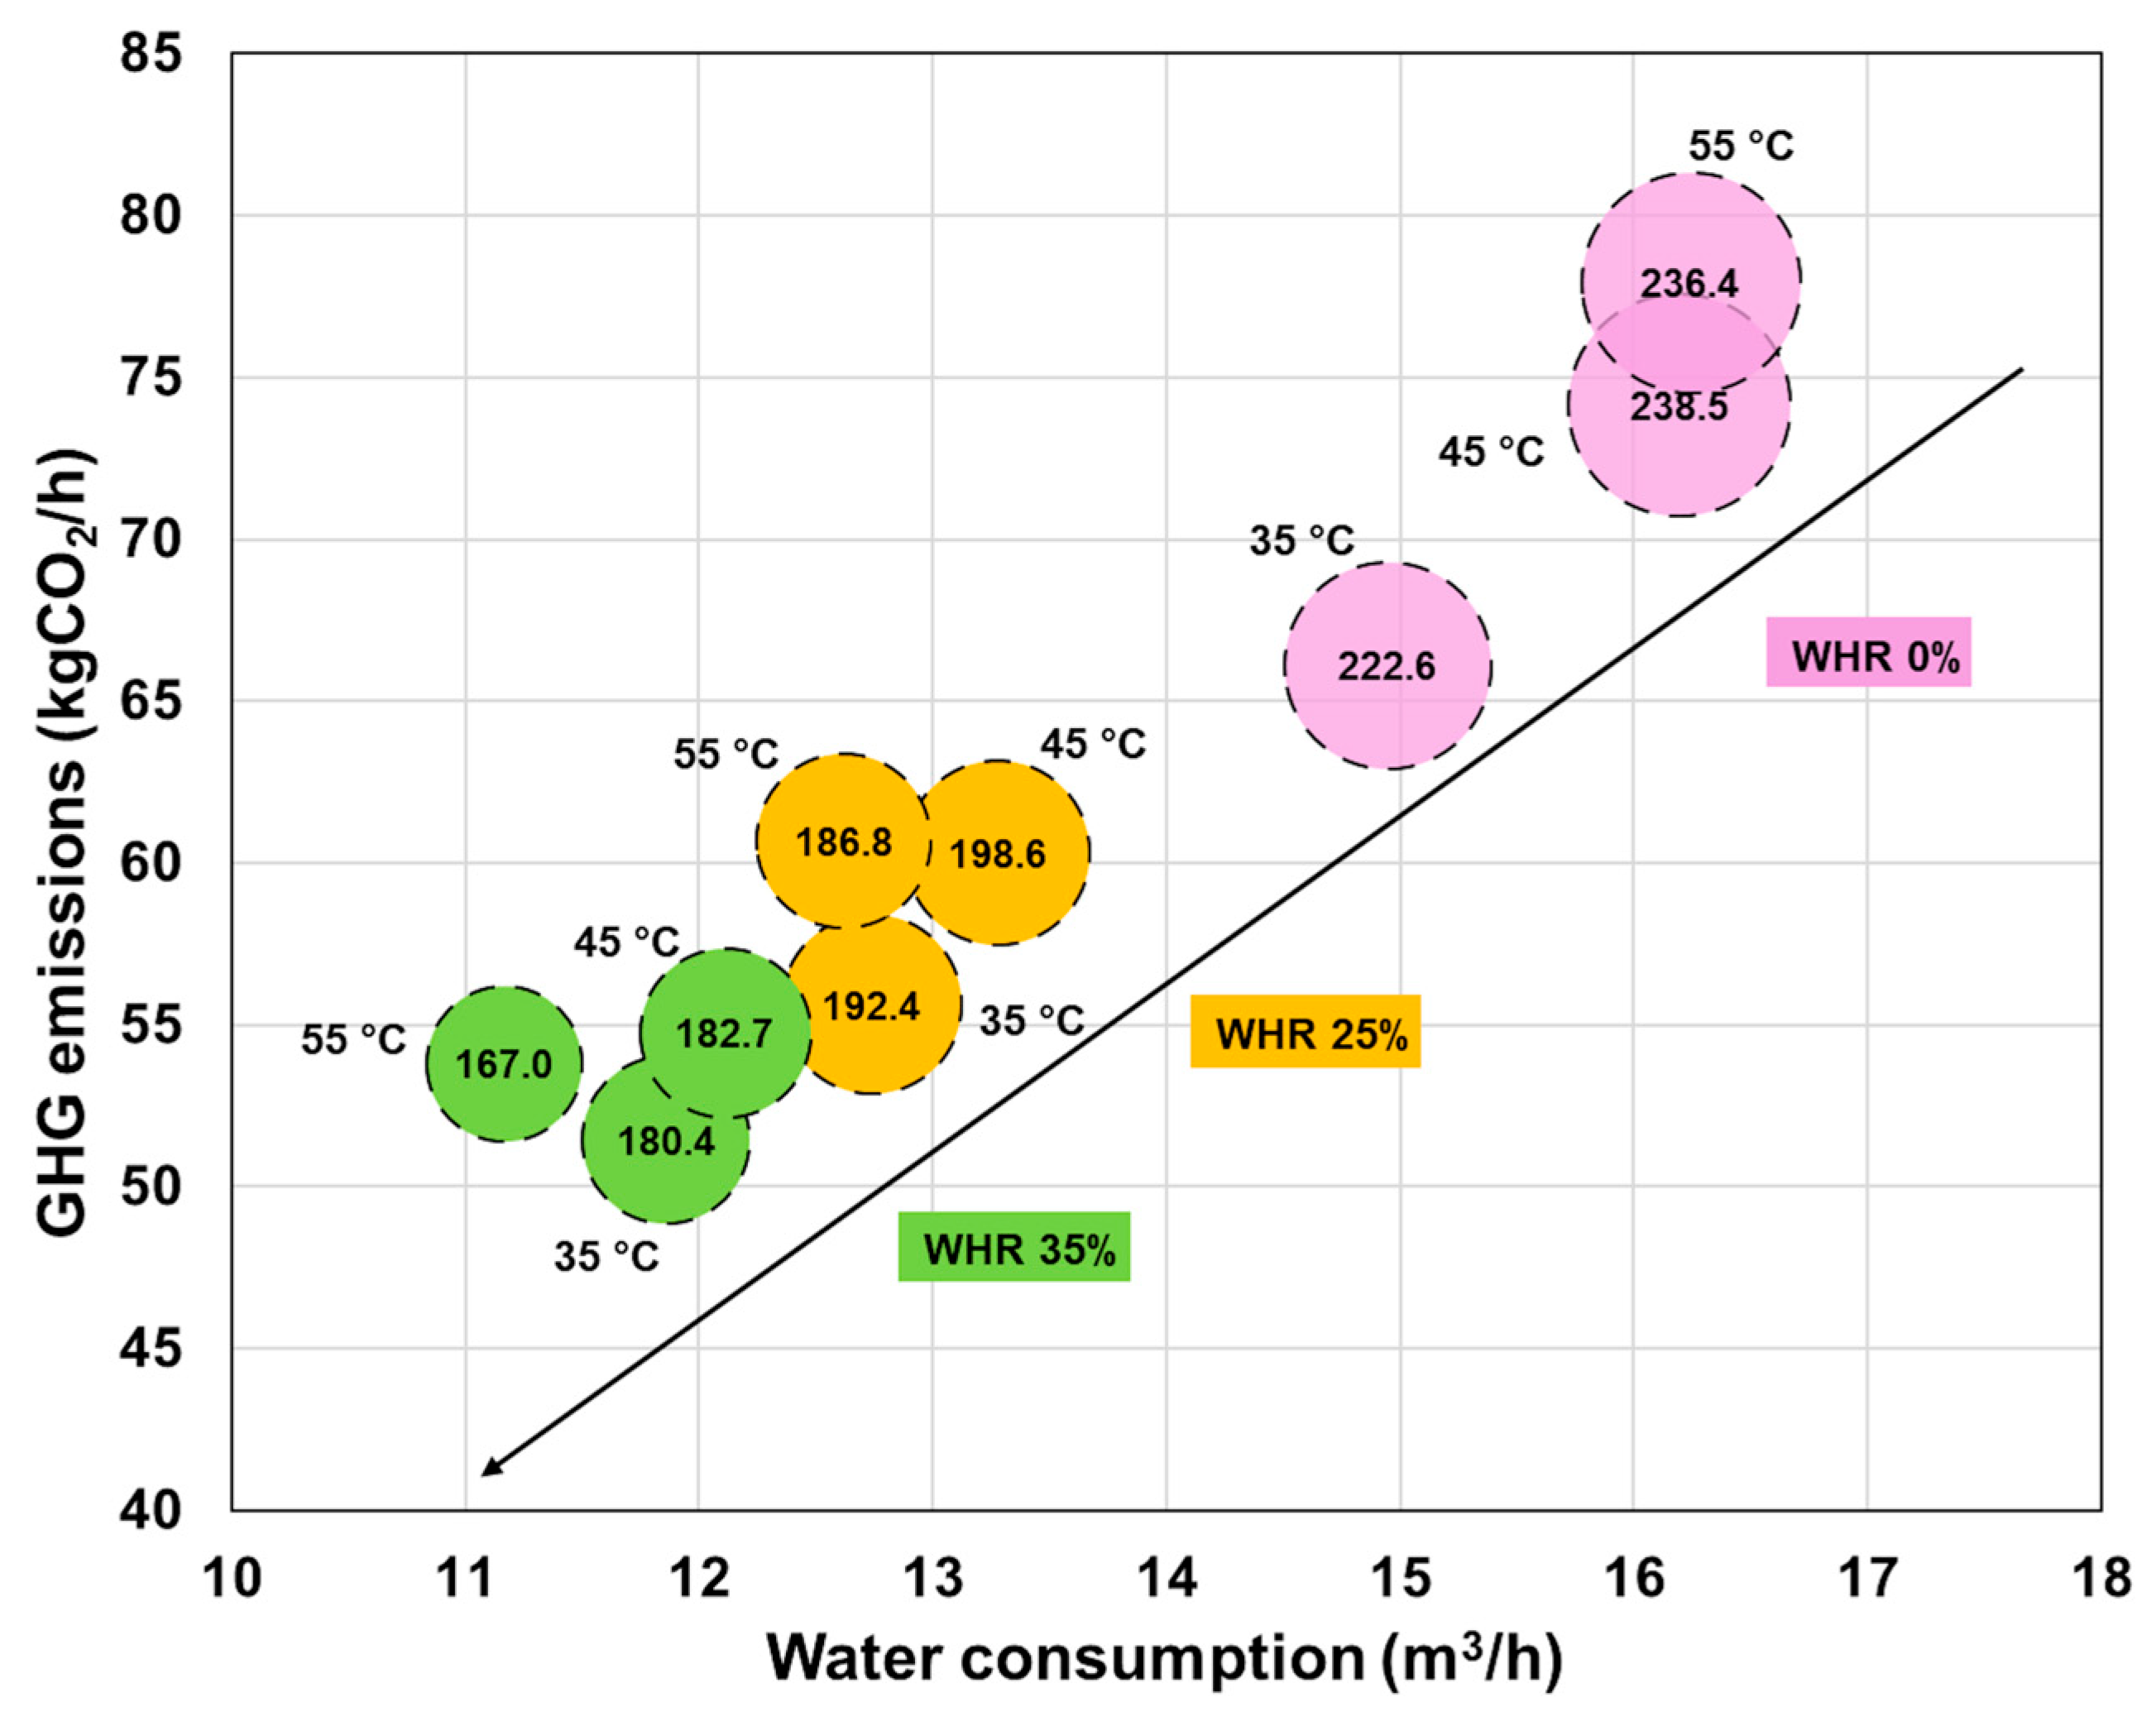
3.5.1. Resource Usage
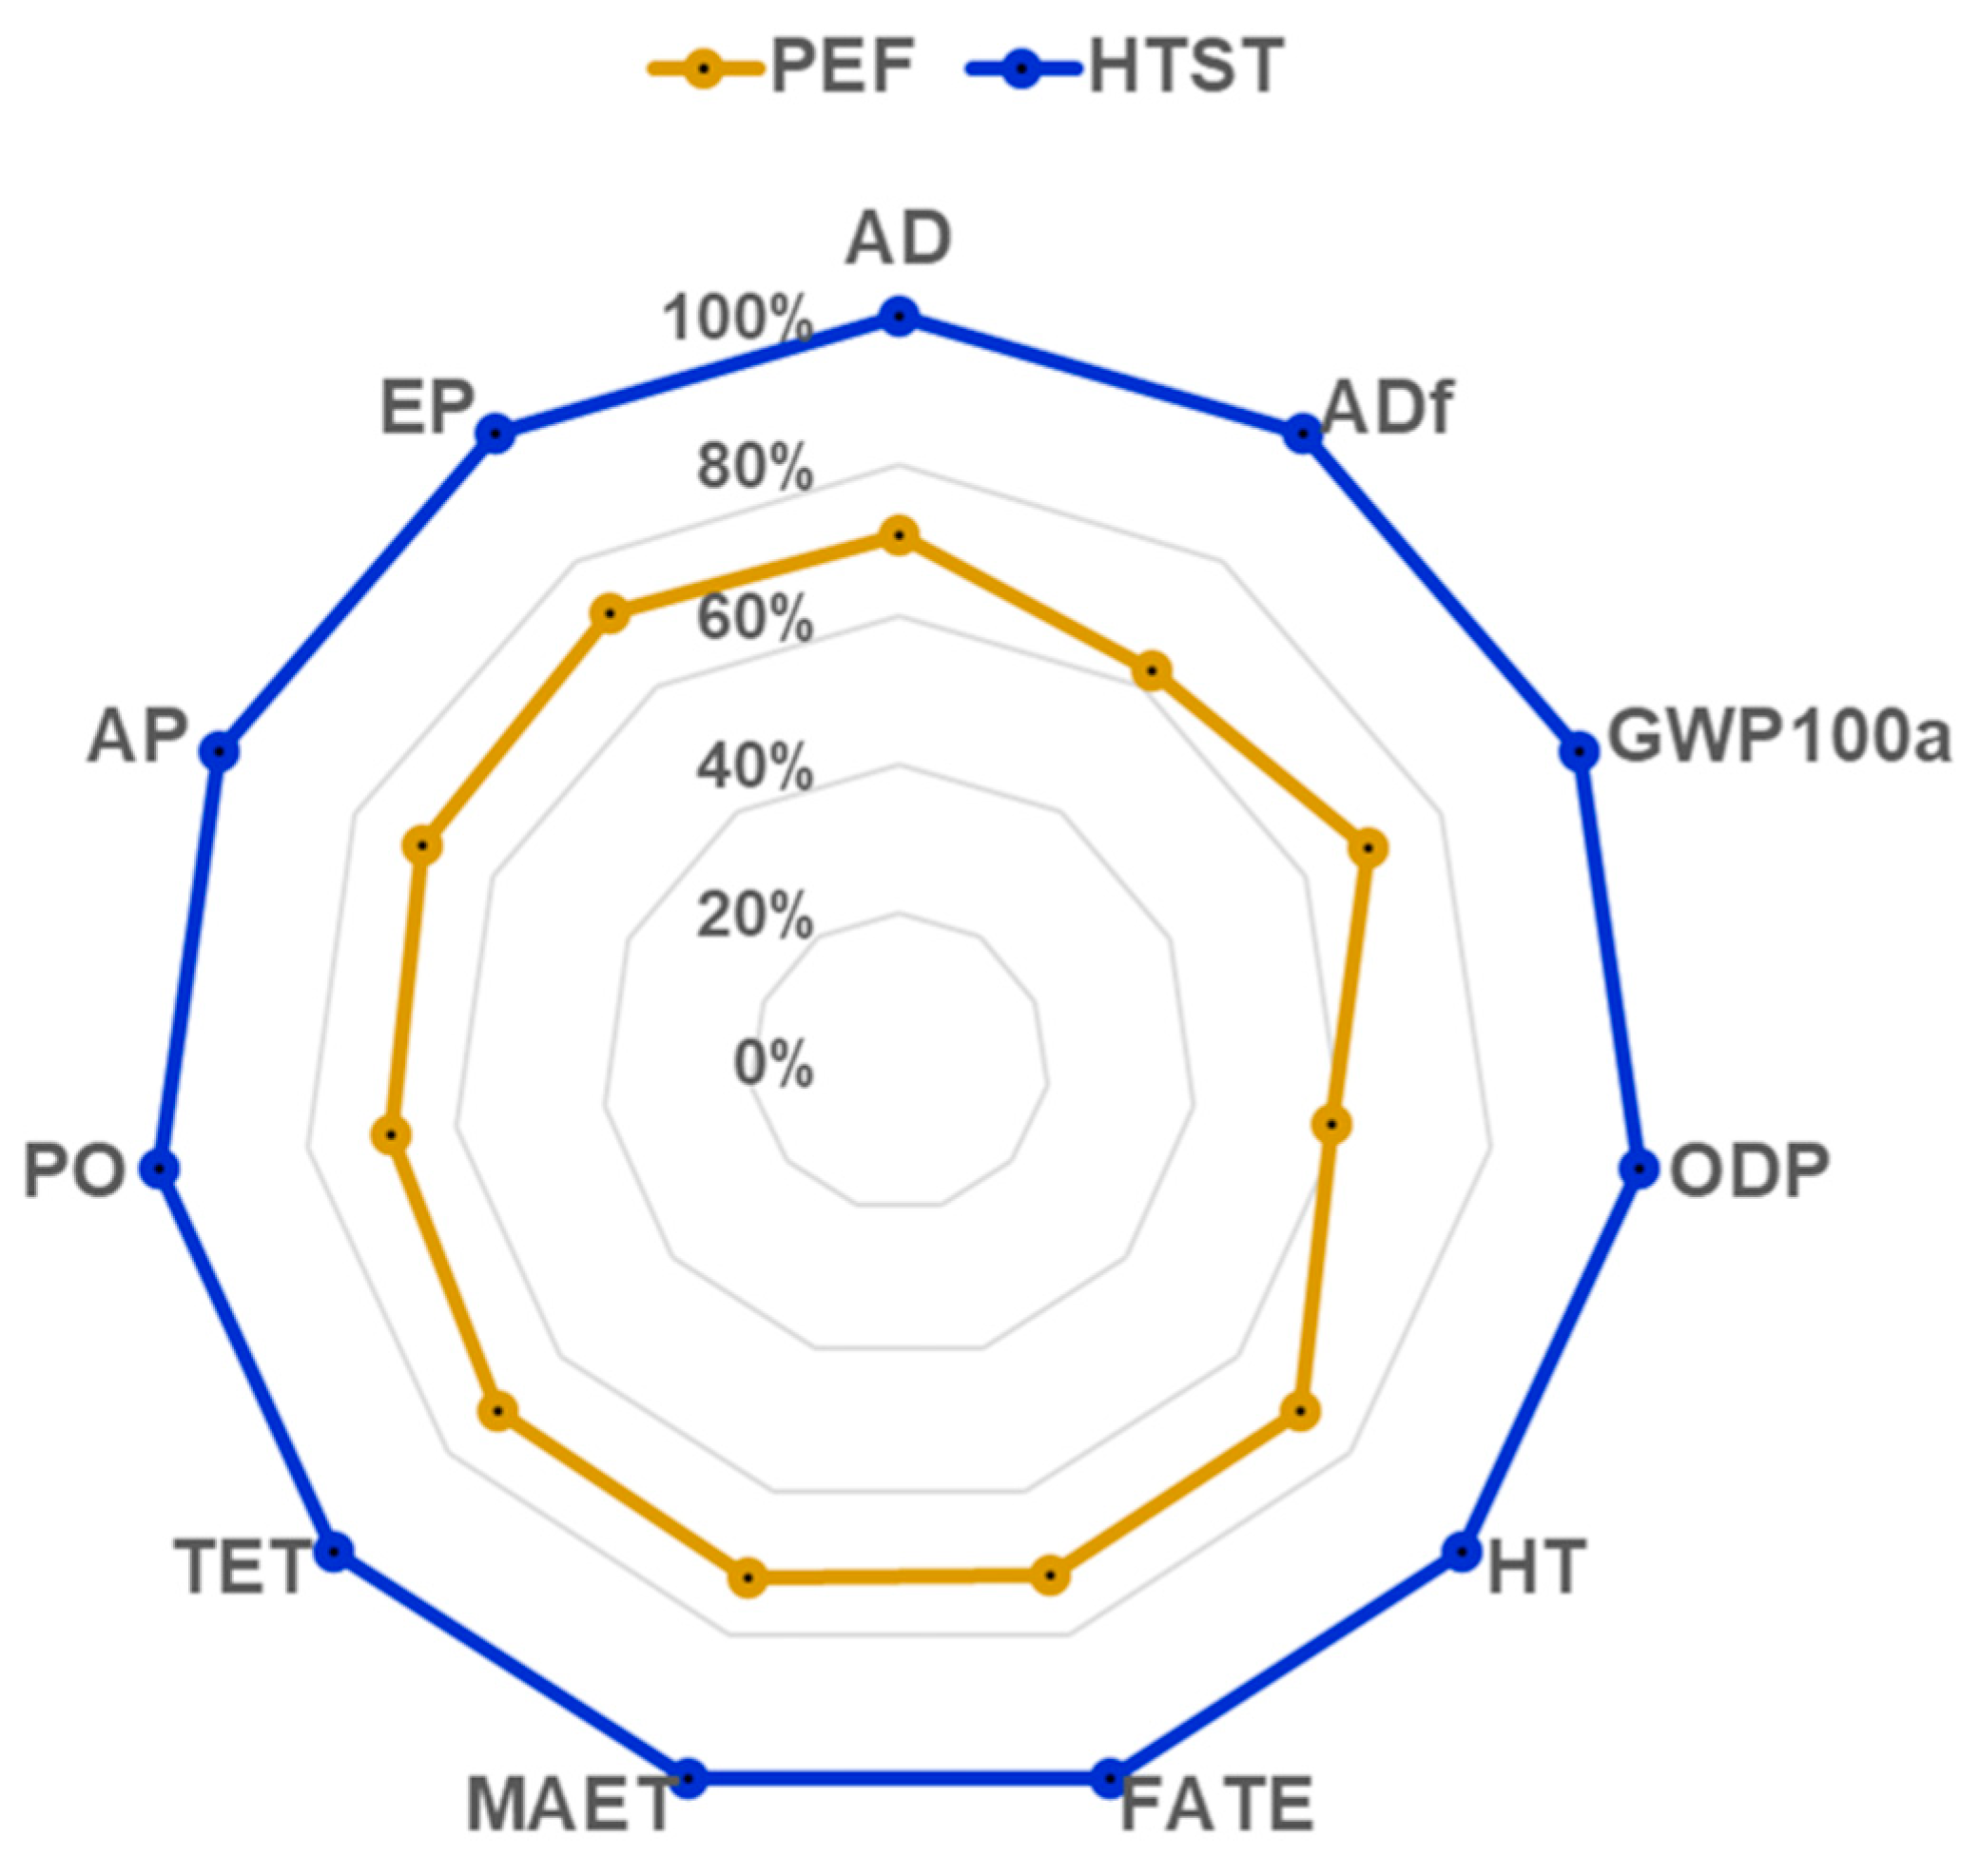
3.5.2. Midpoint Environmental Impact Indicators
3.6. Regulatory Challenges in the Adoption of PEF Technology
4. Conclusions
Supplementary Materials
Author Contributions
Funding
Institutional Review Board Statement
Informed Consent Statement
Data Availability Statement
Conflicts of Interest
References
- Smith, P.G. Introduction to Food Process Engineering; Food Science Text Series; Springer: Boston, MA, USA, 2011; ISBN 978-1-4419-7661-1. [Google Scholar]
- Kermani, N.A.; Holm, F.; Elmegaard, B. A Systematic Review of Electrification Technologies for Danish Food and Beverage Industry. In Proceedings of the ECOS 2022—The 35th International Conference on Efficiency, Cost, Optimization, Simulation and Environmental Impact of Energy Systems ECOS, Paris, France, 4–7 July 2022. [Google Scholar]
- Eslami, E.; Abdurrahman, E.; Ferrari, G.; Pataro, G. Enhancing Resource Efficiency and Sustainability in Tomato Processing: A Comprehensive Review. J. Clean. Prod. 2023, 425, 138996. [Google Scholar] [CrossRef]
- Clairand, J.-M.; Briceno-Leon, M.; Escriva-Escriva, G.; Pantaleo, A.M. Review of Energy Efficiency Technologies in the Food Industry: Trends, Barriers, and Opportunities. IEEE Access 2020, 8, 48015–48029. [Google Scholar] [CrossRef]
- Rodriguez-Gonzalez, O.; Buckow, R.; Koutchma, T.; Balasubramaniam, V.M. Energy Requirements for Alternative Food Processing Technologies-Principles, Assumptions, and Evaluation of Efficiency. Compr. Rev. Food Sci. Food Saf. 2015, 14, 536–554. [Google Scholar] [CrossRef]
- Arshad, R.N.; Abdul-Malek, Z.; Roobab, U.; Munir, M.A.; Naderipour, A.; Qureshi, M.I.; El-Din Bekhit, A.; Liu, Z.W.; Aadil, R.M. Pulsed Electric Field: A Potential Alternative towards a Sustainable Food Processing. Trends Food Sci. Technol. 2021, 111, 43–54. [Google Scholar] [CrossRef]
- Meitz, S.; Reiter, J.; Fluch, J.; Tugores, C.R. Decarbonization of the Food Industry—The Solution for System Design and Operation. Sustainability 2023, 15, 14262. [Google Scholar] [CrossRef]
- Costa, C.; Wollenberg, E.; Benitez, M.; Newman, R.; Gardner, N.; Bellone, F. Roadmap for Achieving Net-Zero Emissions in Global Food Systems by 2050. Sci. Rep. 2022, 12, 15064. [Google Scholar] [CrossRef]
- Tubiello, F.N.; Karl, K.; Flammini, A.; Gütschow, J.; Obli-Laryea, G.; Conchedda, G.; Pan, X.; Qi, S.Y.; Halldórudóttir Heiðarsdóttir, H.; Wanner, N.; et al. Pre- and Post-Production Processes Increasingly Dominate Greenhouse Gas Emissions from Agri-Food Systems. Earth Syst. Sci. Data 2022, 14, 1795–1809. [Google Scholar] [CrossRef]
- Hoekstra, A.Y.; Mekonnen, M.M. The Water Footprint of Humanity. Proc. Natl. Acad. Sci. USA 2012, 109, 3232–3237. [Google Scholar] [CrossRef] [PubMed]
- Compton, M.; Willis, S.; Rezaie, B.; Humes, K. Food Processing Industry Energy and Water Consumption in the Pacific Northwest. Innov. Food Sci. Emerg. Technol. 2018, 47, 371–383. [Google Scholar] [CrossRef]
- Chacha, J.S.; Zhang, L.; Ofoedu, C.E.; Suleiman, R.A.; Dotto, J.M.; Roobab, U.; Agunbiade, A.O.; Duguma, H.T.; Mkojera, B.T.; Hossaini, S.M.; et al. Revisiting Non-Thermal Food Processing and Preservation Methods—Action Mechanisms, Pros and Cons: A Technological Update (2016–2021). Foods 2021, 10, 1430. [Google Scholar] [CrossRef]
- Raso, J.; Frey, W.; Ferrari, G.; Pataro, G.; Knorr, D.; Teissie, J.; Miklavčič, D. Recommendations Guidelines on the Key Information to Be Reported in Studies of Application of PEF Technology in Food and Biotechnological Processes. Innov. Food Sci. Emerg. Technol. 2016, 37, 312–321. [Google Scholar] [CrossRef]
- Lytras, F.; Psakis, G.; Gatt, R.; Cebrián, G.; Raso, J.; Valdramidis, V. Exploring the Efficacy of Pulsed Electric Fields (PEF) in Microbial Inactivation during Food Processing: A Deep Dive into the Microbial Cellular and Molecular Mechanisms. Innov. Food Sci. Emerg. Technol. 2024, 95, 103732. [Google Scholar] [CrossRef]
- Timmermans, R.A.H.; Nierop Groot, M.N.; Nederhoff, A.L.; van Boekel, M.A.J.S.; Matser, A.M.; Mastwijk, H.C. Pulsed Electric Field Processing of Different Fruit Juices: Impact of PH and Temperature on Inactivation of Spoilage and Pathogenic Micro-Organisms. Int. J. Food Microbiol. 2014, 173, 105–111. [Google Scholar] [CrossRef]
- Montanari, C.; Tylewicz, U.; Tabanelli, G.; Berardinelli, A.; Rocculi, P.; Ragni, L.; Gardini, F. Heat-Assisted Pulsed Electric Field Treatment for the Inactivation of Saccharomyces Cerevisiae: Effects of the Presence of Citral. Front. Microbiol. 2019, 10, 1737. [Google Scholar] [CrossRef]
- Pataro, G.; Senatore, B.; Donsì, G.; Ferrari, G. Effect of Electric and Flow Parameters on PEF Treatment Efficiency. J. Food Eng. 2011, 105, 79–88. [Google Scholar] [CrossRef]
- Ghoshal, G. Comprehensive Review on Pulsed Electric Field in Food Preservation: Gaps in Current Studies for Potential Future Research. Heliyon 2023, 9, e17532. [Google Scholar] [CrossRef]
- Saldaña, G.; Álvarez, I.; Condón, S.; Raso, J. Microbiological Aspects Related to the Feasibility of PEF Technology for Food Pasteurization. Crit. Rev. Food Sci. Nutr. 2014, 54, 1415–1426. [Google Scholar] [CrossRef]
- Kempkes, M.A. Industrial Pulsed Electric Field Systems. In Handbook of Electroporation; Springer International Publishing: Cham, Switzerland, 2017; pp. 1–21. [Google Scholar]
- Arnal, Á.; Royo, P.; Pataro, G.; Ferrari, G.; Ferreira, V.; López-Sabirón, A.; Ferreira, G. Implementation of PEF Treatment at Real-Scale Tomatoes Processing Considering LCA Methodology as an Innovation Strategy in the Agri-Food Sector. Sustainability 2018, 10, 979. [Google Scholar] [CrossRef]
- Leone, A.; Tamborrino, A.; Esposto, S.; Berardi, A.; Servili, M. Investigation on the Effects of a Pulsed Electric Field (PEF) Continuous System Implemented in an Industrial Olive Oil Plant. Foods 2022, 11, 2758. [Google Scholar] [CrossRef] [PubMed]
- DLG Expert Report 02/2024. Application of Pulsed Electric Fields (PEF) in the Food Industry; DLG: Frankfurt am Main, Germany, 2024. [Google Scholar]
- Sampedro, F.; McAloon, A.; Yee, W.; Fan, X.; Zhang, H.Q.; Geveke, D.J. Cost Analysis of Commercial Pasteurization of Orange Juice by Pulsed Electric Fields. Innov. Food Sci. Emerg. Technol. 2013, 17, 72–78. [Google Scholar] [CrossRef]
- Heinz, V.; Toepfl, S.; Knorr, D. Impact of Temperature on Lethality and Energy Efficiency of Apple Juice Pasteurization by Pulsed Electric Fields Treatment. Innov. Food Sci. Emerg. Technol. 2003, 4, 167–175. [Google Scholar] [CrossRef]
- Eslami, E.; Landi, G.; Benedetti, M.; Pataro, G. Economic and Environmental Impact Analysis of Innovative Peeling Methods in the Tomato Processing Industry. Sustainability 2024, 16, 11272. [Google Scholar] [CrossRef]
- Toepfl, S.; Heinz, V.; Knorr, D. High Intensity Pulsed Electric Fields Applied for Food Preservation. Chem. Eng. Process. Process Intensif. 2007, 46, 537–546. [Google Scholar] [CrossRef]
- Carullo, D.; Pataro, G.; Donsì, F.; Ferrari, G. Pulsed Electric Fields-Assisted Extraction of Valuable Compounds From Arthrospira Platensis: Effect of Pulse Polarity and Mild Heating. Front. Bioeng. Biotechnol. 2020, 8, 551272. [Google Scholar] [CrossRef]
- Yan, Z.; Yin, L.; Hao, C.; Liu, K.; Qiu, J. Synergistic Effect of Pulsed Electric Fields and Temperature on the Inactivation of Microorganisms. AMB Express 2021, 11, 1–16. [Google Scholar] [CrossRef]
- Toepfl, S.; Mathys, A.; Heinz, V.; Knorr, D. Review: Potential of High Hydrostatic Pressure and Pulsed Electric Fields for Energy Efficient and Environmentally Friendly Food Processing. Food Rev. Int. 2006, 22, 405–423. [Google Scholar] [CrossRef]
- Tomasula, P.M.; Yee, W.C.F.; McAloon, A.J.; Nutter, D.W.; Bonnaillie, L.M. Computer Simulation of Energy Use, Greenhouse Gas Emissions, and Process Economics of the Fluid Milk Process. J. Dairy Sci. 2013, 96, 3350–3368. [Google Scholar] [CrossRef]
- Sampedro, F.; McAloon, A.; Yee, W.; Fan, X.; Geveke, D.J. Cost Analysis and Environmental Impact of Pulsed Electric Fields and High Pressure Processing in Comparison with Thermal Pasteurization. Food Bioproc. Technol. 2014, 7, 1928–1937. [Google Scholar] [CrossRef]
- Landi, G.; Benedetti, M.; Eslami, E.; Ferrari, G.; Pataro, G. Cost, Energy Efficiency, and Environmental Impact Analysis of Orange Juice Pasteurization: Comparing Pulsed Electric Fields with Traditional Thermal Treatment. In Proceedings of the 2024 IEEE International Conference on Environment and Electrical Engineering and 2024 IEEE Industrial and Commercial Power Systems Europe (EEEIC/I&CPS Europe), Rome, Italy, 17 June 2024; IEEE: New York, NY, USA, 2024; pp. 1–6. [Google Scholar]
- Food and Drug Administration. Title 21—Food and Drugs. Part 120—Hazard Analysis Critical Control Point (HACCP) Systems. Subpart 24—Process Controls Code of Federal Regulations; Food and Drug Administration: Washington, DC, USA, 2009. [Google Scholar]
- Timmermans, R.A.H.; Mastwijk, H.C.; Berendsen, L.B.J.M.; Nederhoff, A.L.; Matser, A.M.; Van Boekel, M.A.J.S.; Nierop Groot, M.N. Moderate Intensity Pulsed Electric Fields (PEF) as Alternative Mild Preservation Technology for Fruit Juice. Int. J. Food Microbiol. 2019, 298, 63–73. [Google Scholar] [CrossRef]
- Toepfl, S. Pulsed Electric Field Food Treatment—Scale up from Lab to Industrial Scale. Procedia Food Sci. 2011, 1, 776–779. [Google Scholar] [CrossRef]
- Petruzzi, L.; Campaniello, D.; Speranza, B.; Corbo, M.R.; Sinigaglia, M.; Bevilacqua, A. Thermal Treatments for Fruit and Vegetable Juices and Beverages: A Literature Overview. Compr. Rev. Food Sci. Food Saf. 2017, 16, 668–691. [Google Scholar] [CrossRef]
- Meneses, N.; Jaeger, H.; Knorr, D. Minimization of Thermal Impact by Application of Electrode Cooling in a Co-linear PEF Treatment Chamber. J. Food Sci. 2011, 76, E536–E543. [Google Scholar] [CrossRef]
- Buckow, R.; Schroeder, S.; Berres, P.; Baumann, P.; Knoerzer, K. Simulation and Evaluation of Pilot-Scale Pulsed Electric Field (PEF) Processing. J. Food Eng. 2010, 101, 67–77. [Google Scholar] [CrossRef]
- Sinnott, R.; Towler, G. Chemical Engineering Design; Butterworth-Heinemann: Oxford, UK, 2019. [Google Scholar]
- ASHRAE. Heating, Ventilating, and Air-Conditioning Systems And Euipment; ASHRAE: Peachtree Corners, GA, USA, 2020. [Google Scholar]
- Bastos, J.; Monforti-Ferrario, F.; Melica, G. Covenant of Mayors for Climate and Energy: Greenhouse Gas Emission Factors for Local Emission Inventories; European Commission: Brussels, Belgium, 2024. [Google Scholar]
- EurEau. The Governance of Water Services in Europe 2020 Edition; EurEau: Brussels, Belgium, 2020. [Google Scholar]
- Matos, C.R.; Pereira da Silva, P.; Carneiro, J.F. Economic Assessment for Compressed Air Energy Storage Business Model Alternatives. Appl. Energy 2023, 329, 120273. [Google Scholar] [CrossRef]
- Crippa, M.; Solazzo, E.; Guizzardi, D.; Monforti-Ferrario, F.; Tubiello, F.N.; Leip, A. Food Systems Are Responsible for a Third of Global Anthropogenic GHG Emissions. Nat. Food 2021, 2, 198–209. [Google Scholar] [CrossRef]
- ISO 14040:2006; Environmental Management-Life Cycle Assessment—Principles and Framework. ISO: Geneva, Switzerland, 2006.
- ISO 14044:2006; Environmental Management-Life Cycle Assessment—Requirements and Guidelines. ISO: Geneva, Switzerland, 2006.
- Del Borghi, A.; Moreschi, L.; Gallo, M. Life Cycle Assessment in the Food Industry. In The Interaction of Food Industry and Environment; Elsevier: Amsterdam, The Netherlands, 2020; pp. 63–118. [Google Scholar]
- Rosenbaum, R.K.; Hauschild, M.Z.; Boulay, A.-M.; Fantke, P.; Laurent, A.; Núñez, M.; Vieira, M. Life Cycle Impact Assessment. In Life Cycle Assessment; Springer International Publishing: Cham, Switzerland, 2018; pp. 167–270. [Google Scholar]
- Center of Environmental Science (CML). CML-IA Characterisation Factors. Available online: http://cml.leiden.edu/software/data-cmlia.html (accessed on 7 November 2024).
- Sampedro, F.; Rivas, A.; Rodrigo, D.; Martínez, A.; Rodrigo, M. Pulsed Electric Fields Inactivation of Lactobacillus Plantarum in an Orange Juice–Milk Based Beverage: Effect of Process Parameters. J. Food Eng. 2007, 80, 931–938. [Google Scholar] [CrossRef]
- Sánchez-Moreno, C.; Plaza, L.; Elez-Martínez, P.; De Ancos, B.; Martín-Belloso, O.; Cano, M.P. Impact of High Pressure and Pulsed Electric Fields on Bioactive Compounds and Antioxidant Activity of Orange Juice in Comparison with Traditional Thermal Processing. J. Agric. Food Chem. 2005, 53, 4403–4409. [Google Scholar] [CrossRef] [PubMed]
- Salehi, F. Physico-Chemical Properties of Fruit and Vegetable Juices as Affected by Pulsed Electric Field: A Review. Int. J. Food Prop. 2020, 23, 1036–1050. [Google Scholar] [CrossRef]
- Buckow, R.; Ng, S.; Toepfl, S. Pulsed Electric Field Processing of Orange Juice: A Review on Microbial, Enzymatic, Nutritional, and Sensory Quality and Stability. Compr. Rev. Food Sci. Food Saf. 2013, 12, 455–467. [Google Scholar] [CrossRef] [PubMed]
- Chen, W.; Yan, L.; Bangal, P.R. Preparation of Graphene by the Rapid and Mild Thermal Reduction of Graphene Oxide Induced by Microwaves. Carbon N. Y. 2010, 48, 1146–1152. [Google Scholar] [CrossRef]
- Escuder Vieco, D.; Arenas Vidal, J.; Rojas García, P.; Gónzález, M.J.; García Lara, N.R.; Pallás Alonso, C.R. Comparative Analyses of Holder Pasteurization vs. HTST Pasteurization for Donor Milk: A Cost-Minimization Study Applicable to Human Milk Banks. Int. Breastfeed J. 2023, 18, 1–8. [Google Scholar] [CrossRef] [PubMed]
- Bhadbhade, N.; Patel, M.K. Analysis of Energy Efficiency Improvement and Carbon Dioxide Abatement Potentials for Swiss Food and Beverage Sector. Resour. Conserv. Recycl. 2020, 161, 104967. [Google Scholar] [CrossRef]
- Atuonwu, J.C.; Leadley, C.; Bosman, A.; Tassou, S.A. High-Pressure Processing, Microwave, Ohmic, and Conventional Thermal Pasteurization: Quality Aspects and Energy Economics. J. Food Process Eng. 2020, 43, e13328. [Google Scholar] [CrossRef]
- Aronsson, K.; Rönner, U. Influence of PH, Water Activity and Temperature on the Inactivation of Escherichia Coli and Saccharomyces Cerevisiae by Pulsed Electric Fields. Innov. Food Sci. Emerg. Technol. 2001, 2, 105–112. [Google Scholar] [CrossRef]
- El-Hag, A.H.; Dadarwal, R.; Gonzalez, O.R.; Jayaram, S.H.; Griffiths, M.W. Survivability of Inoculated Versus Naturally Grown Bacteria in Apple Juice Under Pulsed Electric Fields. IEEE Trans. Ind. Appl. 2010, 46, 9–15. [Google Scholar] [CrossRef]
- El-Hag, A.H.; Jayaram, S.H.; Griffiths, M.W. Inactivation of Naturally Grown Microorganisms in Orange Juice Using Pulsed Electric Fields. IEEE Trans. Plasma Sci. 2006, 34, 1412–1415. [Google Scholar] [CrossRef]
- Paniagua-Martínez, I.; Ramírez-Martínez, A.; Serment-Moreno, V.; Rodrigues, S.; Ozuna, C. Non-Thermal Technologies as Alternative Methods for Saccharomyces Cerevisiae Inactivation in Liquid Media: A Review. Food Bioproc. Technol. 2018, 11, 487–510. [Google Scholar] [CrossRef]
- Lee, P.Y.; Leong, S.Y.; Oey, I. Prospects of Pulsed Electric Fields Technology in Food Preservation and Processing Applications from Sensory and Consumer Perspectives. Int. J. Food Sci. Technol. 2024, 59, 6925–6943. [Google Scholar] [CrossRef]
- Góngora-Nieto, M.M.; Sepúlveda, D.R.; Pedrow, P.; Barbosa-Cánovas, G.V.; Swanson, B.G. Food Processing by Pulsed Electric Fields: Treatment Delivery, Inactivation Level, and Regulatory Aspects. LWT 2002, 35, 375–388. [Google Scholar] [CrossRef]
- Mikhrovska, M.; Käferböck, A.; Skarzynska, E.; Witrowa-Rajchert, D. Consumer Attitudes Regarding the Use of PEF in European Union: The Example of Poland. In Pulsed Electric Fields to Obtain Healthier and Sustainable Food for Tomorrow; Elsevier: Amsterdam, The Netherlands, 2020; pp. 311–325. [Google Scholar]
- Lee, P.Y.; Lusk, K.; Mirosa, M.; Oey, I. Effect of Information on Chinese Consumers’ Acceptance of Thermal and Non-Thermal Treated Apple Juices: A Study of Young Chinese Immigrants in New Zealand. Food Qual Prefer. 2016, 48, 118–129. [Google Scholar] [CrossRef]
- Sokolova, T.; Krishna, A.; Döring, T. Paper Meets Plastic: The Perceived Environmental Friendliness of Product Packaging. J. Consum. Res. 2023, 50, 468–491. [Google Scholar] [CrossRef]
- Lyng, J.G.; Lalor, F.; Quinn, G.; Pedrós-Garrido, S. Regulation of Foods Processed by Pulsed or Moderate Electric Fields (PEF or MEF). In Pulsed Electric Fields Technology for the Food Industry. Food Engineering Series; Springer International Publishing: Cham, Switzerland, 2022; pp. 541–561. [Google Scholar]
- Grossklaus, R. Codex Recommendations on the Scientific Basis of Health Claims. Eur. J. Nutr. 2009, 48, 15–22. [Google Scholar] [CrossRef]
- Kušar, A.; Žmitek, K.; Lähteenmäki, L.; Raats, M.M.; Pravst, I. Comparison of Requirements for Using Health Claims on Foods in the European Union, the USA, Canada, and Australia/New Zealand. Compr. Rev. Food Sci. Food Saf. 2021, 20, 1307–1332. [Google Scholar] [CrossRef] [PubMed]
- Tan, K.Y.M.; van der Beek, E.M.; Chan, M.Y.; Zhao, X.; Stevenson, L. Health Claims on Food Products in Southeast Asia: Regulatory Frameworks, Barriers, and Opportunities. Nutr. Rev. 2015, 73, 634–641. [Google Scholar] [CrossRef] [PubMed]
- Toepfl, S.; Heinz, V.; Knorr, D. Overview of Pulsed Electric Field Processing for Food. In Emerging Technologies for Food Processing; Elsevier: Amsterdam, The Netherlands, 2005; pp. 69–97. [Google Scholar]

| Waste Heat Recovery (WHR) Efficiency (%) | (°C) | * (kW) | ** (kg/h) |
|---|---|---|---|
| 0 | 4.0 | 278.8 | 456.0 |
| 25 | 25.5 | 209.1 | 342.0 |
| 35 | 34.1 | 181.2 | 296.4 |
| 45 | 42.7 | 153.3 | 250.8 |
| 55 | 51.3 | 125.5 | 205.2 |
| 65 | 59.9 | 97.6 | 159.6 |
| Waste Heat Recovery (WHR) Efficiency (%) | (°C) | (°C) | (kW) | (kg/h) |
|---|---|---|---|---|
| 0 | 35 | 4.0 | 100.5 | 160.3 |
| 45 | 4.0 | 132.9 | 212.0 | |
| 55 | 4.0 | 165.3 | 263.7 | |
| 25 | 35 | 11.8 | 75.4 | 120.2 |
| 45 | 14.3 | 99.7 | 159.0 | |
| 55 | 16.8 | 124.0 | 197.8 | |
| 35 | 35 | 14.9 | 65.3 | 104.2 |
| 45 | 18.4 | 86.4 | 137.8 | |
| 55 | 21.9 | 107.5 | 171.4 | |
| 45 | 35 | 18.0 | 55.3 | 88.2 |
| 45 | 22.5 | 73.1 | 116.6 | |
| 55 | 27.0 | 90.9 | 145.0 | |
| 55 | 35 | 21.1 | 45.2 | 72.1 |
| 45 | 26.6 | 59.8 | 95.4 | |
| 55 | 32.1 | 74.4 | 118.7 | |
| 65 | 35 | 24.2 | 35.2 | 56.1 |
| 45 | 30.7 | 46.5 | 74.2 | |
| 55 | 37.2 | 57.9 | 92.3 |
| Process Parameters | HTST = 90 °C) | PEF (WHR 35%, = 55 °C) |
|---|---|---|
| Process flow (L/yr) | 16,500,000 | 16,500,000 |
| Annual hours of production (h/yr) | 5500 | 5500 |
| Throughput (L/h) | 3000 | 3000 |
| Capital costs | ||
| Heat exchangers (EUR) | 4500 | 5500 |
| PEF equipment (EUR) | 0 | 680,000 |
| HTST equipment (EUR) | 200,000 | 0 |
| Process chilling (EUR) | 28,830 | 35,340 |
| Process pumps (EUR) | 1000 | 1000 |
| Gas steam generator (EUR) | 56,525 | 28,826 |
| Total capital cost (EUR) | 290,855 | 750,666 |
| Utility costs | ||
| Process electricity (kWh/yr) | 1,138,926 | 881,211 |
| Steam natural gas (smc/yr) | 48,252 | 22,390 |
| Cooling water (m3/yr) | 58,021 | 29,139 |
| Water for steam (m3/yr) | 1630 | 943 |
| Electric charges (EUR/yr) | 284,731 | 220,303 |
| Steam natural gas (EUR/yr) | 28,951 | 13,434 |
| Cooling water charges (EUR/yr) | 203,073 | 101,986 |
| Water for steam charges (EUR/yr) | 5705 | 3300 |
| Annual utility costs (EUR/yr) | 522,462 | 339,022 |
| Labour costs | ||
| Plant operators per shift | 1 | 1 |
| Labor costs (EUR/h) | 23.25 | 23.25 |
| Annual labour costs (EUR/yr) | 127,875 | 127,875 |
| Facility-related costs | ||
| Estimated plant life (years) | 10 | 10 |
| Maintenance charges (%) | 2 | 3 |
| Administration charges (%) | 2.5 | 2.5 |
| Annual depreciation § (EUR/yr) | 29,086 | 75,067 |
| Maintenance and administration charges (EUR/yr) | 13,088 | 41,287 |
| Facility related costs (EUR/yr) | 42,174 | 116,353 |
| Total annual costs (EUR/yr) | 692,511 | 583,250 |
| Unit pasteurization cost (EUR/L) | 0.042 | 0.035 |
| Impact Category | Acronym | Unit | HTST | PEF |
|---|---|---|---|---|
| Abiotic Depletion | AD | kg Sb eq | 1.02 × 10⁻⁸ | 7.22 × 10⁻⁹ |
| Abiotic Depletion (fossil fuels) | ADf | MJ | 4.83 × 10⁻¹ | 3.02 × 10⁻¹ |
| Global Warming Potential | GWP100a | kg CO2-eq | 3.12 × 10⁻² | 2.16 × 10⁻² |
| Ozone Layer Depletion | ODP | kg CFC-11 eq | 5.54 × 10⁻⁹ | 3.23 × 10⁻⁹ |
| Human Toxicity | HT | kg 1,4-DB eq | 6.54 × 10⁻³ | 4.66 × 10⁻³ |
| Fresh Water Aquatic Ecotox. | FAET | kg 1,4-DB eq | 6.42 × 10⁻³ | 4.60 × 10⁻³ |
| Marine Aquatic Ecotoxicity | MAET | kg 1,4-DB eq | 2.51 × 101 | 1.80 × 101 |
| Terrestrial Ecotoxicity | TET | kg 1,4-DB eq | 3.73 × 10⁻⁵ | 2.65 × 10⁻⁵ |
| Photochemical Oxidation | PO | kg C2H4 eq | 6.61 × 10⁻⁶ | 4.54 × 10⁻⁶ |
| Acidification | AP | kg SO2 eq | 1.64 × 10⁻⁴ | 1.15 × 10⁻⁴ |
| Eutrophication | EP | kg PO43− eq | 4.67 × 10⁻⁵ | 3.34 × 10⁻⁵ |
Disclaimer/Publisher’s Note: The statements, opinions and data contained in all publications are solely those of the individual author(s) and contributor(s) and not of MDPI and/or the editor(s). MDPI and/or the editor(s) disclaim responsibility for any injury to people or property resulting from any ideas, methods, instructions or products referred to in the content. |
© 2025 by the authors. Licensee MDPI, Basel, Switzerland. This article is an open access article distributed under the terms and conditions of the Creative Commons Attribution (CC BY) license (https://creativecommons.org/licenses/by/4.0/).
Share and Cite
Landi, G.; Benedetti, M.; Sforzini, M.; Eslami, E.; Pataro, G. Comparative Analysis of Cost, Energy Efficiency, and Environmental Impact of Pulsed Electric Fields and Conventional Thermal Treatment with Integrated Heat Recovery for Fruit Juice Pasteurization. Foods 2025, 14, 2239. https://doi.org/10.3390/foods14132239
Landi G, Benedetti M, Sforzini M, Eslami E, Pataro G. Comparative Analysis of Cost, Energy Efficiency, and Environmental Impact of Pulsed Electric Fields and Conventional Thermal Treatment with Integrated Heat Recovery for Fruit Juice Pasteurization. Foods. 2025; 14(13):2239. https://doi.org/10.3390/foods14132239
Chicago/Turabian StyleLandi, Giovanni, Miriam Benedetti, Matteo Sforzini, Elham Eslami, and Gianpiero Pataro. 2025. "Comparative Analysis of Cost, Energy Efficiency, and Environmental Impact of Pulsed Electric Fields and Conventional Thermal Treatment with Integrated Heat Recovery for Fruit Juice Pasteurization" Foods 14, no. 13: 2239. https://doi.org/10.3390/foods14132239
APA StyleLandi, G., Benedetti, M., Sforzini, M., Eslami, E., & Pataro, G. (2025). Comparative Analysis of Cost, Energy Efficiency, and Environmental Impact of Pulsed Electric Fields and Conventional Thermal Treatment with Integrated Heat Recovery for Fruit Juice Pasteurization. Foods, 14(13), 2239. https://doi.org/10.3390/foods14132239