
Consumer Preferences for Low-Amylose Rice: A Sensory Evaluation and Best–Worst Scaling Approach


Abstract
1. Introduction
2. Materials and Methods
2.1. Survey
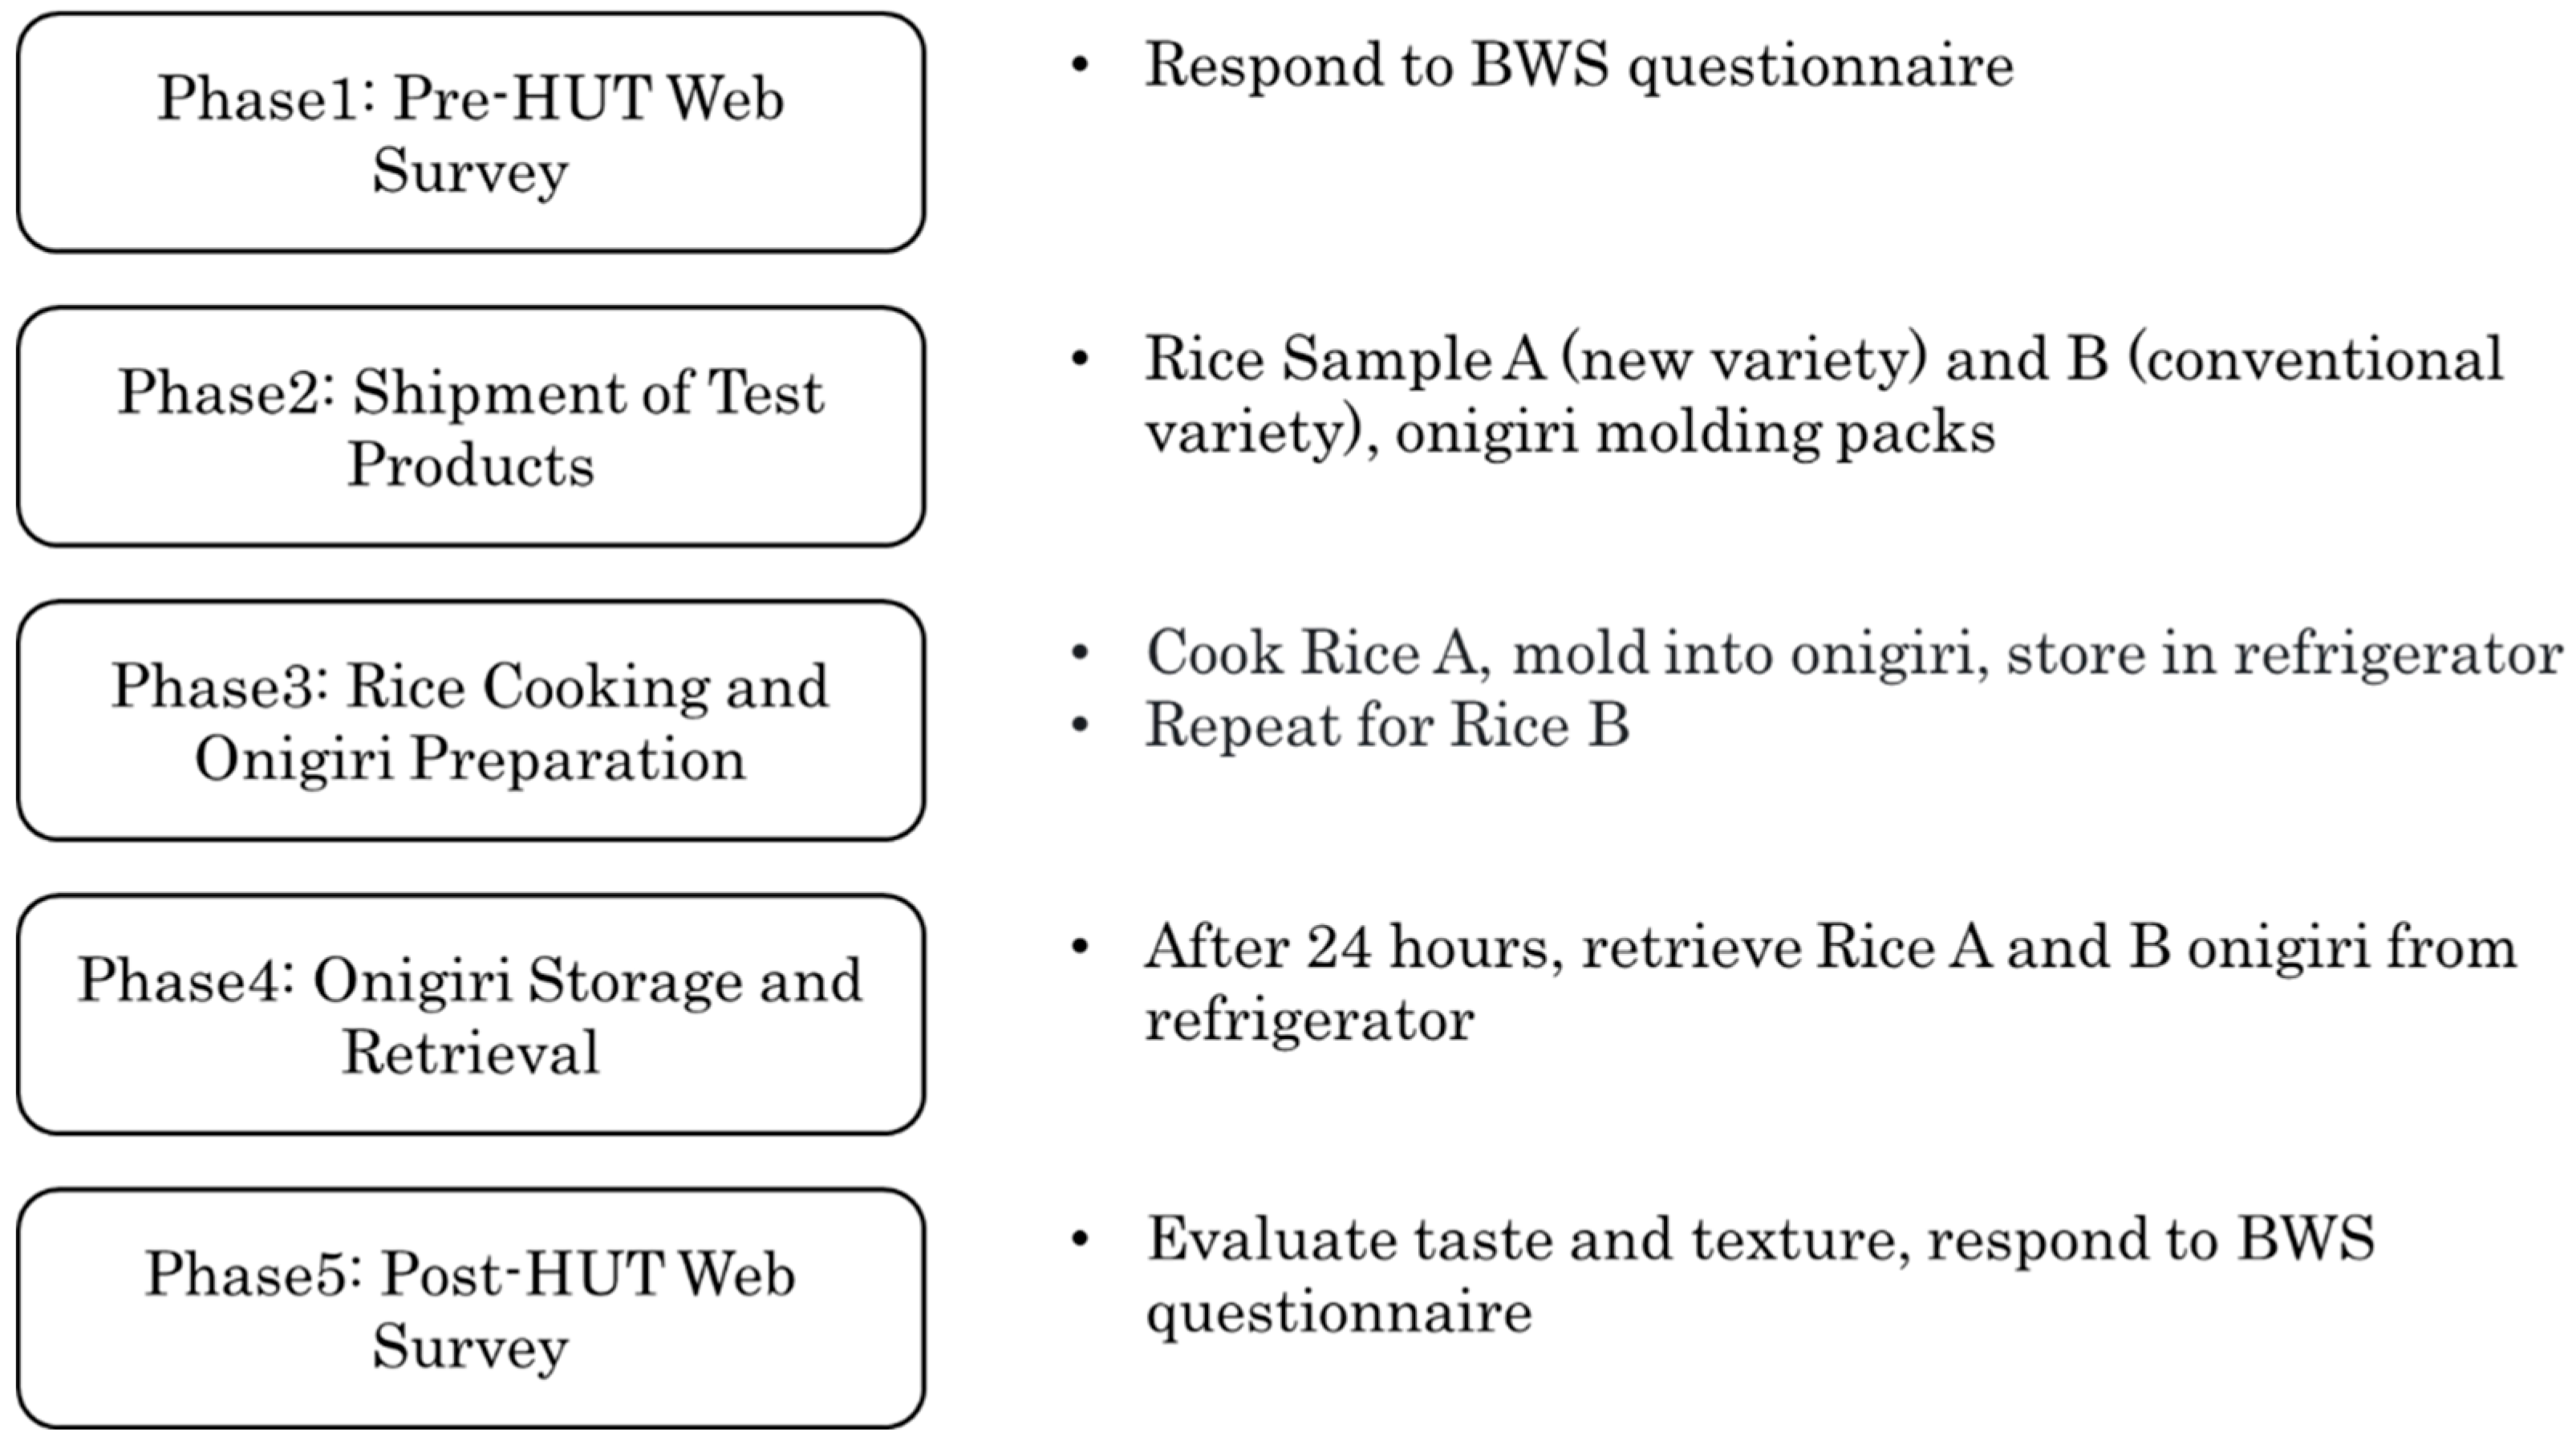
2.2. Sensory Test
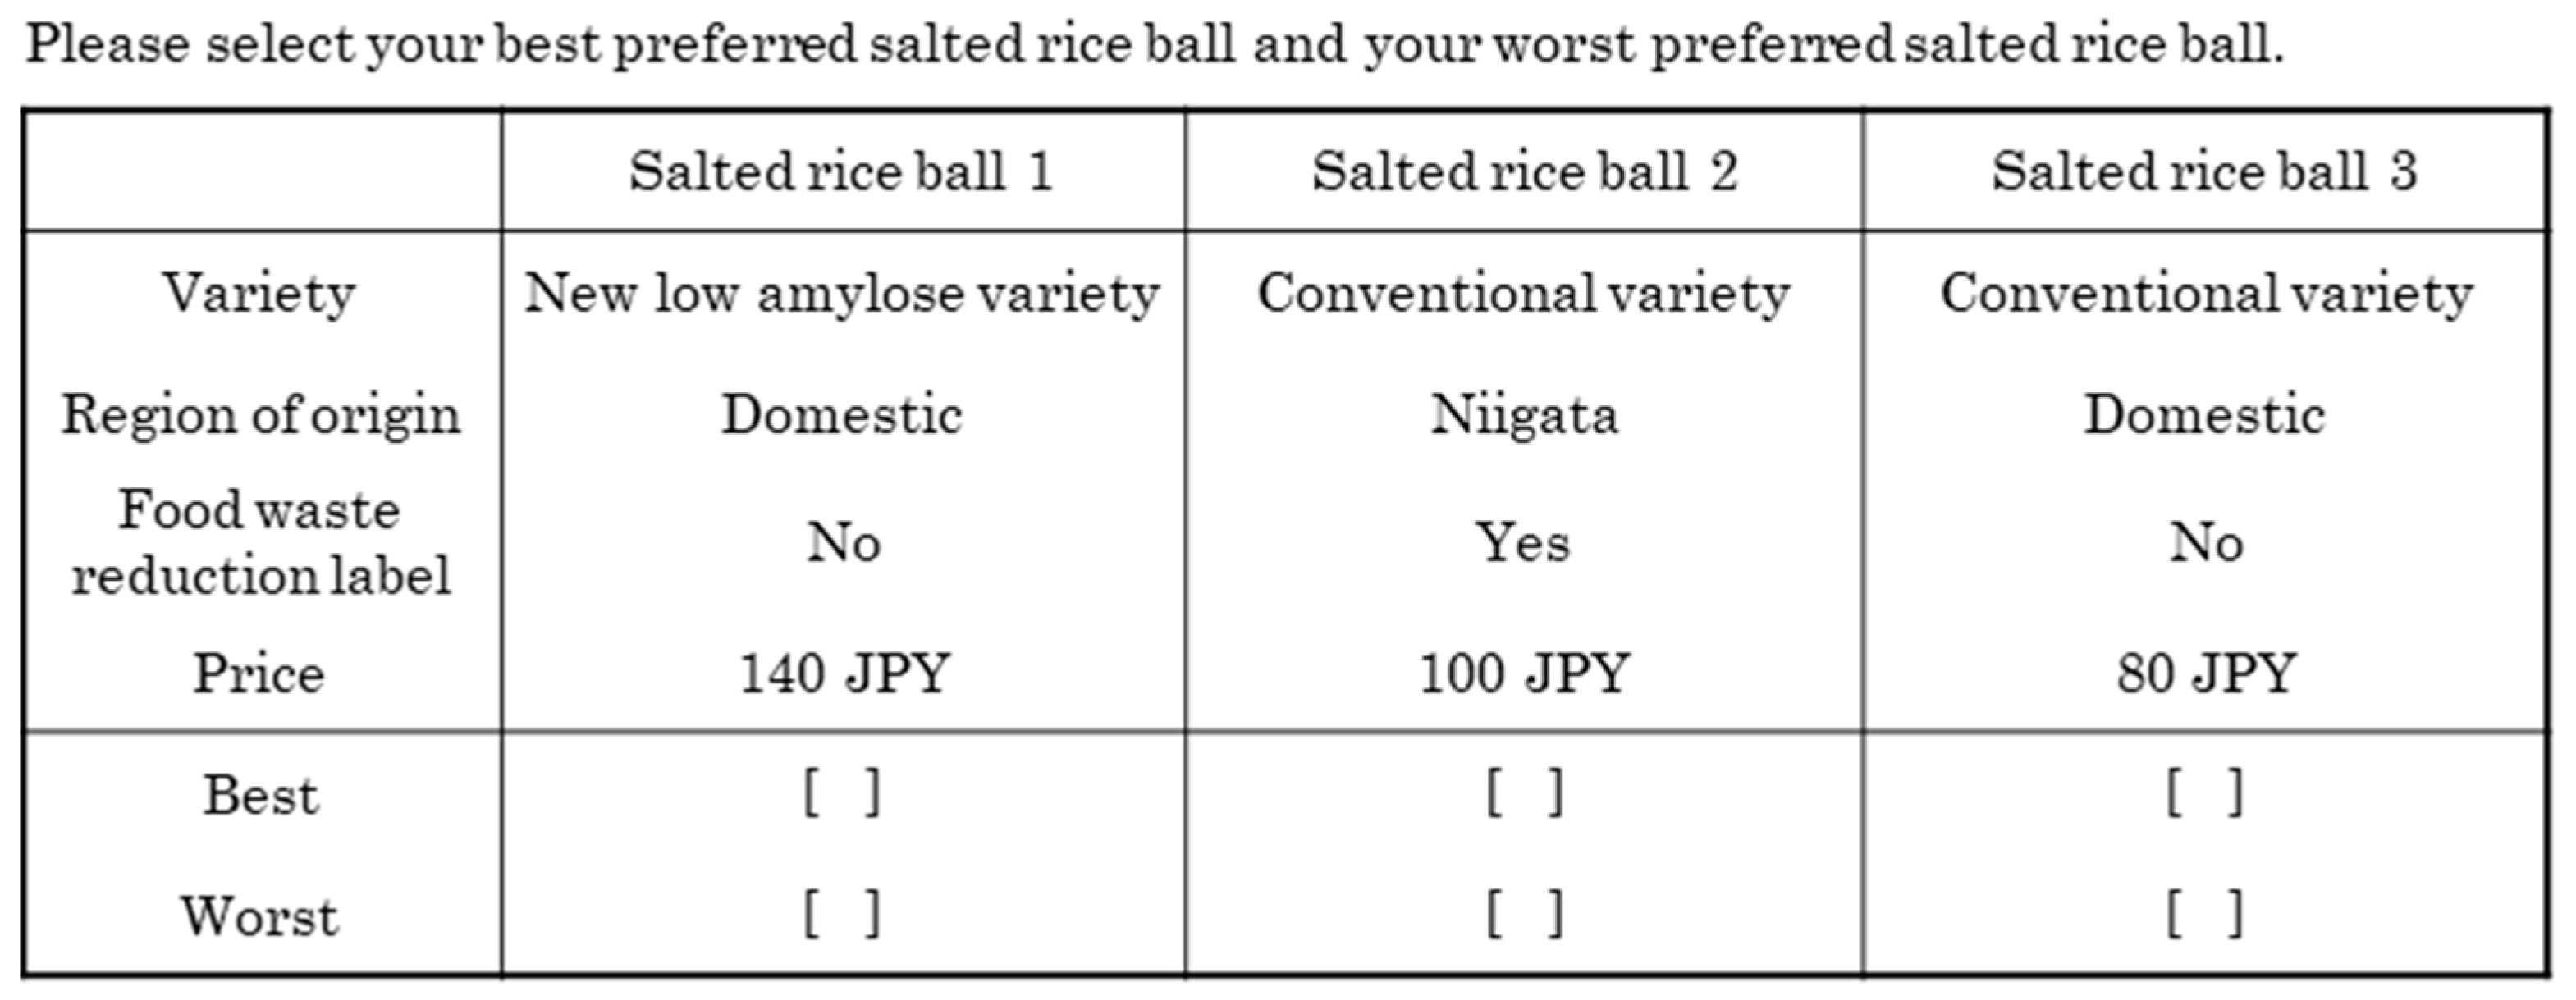
2.3. Profile Design
2.4. Econometric Model
3. Results and Discussion
3.1. Respondents’ Characteristics
3.2. Sensory Evaluation Results
3.3. Estimation Results
4. Conclusions
Author Contributions
Funding
Institutional Review Board Statement
Informed Consent Statement
Data Availability Statement
Conflicts of Interest
References
- Popkin, B.M. Relationship between shifts in food system dynamics and acceleration of the global nutrition transition. Nutr. Rev. 2017, 75, 73–82. [Google Scholar] [CrossRef] [PubMed]
- Vermeulen, S.J.; Park, T.; Khoury, C.K.; Béné, C. Changing diets and the transformation of the global food system. Ann. N. Y. Acad. Sci. 2020, 1478, 3–17. [Google Scholar] [CrossRef] [PubMed]
- Sakai, Y.; Rahayu, Y.Y.S.; Zhao, Y.; Araki, T. Dietary pattern transition and its nutrient intakes and diet quality among Japanese population: Results from the 2003–2019 National Survey. Public Health Nutr. 2024, 27, e231. [Google Scholar] [CrossRef]
- Murakami, K.; Livingstone, M.B.E.; Sasaki, S. Thirteen-year trends in dietary patterns among Japanese adults in the national health and nutrition survey 2003–2015: Continuous westernization of the Japanese diet. Nutrients 2018, 10, 994. [Google Scholar] [CrossRef]
- Ministry of Agriculture Forestry and Fisheries. Food Balance Sheet; Ministry of Agriculture Forestry and Fisheries: Tokyo, Japan, 2025. (In Japanese)
- Ministry of Agriculture Forestry and Fisheries. Statistics on Crop; Ministry of Agriculture Forestry and Fisheries: Tokyo, Japan, 2025. (In Japanese)
- Hasegawa, T.; Sakai, N. Comparing meal satisfaction based on different types of tableware: An experimental study of Japanese cuisine culture. Foods 2021, 10, 1546. [Google Scholar] [CrossRef]
- Mahon, D.; Cowan, C.; McCarthy, M. The role of attitudes, subjective norm, perceived control and habit in the consumption of ready meals and takeaways in Great Britain. Food Qual. Prefer. 2006, 17, 474–481. [Google Scholar] [CrossRef]
- Smith, L.P.; Ng, S.W.; Popkin, B.M. Trends in US home food preparation and consumption: Analysis of national nutrition surveys and time use studies from 1965–1966 to 2007–2008. Nutr. J. 2013, 12, 45. [Google Scholar] [CrossRef] [PubMed]
- Ji, Y.; Han, J. Sustainable home meal replacement (HMR) consumption in Korea: Exploring service strategies using a modified importance–performance analysis. Foods 2022, 11, 889. [Google Scholar] [CrossRef] [PubMed]
- Statistics Bureau. Family Income and Expenditure Survey; Ministry of Internal Affairs and Communications: Tokyo, Japan, 2025. (In Japanese)
- Japan Ready-Made Meal Association. White Paper of Japan Ready-Made Meal Association, 2024 (Digest on-Line Edition); Japan Ready-Made Meal Association: Tokyo, Japan, 2024; Available online: https://www.nsouzai-kyoukai.or.jp/wp-content/uploads/hpb-media/hakusho_2024digest.pdf (accessed on 17 April 2025). (In Japanese)
- Tamura, M. Storage of cooked rice. In Science of Rice Chemistry and Nutrition; Tian, J., Ogawa, Y., Singh, J., Kaur, L., Eds.; Springer: Singapore, 2023; pp. 167–209. [Google Scholar] [CrossRef]
- Nemoto, H.; Ibe, T. Characteristics and uses of new rice (Atarashii Kome no Tokuchou to Riyou). In New Edition Rice Cyclopedia (Shinban Kome No Jiten); Ishitani, T., Ed.; Saiwai Syobou: Tokyo, Japan, 2009; pp. 141–175. [Google Scholar]
- Takami, K.; Koriyama, T.; Ohtsubo, K. Staling Characteristics of cooked low-amylose rice and a proposal of evaluation method. J. Jpn. Soc. Food Sci. Technol. (Nippon Shokuhin Kagaku Kogaku Kaishi) 1998, 45, 469–477. (In Japanese) [Google Scholar] [CrossRef]
- Kodate, T.; Fujioka, T.; Nakajo, S.; Ota, Y.; Okadome, H.; Koide, S. Effects of nitrogen application on the yield and eating quality of the low amylose content rice cultivar Kiraho. Jpn. J. Crop Sci. 2022, 91, 136–146. [Google Scholar] [CrossRef]
- Kim, H.; Kim, O.-W.; Kwak, H.S.; Kim, S.S.; Lee, H.-J. Prediction model of rice eating quality using physicochemical properties and sensory quality evaluation. J. Sens. Stud. 2017, 32, e12273. [Google Scholar] [CrossRef]
- Kwak, H.S.; Kim, M.; Lee, Y.; Jeong, Y. Identification of key sensory attributes for consumer acceptance and instrumental quality of aseptic-packaged cooked rice. Int. J. Food Sci. Technol. 2015, 50, 691–699. [Google Scholar] [CrossRef]
- Suwansri, S.; Meullenet, J.-F.; Hankins, J.A.; Griffin, K. Preference mapping of domestic/imported jasmine rice for U.S.-Asian consumers. J. Food Sci. 2002, 67, 2420–2431. [Google Scholar] [CrossRef]
- Meullenet, J.-F.; Griffin, V.K.; Carson, K.; Davis, G.; Davis, S.; Gross, J.; Hankins, J.A.; Sailer, E.; Sitakalin, C.; Suwansri, S.; et al. Rice external preference mapping for Asian consumers living IN The United States. J. Sens. Stud. 2001, 16, 73–94. [Google Scholar] [CrossRef]
- Ohtsubo, K.; Nakamura, S. Evaluation of palatability of cooked rice. Adv. Int. Rice Res. 2017, 3, 91–110. [Google Scholar] [CrossRef]
- Xin, Z.; Cui, Z.; Cui, J.; Matsue, Y.; Ogata, T.; Kusutani, A. Sensory test for the palatability of Japanese rice cultivars by Chinese and Japanese panels. Jpn. J. Crop Sci. 2015, 84, 176–181. (In Japanese) [Google Scholar] [CrossRef]
- Matsue, Y.; Sato, H.; Ogata, T. Palatability and suitability for blending of low-amylose rice of seven cultivars. Jpn. J. Crop Sci. 2005, 74, 422–426. [Google Scholar] [CrossRef]
- Aoki, K.; Akai, K.; Ujiie, K. A choice experiment to compare preferences for rice in Thailand and Japan: The impact of origin, sustainability, and taste. Food Qual. Prefer. 2017, 56, 274–284. [Google Scholar] [CrossRef]
- Yuan, R.; Jin, S.; Zhou, L.; Chien, H.; Wu, W. Promoting eco-labeled food consumption in China: The role of information. Agribusiness 2025, 41, 401–423. [Google Scholar] [CrossRef]
- Fang, P.; Zhou, Z.; Wang, H.; Zhang, L. Consumer preference and willingness to pay for rice attributes in China: Results of a choice experiment. Foods 2024, 13, 2774. [Google Scholar] [CrossRef]
- Mizuki, A.; Yasue, H. Consumer Evaluation of Rice Balls with Low Amylose rice variety: Application of Best-Worst Scaling. J. Food Agric. Environ. 2024, 34, 19–25. (In Japanese) [Google Scholar]
- Huang, W.-S.; Kuo, H.-Y.; Tung, S.-Y.; Chen, H.-S. Assessing consumer preferences for suboptimal food: Application of a choice experiment in citrus fruit retail. Foods 2020, 10, 15. [Google Scholar] [CrossRef]
- Ornelas Herrera, S.I.; Baba, Y.; Kallas, Z.; Meers, E.; Michels, E.; Hajdu, Z.; Spicnagel, A.M. The role of environmental attitudes and consumption patterns in consumers’ preferences for sustainable food from circular farming system: A six EU case studies. Agric. Food Econ. 2025, 13, 7. [Google Scholar] [CrossRef] [PubMed]
- Iwamoto, H. Effects of eco labeling on food waste reduction through green purchasing. J. Rural. Probl. 2013, 49, 385–390. [Google Scholar] [CrossRef]
- Ray, B.; DeLong, K.L.; Jensen, K.; Burns, S.; Luckett, C. Consumer preferences for foods with varying best if used-by dates: An experimental auction and sensory evaluation analysis. Food Policy 2024, 125, 102650. [Google Scholar] [CrossRef]
- The Food Agency. Sensory Testing Method of Rice (Kome no Syokumishiken] isshi Youryou); Food Agency Report No. 3019; The Food Agency: Tokyo, Japan, 1968.
- Cohen, J. Statistical Power Analysis for the Behavioral Sciences; Routledge: New York, NY, USA, 2013. [Google Scholar] [CrossRef]
- Louviere, J.J.; Flynn, T.N.; Marley, A.A.J. Best-Worst Scaling: Theory, Methods and Applications; Cambridge University Press: London, UK, 2015; pp. 5–11. [Google Scholar] [CrossRef]
- Marley, A.A.J.; Louviere, J.J. Some probabilistic models of best, worst, and best–worst choices. J. Math. Psychol. 2005, 49, 464–480. [Google Scholar] [CrossRef]
- Calingacion, M.; Laborte, A.; Nelson, A.; Resurreccion, A.; Concepcion, J.C.; Daygon, V.D.; Mumm, R.; Reinke, R.; Dipti, S.; Bassinello, P.Z.; et al. Diversity of global rice markets and the science required for consumer-targeted rice breeding. PLoS ONE 2014, 9, e85106. [Google Scholar] [CrossRef]
- Krinsky, I.; Robb, A.L. On approximating the statistical properties of elasticities. Rev. Econ. Stat. 1986, 68, 715–719. [Google Scholar] [CrossRef]
- Nelson, P. Information and consumer behavior. J. Pol. Econ. 1970, 78, 311–329. [Google Scholar] [CrossRef]
- Zapata, S.D.; Villavicencio, X.A.; Marconi, T.G.; Avila, C.A. Using sensory analysis and stated preference valuation to assess the willingness to pay for fresh tomato attributes. Agribusiness 2024. [Google Scholar] [CrossRef]
- Zhu, Y.; Shen, M.; Sims, C.A.; Marshall, M.R.; House, L.A.; Sarnoski, P.J. Consumer preference and willingness to pay for tomato juice. Int. Food Agribus. Manag. Rev. 2018, 21, 1167–1184. [Google Scholar] [CrossRef]
- Lusk, J.L.; Nilsson, T.; Foster, K. Public preferences and private choices: Effect of altruism and free riding on demand for environmentally certified pork. Environ. Resour. Econ. 2007, 36, 499–521. [Google Scholar] [CrossRef]

| Attribute | Level |
|---|---|
| Variety | New low-amylose variety, conventional variety |
| Region of origin | Niigata, domestic |
| Food waste reduction label (yes: attached) | Yes, no |
| Price | JPY 80, JPY 100, JPY 120, JPY 140 |
| % | |
|---|---|
| Sex | |
| Male | 49.2 |
| Female | 50.8 |
| Age (years) | |
| 20–29 | 18.6 |
| 30–39 | 20.3 |
| 40–49 | 20.3 |
| 50–59 | 20.3 |
| 60–69 | 20.3 |
| Employment | |
| Office workers | 44.1 |
| Part-time workers | 18.6 |
| Housewives | 27.1 |
| Students | 5.1 |
| Others | 5.1 |
| Household income (million JPY per year) | |
| Less than 3 | 5.1 |
| 3–6 | 23.7 |
| 6–9 | 18.6 |
| 9–12 | 27.1 |
| Over 12 | 8.5 |
| No response | 16.9 |
| Family members living together (multiple responses) | |
| Partners | 74.6 |
| Children under 18 years | 32.2 |
| Children over 18 years | 18.6 |
| Parents of brothers | 17.0 |
| No family members | 10.2 |
| Rice Balls | Salted Rice Balls | |
|---|---|---|
| Three times or more per week | 15.3 | 8.5 |
| Once or twice per week | 33.9 | 11.9 |
| Two or three times per month | 49.2 | 23.7 |
| Less than once per month | 1.7 | 55.9 |
| Do not purchase | 0.0 | 0.0 |
| Mean | Standard Deviation | |
|---|---|---|
| Appearance | 2.17 | 1.29 |
| Aroma | 3.10 | 1.21 |
| Taste | 4.75 | 0.54 |
| Hardness | 2.98 | 1.01 |
| Stickiness | 2.00 | 0.95 |
| Means | p-Value | ||
|---|---|---|---|
| Non-Glutinous Rice Koshihikari | Low Amylose-Rice Iwate 144 | ||
| Appearance | 3.31 | 3.68 | 0.007 |
| Aroma | 3.34 | 3.80 | 0.002 |
| Taste | 3.37 | 3.86 | 0.000 |
| Hardness | 3.47 | 3.83 | 0.018 |
| Stickiness | 3.36 | 3.93 | 0.000 |
| Overall Evaluation | 3.37 | 3.97 | 0.000 |
| Before Tasting | After Tasting | |||||
|---|---|---|---|---|---|---|
| Variables | Coefficient | Standard Error | z-Value | Coefficient | Standard Error | z-Value |
| New variety | 0.125 * | 0.067 | 1.870 | 0.475 *** | 1.608 | 6.839 |
| Niigata | 0.439 *** | 0.068 | 6.457 | 0.204 *** | 1.227 | 2.973 |
| Food waste | 0.338 *** | 0.067 | 5.020 | 0.222 *** | 1.248 | 3.235 |
| Price | −0.023 *** | 0.002 | −13.697 | −0.025 *** | 0.976 | −14.354 |
| Respondents | 59 | 59 | ||||
| Observations | 472 | 472 | ||||
| Log likelihood at zero | −845.71 | −845.71 | ||||
| Log likelihood at convergence | −695.52 | −675.89 | ||||
| Adjusted pseudo R2 | 0.173 | 0.196 | ||||
| Before Tasting | After Tasting | Change | |||
|---|---|---|---|---|---|
| New variety | 5.86 | [−0.31, 12.24] | 19.30 | [13.80, 25.16] | 13.44 |
| Niigata | 19.93 | [13.66, 26.77] | 8.30 | [2.84, 13.95] | −11.63 |
| Food Waste | 15.43 | [9.42, 22.10] | 9.01 | [3.59, 14.80] | −6.42 |
| Before Tasting | After Tasting | After Tasting | |||||||
|---|---|---|---|---|---|---|---|---|---|
| Variables | Coefficient | Standard Error | z-Value | Coefficient | S.E. | z-Value | Coefficient | Standard Error | z-Value |
| Main Effect | |||||||||
| New variety | 0.451 ** | 0.210 | 0.032 | 0.951 *** | 0.220 | 0.000 | 0.633 ** | 0.253 | 0.012 |
| Niigata | −0.241 | 0.210 | 0.252 | 0.113 | 0.219 | 0.607 | 0.108 | 0.220 | 0.623 |
| Food waste | 0.616 *** | 0.211 | 0.004 | 0.410 * | 0.219 | 0.062 | 0.416 * | 0.220 | 0.058 |
| Price | −0.023 *** | 0.002 | 0.000 | −0.025 *** | 0.002 | 0.000 | −0.026 *** | 0.002 | 0.000 |
| Cross Effect | |||||||||
| New variety × female | −0.027 | 0.148 | 0.853 | 0.055 | 0.153 | 0.718 | 0.023 | 0.159 | 0.885 |
| Niigata × female | 0.464 *** | 0.149 | 0.001 | 0.145 | 0.153 | 0.343 | 0.157 | 0.157 | 0.316 |
| Food waste × female | −0.092 | 0.149 | 0.538 | 0.097 | 0.153 | 0.525 | 0.106 | 0.157 | 0.498 |
| New variety × fsrb | −0.099 | 0.080 | 0.221 | −0.022 *** | 0.082 | 0.005 | −0.148* | 0.089 | 0.096 |
| Niigata × fsrb | 0.157* | 0.080 | 0.051 | 0.061 | 0.081 | 0.452 | 0.070 | 0.085 | 0.405 |
| Food waste × fsrb | −0.031 | 0.081 | 0.704 | −0.058 | 0.082 | 0.475 | −0.058 | 0.085 | 0.491 |
| New variety × 20s | −0.066 | 0.178 | 0.712 | −0.509 *** | 0.181 | 0.005 | −0.279 | 0.195 | 0.151 |
| Niigata × 20s | −0.111 | 0.177 | 0.531 | 0.062 | 0.179 | 0.726 | 0.063 | 0.183 | 0.730 |
| Food waste × 20s | −0.310* | 0.178 | 0.083 | −0.133 | 0.181 | 0.462 | −0.143 | 0.184 | 0.436 |
| New variety × child | 0.141 | 0.156 | 0.370 | 0.393 ** | 0.163 | 0.016 | 0.383 ** | 0.177 | 0.030 |
| Niigata × child | −0.090 | 0.156 | 0.565 | −0.069 | 0.163 | 0.669 | −0.076 | 0.165 | 0.642 |
| Food waste × child | −0.198 | 0.157 | 0.206 | −0.244 | 0.163 | 0.134 | −0.256 | 0.166 | 0.122 |
| New variety × taste | −0.212 | 0.174 | 0.223 | −0.146 | 0.183 | 0.424 | −0.163 | 0.194 | 0.401 |
| Niigata × taste | 0.288* | 0.174 | 0.098 | −0.085 | 0.183 | 0.640 | −0.095 | 0.187 | 0.608 |
| Food waste × taste | −0.056 | 0.174 | 0.746 | −0.018 | 0.183 | 0.921 | −0.009 | 0.186 | 0.957 |
| New variety × appearance | 0.300 *** | 0.084 | 0.000 | ||||||
| New variety × aroma | −0.096 | 0.095 | 0.312 | ||||||
| New variety × taste | 0.048 | 0.093 | 0.601 | ||||||
| New variety × hardness | 0.012 | 0.085 | 0.884 | ||||||
| New variety × stickiness | 0.167* | 0.091 | 0.067 | ||||||
| Respondents | 59 | 59 | 59 | ||||||
| Observations | 472 | 472 | 472 | ||||||
| Log likelihood at zero | −845.711 | −845.711 | −845.711 | ||||||
| Log likelihood at convergence | −680.068 | −657.692 | −646.081 | ||||||
| Adjusted pseudo R2 | 0.169 | 0.199 | 0.207 | ||||||
Disclaimer/Publisher’s Note: The statements, opinions and data contained in all publications are solely those of the individual author(s) and contributor(s) and not of MDPI and/or the editor(s). MDPI and/or the editor(s) disclaim responsibility for any injury to people or property resulting from any ideas, methods, instructions or products referred to in the content. |
© 2025 by the authors. Licensee MDPI, Basel, Switzerland. This article is an open access article distributed under the terms and conditions of the Creative Commons Attribution (CC BY) license (https://creativecommons.org/licenses/by/4.0/).
Share and Cite
Mizuki, A.; Yasue, H. Consumer Preferences for Low-Amylose Rice: A Sensory Evaluation and Best–Worst Scaling Approach. Foods 2025, 14, 2128. https://doi.org/10.3390/foods14122128
Mizuki A, Yasue H. Consumer Preferences for Low-Amylose Rice: A Sensory Evaluation and Best–Worst Scaling Approach. Foods. 2025; 14(12):2128. https://doi.org/10.3390/foods14122128
Chicago/Turabian StyleMizuki, Asato, and Hiroyuki Yasue. 2025. "Consumer Preferences for Low-Amylose Rice: A Sensory Evaluation and Best–Worst Scaling Approach" Foods 14, no. 12: 2128. https://doi.org/10.3390/foods14122128
APA StyleMizuki, A., & Yasue, H. (2025). Consumer Preferences for Low-Amylose Rice: A Sensory Evaluation and Best–Worst Scaling Approach. Foods, 14(12), 2128. https://doi.org/10.3390/foods14122128