Article

Effective Identification of Variety and Origin of Chenpi Using Hyperspectral Imaging Assisted with Chemometric Models

1
State Key Laboratory for Quality Ensurance and Sustainable Use of Dao-di Herbs, National Resource Center for Chinese Materia Medica, China Academy of Chinese Medical Sciences, Beijing 100700, China
2
Jiangxi Province Key Laboratory of Sustainable Utilization of Traditional Chinese Medicine Resources, Institute of Traditional Chinese Medicine Health Industry, China Academy of Chinese Medical Sciences, Nanchang 330115, China
3
Dexing Research and Training Center of Chinese Medical Sciences, China Academy of Chinese Medical Sciences, Dexing 334213, China
4
Jiangxi Health Industry Institute of Traditional Chinese Medicine, Nanchang 330115, China
5
Research Center for Quality Evaluation of Dao-di Herbs, Ganjiang New District, Nanchang 330000, China
6
Fruit Research Institute, Fujian Academy of Agricultural Sciences, Fuzhou 350013, China
*
Authors to whom correspondence should be addressed.
These authors contributed equally to this work.
Foods 2025, 14(11), 1979; https://doi.org/10.3390/foods14111979
Submission received: 22 March 2025 / Revised: 20 May 2025 / Accepted: 28 May 2025 / Published: 3 June 2025
(This article belongs to the Section Food Analytical Methods)

Abstract

Geographical origins and varietal characteristics can significantly affect the quality of Citri Reticulatae Pericarpium (Chenpi), making rapid and accurate identification essential for consumer protection. To overcome the inefficiency and high cost of conventional detection methods, this study proposed a nondestructive approach that integrates hyperspectral imaging (HSI) with deep learning to classify Chenpi varieties and their geographical origins. Hyperspectral data were collected from 15 Chenpi varieties (citrus peel) across 13 major production regions in China using three dataset configurations: exocarp-facing-upward (Z), endocarp-facing-upward (F), and a fused dataset combining random orientations (ZF). Convolutional neural networks (CNNs) were developed and compared with conventional machine learning models, including partial least-squares discriminant analysis (PLS-DA), support vector machines (SVMs), and a multilayer perceptron (MLP). The CNN model achieved 96.39% accuracy for varietal classification with the ZF dataset, while the Z-PLSDA model optimized with second derivative (D2) preprocessing and competitive adaptive reweighted sampling (CARS) feature selection attained 91.67% accuracy in geographical origin discrimination. Feature wavelength selection strategies, such as CARS, simplified the model complexity while maintaining a classification performance comparable to that of the full-spectrum models. These findings demonstrated that HSI combined with deep learning could provide a rapid, nondestructive, and cost-effective solution for Chenpi quality assessment and origin traceability.

1. Introduction

Citrus fruits, including oranges, grapefruits, lemons, limes, tangerines, and mandarins, are among the most widely cultivated and consumed fruit crops globally [1], and they are valued for both their nutritional benefits and extensive industrial applications. Although a significant portion is consumed fresh, citrus processing generates substantial waste, primarily peels, seeds, and pulp, which serve as valuable raw materials for high-value industries such as essential oil extraction, citric acid production, and biofuel generation. Notably, residues account for nearly 50% of the processed fruit mass, with peels comprising the majority [2,3]. Citrus peels contain bioactive compounds, including polyphenols, flavonoids, essential oils, and dietary fibers, with significant applications in nutraceuticals, functional foods, and pharmaceuticals [4]. Therefore, efficient utilization of these discarded peels is crucial. In China, citrus fruits are highly valued in conventional Chinese medicine (TCM), contributing to well-known medicinal herbs, such as Chenpi, Foshou, Xiangyuan, and Zhiqiao [5,6]. Among these, Chenpi serves as the dried peel of mature Citrus reticulata Blanco (mandarin), which is listed in pharmacopoeias worldwide [7,8]. As the globally largest producer of mandarins, China produced 23.12 million tonnes in 2020, accounting for approximately 60% of the global production [9]. Transforming discarded citrus peels into Chenpi not only mitigates industrial waste but also enhances the supply of this highly valued dual-purpose TCM, which is widely used in both medicinal and culinary applications [10]. The rising market value of Chenpi continues to drive economic growth in this sector [11].
Despite the high value of Chenpi, the market faces several significant challenges, primarily due to the extensive diversity of mandarin varieties, which complicate unified and standardized processing. Several mandarin varieties, including C. reticulata ‘Chachi’, C. reticulata ‘Unshiu’, C. reticulata ‘Dahongpao’, and C. reticulata ‘Tangerina’, are officially listed in the Chinese Pharmacopoeia [7], while hundreds of other varieties, such as C. reticulata ‘Zhuhong’, C. reticulata ‘Ponkan’, and C. reticulata ‘Suavissima’, are also used for Chenpi production [12]. These varieties exhibit substantial differences in their active constituents and concentrations. For instance, C. reticulata ‘Dahongpao’ contains the significantly higher flavonoid levels compared to Citrus grandis Tomentosa, Citrus ichangensis Swingle, Citrus sinensis (L.) Osbeck, and C. reticulata ‘Buzhihuo’ [13], while C. reticulata ‘Chachi’ is particularly rich in terpenoids [14]. Such variations in bioactive compounds and flavor profiles pose considerable challenges for quality control in Chenpi, highlighting the need for rapid identification techniques to distinguish between these varieties and improve quality management and industrial efficiency. Furthermore, the composition and concentration of TCM are heavily influenced by geographical origin, with significant variations observed even within the same cultivar [15,16]. Major Chenpi production regions in China include Guangdong, Jiangxi, Sichuan, Fujian, and Zhejiang, with Guangdong accounting for 70% of the total Chenpi production, of which 90% originates from Xinhui [17]. Xinhui Chenpi derived from C. reticulata ‘Chachi’ grown in Xinhui County is widely regarded as the highest quality due to its protected geographical indication (PGI) status and the superior nutrient content [18,19]. In recent years, its commercial value has surged, which can be driven by the rising popularity of tea-related products such as “Xiao-Qing-Gan” and “Gan-Pu” tea, leading to the significant price disparities in the market [20] and contributing to an industry valued at 19 billion CNY (US$2.66 billion) in 2022 [21]. However, as the price of Xinhui Chenpi continues to rise, counterfeit products made from non-Xinhui mandarin varieties have flooded the herbal market, which can be falsely marketed as authentic Xinhui Chenpi. Consequently, accurately identifying both the origin and variety of Chenpi has become a critical challenge in ensuring product authenticity and maintaining market stability.
In the current Chenpi market, conventional detection methods rely primarily on sensory evaluation, physical analysis, and chemical testing [22]. However, the accuracy of sensory and physical assessments is often compromised [21] because of the striking similarities in mandarin peel appearance and the vast number of species, making precise identification of origin and variety highly challenging. Chemical analysis techniques, such as high-performance liquid chromatography (HPLC) [23], gas chromatography (GC) [9], and liquid chromatography–tandem mass spectrometry (LC-MS/MS) [24], allow precise differentiation by detecting the key constituents and volatile compounds in Chenpi [25]. However, these methods are inefficient, destructive, and time-consuming, and they require advanced technical expertise, rendering them impractical for onsite market screening. DNA barcoding technology has also been widely applied in herbal medicine authentication. However, conventional DNA barcoding techniques may be inadequate for Chenpi, which has an exceptionally long storage duration. DNA degradation over time can impair the polymerase chain reaction (PCR) efficiency, limiting its applicability [26]. Given these challenges, the development of rapid and accurate identification techniques to determine the origin and variety of Chenpi is essential to ensure quality control and authenticity verification.
Hyperspectral imaging (HSI) technology is widely used for food quality detection owing to its low cost, simple preprocessing, and ability to rapidly collect data from multiple samples [27]. When combined with conventional machine learning algorithms such as SVM and PLSR/PLSDA, HSI has been successfully applied to predict the chemical composition and origin of agricultural products [28,29]. However, conventional algorithms struggle to process large-scale data and typically rely on manual feature extraction [30,31]. In contrast, deep learning methods such as CNN and LSTM offer significant advantages in self-learning and efficiently handling large datasets [32,33], while integrating attention mechanisms (AMs) can further enhance prediction accuracy and efficiency [30,34]. Despite these advancements, no study has explored the combination of HSI and deep learning for predicting the origin and variety of Chenpi.
This study aimed to integrate deep learning with HSI technology, incorporating characteristic band selection and machine vision techniques to enhance the identification of the origin and variety of Chenpi. The primary research objectives were as follows: (1) to construct a comprehensive hyperspectral imaging database containing Chenpi samples from various origins and varieties; (2) to compare the predictive performance of different machine learning models and develop a hybrid deep learning model for predicting both geographic origin and variety; and (3) to develop and evaluate models specifically designed to predict the geographic origin and variety of Chenpi, with a particular focus on the same variety grown in different regions, especially those cultivated in PGI regions of China in order to assess the impact of geographic variability on prediction accuracy.

2. Materials and Methods

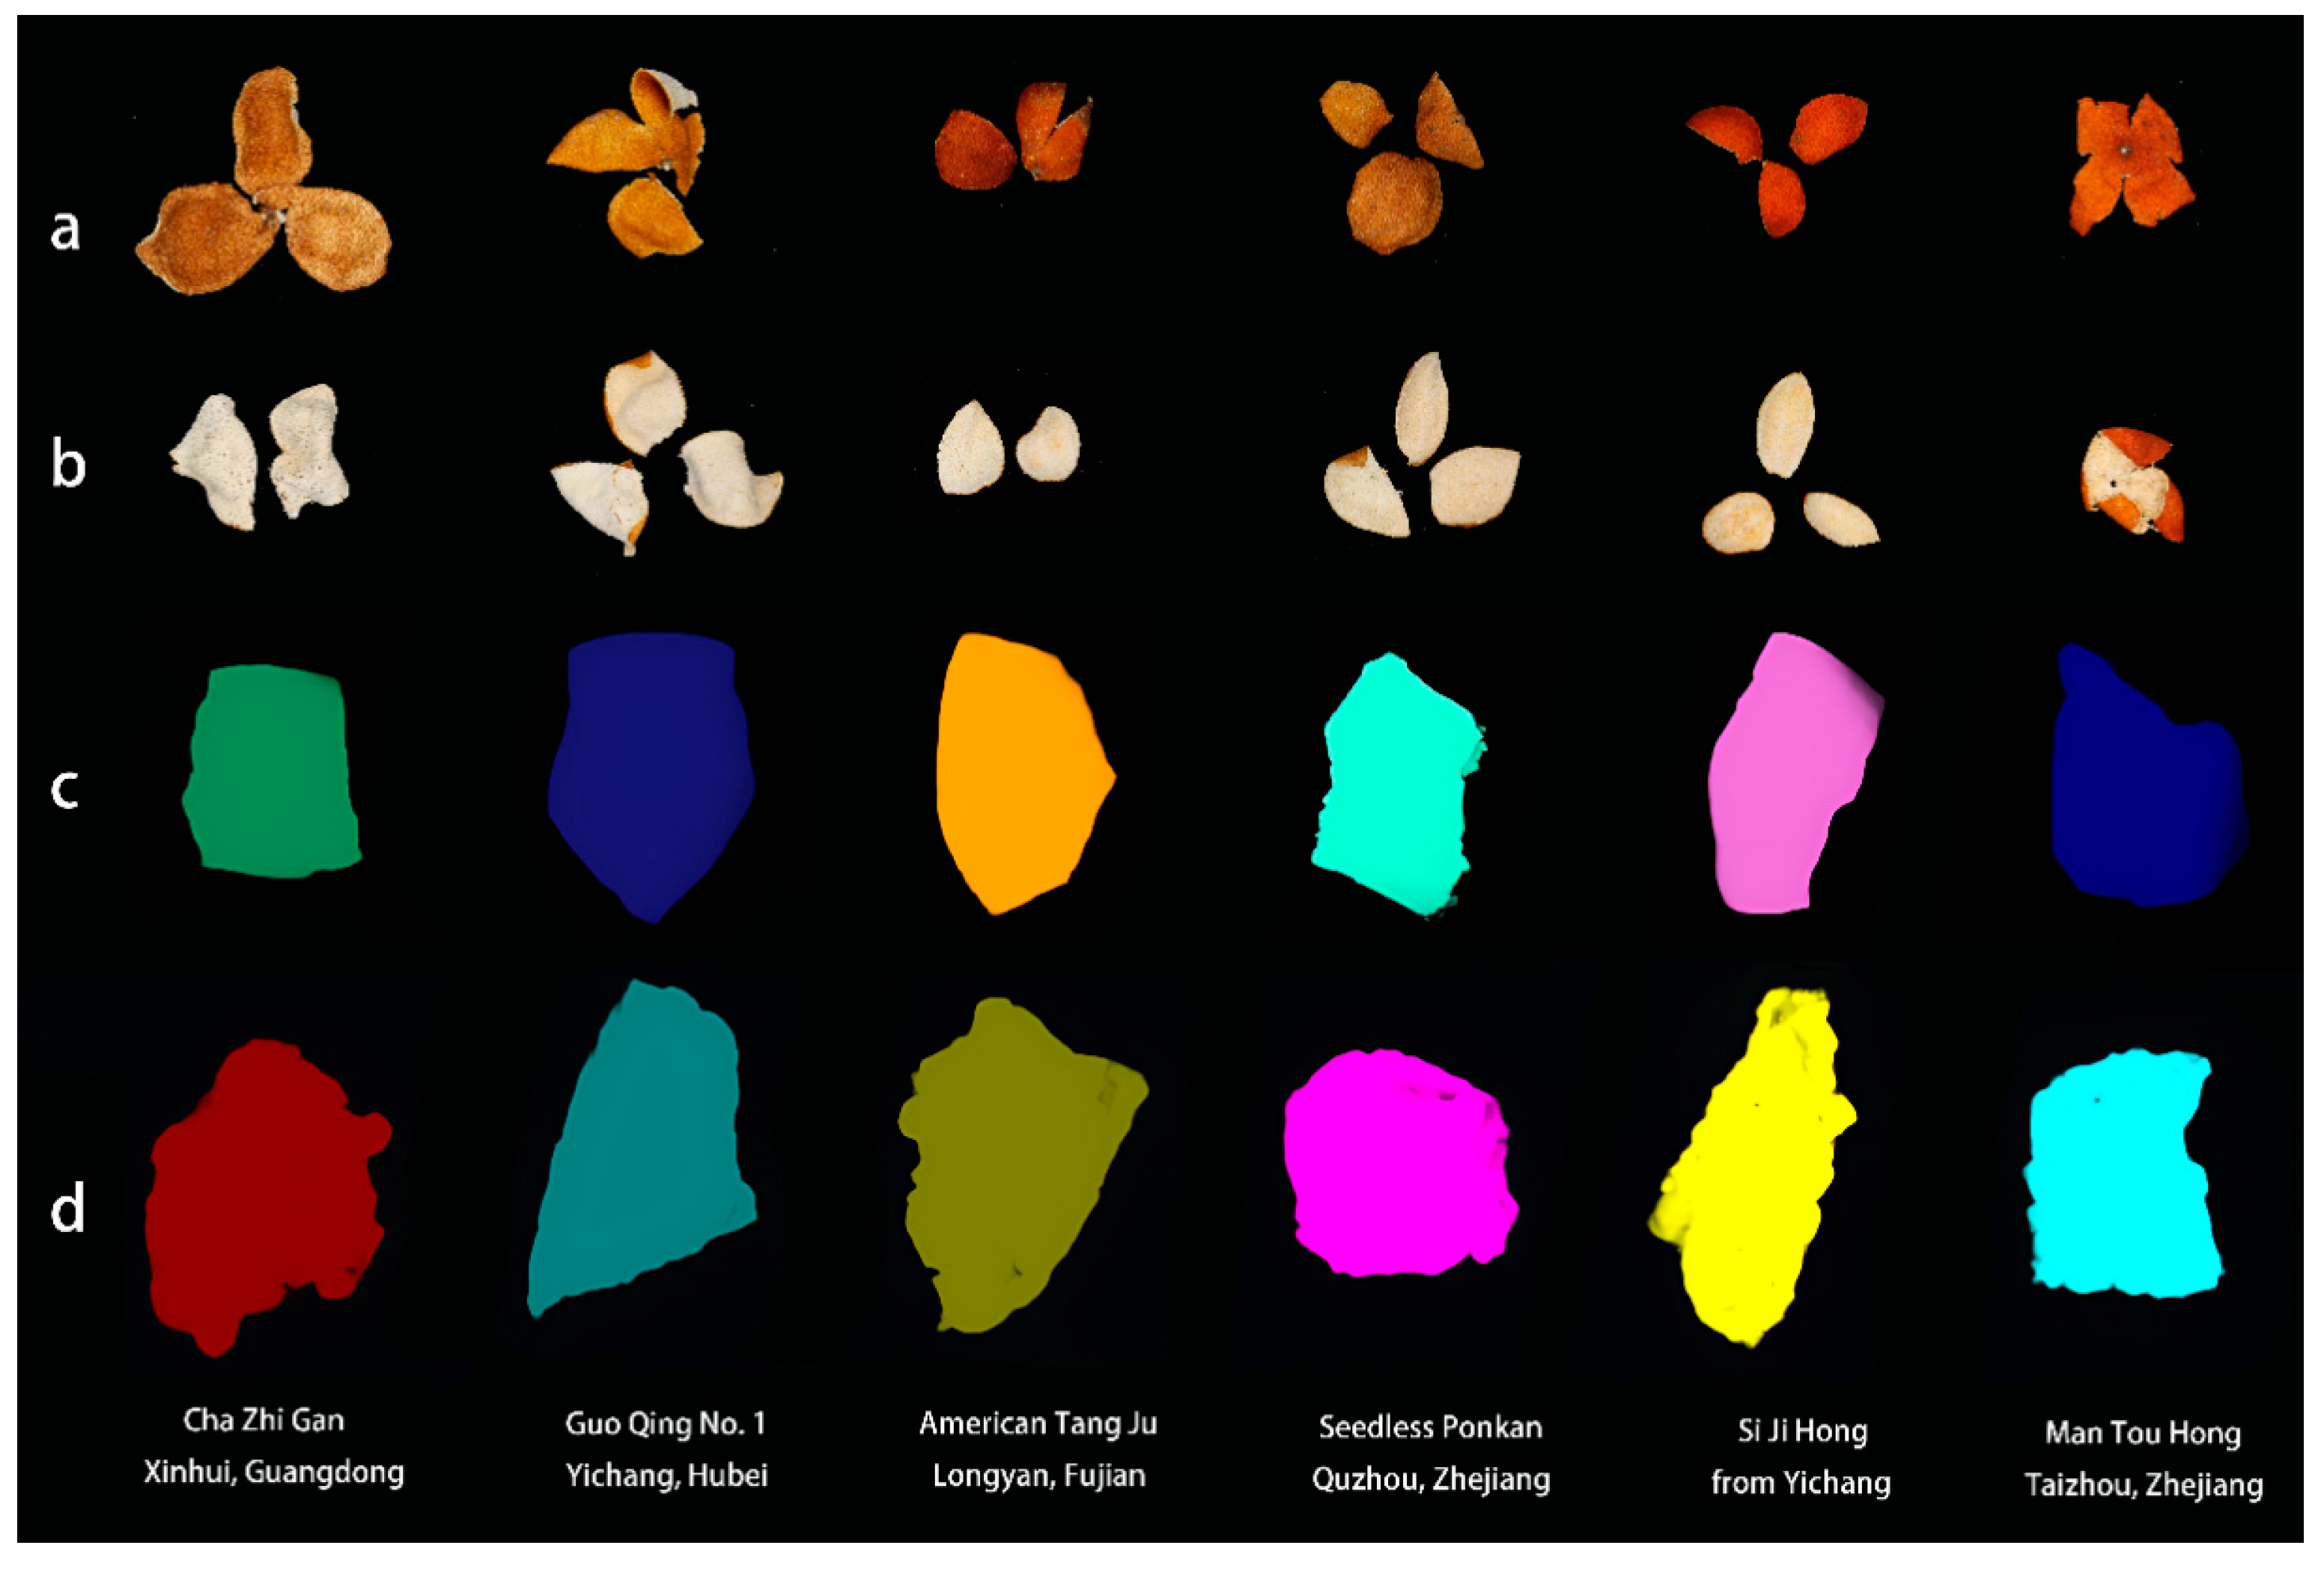
2.1. Sample Collection and Pretreatment

Mature mandarin fruits were harvested between September and December 2024 from eight provinces and 13 major production regions across China. Within each region, multiple sites were selected for subsample collection, resulting in 19 batches of mandarin fruit samples, with each batch comprising 60 individual fruits.
Following harvest, the fruit peels were naturally dried within the same year to produce Chenpi. The variety and geographical origin information of Chenpi are presented in Table 1. The sample set included 15 distinct Chenpi varieties collected from 13 geographical locations. The images of the exocarp and endocarp of some Chenpi variety samples are shown in Figure 1.

2.2. Hyperspectral Image Acquisition

Data were acquired using a HySpex-series hyperspectral imaging spectrometer (Norsk Elektro Optikk A/S, Oslo, Norway). The system comprised two imaging modules covering the visible-near-infrared (VNIR, SN0605; 410–990 nm) and short-wave infrared (SWIR, N3124; 950–2500 nm) spectral ranges, a halogen tungsten illumination source (H-LAM; Norsk Elektro Optikk, Oslo, Norway), a conveyor belt for sample transportation, and a computer for data acquisition. Operating with a spectral resolution of 6 nm, the system maintained a 25 cm working distance between the lens and samples, with the platform moving at a constant speed of 1.5 mm/s during the linear scanning. A small sample piece (approximately 15 × 25 mm) was extracted from each fruit for hyperspectral scanning on both the front and back surfaces, generating 2280 spectral datasets (19 batches × 60 fruit peels per batch × 2 scans per peel).
To reduce noise interference from dark currents and non-uniform illumination during HSI acquisition, the raw hyperspectral data underwent black-and-white reference calibration before further analysis [35]. This correction was applied using the following mathematical approach.
R = R r R d R w R d × 100 %
where R denotes the corrected spectral data, Rr represents the raw spectral data, Rd denotes the dark reference data (obtained by turning off the illumination source and covering the camera lens to eliminate ambient light interference), and Rw represents the white reference data acquired from the spectrally flat calibration panel with the reflectance.
The spectral reflectance of individual Chenpi samples was extracted using thresholding and watershed segmentation methods. Specifically, the thresholding segmentation strategy is based on grayscale separation, where a threshold value of 0.2 is set to effectively distinguish and separate the Chenpi sample image from the background on the moving stage. According to the object size of Chenpi sample (with pixel size of VNIR for 1785–2973 and of SWIR for 31,076–39,745), the watershed algorithm is applied to achieve efficient segmentation between the whiteboard and the Chenpi sample. Also, the ROIs for representative samples of each orientation (F and Z) was added in the Figure 1c,d.

2.3. Spectral Preprocessing Methods

During hyperspectral imaging acquisition, the spectral data may contain extraneous information owing to noise, stray light, and baseline drift, which can negatively affect model performance. To enhance predictive accuracy and model stability, appropriate preprocessing of raw spectral data is typically required before modeling. In this study, five spectral preprocessing methods were applied and compared for their effects on classification performance: multiplicative scatter correction (MSC), first derivative (D1), second derivative (D2), Savitzky–Golay smoothing (SG), and standard normal variate (SNV).

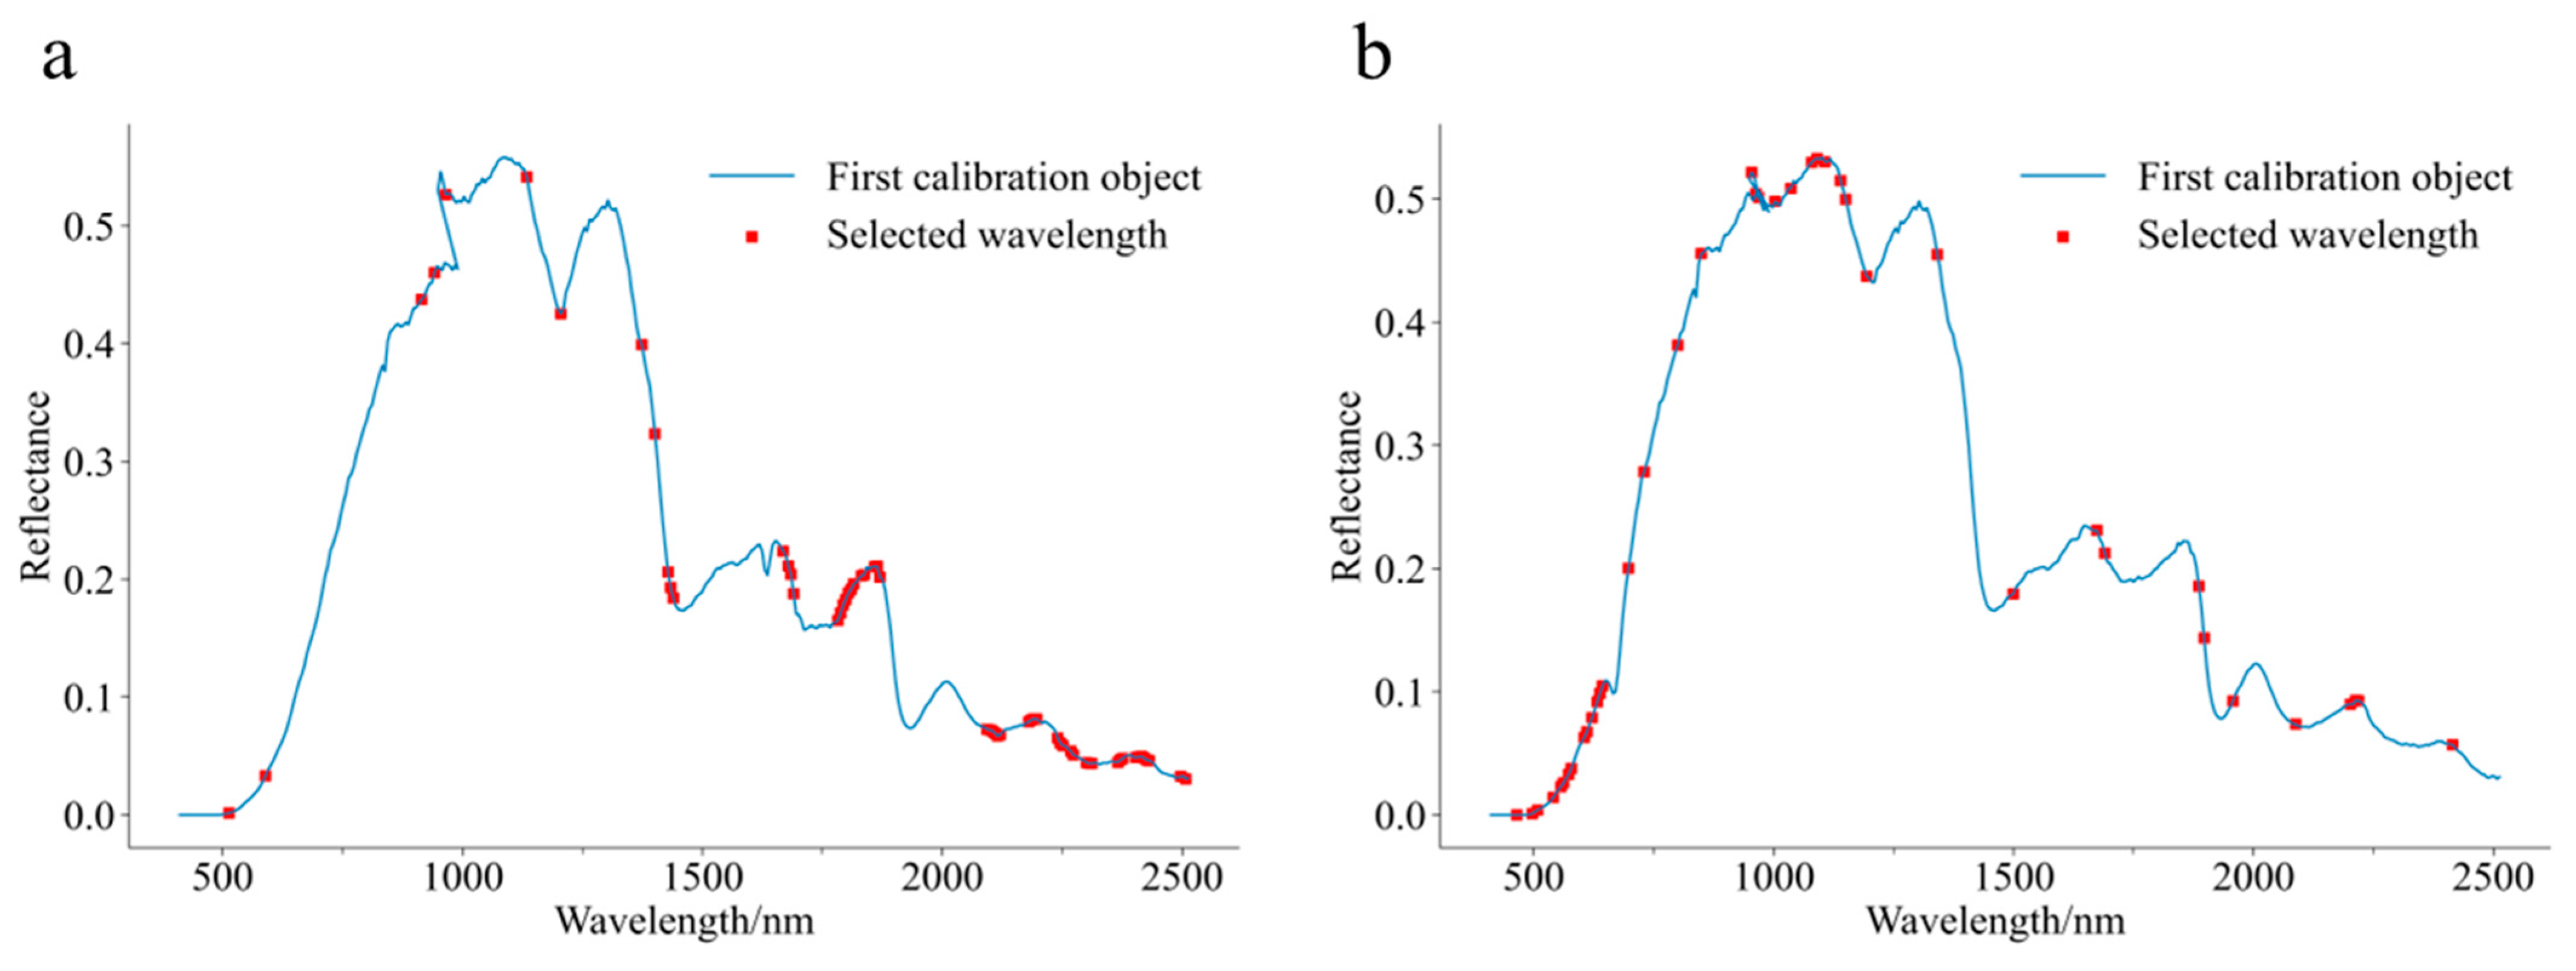
2.4. Effective Wavelength Screening Algorithms

Full-spectrum hyperspectral data, with their wide spectral range, numerous bands, and large volume, can often lead to issues such as data redundancy and multicollinearity, increasing model complexity. Therefore, selecting characteristic spectral bands is essential to reduce data dimensionality, eliminate interference from irrelevant variables, and enhance both the efficiency and predictive performance of spectral modeling.
The Successive Projections Algorithm (SPA) uses projection operations in the vector space to eliminate irrelevant variables and address collinearity, identifying an optimal subset of wavelengths with minimal redundancy. SPA applies a sequential projection strategy to iteratively rank the initial wavelengths and generate multiple candidate subsets, from which the optimal subset is selected based on the model’s predictive performance [36]. In this study, the minimum and maximum numbers of selected bands were set to 10 and 50, respectively, using the preprocessing method configured as “autoscaling”.
The competitive adaptive reweighted sampling (CARS) method integrates Monte Carlo sampling with partial least-squares (PLS) regression coefficients to identify optimal feature variables. First, the candidate variables were screened by combining the PLS coefficients with an exponentially decreasing function, followed by adaptive reweighted sampling. The final wavelength combination was selected based on the lowest root mean squared error of cross-validation (RMSECV) through 10-fold cross-validation [37]. In this study, the number of Monte Carlo sampling iterations was set to 50, and the number of principal components was fixed at 10.

2.5. Conventional Machine Learning Model

Partial least-squares discriminant analysis (PLS-DA) is a high-dimensional linear classification model based on partial least-squares regression (PLSR) [38]. During modeling, the labeled numerical vectors were converted into dummy variable matrices, and predictions were made using the PLSR model by assigning samples to the class with the highest predicted value. To optimize the latent variables and prevent overfitting, a 10-fold cross-validation approach was applied with the number of latent variables limited to a maximum of 21.
A support vector machine (SVM) is a classifier suitable for handling non-linear data that maximizes the margin in the feature space and offers strong generalization capabilities. It determines an (N-1)-dimensional hyperplane as the decision boundary for classification in N-dimensional data, with the margin defined by the sum of distances between the hyperplane and support vectors on both sides, where larger margins correspond to a higher classification accuracy [39]. In this study, hyperparameters, including the kernel function type (e.g., polynomial kernel), polynomial degree (optimized range: 2–3), penalty coefficient C (10−1–102), and kernel coefficient g (10−7–1), were optimized via a grid search. To ensure generalization, the optimal parameter combination was evaluated using leave-one-out cross-validation.
A multilayer perceptron (MLP) is a feedforward artificial neural network consisting of fully connected input, hidden, and output layers [40]. Trained by the backpropagation algorithm, it propagates errors backwards to update weights and biases, allowing the network to approximate target functions. Deep architectures with multiple hidden layers enhance the representational capacity. In this study, grid search optimization was used to determine the number of hidden layers, neurons per layer, and optimization algorithms (lbfgs, sgd, or Adam) with the activation function fixed as ReLU.

2.6. Deep Learning Model

As a leading deep learning (DL) architecture, convolutional neural networks (CNNs) have gained significant attention in both industry and academia, owing to their remarkable success in fields such as computer vision and natural language processing. A typical CNN consists of an input layer, convolutional layers, pooling layers, fully connected layers, and an output layer. This structure mimics biological neural networks with convolutional kernel scanning data to extract key features. In addition, CNNs employ a local weight-sharing mechanism that reduces parameter redundancy, thereby mitigating overfitting [41].
In this study, the CNN architecture was based on ResNet18 and consisted of eight convolutional layers, one pooling layer, and one fully connected layer. Convolutional operations were performed using predefined stride sizes and kernel dimensions to reduce data dimensionality. The ReLU activation function introduced nonlinearity, whereas the Adam optimizer (learning rate: 10−4) ensured rapid convergence during training. A Softmax classifier at the output layer was used to assign the spectral data to distinct categories. Additionally, L1/L2 regularization is applied to the models, introducing penalty terms in the loss function to control model complexity and prevent overfitting.

2.7. Data Analysis and Model Evaluation

The dataset was randomly divided into training, validation, and prediction sets at a 6:2:2 ratio (variety dataset: 900 samples, origin dataset: 300 samples), with the training set used for model fitting, the validation set for hyperparameter tuning, and the prediction set for performance evaluation. All spectral preprocessing and classification modeling were conducted using PyCharm (Python 3.10). PLS-DA, SVM, and MLP models were developed using the Scikit-learn library, whereas the CNN was implemented using the PyTorch deep learning framework (version 1.12.0+cu113).
Classification accuracy is the most commonly used metric for evaluating model performance, and it represents the ratio of correctly predicted samples to the total number of samples. Precision measures the ratio of correctly predicted positive samples among all predicted positive cases, while recall represents the ratio of correctly predicted positive cases to the actual total number of positive cases. Higher values approaching 100% indicate better classification performance. The confusion matrix provides a visual representation of the model performance, intuitively displaying key evaluation metrics such as accuracy, precision, and recall. The evaluation formula is as follows:
P r e c i s i o n = T P T P + F P × 100 % ,
R e c a l l = T P T P + F N × 100 % ,
A c c u r a c y = T P + T N T P + T N + F P + F N × 100 % ,
where TP denotes the number of true positive samples, TN is the number of true negative samples, FP is the number of false positive samples, and FN is the number of false negative samples.

3. Results

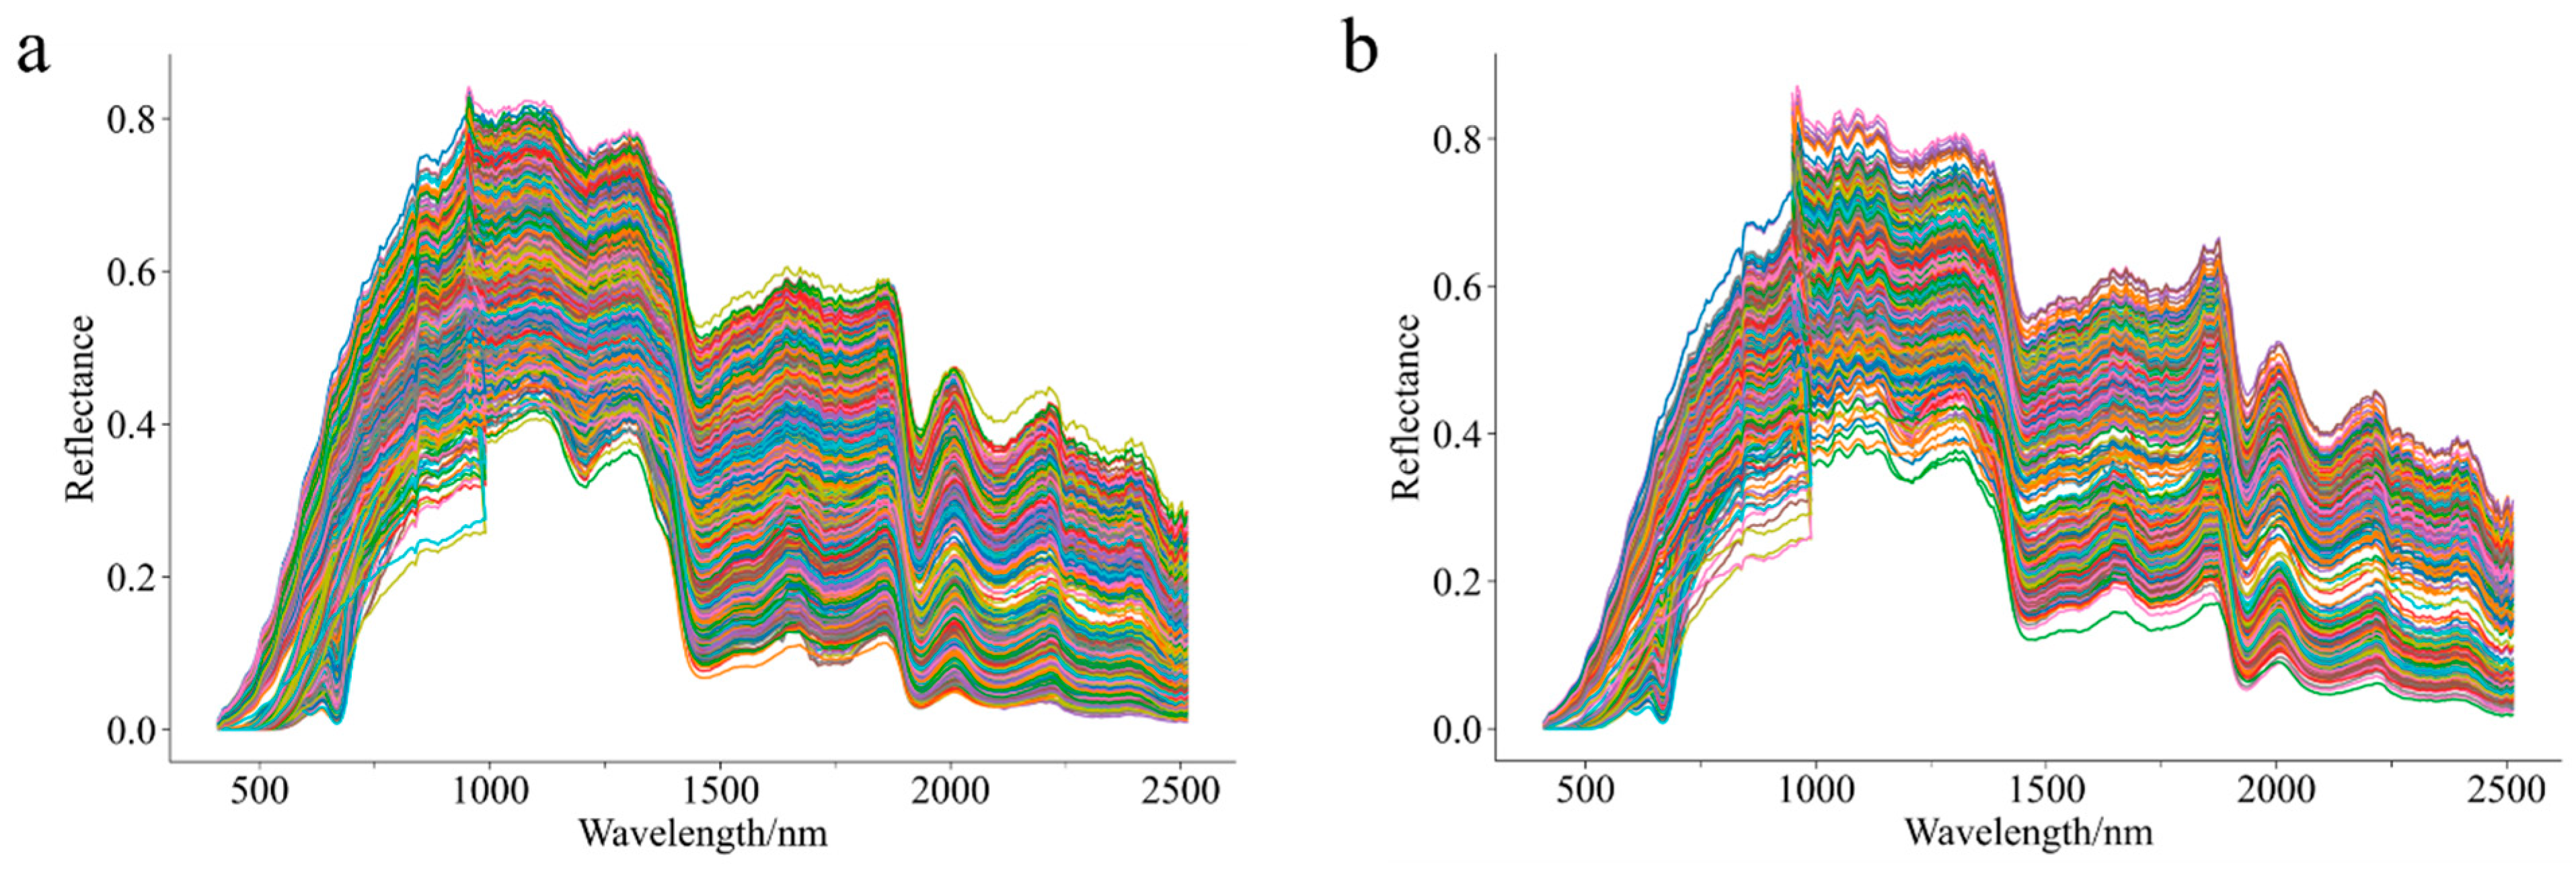
3.1. Raw Spectra of Chenpi Samples from Different Varieties and Origins

The spectral curves of Chenpi samples from different botanical varieties and geographical origins, from the ZF dataset that combines the Z and F datasets, are shown in Figure 2. While samples from different varieties and origins exhibit similar trends in spectral curves, differences in spectral reflectance intensity are observed, which may arise from variations in chemical composition between varieties and origins. The spectral curves display a sharp upward trend in the visible-near-infrared range (400–1000 nm). In the short-wave infrared range (1000–2500 nm), the curves show a fluctuating downward trend with distinct absorption peaks and troughs. A consistent trough at 500–700 nm reflected the color characteristics of the samples. The Z dataset spectral curves are more clustered and stable, whereas the F dataset exhibits greater noise and instability, requiring preprocessing methods to remove interference from excessive noise in the raw spectral curves.
A correlation analysis of spectral peaks revealed distinct molecular interactions: The absorption band near 1200 nm corresponds to the second stretching overtone of C–H bonds, predominantly originating from carbohydrate and lipid components. At 1300 nm, the spectral feature arises from C–H in-plane bending vibrations within organic matrices. The prominent peak at 1800 nm is attributed to O–H stretching vibrations associated with moisture absorption. Notably, although the peak positions of Chenpi from different varieties and origins are similar, there are significant differences in peak reflection intensity at the same location, indicating that spectral reflection patterns have different varieties and geographical characteristics.

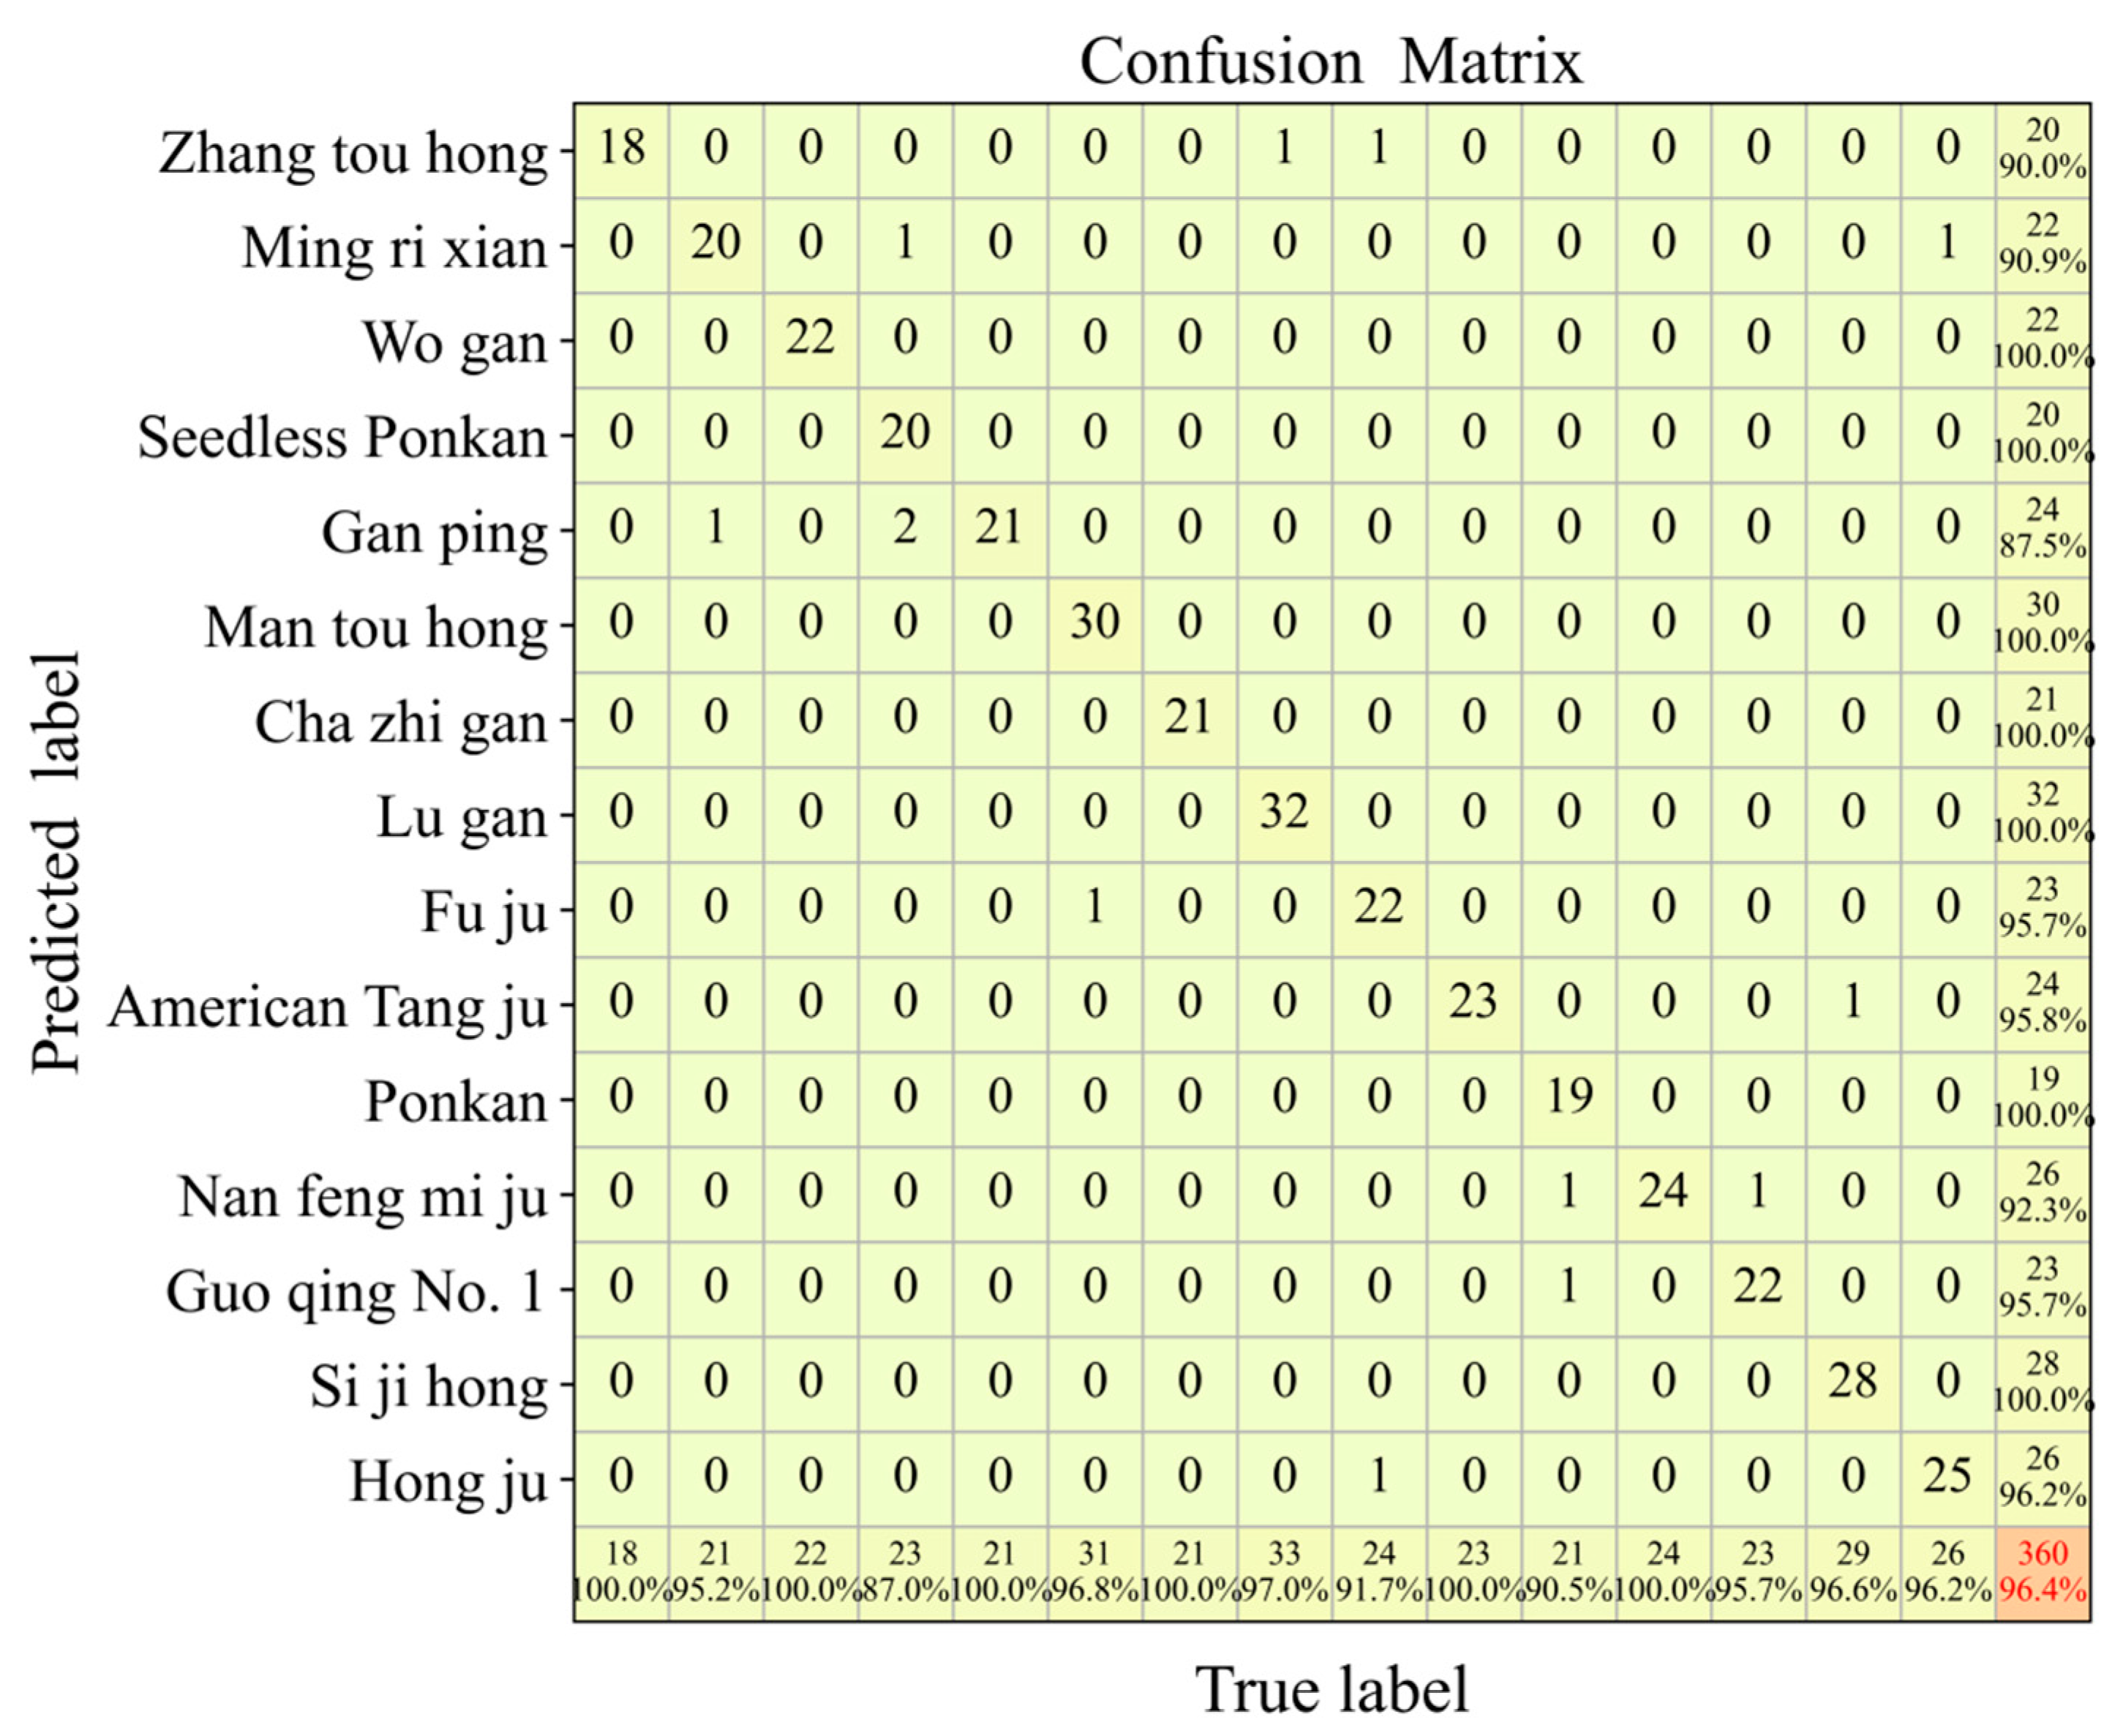
3.2. Discriminant Analysis of Different Chenpi Varieties

In conventional machine learning approaches, five preprocessing methods (MSC, D1, D2, SG, and SNV) were applied to the raw spectra (RAW) to eliminate noise interference and baseline drift, followed by the development of PLS-DA, SVM, and MLP models based on the preprocessed data. In contrast, a convolutional neural network (CNN) leveraging its automated feature extraction capability can directly utilize raw spectra without preprocessing for effective feature learning. To assess the impact of sample orientation on classification performance, hyperspectral data were collected from Chenpi samples in two orientations: exocarp-facing-upward (Z) and endocarp-facing-upward (F). Additionally, a combined dataset (Z + F) was created by merging both orientations to simulate real-world scenarios, in which samples were randomly positioned during data acquisition.
The classification results for each model are listed in Table 2. Overall, except for SG preprocessing, most models showed improved classification accuracy after preprocessing, with D1 and SNV demonstrating universal applicability. Notably, the D1-MLP and SNV-SVM models consistently achieved accuracy rates above 90% across all three datasets (Z, F, and ZF), confirming their effectiveness in enhancing spectral feature discriminability. Among the four classification models, certain machine learning approaches (PLS-DA, SVM, and MLP) effectively distinguished Chenpi varieties, with most achieving over 80% accuracy in both the training and prediction sets. Specifically, the D1-MLP model attained the highest prediction accuracy (92.78%) for the Z dataset, whereas the SNV-SVM model achieved optimal performance (94.44% accuracy) on the F dataset. In contrast, the CNN demonstrated moderate classification performance on single-orientation datasets (Z or F) but outperformed all other models on the combined ZF dataset, achieving a prediction accuracy of 96.39% using the raw spectra. This result underscores the strong representational capacity of deep networks in handling multisource data fusion.
To further assess the classification performance of the CNN model for each Chenpi variety, a confusion matrix (Figure 3) was constructed for the prediction set based on the optimal RAW-CNN model [42]. In the confusion matrix, the columns represent the true class labels and the rows indicate the predicted class labels. The diagonal cells show the number of correctly classified samples per class, with the rightmost column displaying the total number of true samples and their recall rates. The bottom row presents the number of predicted samples per class along with their precision rates. The results revealed that “Gan Ping” had a relatively high misclassification rate, achieving only 87.5% recall, while “Seedless Ponkan” exhibited reduced discriminability, with a precision of 87.0%. Most varieties demonstrated high precision and recall rates, particularly “Wo Gan” and “Cha Zhi Gan”, which achieved 100% recall and precision, indicating the strong distinctiveness in the model’s classification of these two varieties.

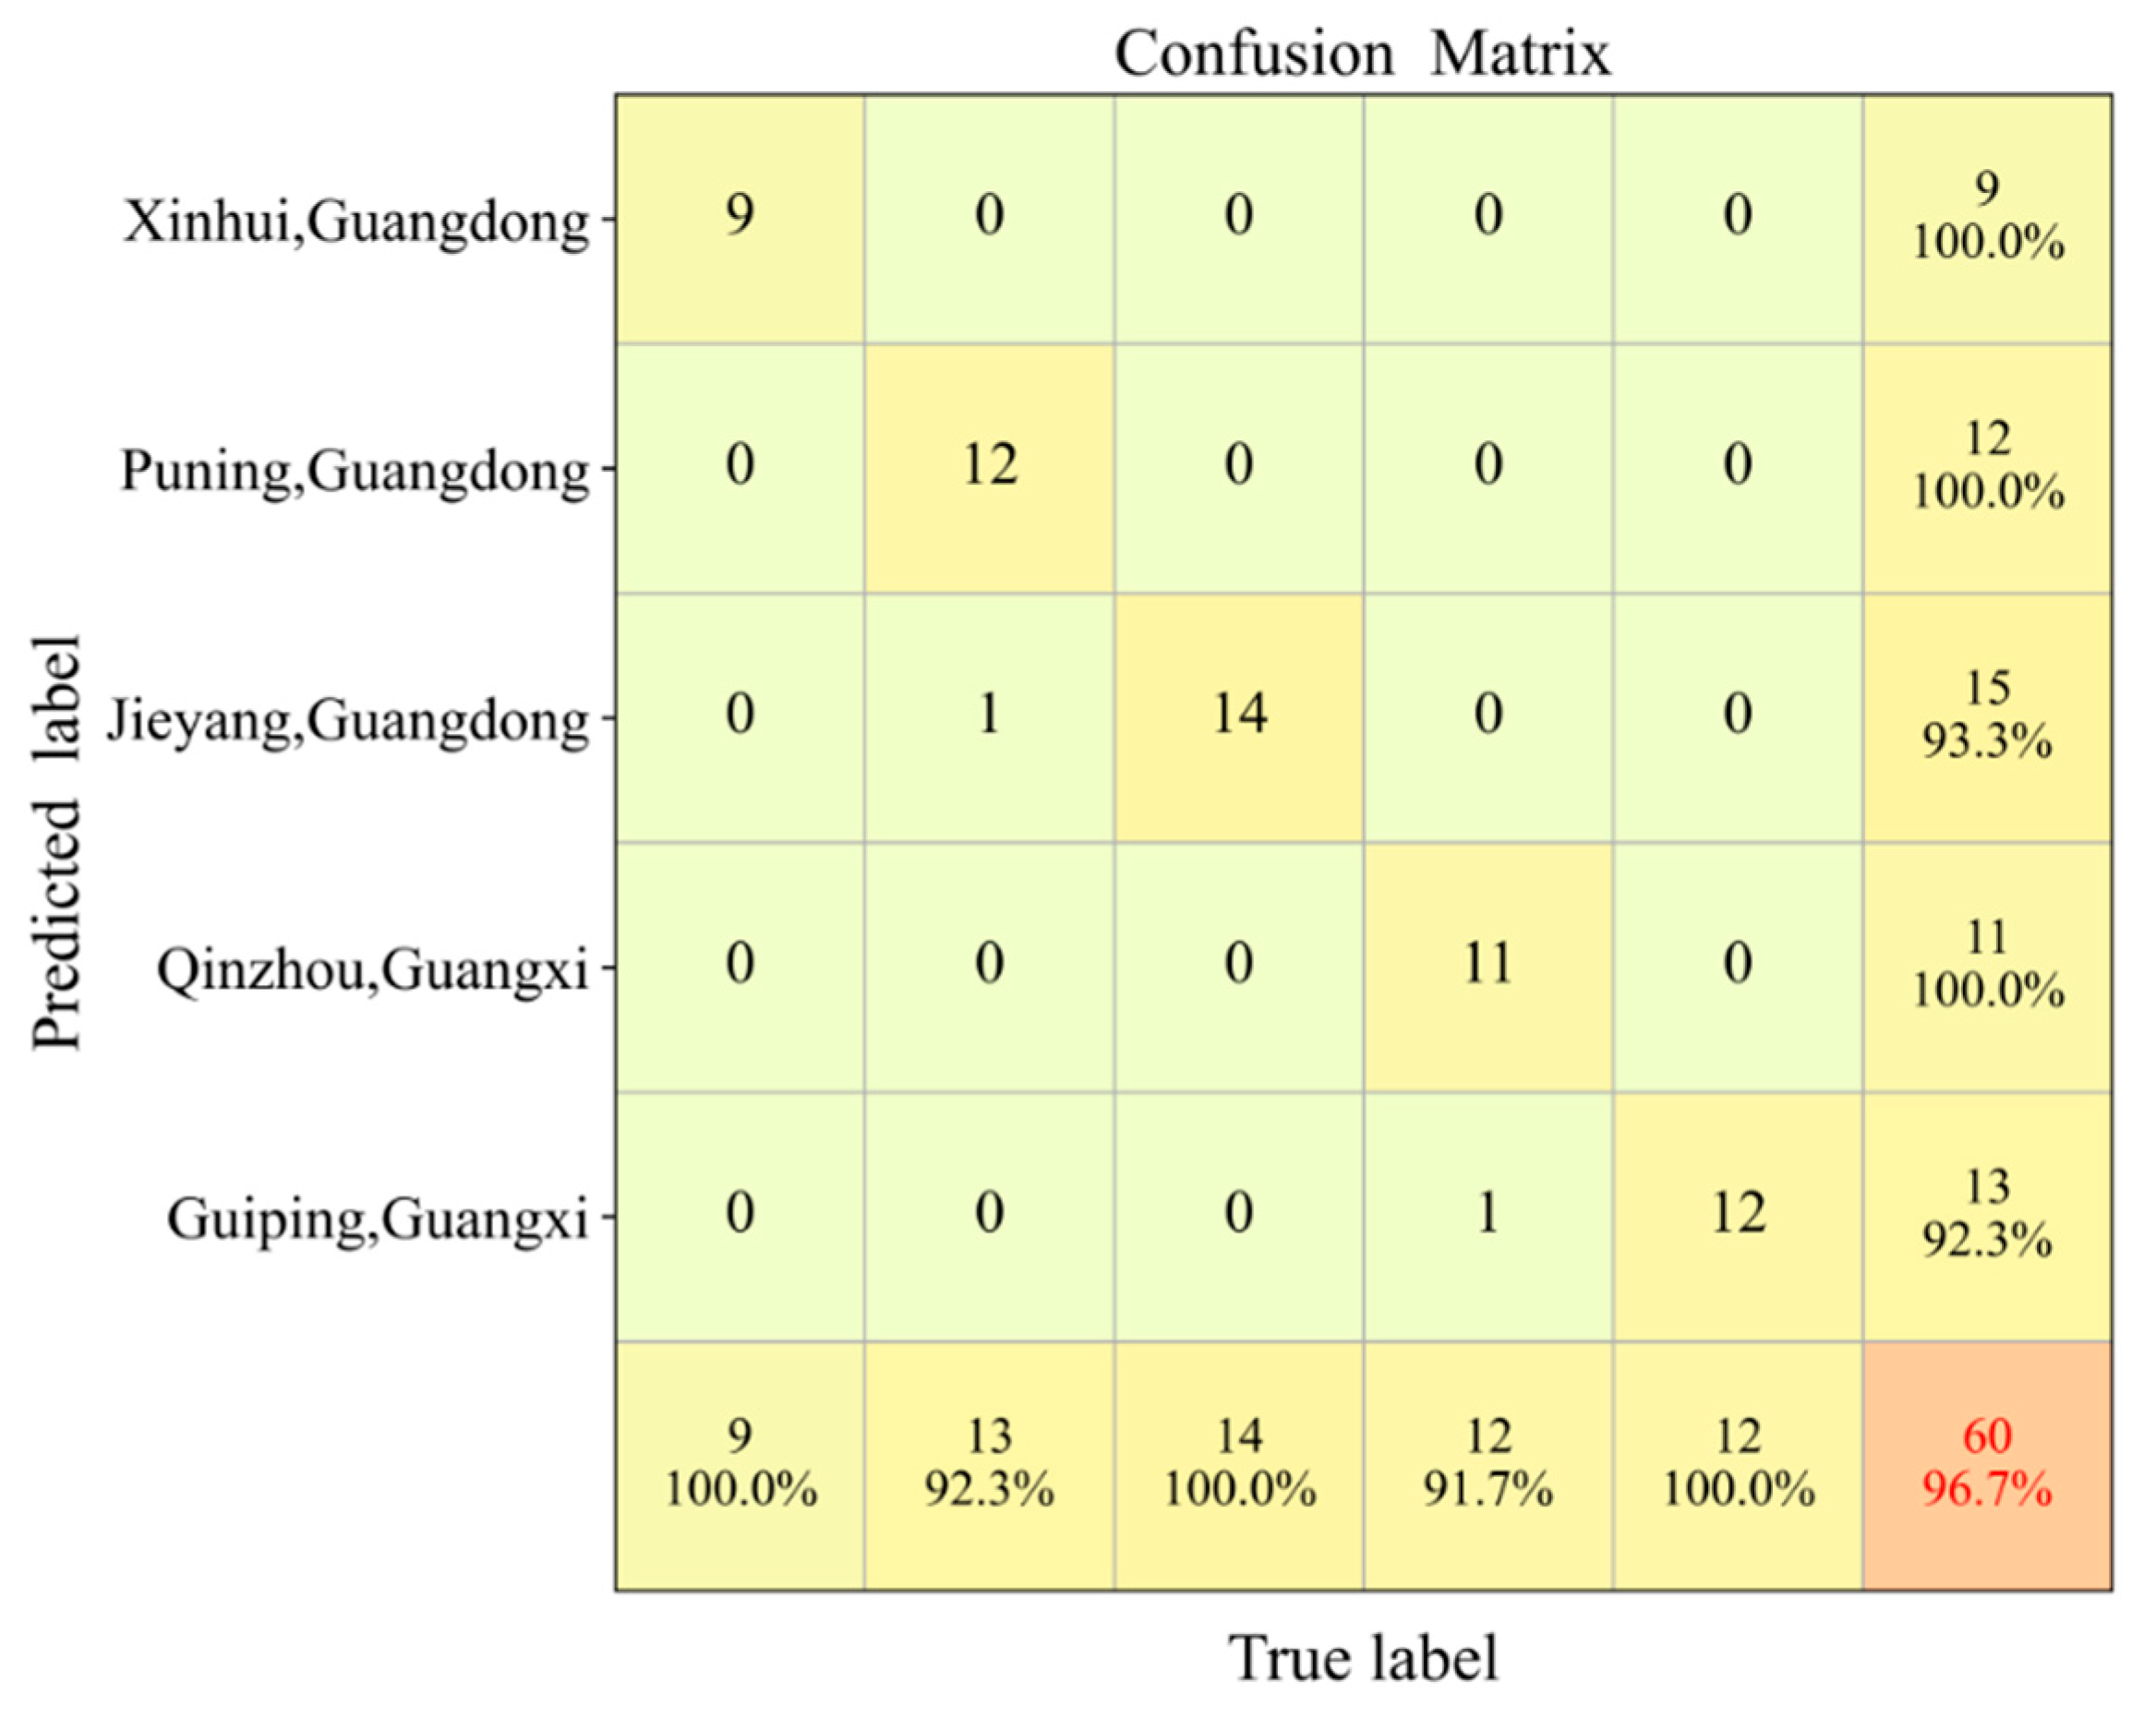
3.3. Discriminant Analysis of Different Chenpi Origins

In addition to varietal identification, tracing the geographical origin of Chenpi is a key challenge for market authentication. This study utilized the authentic Chenpi “Cha-Zhi-Gan” to develop origin discrimination models, following the same dataset partitioning protocol as previously described. The classification results are presented in Table 3.
Among the evaluated models, PLS-DA demonstrated robust performance in discriminating geographical origins, achieving classification accuracies above 80% across all datasets, with a prediction accuracy of 96.67% for the Z dataset. The SVM and MLP models exhibited significant variability depending on the preprocessing method, with only specific techniques yielding optimal results. The MLP model performed the best with D1 and D2 preprocessing, whereas the SVM model achieved the highest accuracy with SNV, reaching 95.00% and 94.17% for the F and ZF datasets, respectively. In contrast, the CNN model underperformed in origin identification, likely owing to the insufficient sample size, achieving an accuracy of approximately 80% across all datasets. Overall, the D2-PLSDA model applied to the Z dataset delivered the highest performance with training and prediction set accuracies of 98.75% and 96.67%, respectively.
To further evaluate the classification efficacy of the model for “Cha-Zhi-Gan” Chenpi in different geographical regions, a confusion matrix of the prediction set (Figure 4) was generated based on the optimal D2-PLSDA model. The results indicated that one sample from Guangdong Puning was misclassified as Guangdong Jieyang, and one from Guangxi Qinzhou was incorrectly predicted as Guangxi Guiping, indicating a higher likelihood of misclassification among geographically proximate origins. Notably, “Cha-Zhi-Gan” Chenpi from the authentic producing region of Guangdong Xinhui demonstrated absolute discriminative superiority, achieving 100% recall and precision, highlighting a clear spectral distinction between Xinhui origin Chenpi and those from other regions.

3.4. Extraction of Spectral Feature Wavelength

To determine the most effective wavelength screening method for model simplification, SPA and CARS were used to extract the feature wavelengths from the ZF-CNN model (optimal for varietal classification) and the Z-D2-PLSDA model (optimal for origin discrimination) based on their full-spectrum classification results. The outcomes are summarized in Table 4 and Figure 5.
The number of feature wavelengths selected via the SPA (20–38) was significantly lower than that selected via the CARS (41–57). Both methods resulted in reduced model accuracy compared with full-spectrum modeling, likely owing to the loss of informative wavelengths during dimensionality reduction. The ZF-CNN model was particularly sensitive to wavelength reduction, with prediction accuracies dropping to 73.06% (SPA) and 85.00% (CARS). In contrast, the Z-D2-PLSDA model combined with CARS demonstrated strong performance, retaining a prediction accuracy of 91.67% using only 41 feature wavelengths, achieving an accuracy comparable to that of the full-spectrum model, while significantly reducing the complexity. CARS outperformed SPA in feature wavelength selection by preserving critical spectral information despite retaining more wavelengths and effectively balancing accuracy and error minimization. These findings suggest that the adaptive reweighting mechanism of CARS mitigates information loss more effectively than the projection-based approach of SPA, particularly in scenarios that require high discriminative fidelity.

4. Discussion

This study explored the classification of Chenpi from distinct varieties and geographical origins (“Cha-Zhi-Gan”) using HSI and machine learning models. Three sample orientation configurations were evaluated: exocarp-facing-upward (Z), endocarp-facing-upward (F), and a fused dataset combining random orientations (ZF). The classification models constructed from these configurations exhibited varying performance. Among the machine learning approaches (PLS-DA, SVM, and MLP), the Z dataset achieved a slightly higher classification accuracy than the F and ZF configurations. Contrary to the expected benefits of data fusion, the ZF approach underperformed, likely owing to redundant or noisy spectral information from the F orientation, which diminished the model’s discriminative capacity.
This study compared the deep learning model CNN with conventional machine learning models (PLS-DA, SVM, and MLP), highlighting the superior performance of CNN under large-sample conditions [43]. In the varietal classification of Chenpi peels using CNN, the fused ZF dataset group significantly improved the accuracy to 96.39%, establishing CNN as the optimal model for varietal discrimination. In the geographical origin classification, the CNN attained prediction accuracies of 80.00% (Z dataset) and 75.00% (F dataset), with a modest increase to 85.83% for the ZF dataset. This limited improvement may be attributed to the smaller sample size for origin discrimination (300 samples per single-orientation dataset, 600 total after fusion), further confirming the CNN’s sensitivity to sample quantity and its impact on model performance [44]. Overall, CNN and machine learning models exhibit complementary strengths. Compared with conventional approaches, CNN’s multilayered neural network architecture enables robust feature extraction and high representational capacity, making it particularly effective in large-sample scenarios. Although CNN requires a longer computational time for training, its advantages in terms of generalizability, stability, and interpretability surpass those of conventional models [45], making it highly effective for Chenpi varietal discrimination.
A comparative analysis of the two feature wavelength selection methods highlighted the superiority of CARS over SPA. Although SPA selected fewer characteristic wavelengths, the resulting model exhibited significant performance deterioration, suggesting that the selected wavelengths contained limited informative content. In contrast, CARS delivered more robust results, with its optimal model, Z-D2-PLSDA, constructed using 57 characteristic wavelengths, achieving a prediction set accuracy of 91.67%. By leveraging the PLS regression coefficients, CARS iteratively selected the wavelengths contributing the most to the model while dynamically adjusting the weights. Despite its higher computational complexity and a larger number of selected wavelengths, CARS more effectively identified the critical wavelengths, ultimately enhancing the model performance.
The feature wavelength selection curves indicated that ZF-CARS-CNN predominantly selected the characteristic bands in the near-infrared range, suggesting that front and back surface data modeling prioritized the near-infrared bands with richer information. In contrast, Z-D2-CARS-PLSDA primarily selected wavelengths within the 500–700 nm visible light range, which contained abundant color information, highlighting that focusing on visible light wavelengths during Z dataset modeling could yield superior results.

5. Conclusions

Geographical differences and varietal characteristics significantly influence the quality indicators of Chenpi, making accurate identification essential for protecting consumer rights. Moreover, there is an urgent need in food research for efficient and nondestructive rapid detection technologies to assess food quality. As a promising nondestructive detection technique, HSI has been widely applied in food and agricultural product quality evaluation. This study integrated HSI with deep learning to assess Chenpi samples from different varieties and geographical origins to develop a classification model for rapid differentiation. By incorporating the feature wavelength selection strategies, the model was significantly simplified while maintaining a classification performance comparable to that of full-wavelength models.
The results demonstrated that integrating HSI technology with deep learning provided a rapid and nondestructive approach to predicting Chenpi varieties and origins. Future research could expand the range of Chenpi varieties and origins while incorporating incremental learning to enhance model applicability and generalization. This approach could facilitate large-scale adoption of hyperspectral imaging for origin tracing and quality evaluation of conventional Chinese medicinal materials, particularly Chenpi.

Author Contributions

Conceptualization, data curation, writing—original draft, and resources, H.L.; writing—review and editing, project administration, and supervision, Y.W. (Youyou Wang); writing—review and editing and data curation, Y.W. (Yiheng Wang); writing—review and editing and resources, H.H.; resources, J.W.; resources, X.Z.; funding acquisition, project administration, and supervision, Q.Y.; funding acquisition, project administration, and supervision, J.Y. All authors have read and agreed to the published version of the manuscript.

Funding

This work was supported by the National Key Research and Development Program of China (2023YFC3503801), the Scientific and Technological Innovation Project of China Academy of Chinese Medical Sciences (CI2023E002), the Innovation Team and Talents Cultivation Program of National Administration of Traditional Chinese Medicine (ZYYZDXK-2023244), the Quality and Technical Service Platform for Traditional Chinese Medicine Whole Industry Chain (2022-230-221), the key project at central government level: The ability establishment of sustainable use for valuable Chinese medicine resources (2060302), the China Agricultural Research System of MOF and MARA (CARS-21), The Scientific and Technological Innovation Project of China Academy of Chinese Medical Sciences (Grant No. ZZ18-YQ-052), and The fundamental research funds for the central public welfare research institutes of China Academy of Chinese Medical Sciences (Grant No. ZZXT202412).

Institutional Review Board Statement

Not applicable.

Informed Consent Statement

Not applicable.

Data Availability Statement

The original contributions presented in the study are included in the article, further inquiries can be directed to the corresponding author.

Conflicts of Interest

The authors declare that they have no known competing financial interests or personal relationships that could have appeared to influence the work reported in this paper.

References

  1. Hsouna, A.B.; Sadaka, C.; Mekinić, I.G.; Garzoli, S.; Švarc-Gajić, J.; Rodrigues, F.; Morais, S.; Moreira, M.; Ferreira, E.; Spigno, G.; et al. The Chemical Variability, Nutraceutical Value, and Food-Industry and Cosmetic Applications of Citrus Plants: A Critical Review. Antioxidants 2023, 12, 481. [Google Scholar] [CrossRef] [PubMed]
  2. Sharma, K.; Mahato, N.; Cho, M.; Lee, Y. Converting Citrus Wastes into Value-Added Products: Economic and Environmently Friendly Approaches. Nutrition 2017, 34, 29–46. [Google Scholar] [CrossRef]
  3. Panwar, D.; Saini, A.; Panesar, P.; Chopra, H. Unraveling the Scientific Perspectives of Citrus By-Products Utilization: Progress towards Circular Economy. Trends Food Sci. Technol. 2021, 111, 549–562. [Google Scholar] [CrossRef]
  4. Anticona, M.; Blesa, J.; Frígola, A.; Esteve, M. High Biological Value Compounds Extraction from Citrus Waste with Non-Conventional Methods. Foods 2020, 9, 811. [Google Scholar] [CrossRef]
  5. Cao, X.; Shi, K.; Xu, Y.; Zhang, P.; Zhang, H.; Pan, S. Integrated Metabolomics and Network Pharmacology to Reveal Antioxidant Mechanisms and Potential Pharmacological Ingredients of Citrus Herbs. Food Res. Int. 2023, 174, 113514. [Google Scholar] [CrossRef] [PubMed]
  6. He, Y.J.; Zhu, M.; Zhou, Y.; Zhao, K.; Zhou, J.; Qi, Z.H.; Zhu, Y.Y.; Wang, Z.J.; Xie, T.Z.; Tang, Q.; et al. Comparative Investigation of Phytochemicals among Ten Citrus Herbs by Ultra High Performance Liquid Chromatography Coupled with Electrospray Ionization Quadrupole Time-of-Flight Mass Spectrometry and Evaluation of Their Antioxidant Properties. J. Sep. Sci. 2020, 43, 3349–3358. [Google Scholar] [CrossRef] [PubMed]
  7. Chinese Pharmacopoeia Commission. Pharmacopoeia of the People’s Republic of China, 1st ed.; China Medical Science Press: Beijing, China, 2020. [Google Scholar]
  8. Wang, P.; Zhang, J.; Zhang, Y.; Su, H.; Qiu, X.; Gong, L.; Huang, J.; Bai, J.; Huang, Z.; Xu, W. Chemical and Genetic Discrimination of Commercial Guangchenpi (Citrus reticulata ‘Chachi’) by Using UPLC-QTOF-MS/MS Based Metabolomics and DNA Barcoding Approaches. RSC Adv. 2019, 9, 23373–23381. [Google Scholar] [CrossRef]
  9. Mamy, D.; Huang, Y.; Akpabli-Tsigbe, N.D.K.; Battino, M.; Chen, X. Valorization of Citrus reticulata Peels for Flavonoids and Antioxidant Enhancement by Solid-State Fermentation Using Aspergillus Niger CGMCC 3.6189. Molecules 2022, 27, 8949. [Google Scholar] [CrossRef]
  10. Yu, X.; Sun, S.; Guo, Y.; Liu, Y.; Yang, D.; Li, G.; Lü, S. Citri reticulatae Pericarpium (Chenpi): Botany, Ethnopharmacology, Phytochemistry, and Pharmacology of a Frequently Used Traditional Chinese Medicine. J. Ethnopharmacol. 2018, 220, 265–282. [Google Scholar] [CrossRef]
  11. Sun, W.; Ai, Z.; Li, M.; Lei, D.; Mowafy, S.; Liu, Y. Comparative Analysis of Citri reticulatae Pericarpium: Revealing the Nonvolatile Compounds Transformation and Optimizing Drying Processes. Ind. Crops Prod. 2024, 212, 118266. [Google Scholar] [CrossRef]
  12. Zheng, Y.; Zeng, X.; Peng, W.; Wu, Z.; Su, W. Study on the Discrimination between Citri reticulatae Pericarpium Varieties Based on HS-SPME-GC-MS Combined with Multivariate Statistical Analyses. Molecules 2018, 23, 1235. [Google Scholar] [CrossRef]
  13. Wang, F.; Chen, L.; Chen, H.; Chen, S.; Liu, Y. Analysis of Flavonoid Metabolites in Citrus Peels (Citrus reticulata “Dahongpao”) Using UPLC-ESI-MS/MS. Molecules 2019, 24, 2680. [Google Scholar] [CrossRef] [PubMed]
  14. Wen, J.; Wang, Y.; Lu, X.; Pan, H.; Jin, D.; Wen, J.; Jin, C.; Sahu, S.K.; Su, J.; Luo, X.; et al. An Integrated Multi-Omics Approach Reveals Polymethoxylated Flavonoid Biosynthesis in Citrus reticulata Cv. Chachiensis. Nat. Commun. 2024, 15, 3991. [Google Scholar] [CrossRef]
  15. Li, L.; Zhang, M.; Wang, X.; Yang, Y.; Gong, X.; Wang, C.; Xu, J.; Li, M. Assessment of Components of Gingko biloba Leaves Collected from Different Regions of China That Contribute to Its Antioxidant Effects for Improved Quality Monitoring. Food Sci. Technol. 2020, 41 (Suppl. 2), fst.33620. [Google Scholar] [CrossRef]
  16. Li, Z.; Wang, H.; Feng, L.; Song, L.; Lu, Y.; Li, H.; Li, Y.; Tian, G.; Yang, Y.; Li, H.; et al. Comparative Metabolomics Provides Novel Insights into Correlation Between Dominant Habitat Factors and Constituents of Stellaria Radix (Stellaria dichotoma L. var. lanceolata Bge.). Front. Plant Sci. 2022, 13, 1035712. [Google Scholar] [CrossRef]
  17. Fu, Y.; Wang, C.; Gao, Z.; Liao, Y.; Peng, M.; Fu, F.; Li, G.; Su, D.; Guo, J.; Shan, Y. Microbes: Drivers of Chenpi Manufacturing, Biotransformation, and Physiological Effects. Food Chem. 2025, 464, 141631. [Google Scholar] [CrossRef] [PubMed]
  18. Duan, L.; Guo, L.; Dou, L.L.; Zhou, C.L.; Xu, F.G.; Zheng, G.D.; Li, P.; Liu, E.H. Discrimination of Citrus reticulata Blanco and Citrus reticulata ‘Chachi’ by Gas Chromatograph-Mass Spectrometry Based Metabolomics Approach. Food Chem. 2016, 212, 123–127. [Google Scholar] [CrossRef]
  19. Zhu, Y.; Zhu, Y.; Liu, X.; Qi, J. Change in Nutrients of Citri reticulatae ‘Chachi’ in Relation to Browning during Aging. J. Food Compos. Anal. 2022, 107, 104351. [Google Scholar] [CrossRef]
  20. Lv, W.; Lin, T.; Ren, Z.; Jiang, Y.; Zhang, J.; Bi, F.; Gu, L.; Hou, H.; He, J. Rapid Discrimination of Citrus reticulata ‘Chachi’ by Headspace-Gas Chromatography-Ion Mobility Spectrometry Fingerprints Combined with Principal Component Analysis. Food Res. Int. 2020, 131, 108985. [Google Scholar] [CrossRef]
  21. Liu, Y.; Wen, H.; Kong, J.; Hu, Z.; Hu, Y.; Zeng, J.; Chen, X.; Zhang, H.; Chen, J.; Xu, J. Flavor Characterization of Citri reticulatae Pericarpium (Citrus reticulata ‘Chachiensis’) with Different Aging Years via Sensory and Metabolomic Approaches. Food Chem. 2024, 443, 138616. [Google Scholar] [CrossRef]
  22. Wang, H.; Xu, H. The Study on Food Sensory Evaluation Based on Particle Swarm Optimization Algorithm. AJFST 2015, 8, 772–776. [Google Scholar] [CrossRef]
  23. Qian, Y.; Gao, Z.; Wang, C.; Ma, J.; Li, G.; Fu, F.; Guo, J.; Shan, Y. Effects of Different Treatment Methods of Dried Citrus Peel (Chenpi) on Intestinal Microflora and Short-Chain Fatty Acids in Healthy Mice. Front. Nutr. 2021, 8, 702559. [Google Scholar] [CrossRef] [PubMed]
  24. Tang, L.J.; Li, X.K.; Huang, Y.; Zhang, X.Z.; Li, B.Q. Accurate and Visualiable Discrimination of Chenpi Age Using 2D-CNN and Grad-CAM++ Based on Infrared Spectral Images. Food Chem. X 2024, 23, 101759. [Google Scholar] [CrossRef]
  25. Zong, Y.; Chen, T.; Dong, H.; Zhu, L.; Ju, W. Si-Ni-San Prevents Reserpine-Induced Depression by Inhibiting Inflammation and Regulating CYP450 Enzymatic Activity. Front. Pharmacol. 2020, 10, 1518. [Google Scholar] [CrossRef] [PubMed]
  26. Jităreanu, A.; Trifan, A.; Vieriu, M.; Caba, I.C.; Mârțu, I.; Agoroaei, L. Current Trends in Toxicity Assessment of Herbal Medicines: A Narrative Review. Processes 2022, 11, 83. [Google Scholar] [CrossRef]
  27. Zhang, L.; Wang, Y.; Wei, Y.; An, D. Near-Infrared Hyperspectral Imaging Technology Combined with Deep Convolutional Generative Adversarial Network to Predict Oil Content of Single Maize Kernel. Food Chem. 2022, 370, 131047. [Google Scholar] [CrossRef]
  28. Feng, L.; Wu, B.; Zhu, S.; He, Y.; Zhang, C. Application of Visible/Infrared Spectroscopy and Hyperspectral Imaging with Machine Learning Techniques for Identifying Food Varieties and Geographical Origins. Front. Nutr. 2021, 8, 680357. [Google Scholar] [CrossRef] [PubMed]
  29. Hu, N.; Li, W.; Du, C.; Zhang, Z.; Gao, Y.; Sun, Z.; Yang, L.; Yu, K.; Zhang, Y.; Wang, Z. Predicting Micronutrients of Wheat Using Hyperspectral Imaging. Food Chem. 2021, 343, 128473. [Google Scholar] [CrossRef]
  30. Fan, J.; Bi, S.; Xu, R.; Wang, L.; Zhang, L. Hybrid Lightweight Deep-Learning Model for Sensor-Fusion Basketball Shooting-Posture Recognition. Measurement 2022, 189, 110595. [Google Scholar] [CrossRef]
  31. Li, X.; Yi, X.; Liu, Z.; Liu, H.; Chen, T.; Niu, G.; Yan, B.; Chen, C.; Huang, M.; Ying, G. Application of Novel Hybrid Deep Leaning Model for Cleaner Production in a Paper Industrial Wastewater Treatment System. J. Clean. Prod. 2021, 294, 126343. [Google Scholar] [CrossRef]
  32. Li, Z.; Lin, Z.; Lu, Z.; Feng, Z.; Chen, Q.; Deng, S.; Li, Z.; Yan, Y.; Ying, Z. Coix seed Improves Growth Performance and Productivity in Post-Weaning Pigs by Reducing Gut pH and Modulating Gut Microbiota. AMB Express 2019, 9, 115. [Google Scholar] [CrossRef] [PubMed]
  33. Chu, H.; Zhang, C.; Wang, M.; Gouda, M.; Wei, X.; He, Y.; Liu, Y. Hyperspectral Imaging with Shallow Convolutional Neural Networks (SCNN) Predicts the Early Herbicide Stress in Wheat Cultivars. J. Hazard. Mater. 2022, 421, 126706. [Google Scholar] [CrossRef] [PubMed]
  34. Mou, L.; Zhou, C.; Zhao, P.; Nakisa, B.; Rastgoo, M.N.; Jain, R.; Gao, W. Driver Stress Detection via Multimodal Fusion Using Attention-Based CNN-LSTM. Expert Syst. Appl. 2021, 173, 114693. [Google Scholar] [CrossRef]
  35. Yipeng, L.; Wenbing, L.; Kaixuan, H.; Wentao, T.; Ling, Z.; Shizhuang, W.; Linsheng, H. Determination of Wheat Kernels Damaged by Fusarium Head Blight Using Monochromatic Images of Effective Wavelengths from Hyperspectral Imaging Coupled with an Architecture Self-Search Deep Network. Food Control 2022, 135, 108819. [Google Scholar] [CrossRef]
  36. Min, D.; Zhao, J.; Bodner, G.; Ali, M.; Li, F.; Zhang, X.; Rewald, B. Early Decay Detection in Fruit by Hyperspectral Imaging–Principles and Application Potential. Food Control 2023, 152, 109830. [Google Scholar] [CrossRef]
  37. Cai, Z.; Huang, Z.; He, M.; Li, C.; Qi, H.; Peng, J.; Zhou, F.; Zhang, C. Identification of Geographical Origins of Radix Paeoniae Alba Using Hyperspectral Imaging with Deep Learning-Based Fusion Approaches. Food Chem. 2023, 422, 136169. [Google Scholar] [CrossRef]
  38. Dai, Y.; Yan, B.; Xiong, F.; Bai, R.; Wang, S.; Guo, L.; Yang, J. Tanshinone Content Prediction and Geographical Origin Classification of Salvia miltiorrhiza by Combining Hyperspectral Imaging with Chemometrics. Foods 2024, 13, 3673. [Google Scholar] [CrossRef] [PubMed]
  39. Wang, Y.; Song, S. Variety Identification of Sweet Maize Seeds Based on Hyperspectral Imaging Combined with Deep Learning. Infrared Phys. Technol. 2023, 130, 104611. [Google Scholar] [CrossRef]
  40. Cai, Z.; He, M.; Li, C.; Qi, H.; Bai, R.; Yang, J.; Zhang, C. Identification of Chrysanthemum Using Hyperspectral Imaging Based on Few-Shot Class Incremental Learning. Comput. Electron. Agric. 2023, 215, 108371. [Google Scholar] [CrossRef]
  41. Qi, H.; Huang, Z.; Jin, B.; Tang, Q.; Jia, L.; Zhao, G.; Cao, D.; Sun, Z.; Zhang, C. SAM-GAN: An Improved DCGAN for Rice Seed Viability Determination Using near-Infrared Hyperspectral Imaging. Comput. Electron. Agric. 2024, 216, 108473. [Google Scholar] [CrossRef]
  42. Wang, B.; He, J.; Zhang, S.; Li, L. Nondestructive Prediction and Visualization of Total Flavonoids Content in Cerasus Humilis Fruit during Storage Periods Based on Hyperspectral Imaging Technique. J. Food Process Eng. 2021, 44, e13807. [Google Scholar] [CrossRef]
  43. Wang, Y.; Yang, J.; Yu, S.; Fu, H.; He, S.; Yang, B.; Nan, T.; Yuan, Y.; Huang, L. Prediction of Chemical Indicators for Quality of Zanthoxylum Spices from Multi-Regions Using Hyperspectral Imaging Combined with Chemometrics. Front. Sustain. Food Syst. 2022, 6, 1036892. [Google Scholar] [CrossRef]
  44. Li, X.; Wei, Z.; Peng, F.; Liu, J.; Han, G. Non-Destructive Prediction and Visualization of Anthocyanin Content in Mulberry Fruits Using Hyperspectral Imaging. Front. Plant Sci. 2023, 14, 1137198. [Google Scholar] [CrossRef] [PubMed]
  45. Bai, Z.; Hu, X.; Tian, J.; Chen, P.; Luo, H.; Huang, D. Rapid and Nondestructive Detection of Sorghum Adulteration Using Optimization Algorithms and Hyperspectral Imaging. Food Chem. 2020, 331, 127290. [Google Scholar] [CrossRef]
Figure 1. Partial samples of different varieties of Chenpi, divided into exocarp-facing-upward (Z) and endocarp-facing-upward (F). (a) Photograph of Z-side; (b) photograph of F-side; (c) ROI image of Z-side; (d) ROI image of F-side.
Foods 14 01979 g001
Figure 2. Spectral curves of Chenpi samples of different varieties and origins. (a) ZF dataset of variety. (b) ZF dataset of origin.
Foods 14 01979 g002
Figure 3. The confusion matrix on the prediction sets of the ZF-CNN.
Foods 14 01979 g003
Figure 4. Confusion matrix on the prediction sets of the Z-D2-PLSDA.
Foods 14 01979 g004
Figure 5. Selected wavelengths for best classification model of Chenpi by CARS. (a) ZF-CARS-CNN; (b) Z-D2-CARS-PLSDA.
Foods 14 01979 g005
Table 1. Geographical scale information of different varieties of Chenpi.
No.Chenpi VarietyGeographical Origin
C-1Zhang tou hongXingan, Jiangxi
C-2Ming ri xianQuzhou, Zhejiang
C-3Wo ganQuzhou, Zhejiang
C-4Seedless PonkanQuzhou, Zhejiang
C-5Gan pingQuzhou, Zhejiang
C-6Man tou hongTaizhou, Zhejiang
C-7, C-8, C-9Cha zhi ganXinhui, Puning and Jieyang, Guangdong
C-10, C-11Cha zhi ganQinzhou and Guiping, Guangxi
C-12Lu ganFuzhou, Fujian
C-13Fu juFuzhou, Fujian
C-14American Tang juLongyan, Fujian
C-15PonkanTujia and Miao Autonomous Prefecture, Hunan
C-16Nan feng mi juYichang, Hubei
C-17Guo qing No. 1Yichang, Hubei
C-18Si ji hongYichang, Hubei
C-19Hong juWanzhou, Chongqing
Table 2. The accuracy of discriminant analysis models for different Chenpi varieties.
ModelsPretreatmentsZFZF
Training Set (%)Validation Set (%)Prediction Set (%)Training Set (%)Validation Set (%)Prediction Set (%)Training Set (%)Validation Set (%)Prediction Set (%)
PLS-DARAW86.8185.3879.4490.1489.1290.5686.2586.1985.28
MSC90.5686.7985.5691.1191.0191.6787.6484.4484.17
D193.3388.2387.7892.3689.2490.5692.5790.2890.28
D296.6791.2490.0087.7884.6783.8989.3883.3383.89
SG87.2284.1780.5691.2590.1491.6786.0484.3485.28
SNV90.4286.4285.5690.1490.0087.7888.1285.5685.28
SVMRAW93.1987.3384.4486.3983.0676.6783.7581.2480.00
MSC91.6784.3785.0084.4482.2481.1183.1382.5678.89
D196.8190.2888.3398.1993.3692.2297.5793.7994.44
D297.6488.6787.2299.4486.3485.5699.0393.0492.22
SG90.8385.0083.3381.8174.5673.3379.5878.5674.44
SNV99.5895.8490.5699.8695.6694.4498.8291.3992.78
MLPRAW90.0085.7682.7870.9670.1270.5676.6075.6771.94
MSC86.1180.1280.5665.2864.3662.7873.8272.2270.28
D1100.093.2492.7899.7294.1293.3398.6894.1294.72
D297.9293.4592.2281.6780.3377.2284.7283.3381.39
SG81.8175.6773.3365.1463.4462.2261.4660.3954.44
SNV94.3187.4285.0094.4489.3386.1184.3182.1283.06
CNNRAW99.7085.5683.3398.0890.2388.3399.1898.6796.39
Table 3. The accuracy of discriminant analysis models for different “Cha zhi gan” Chenpi origins.
ModelsPretreatmentsZFZF
Training Set (%)Validation Set (%)Prediction Set (%)Training Set (%)Validation Set (%)Prediction Set (%)Training Set (%)Validation Set (%)Prediction Set (%)
PLS-DARAW90.8385.4286.6796.6792.4283.3385.8381.4283.33
MSC96.2595.0088.3393.7591.6793.3387.2985.8382.50
D198.9798.3393.3395.0093.6791.6796.2591.6790.83
D298.7595.7596.6788.3382.5085.0096.0492.4290.83
SG88.3387.2983.3390.4289.3385.0085.4282.5085.00
SNV95.8392.8390.0097.0887.4285.0085.4281.6383.33
SVMRAW84.1783.6783.3385.8383.3376.6781.0479.5879.17
MSC85.0080.0078.3382.9281.6778.3381.8775.0077.50
D192.0886.6785.0096.6789.0285.0093.5490.2186.67
D292.0888.3391.6795.0084.5887.2993.1384.7985.00
SG82.5080.3378.3382.9276.6775.0076.4674.3875.00
SNV98.7593.7591.6799.1795.4295.0097.9295.6394.17
MLPRAW78.3375.0076.6773.7572.3370.0092.0890.3385.83
MSC78.7573.3370.0090.8390.0080.0095.8390.7987.50
D195.0092.7595.0093.3385.8380.0099.3895.7591.67
D298.7591.6793.3388.3387.6783.3398.7590.1791.67
SG80.8372.6770.0073.3372.4271.6798.7586.6784.17
SNV81.6778.7576.6792.0885.3378.3395.8382.5083.33
CNNRAW83.3378.3380.0077.5076.6775.0089.0087.9085.83
Table 4. The accuracy of optimal classification model for Chenpi varieties and origins based on feature wavelength selection using different methods.
ModelsMethodsNumberTraining
Set (%)
Validation
Set (%)
Prediction
Set (%)
ZF-CNNSPA3877.1974.4473.06
CARS5788.6786.7885.00
Z-D2-PLSDASPA2076.6772.3471.67
CARS4192.9292.6791.67
Disclaimer/Publisher’s Note: The statements, opinions and data contained in all publications are solely those of the individual author(s) and contributor(s) and not of MDPI and/or the editor(s). MDPI and/or the editor(s) disclaim responsibility for any injury to people or property resulting from any ideas, methods, instructions or products referred to in the content.

