1. Introduction
Rice, as one of major food crops in the world, has a direct impact on consumer health and food security. Milling quality is a crucial indicator for rice milling performance evaluation, which is also a crucial indicator for rice quality evaluation. Rice milling quality primarily includes brown rice rate (BRR), milled rice rate (MRR), and head rice rate (HRR). During rice processing, the brown rice or paddy undergoes a series of steps, including hulling, milling, polishing, grading, and packaging, before being stored, distributed, and sold. Typically, when processing 100 kg of paddy, about 20% is separated as husk, leaving 80% as brown rice. Further milling of the brown rice results in approximately 10% bran and 70% milled rice [
1]. The milled rice consists of a mixture of head rice and broken grains. High-quality milled rice requires that the proportion of broken grains in head rice does not exceed 4% [
1]. Thus, only about 66% of the original paddy is suitable for consumption.
Head rice generally holds a higher economic value, while broken rice is commonly used in various processed products. Maintaining milling quality is essential for preserving the market value and usability of rice. Monitoring the degree of milling and minimizing the proportion of broken rice are crucial for reducing economic losses [
2].
Traditional methods to assess rice milling quality, including manual sensory evaluation, chemical analysis, and physical indicator measurements, are often limited by a low efficiency, high operational complexity, and subjectivity. These approaches tend to be time-consuming, labor-intensive, and error-prone, making them inadequate for modern agricultural production and processing demands [
3,
4]. Conventional visual inspection methods exhibit limitations in distinguishing visually similar rice varieties, making it difficult to accurately identify quality differences, thereby affecting the quality control of the final product [
5]. To overcome these shortcomings of traditional techniques, various spectral and imaging technologies, such as hyperspectral imaging (HSI), near-infrared spectroscopy, thermal imaging [
6], and laser backscattering imaging, have been successfully applied to rice quality detection, significantly improving its accuracy and efficiency [
7].
Hyperspectral imaging (HSI) has emerged as a rapid, nondestructive, and highly efficient detection tool, demonstrating substantial potential in agricultural product quality assessment [
8]. This technology can simultaneously capture the spatial and spectral information of the tested object, enabling a comprehensive analysis of both internal composition and external characteristics. By analyzing the unique spectral signatures of materials, HSI has been widely validated for its effectiveness in agricultural and food quality detection [
9]. A single scan enables the simultaneous acquisition of multi-dimensional data with a significantly higher efficiency than conventional chemical methods. Chen et al. proposed a hyperspectral imaging (HSI)-based method to quantify residual bran on milled rice grains, achieving a 93.5% accuracy in mapping bran distribution patterns [
10].
Both traditional machine learning and deep learning techniques have achieved remarkable results in the field of rice quality detection using hyperspectral imaging. By leveraging the rich spectral information provided by hyperspectral imaging (HSI) technology, machine learning models can achieve the high-precision prediction of agricultural product quality attributes, demonstrating excellent performance in terms of accuracy and reliability for quality assessment. Yang et al. [
9] employed an optimization approach combining cross-validation and grid search to construct an efficient CatBoost model, which achieved an accuracy of 91.31% in predicting the degree of milling (DOM) of rice. Meanwhile, as an advanced branch of machine learning, deep learning has exhibited outstanding performance in tasks such as image classification and object detection due to its capability for automatic feature extraction [
11]. In particular, convolutional neural networks (CNNs) can directly learn multi-level feature representations from raw hyperspectral data without manual intervention, thereby effectively uncovering latent information within the data. Emerging deep learning technology brings new opportunities for effectively processing massive and diverse data from seeds and evaluating their quality [
12]. Prabahar et al. [
13] demonstrated that a CNN combined with near-infrared (NIR) spectroscopy can effectively screen rice quality. Their results showed that CNN-based regression models achieved more accurate quantitative estimations of amylose content and chalkiness compared to traditional regression approaches.
Current research on rice milling quality prediction primarily focuses on single-task detection, predicting an object one time (e.g., head rice rate), while an in-depth exploration of multi-task joint detection remains lacking [
14]. Multi-task refers to the simultaneous detection of multiple objects. In reality, milling quality is a multi-dimensional composite metric involving multiple interrelated parameters, including brown rice rate, milled rice rate, and head rice rate. These parameters are not independent but may exhibit complex nonlinear relationships. Therefore, developing a multi-task joint detection method based on hyperspectral imaging and deep learning holds significant importance for achieving a comprehensive, accurate, and nondestructive assessment of rice milling quality. Such an approach not only improves detection efficiency and reduces computational costs [
15] but also provides more holistic data support for quality control in rice processing.
This study aims to explore the feasibility of using hyperspectral imaging technology to simultaneously predict rice milling quality attributes (BRR, MRR, and HRR). By collecting hyperspectral images of different rice varieties under different treatments, the quantitative models between milling quality attributes and spectral features are established, providing a theoretical foundation and technical support for the rapid, nondestructive detection of rice milling quality. The specific objectives are (1) to develop single-task models—including Partial Least Squares Regression (PLSR), Support Vector Regression (SVR), Backpropagation Neural Networks (BPNNs), and Convolutional Neural Networks (CNNs), with each model predicting one quality indicator; (2) to construct multi-task models (PLSR, BPNN, and CNN) and a multi-output SVR for the simultaneous prediction of all three quality indicators, BRR, MRR, and HRR; (3) to employ SHapley Additive exPlanations (SHAP) for BPNNs’ visualization and interpretability analysis, enhancing understanding of the decision-making process of the models.
2. Materials and Methods
2.1. Materials and Experimental Design
Two japonica rice cultivars, Xiushui121 and Zhehujing26, were used in this study. Field experiments were conducted at the Balidian Experimental Station of the Huzhou Academy of Agricultural Sciences (30°48′36″ N, 120°11′24″ E) and Jianliang Family Farm (30°51′54″ N, 120°05′56″ E) in the Wuxing district of Huzhou, China, in 2023. The soil type at both sites was clay. The experimental design employed a split plot arrangement, with nitrogen fertilizer treatment as the main plot and variety as the subplot. There were three replicates for each treatment in Balidian Station and one replicate for each treatment in Jianliang Farm, respectively. A total of 16 treatments were established in two sites, with detailed information listed in
Table S1 (in the Supplementary Materials). The topdressing fertilizers were applied at the tillering stage (I, 30 June 2023), panicle initiation stage (II, 9 August 2023), and booting stage (III, 18 August 2023), respectively.
At the rice maturity stage, approximately 100 continuous panicles in a row were collected in each plot. Then, the sample grains were dried naturally by sunlight. Then, the seeds of these panicles were threshed and mixed thoroughly. The seeds were then divided into five samples. In all, 240 samples (5 samples × 8 treatments × 2 varieties × 3 three replicates) and 80 samples (5 samples × 8 treatments × 2 varieties × 1 replicate) were obtained from Balidian Station and Jianliang Farm, respectively. Thus, a total of 320 samples were obtained in this study. However, hyperspectral images of 15 samples were missing due to machine issues, and only 305 samples were used for further analysis. In each sample, about 20 g of rice seeds was used for hyperspectral image acquisition and milling quality measurement.
2.2. Measurement of Rice Milling Quality Indicators
The BRR, MRR, and HRR are the key indicators of rice milling quality, and primary factors influencing its market price. These indicators were determined according to the methods of Dou et al. [
16] with a minor modification. Approximately 20 g of paddy rice was dehulled to produce brown rice using a rice huller (JLG-IIA, Zhongchuliang, Chengdu, China). The milled rice was obtained from the brown rice using a milled rice machine (JNM-III, Zhongchuliang, Chengdu, China). The head rice was defined as that whose grain volume was over 3/4 of an intact grain body, and the assessment was conducted manually.
2.3. Hyperspectral Image Acquisition
The hyperspectral imaging system consisted of a camera, light source, motorized translation stage, and a computer. In this experiment, the hyperspectral camera (FX17, SPECIM, Oulu, Finland) acquired hyperspectral images in the near-infrared range (900–1700 nm). Rice seed samples were placed on the motorized stage at a distance of 30 cm from the camera. During the hyperspectral images’ collection, the stage moved at a constant speed of 26.3 mm·s−1. The hyperspectral images’ acquisition was controlled using the LUMO Scanner software 2020 (SPECIM, Oulu, Finland).
Spectral data from about 200 seeds were extracted from one hyperspectral image. For each sample, 5–7 hyperspectral images were acquired. To mitigate the effects of uneven illumination, lens transmission variations, and dark current noise from the camera, white and dark reference corrections were applied to the hyperspectral images prior to spectral extraction. The dark reference image (reflectance ≈ 0%) was acquired by covering the lens with its cap, while the white reference image (reflectance ≈ 100%) was obtained using a white Teflon board. The reflectance (R) was calculated using Equation (1):
where
R is the corrected reflectance data,
I is the raw intensity data,
D is the dark reference data, and
W is the white reference data.
2.4. Spectral Extraction
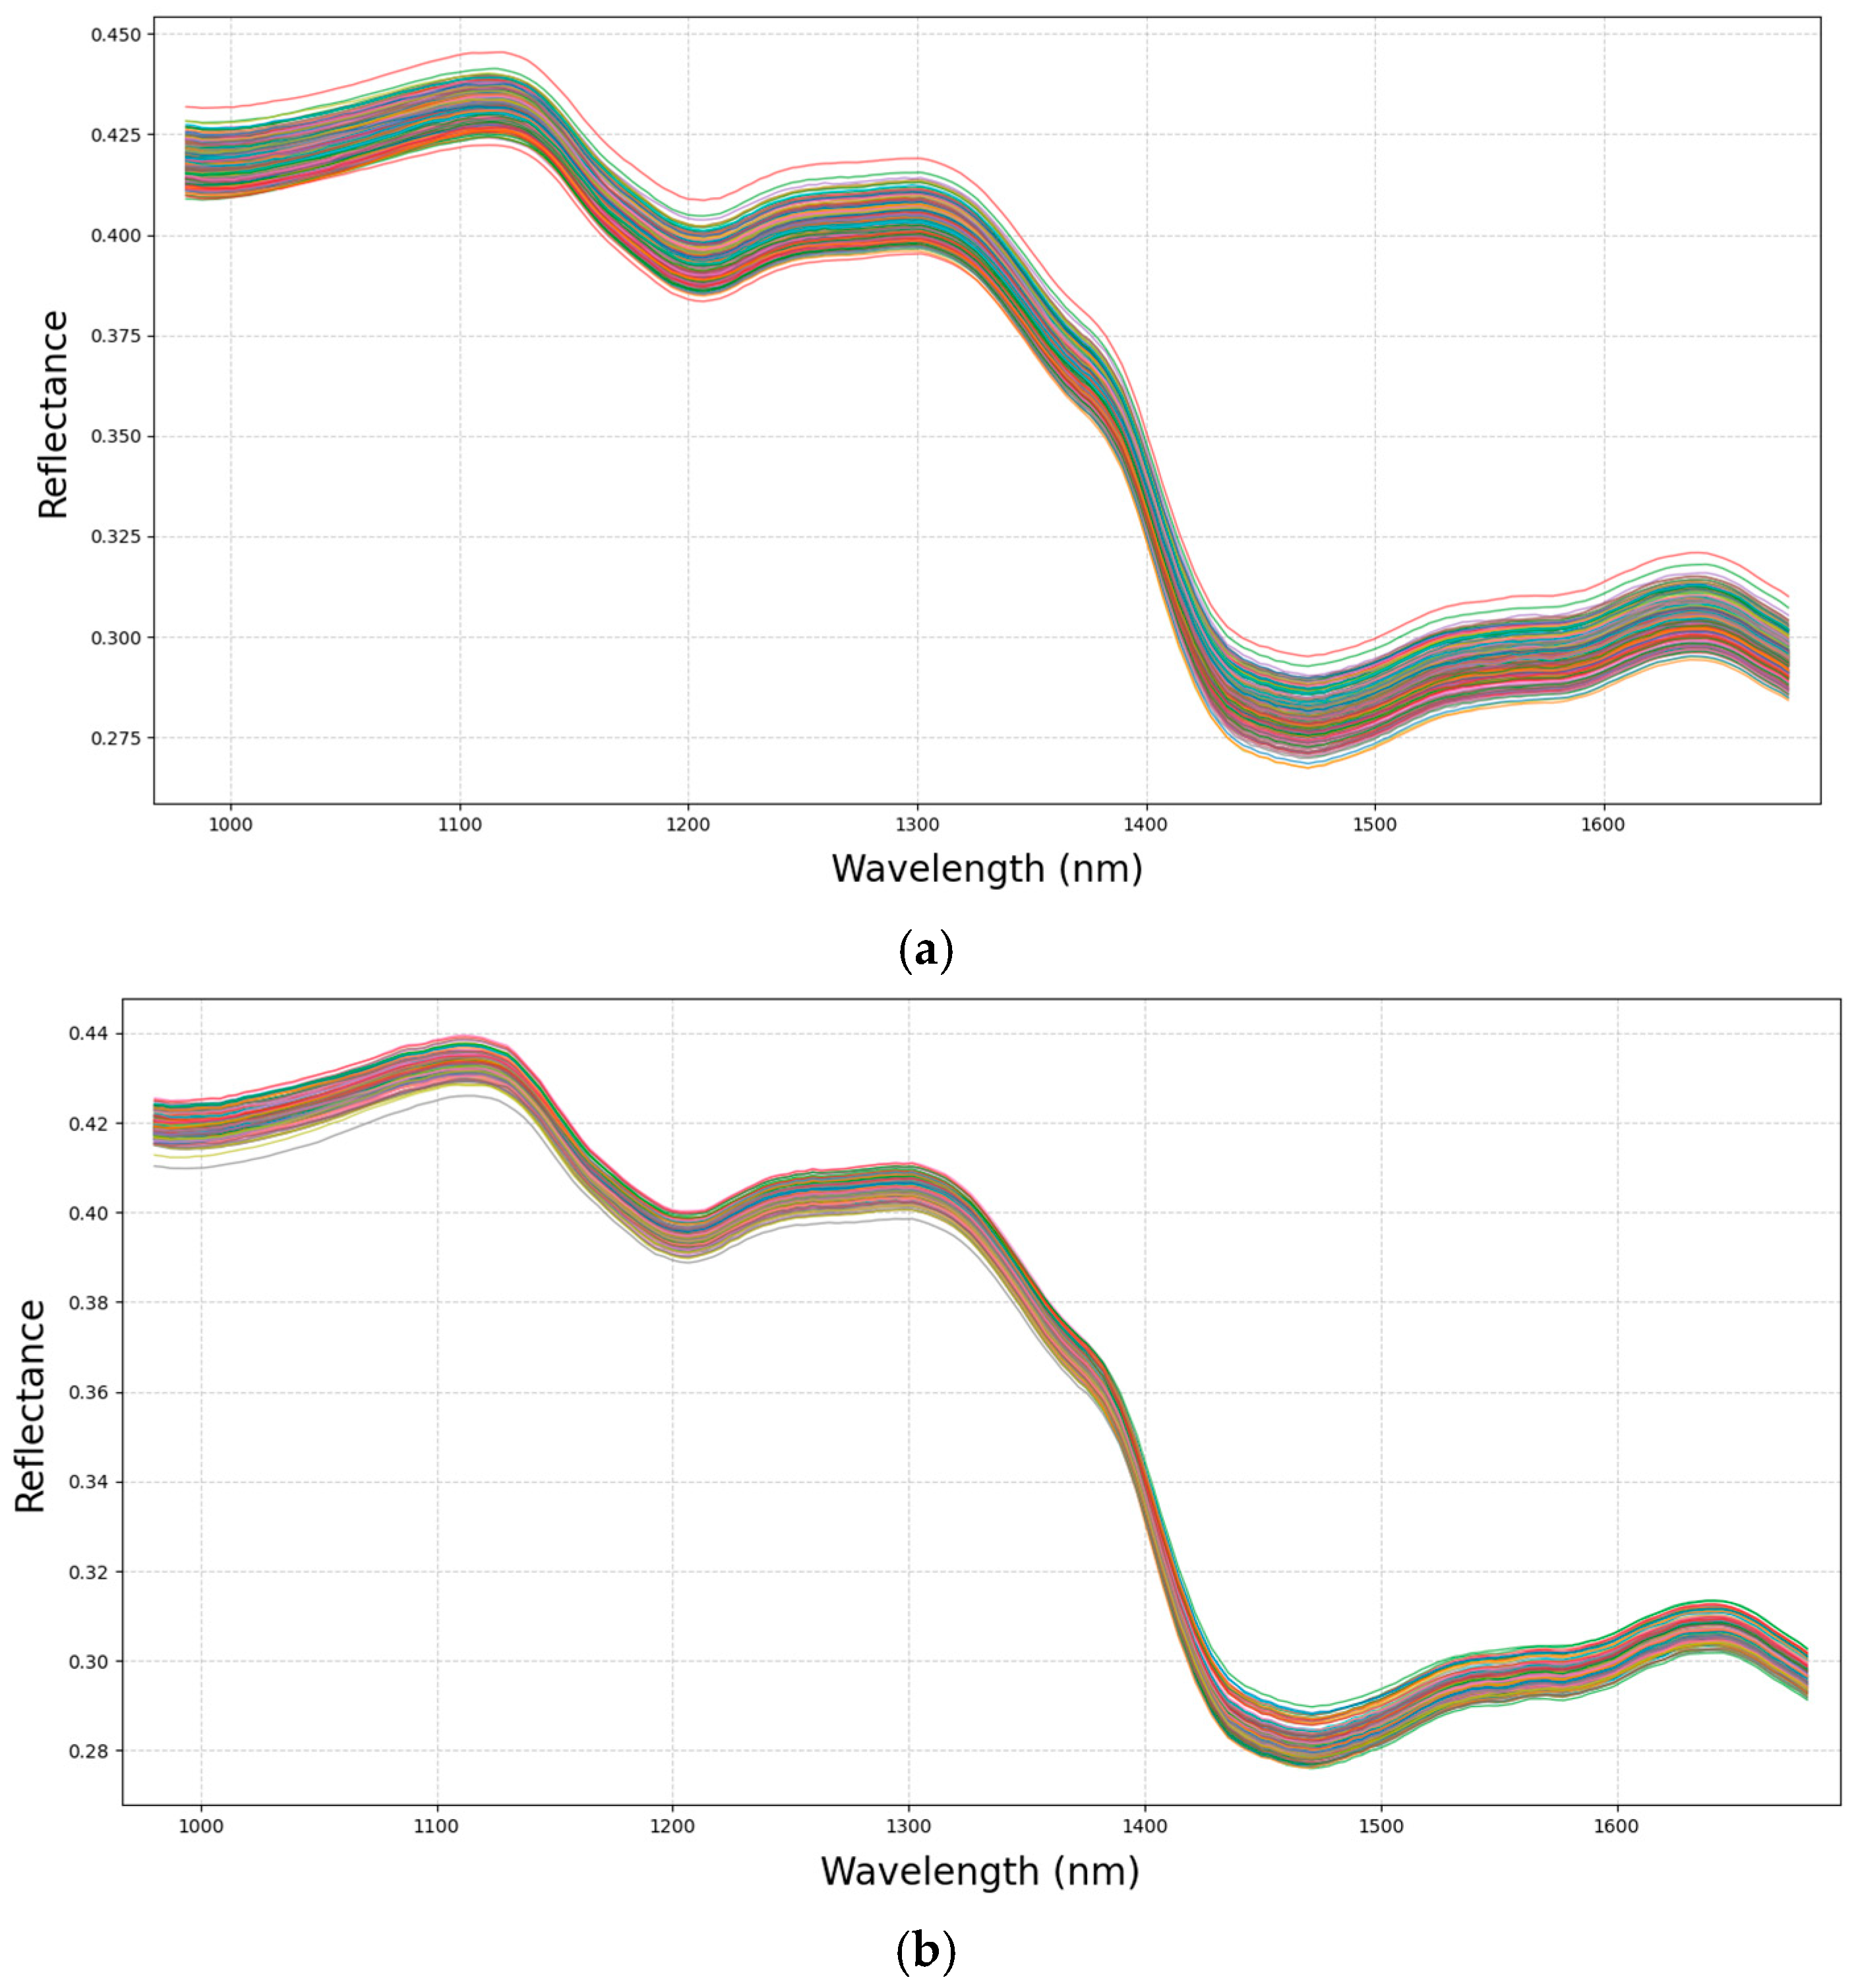
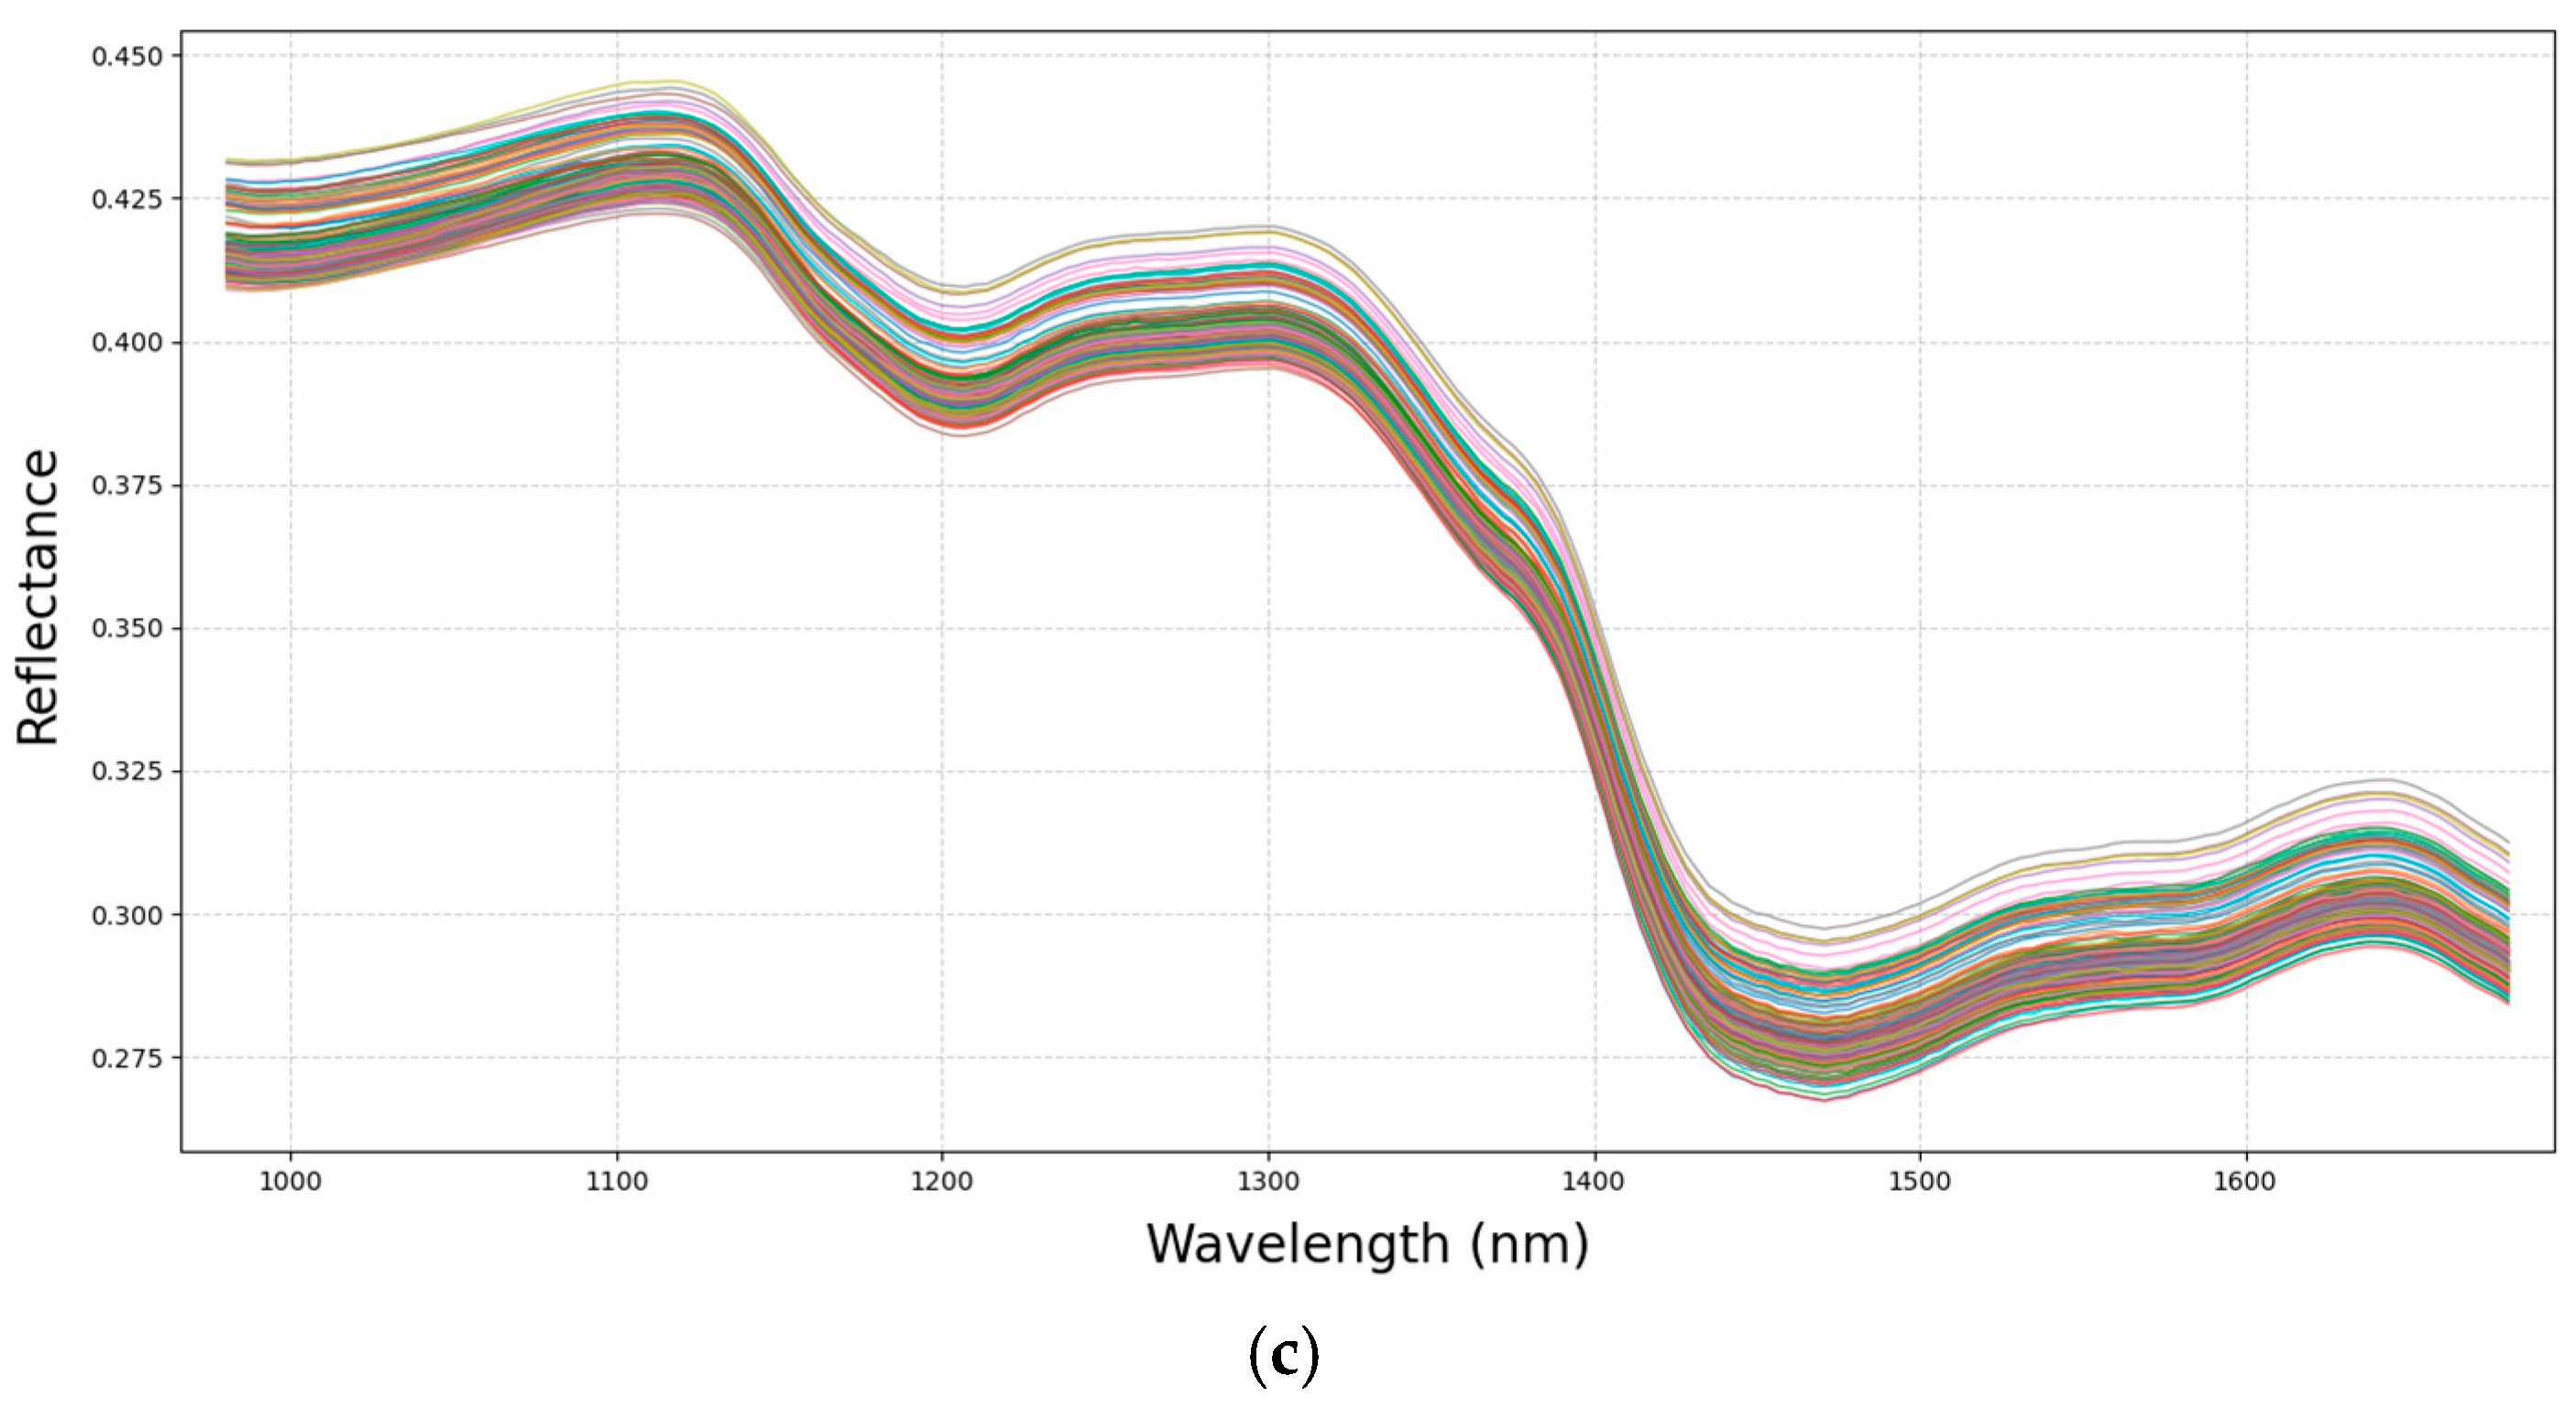
During the acquisition of hyperspectral images, a corresponding RGB image with the same spatial size was also generated. Due to the fact that the seeds and the black background showed significant color differences, the RGB images were binarized to obtain a mask. In the mask, 8 connected neighborhoods were used to determine whether pixels belonged to the same region. The foreign materials (dust or others) in the masks were successfully removed by filtering all regions with a number of pixels less than 100. Finally, in the mask, each connected region represented a seed. Image masks were then applied to the hyperspectral images to separate the seed samples from the background. The spectral information of individual seeds was extracted according to the acquisition sequence, with the entire area of each seed defined as the region of interest (ROI). Each pixel within the area contained a spectrum. Finally, the average spectrum of each seed was derived by computing the average values of the spectra of all pixels within the ROI. There were five to seven hyperspectral images of each sample, and the spectra of all the seeds in one sample was averaged to one spectrum representing the sample. Thus, a total of 305 spectra were obtained for the 305 samples.
The raw spectral curves exhibited uninformative wavelengths at both ends, likely due to instrumental and environmental factors during measurement. To enhance the subsequent analysis and improve the modeling performance, preprocessing of the raw spectral data was necessary. In this study, the noisy bands at both ends of the spectrum were selectively removed before the spectral extraction based on the preview of the seed spectral profiles. The first 13 spectral bands at the beginning of the spectra (below 980 nm) and the last 11 bands at end of the original spectra (beyond 1684 nm) were excluded, resulting in an effective spectral range of 980–1684 nm for further analysis. The remaining spectra contained 200 bands.
2.5. Regression Analysis Methods
To build the regression models, the independent variable X consisted of spectral data, and the dependent variables Y were the three quality indicators: BRR, HRR, and MRR. The regression models were built without special labels.
2.5.1. Partial Least Squares Regression
Partial Least Squares Regression (PLSR) is a multivariate statistical data analysis method capable of performing regression modeling (multivariate linear regression), data structure simplification (principal component analysis), and correlation analysis between variable sets (canonical correlation analysis). By projecting high-dimensional data spaces of both independent and dependent variables into corresponding low-dimensional spaces, it derives mutually orthogonal feature vectors for each, then establishes univariate linear regression relationships between these feature vectors [
6]. This approach not only addresses collinearity issues but also emphasizes the explanatory and predictive power of independent variables on dependent variables during feature selection, effectively eliminating noise irrelevant to the regression and resulting in models with minimal variables. Optimal parameters were selected using grid search and 10-fold cross-validation, with principal components optimized within the range of 1–20.
2.5.2. Support Vector Machine
Support Vector Machine (SVM) is a classical machine learning algorithm widely applied to classification and regression tasks. Its core concept involves constructing an optimal hyperplane for data classification or regression. SVM demonstrates excellent performance in handling high-dimensional data and nonlinear problems, particularly maintaining a strong generalization capability even with small sample sizes [
17]. Support Vector Regression (SVR), an extension of SVM for regression problems, aims to predict continuous values through the construction of regression functions. As a powerful regression tool, SVR has shown unique advantages in hyperspectral data analysis. It effectively processes high-dimensional, nonlinear spectral data and adapts flexibly to different data distributions through kernel functions. For parameter optimization, grid search and 10-fold cross-validation were employed on the validation set, with kernel function types including linear, radial basis function (rbf), and polynomial (poly). The regularization parameter ranged from 10
−7 to 10
7 across 14 orders of magnitude, while kernel coefficients used both ‘scale’ and ‘auto’ modes.
2.5.3. Backpropagation Neural Network
The Backpropagation Neural Network (BPNN) is a classic multilayer feedforward neural network widely used for pattern recognition and regression prediction tasks. The BPNN adjusts network weights and biases through the backpropagation algorithm, employing mean squared error (MSE) as the loss function to optimize model performance [
18]. In this study combining hyperspectral imaging with deep learning for the nondestructive detection of rice milling quality, the BPNN utilizes feature vectors extracted from hyperspectral data as input. Through nonlinear transformations across multiple hidden layers, it extracts spectral features and predicts key quality indicators (brown rice rate, milled rice rate, and head rice rate) at the output layer.
The BPNN architecture consists of two fully connected layers, including an input layer, hidden layer, and output layer. The input layer size was set to 200, with hidden layer dimensions of 1624 for brown rice rate prediction and 1024 for both milled rice rate and head rice rate predictions. For brown rice rate modeling, the training parameters included 6000 epochs, a batch size of 16, and a learning rate of 0.001. The milled rice rate and head rice rate models were trained for 5000 epochs, with a batch size of 32 and learning rate of 0.001. The Rectified Linear Unit (ReLU) activation function was employed in the hidden layers, and the Adam optimizer was utilized to enhance the regression’s prediction accuracy, thereby optimizing the prediction performance for rice milling quality.
During the training of BPNN models, the models and the corresponding results of each epoch were saved. After the training, the models with optimal performance were selected for further analysis.
2.5.4. Convolutional Neural Network
In the nondestructive detection of rice milling quality using hyperspectral imaging combined with deep learning, Convolutional Neural Networks (CNNs) can be applied not only for classification tasks but also for regression tasks to predict continuous variables of milling quality (brown rice rate, milled rice rate, and head rice rate). CNNs establish precise regression predictions by extracting features from hyperspectral data and learning the mapping relationships between these features and quality indicators [
19]. The CNN architecture primarily consists of the following key components: an input layer, convolutional layers, pooling layers, fully connected layers, and output layer. Compared with traditional spectral regression methods, CNNs demonstrate superior nonlinear modeling capabilities, enabling the automatic learning of complex features from high-dimensional spectral data to improve the accuracy and robustness of rice milling quality predictions.
CNNs can effectively implement multi-task learning by jointly optimizing correlations between multiple tasks, thereby enhancing model training efficiency. We designed a multi-output model where each output corresponds to a specific task, allowing the model to share underlying convolutional layers and feature extractors while generating separate prediction results for each task.
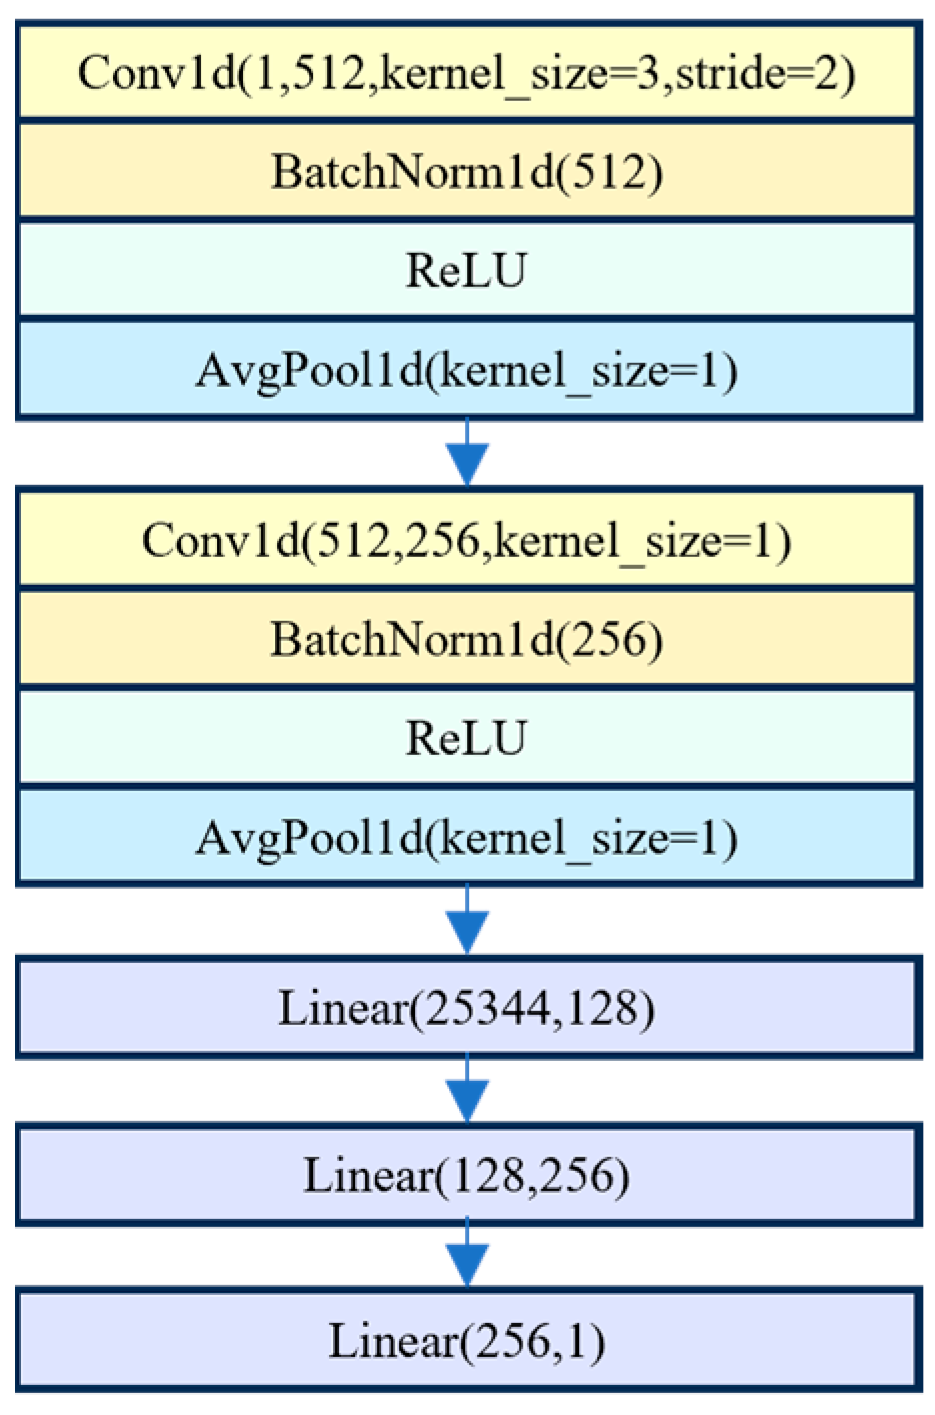
In this study, a one-dimensional CNN (1D-CNN) was used. For spectral data analysis using 1D-CNN, local features such as absorption peaks and changes in reflectance within a specific wavelength range could be identified by sliding along the spectra with a one-dimensional convolution kernel. The activation function and multi-layer stacked structure were used to construct a complex nonlinear mapping. Thus, 1D-CNN was used to extract localized spectral features and manage nonlinear spectral dependencies, even in the absence of spatial structure. The CNN model was constructed using the PyTorch 1.11.0 framework, with ReLU activation functions employed in the convolutional layers. The CNN model for predicting brown rice rate, milled rice rate, and head rice rate comprises five layers, including two convolutional layers and three fully connected layers. The overall architecture of the CNN model is illustrated in
Figure 1. The batch size was set to 8 for the brown rice rate prediction and 16 for both milled rice rate and head rice rate predictions. The learning rate (LR) was established at 0.001, with the Adam optimization algorithm employed to minimize loss during model training.
During the training of the CNN models, the models and the corresponding results of each epoch were saved. After the training, the models with optimal performance were selected for further analysis.
2.5.5. Multi-Task Learning
Multi-task learning (MTL) is a machine learning method that simultaneously optimizes multiple related tasks by sharing feature representations, thereby enhancing models’ generalization and prediction accuracy. In this study of nondestructive rice milling quality detection combining hyperspectral imaging and deep learning, an MTL framework was adopted to concurrently predict brown rice rate, milled rice rate, and head rice rate. This approach fully utilizes the multidimensional information in hyperspectral data to improve modeling performance. Four MTL methods were implemented:
Multi-Task PLSR: This method extracts latent factors from hyperspectral data through linear regression modeling while simultaneously predicting multiple target variables [
20]. During training, the number of principal components were optimized within the range of 1–20.
Multi-Output Support Vector Machine (Multi-Output SVM or Multi-Target SVM) extends the traditional SVM to address multi-output (multi-target) regression or classification problems [
21]. This approach is particularly suitable for scenarios requiring the simultaneous prediction of multiple correlated indicators with limited sample sizes.
Multi-Task BPNN: The BPNN utilizes a multilayer feedforward structure, optimizing weights for multiple target variables through error backpropagation, while learning correlations between different quality indicators to improve its nonlinear fitting performance [
22].
Multi-Task CNN: The CNN architecture employs convolutional layers to extract both local and global features from hyperspectral data, achieving the joint learning of multiple quality indicators through shared network structures. This approach effectively explores deep spectral features to enhance its prediction capability [
23].
Compared with single-task learning, MTL establishes connections among related quality indicators, reduces overfitting through information sharing, enhances model generalization, and delivers more stable and reliable predictions for rice milling quality. As for the multi-task learning models, mean squared error (MSE) was used as the loss function. The weights of the loss of the three tasks (the prediction of BRR, MRR, and HRR) were kept equal during the training, and the weights were not tuned.
2.6. SHAP Analysis
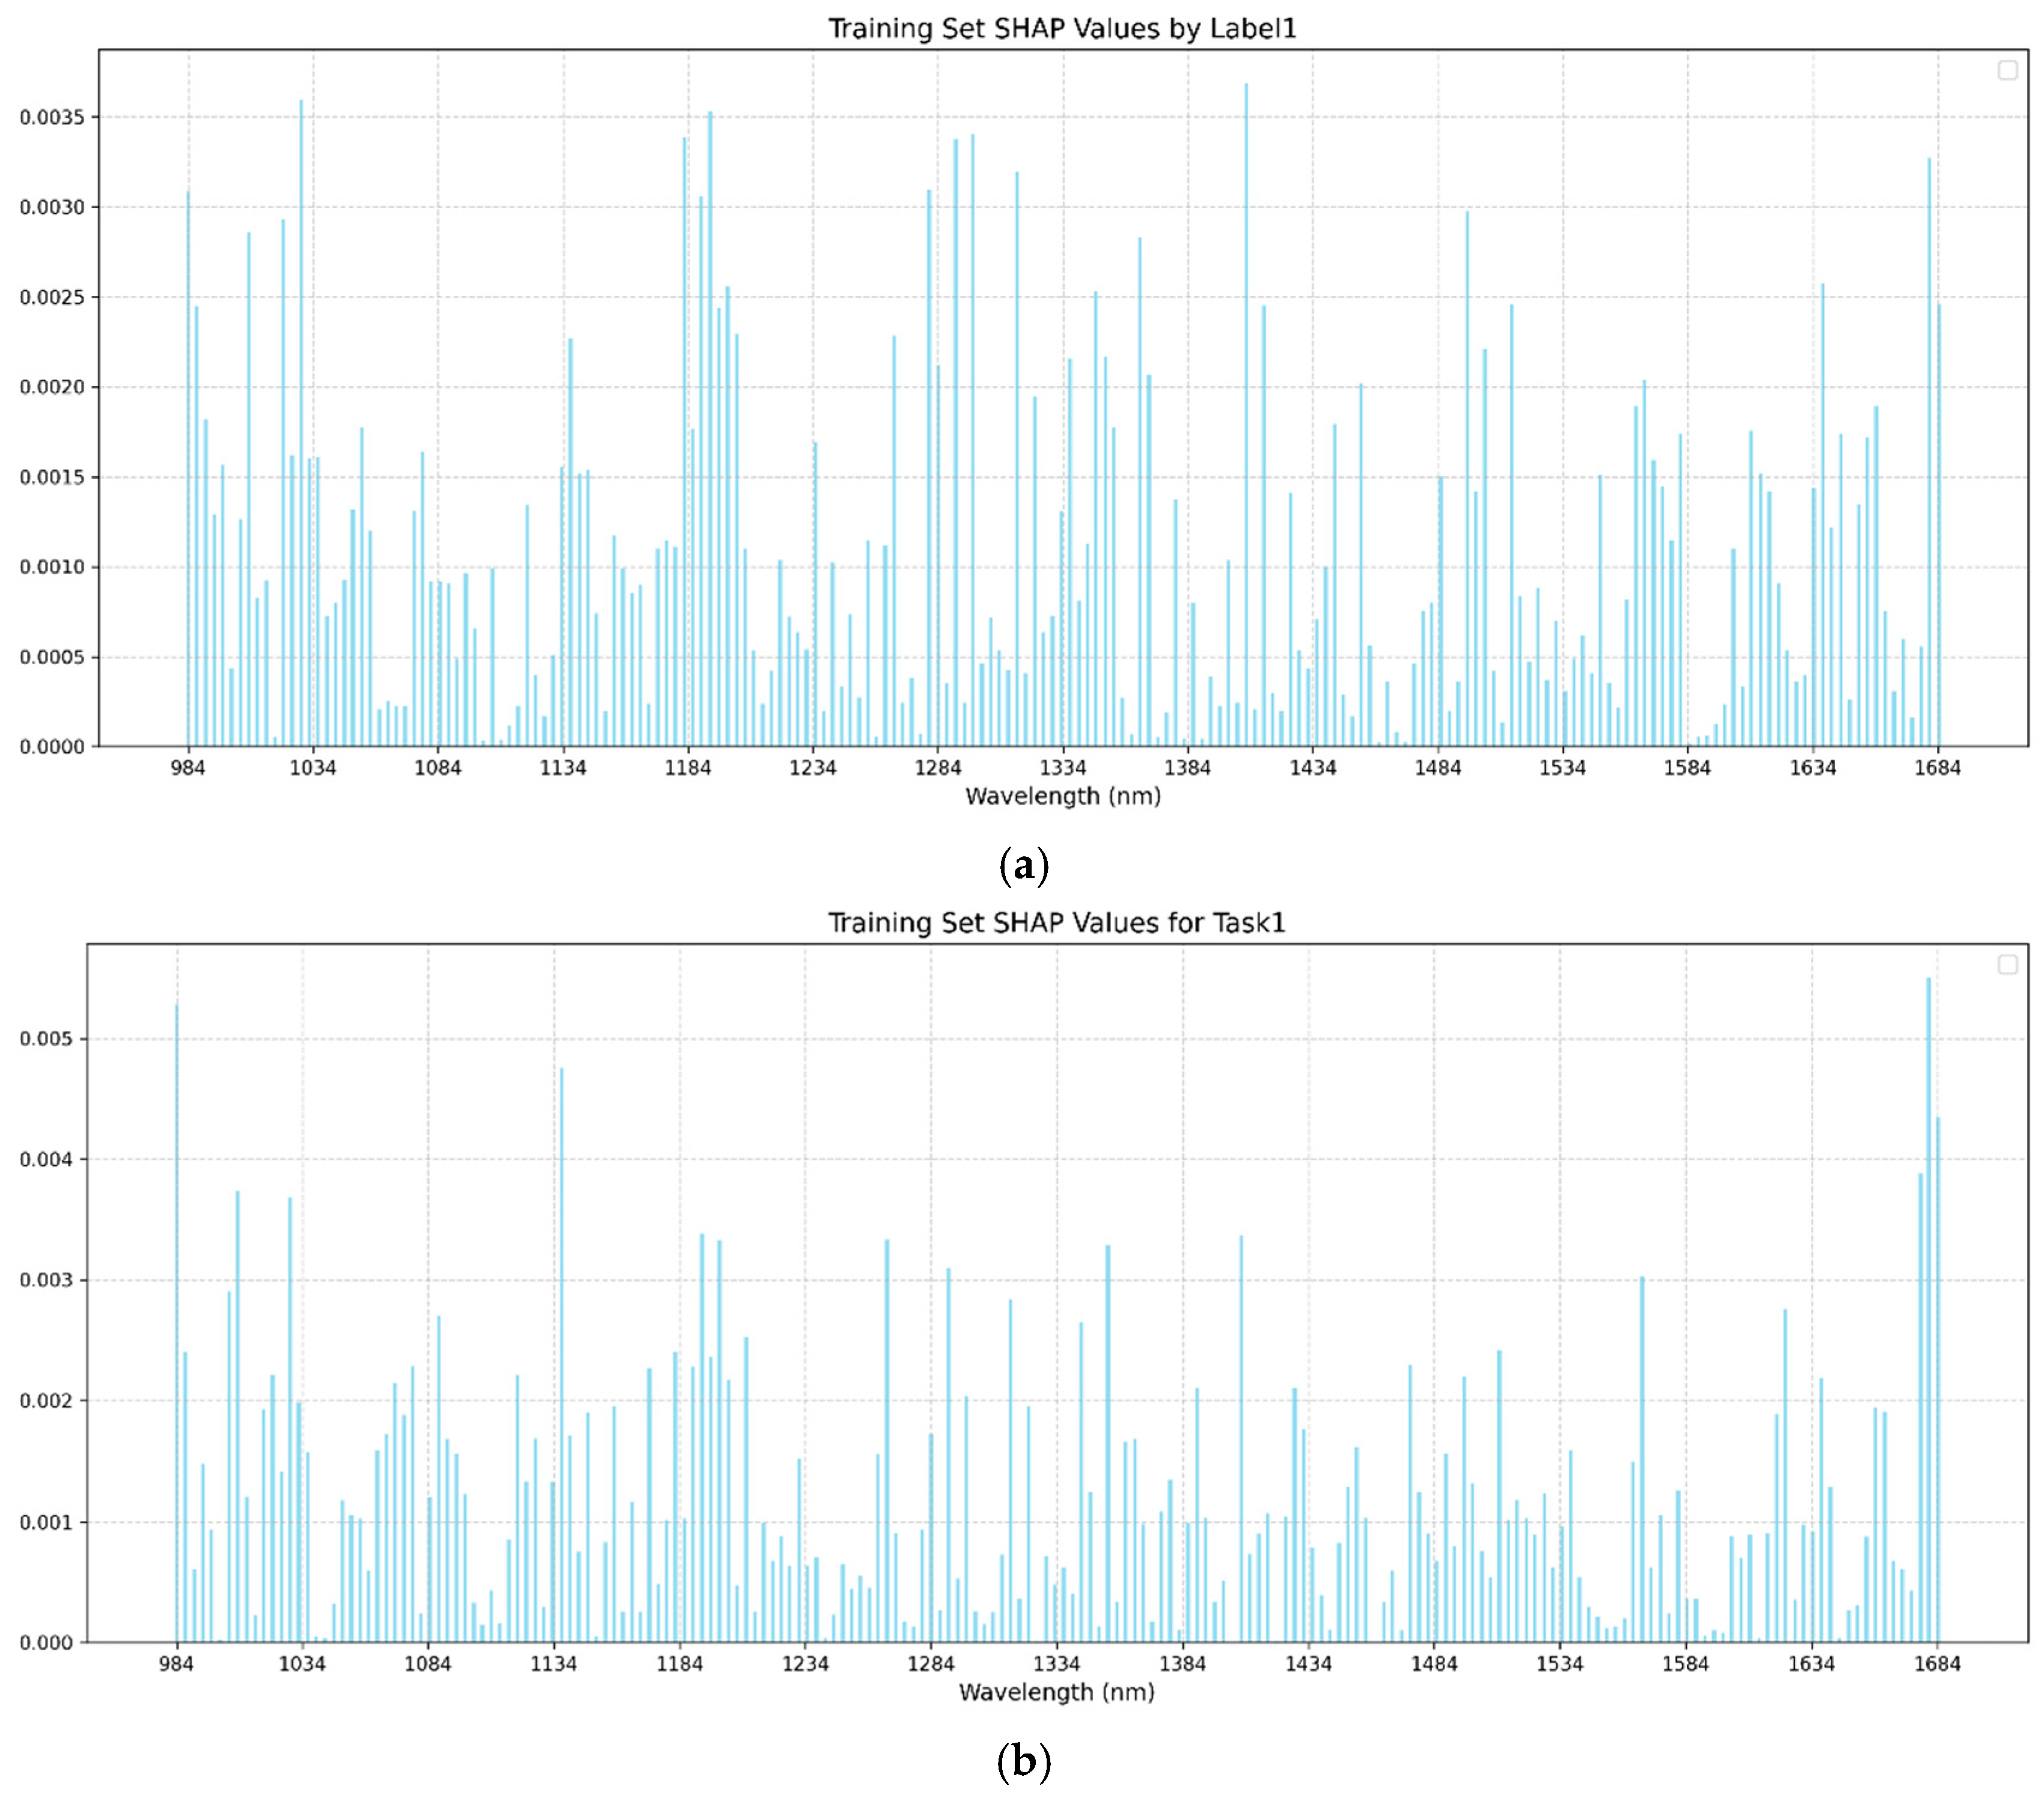
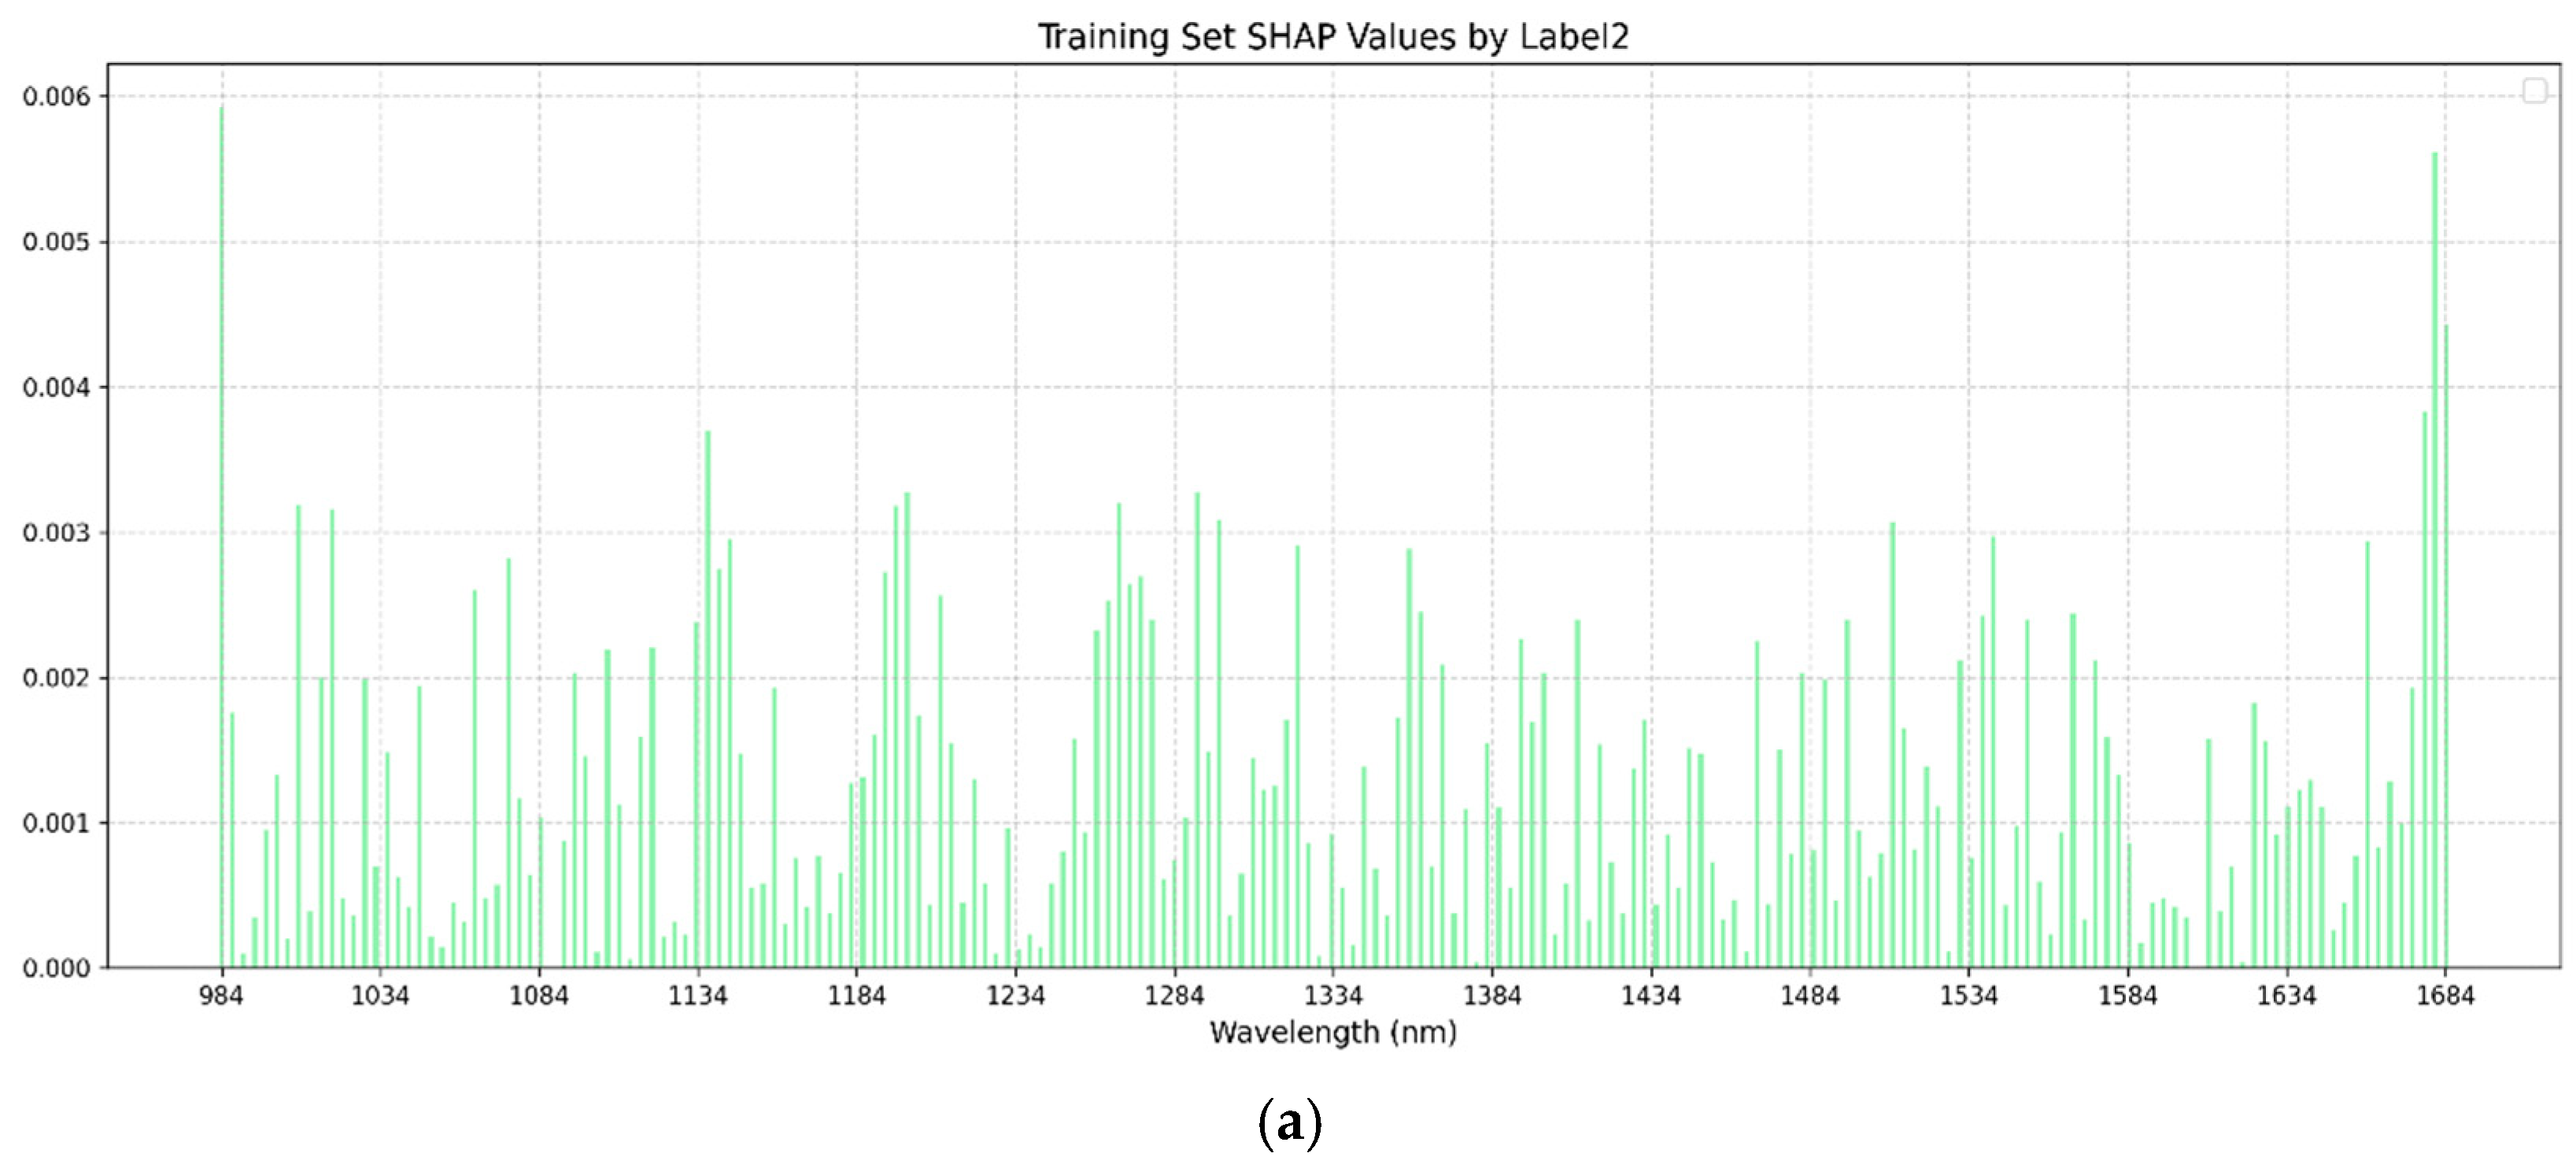
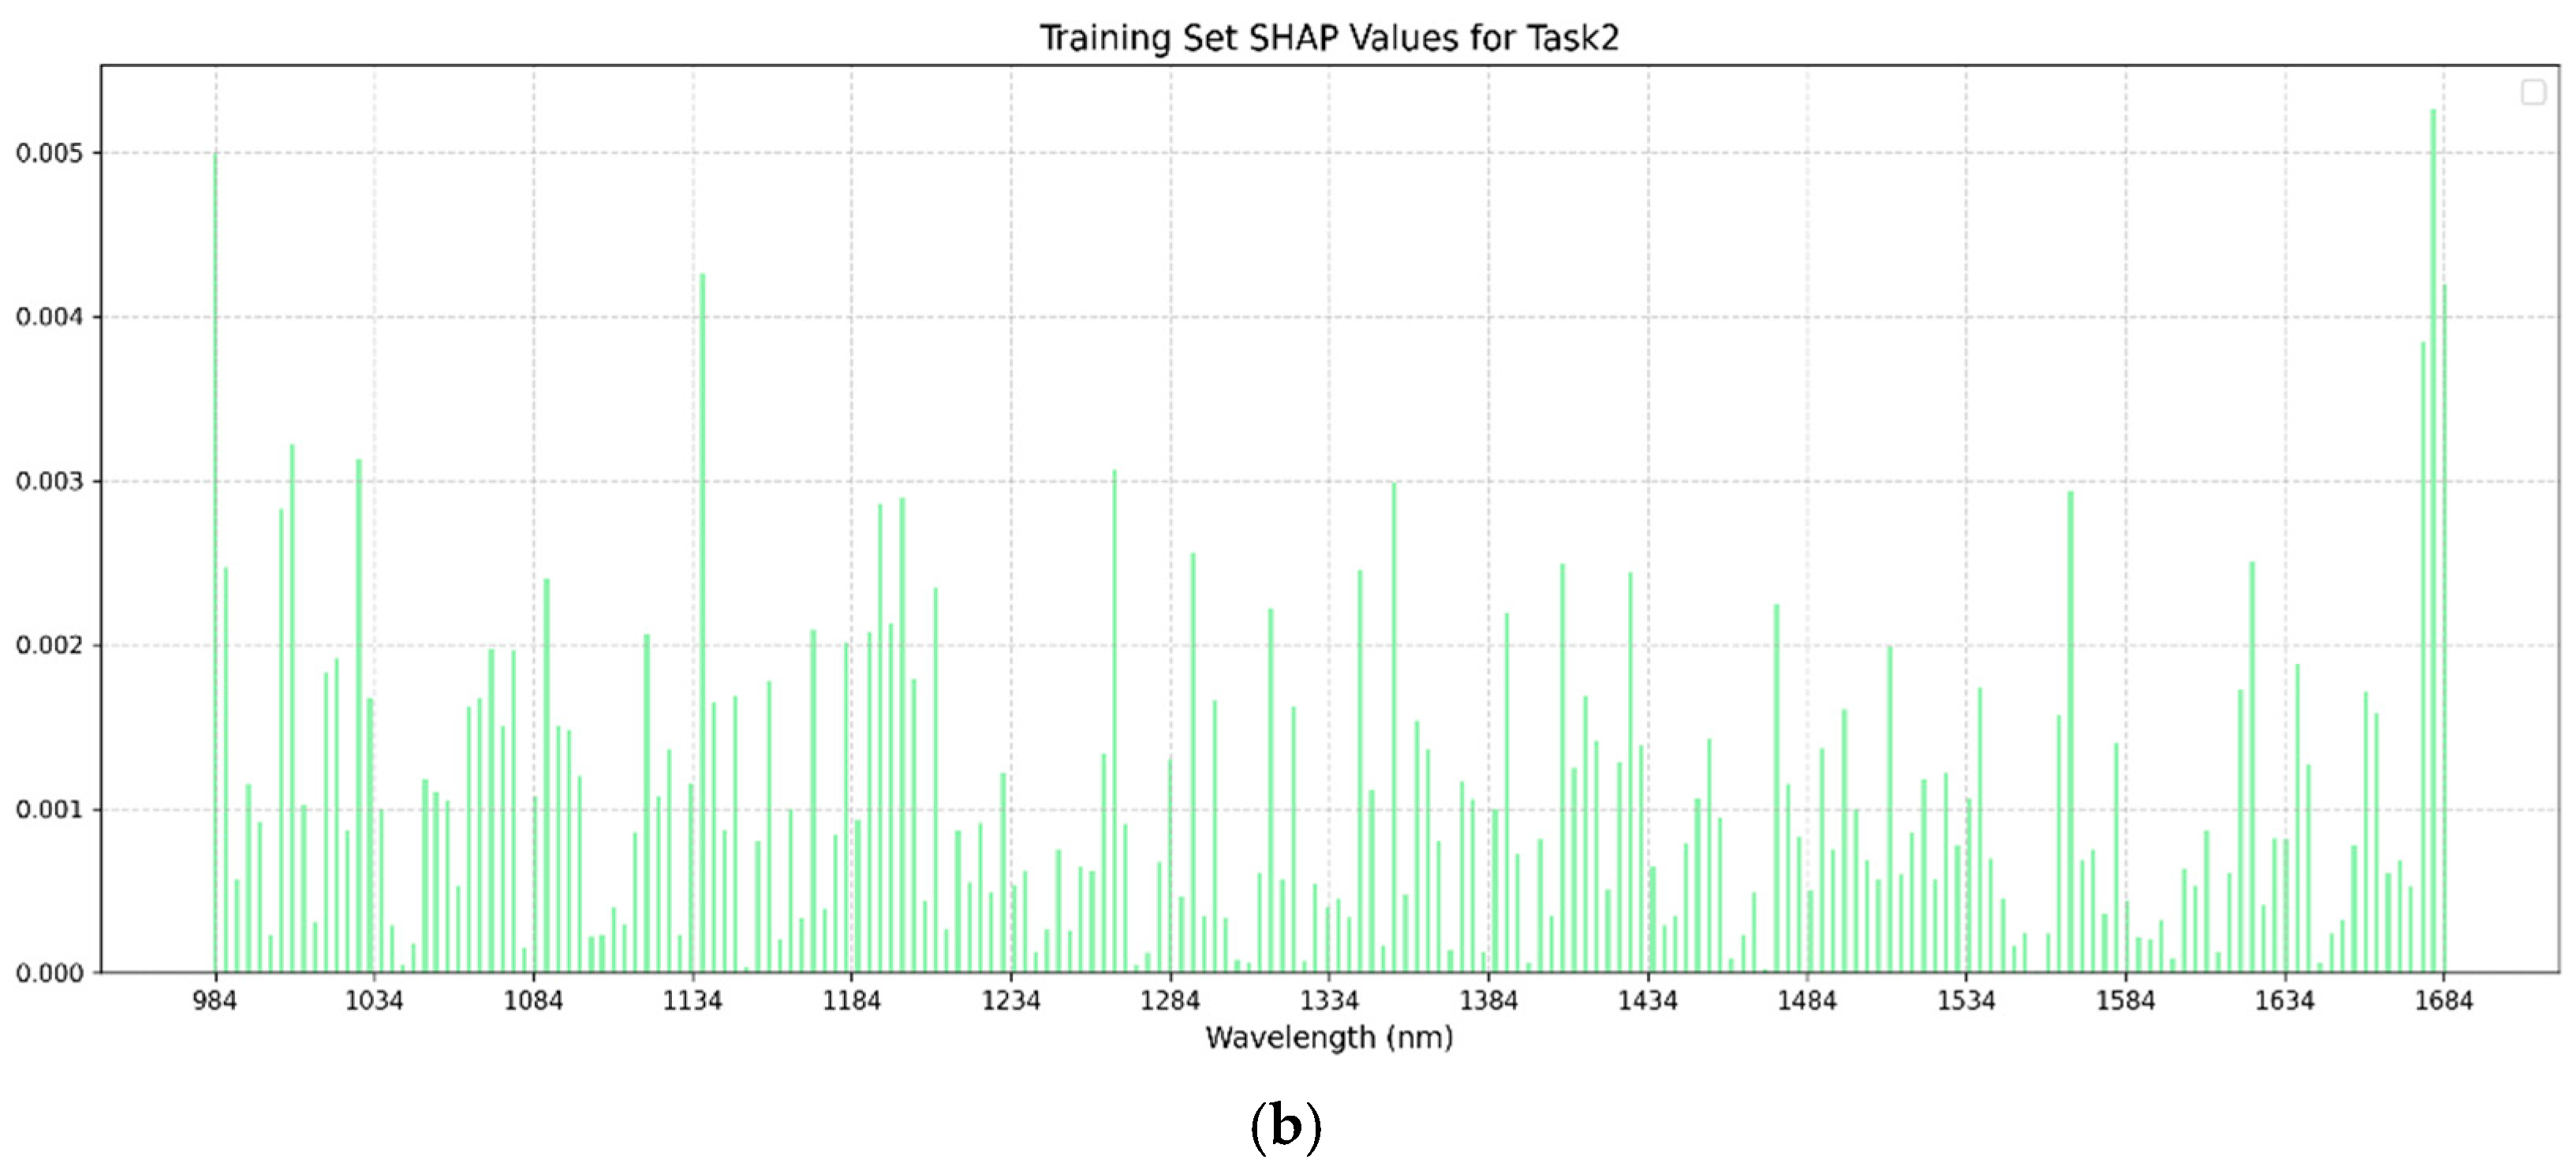
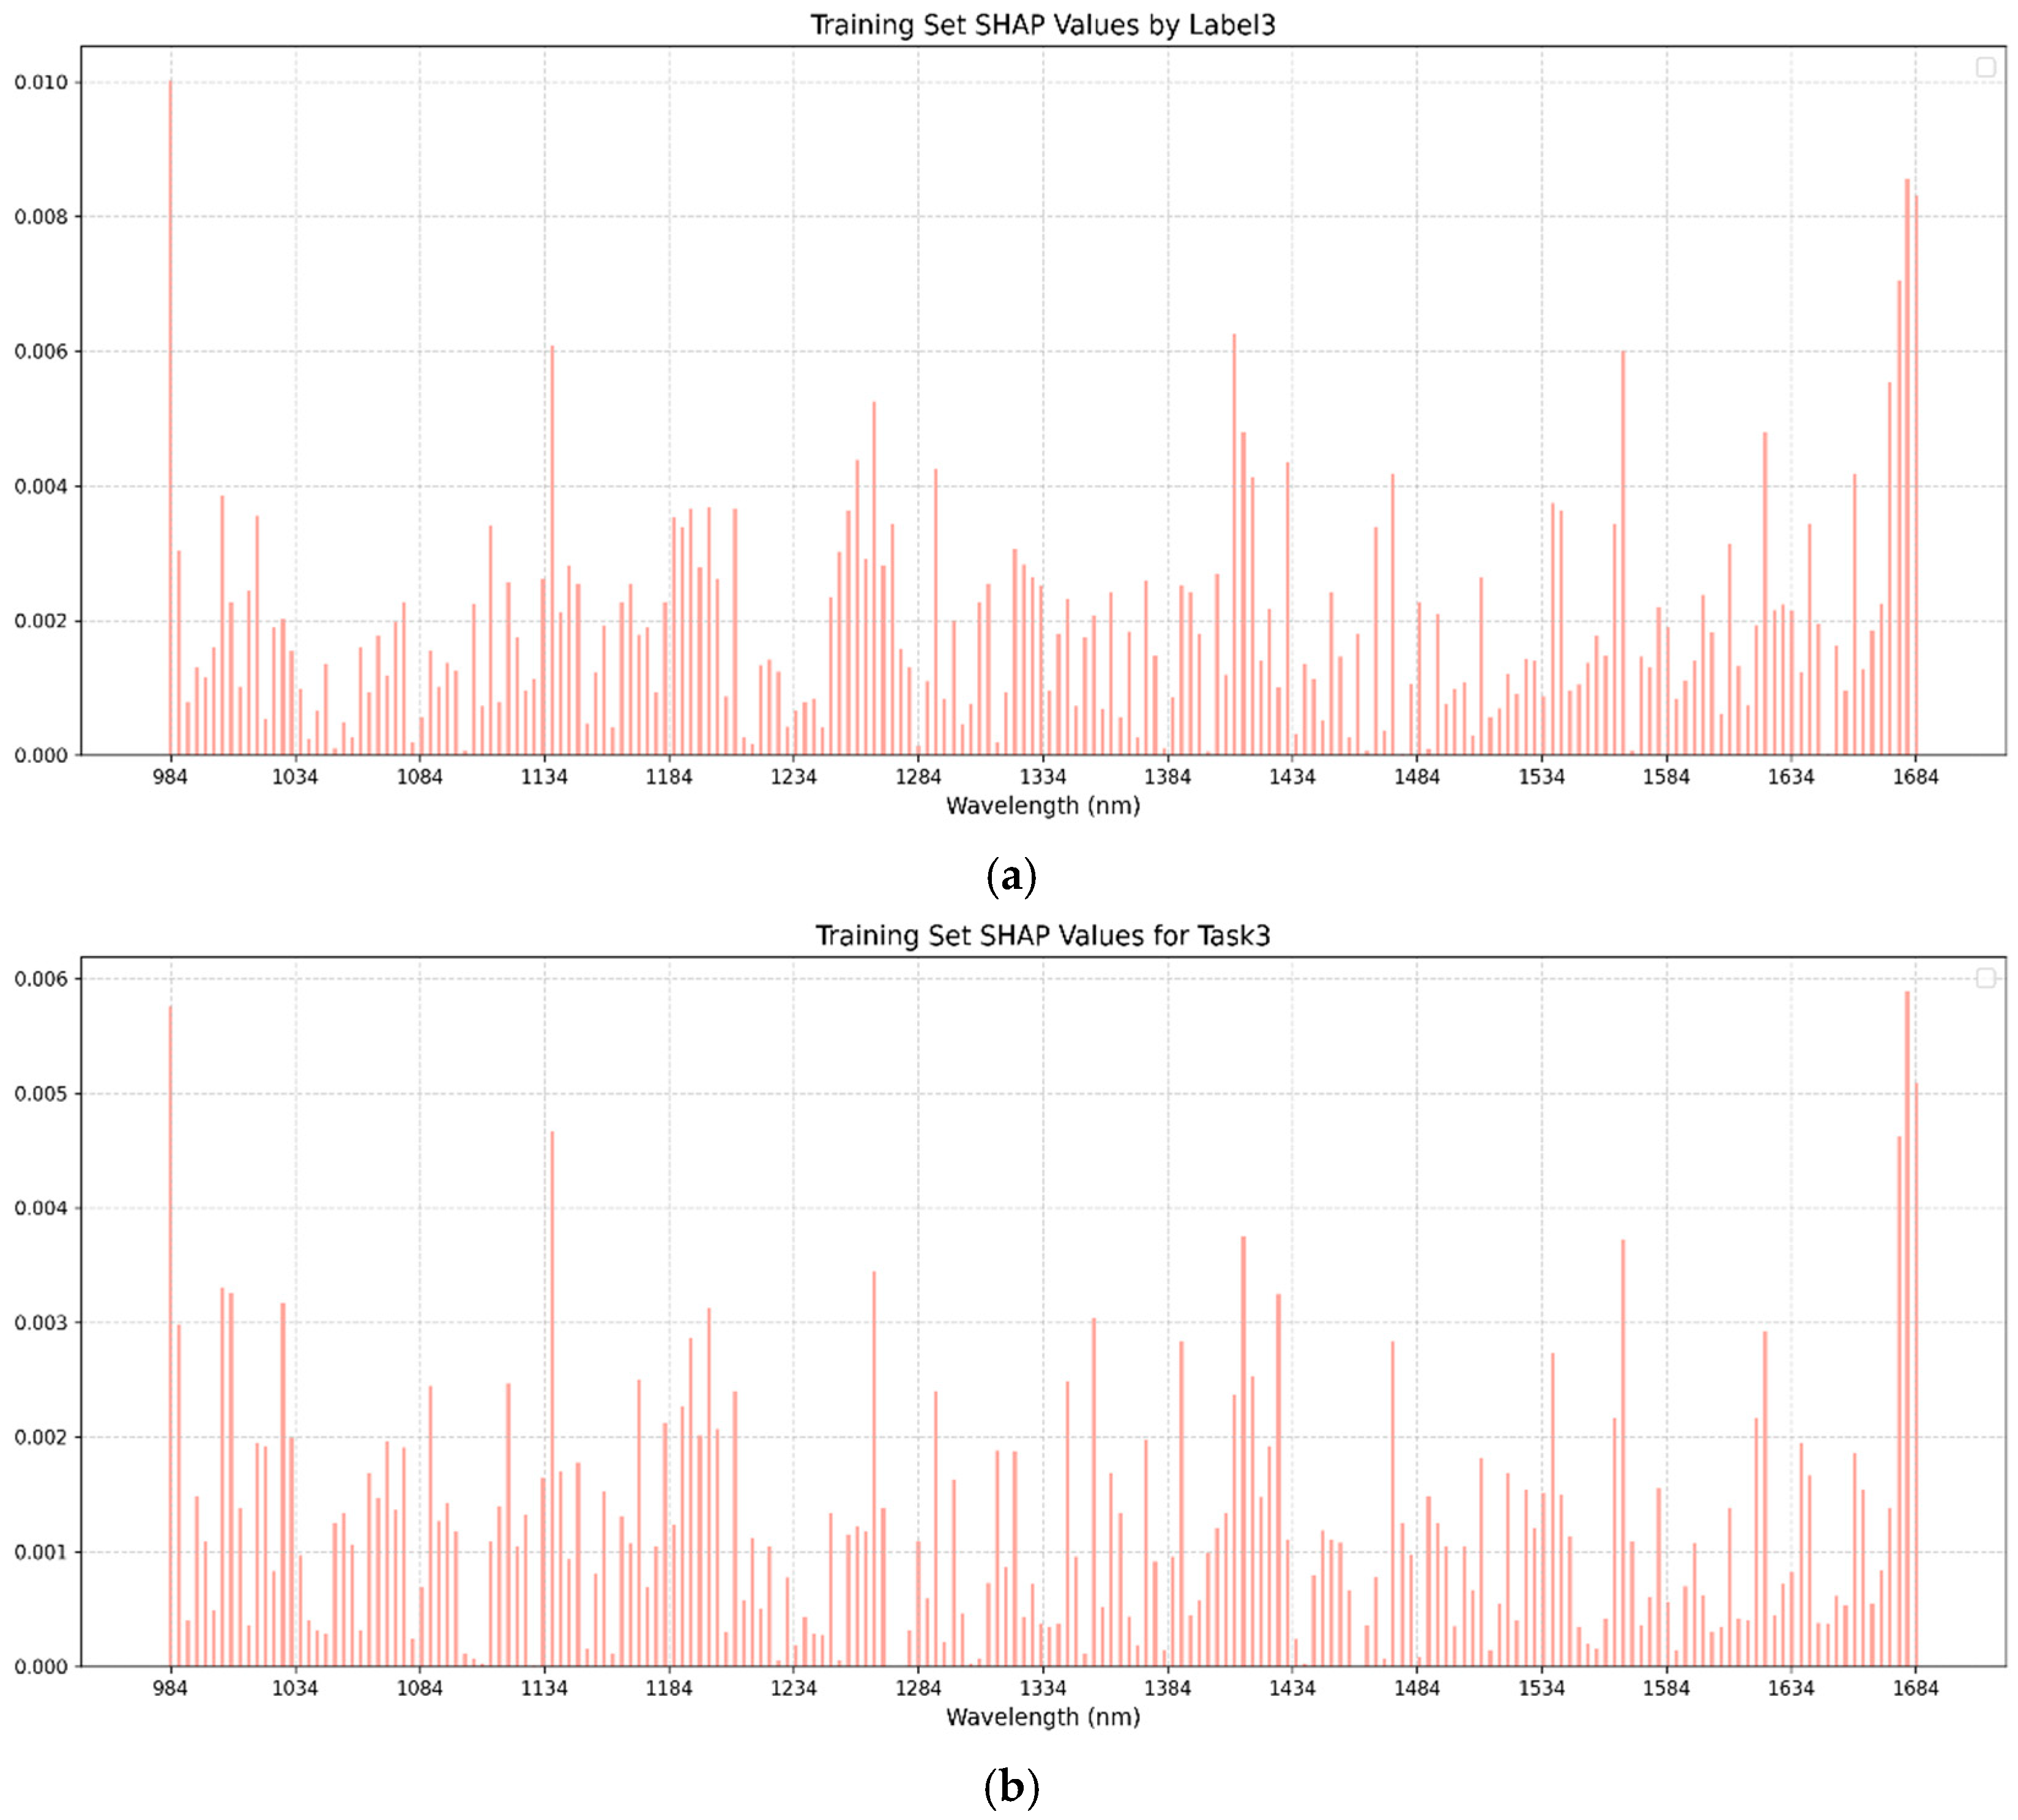
SHAP (SHapley Additive exPlanations) analysis, grounded in game theory, was employed to interpret the optimal models by quantifying the contribution of each input feature (SHAP value) based on its average impact on model outputs [
24]. In this study, SHAP values were calculated using all the samples from the training sets of both single-task BPNN and multi-task BPNN models, as the backpropagation-based regression networks demonstrated superior performance and were selected for SHAP interpretation. Summary plots were generated for the single-task and multi-task training sets to visualize the magnitude and direction of influential spectral bands.
2.7. Dataset Construction and Outlier Sample Removal
As mentioned above, the average spectrum of each sample was obtained, and the BRR, MRR and HRR values of the corresponding sample were measured. The spectral data and the milling quality indicators were then used to establish calibrations. To ensure a robust model performance for predicting brown rice rate, milled rice rate, and head rice rate, outliers and anomalous samples that could compromise model accuracy were removed. During the measurement of milling quality indicators, three samples were mismeasured. The remaining 302 samples were then used for further analysis. A boxplot method was used to identify samples with extreme values of the three indicators (in
Figure S1), and two samples with extreme values were identified as outlier samples. Then, PLSR models were established using all the samples for the three milling quality indicators, and the samples with a larger prediction error were manually identified as outlier samples. In all, 18 additional outliers were identified for the three milling quality indicators. It should be noted that for one milling quality indicator, the samples identified as outlier samples were also removed for the other two indicators. Thus, after removing 23 anomalous samples, the remaining 282 samples were retained for modeling. Then, the samples were randomly split into the training, validation, and test sets at the ratio of 4:1:1, and no samples repeatedly occurred in the three sets. The dataset split was not stratified by treatment or variety. The samples in the three sets for the three milling quality indicators were the same. Moreover, the samples in the three sets for single-task and multi-task learning were the same. Thus, the model performance could be better compared. The statistical analysis of the milling quality indicators in the training, validation, and test sets is shown in
Table 1.
2.8. Model Evaluation
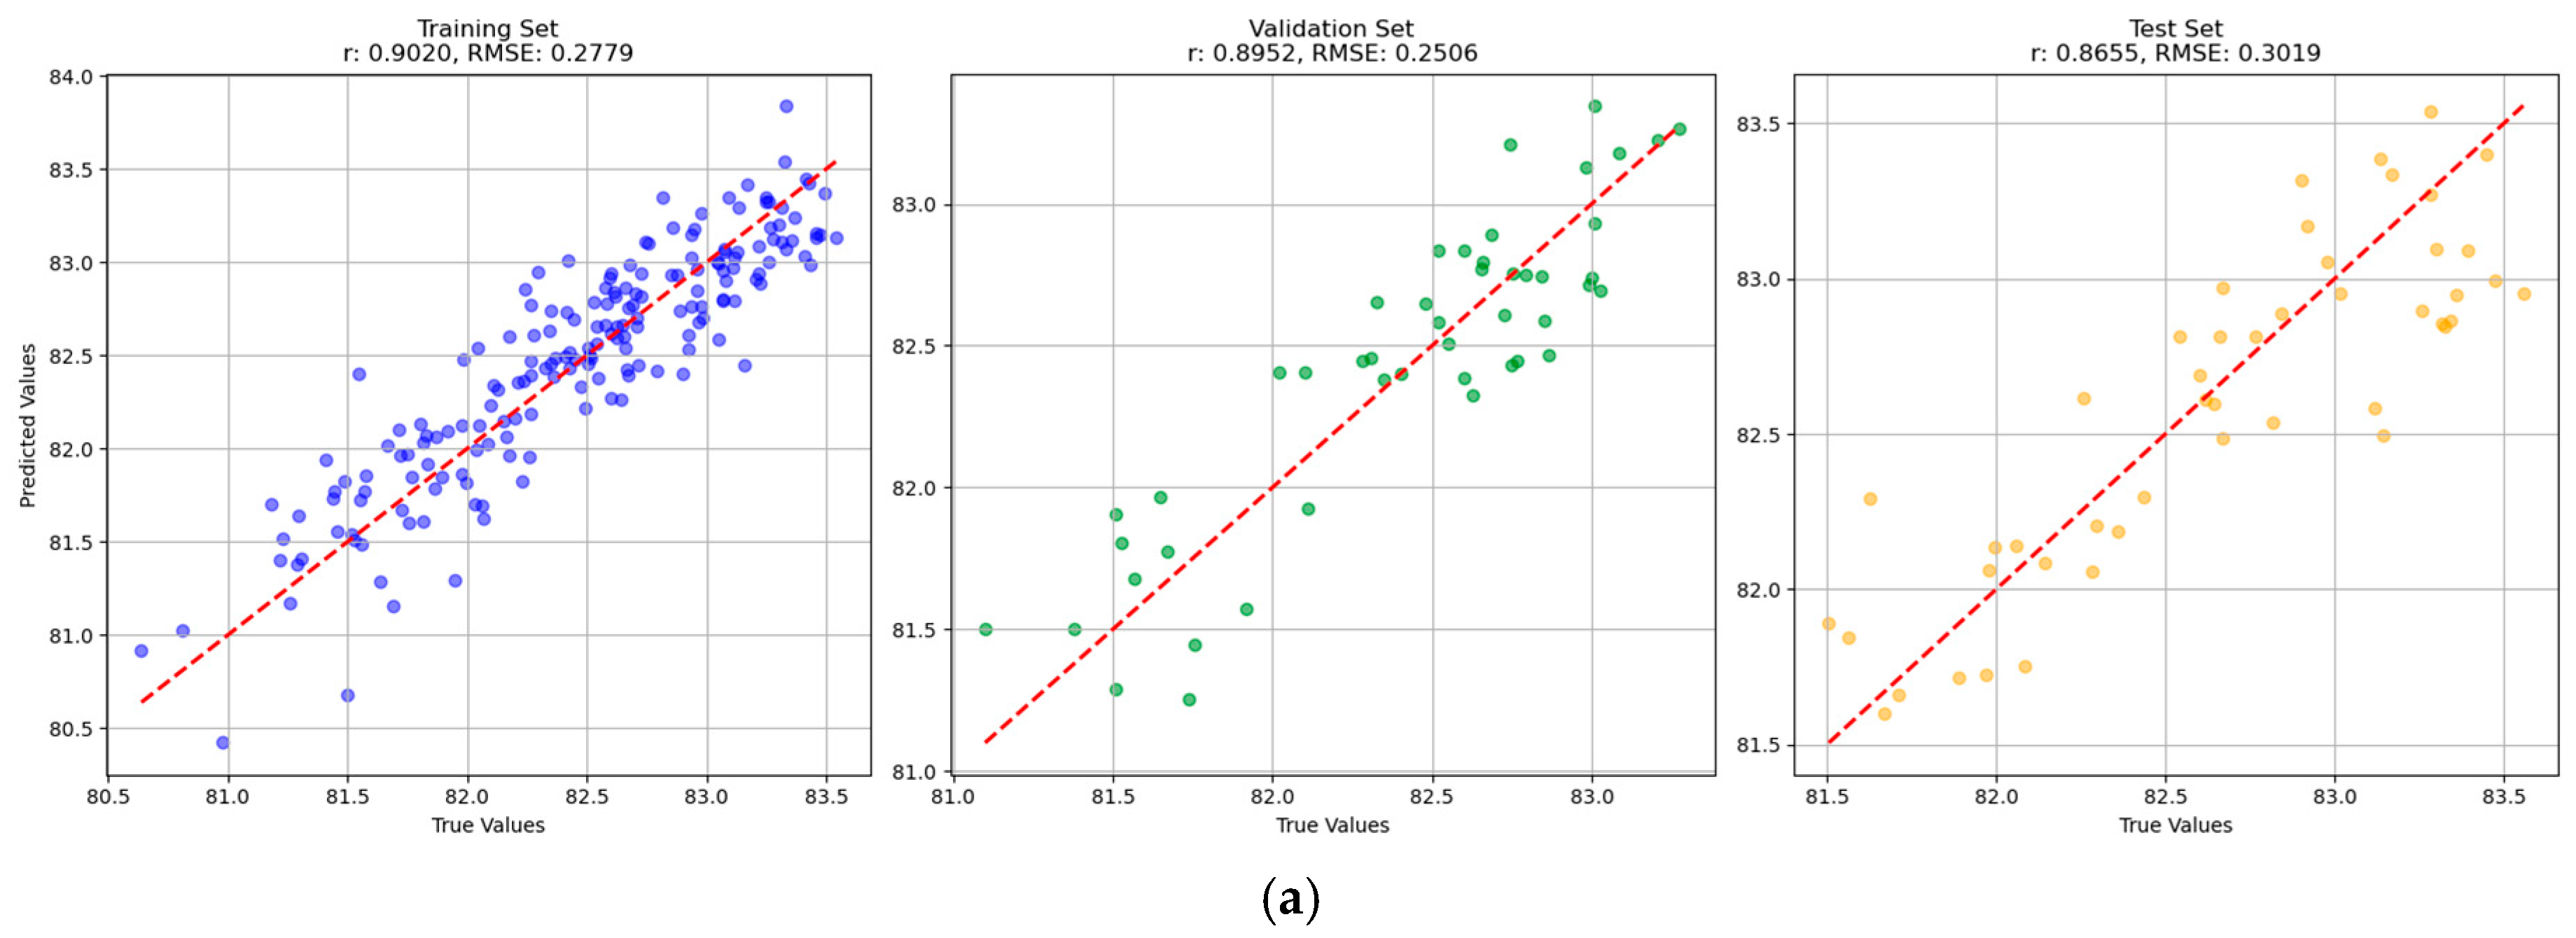
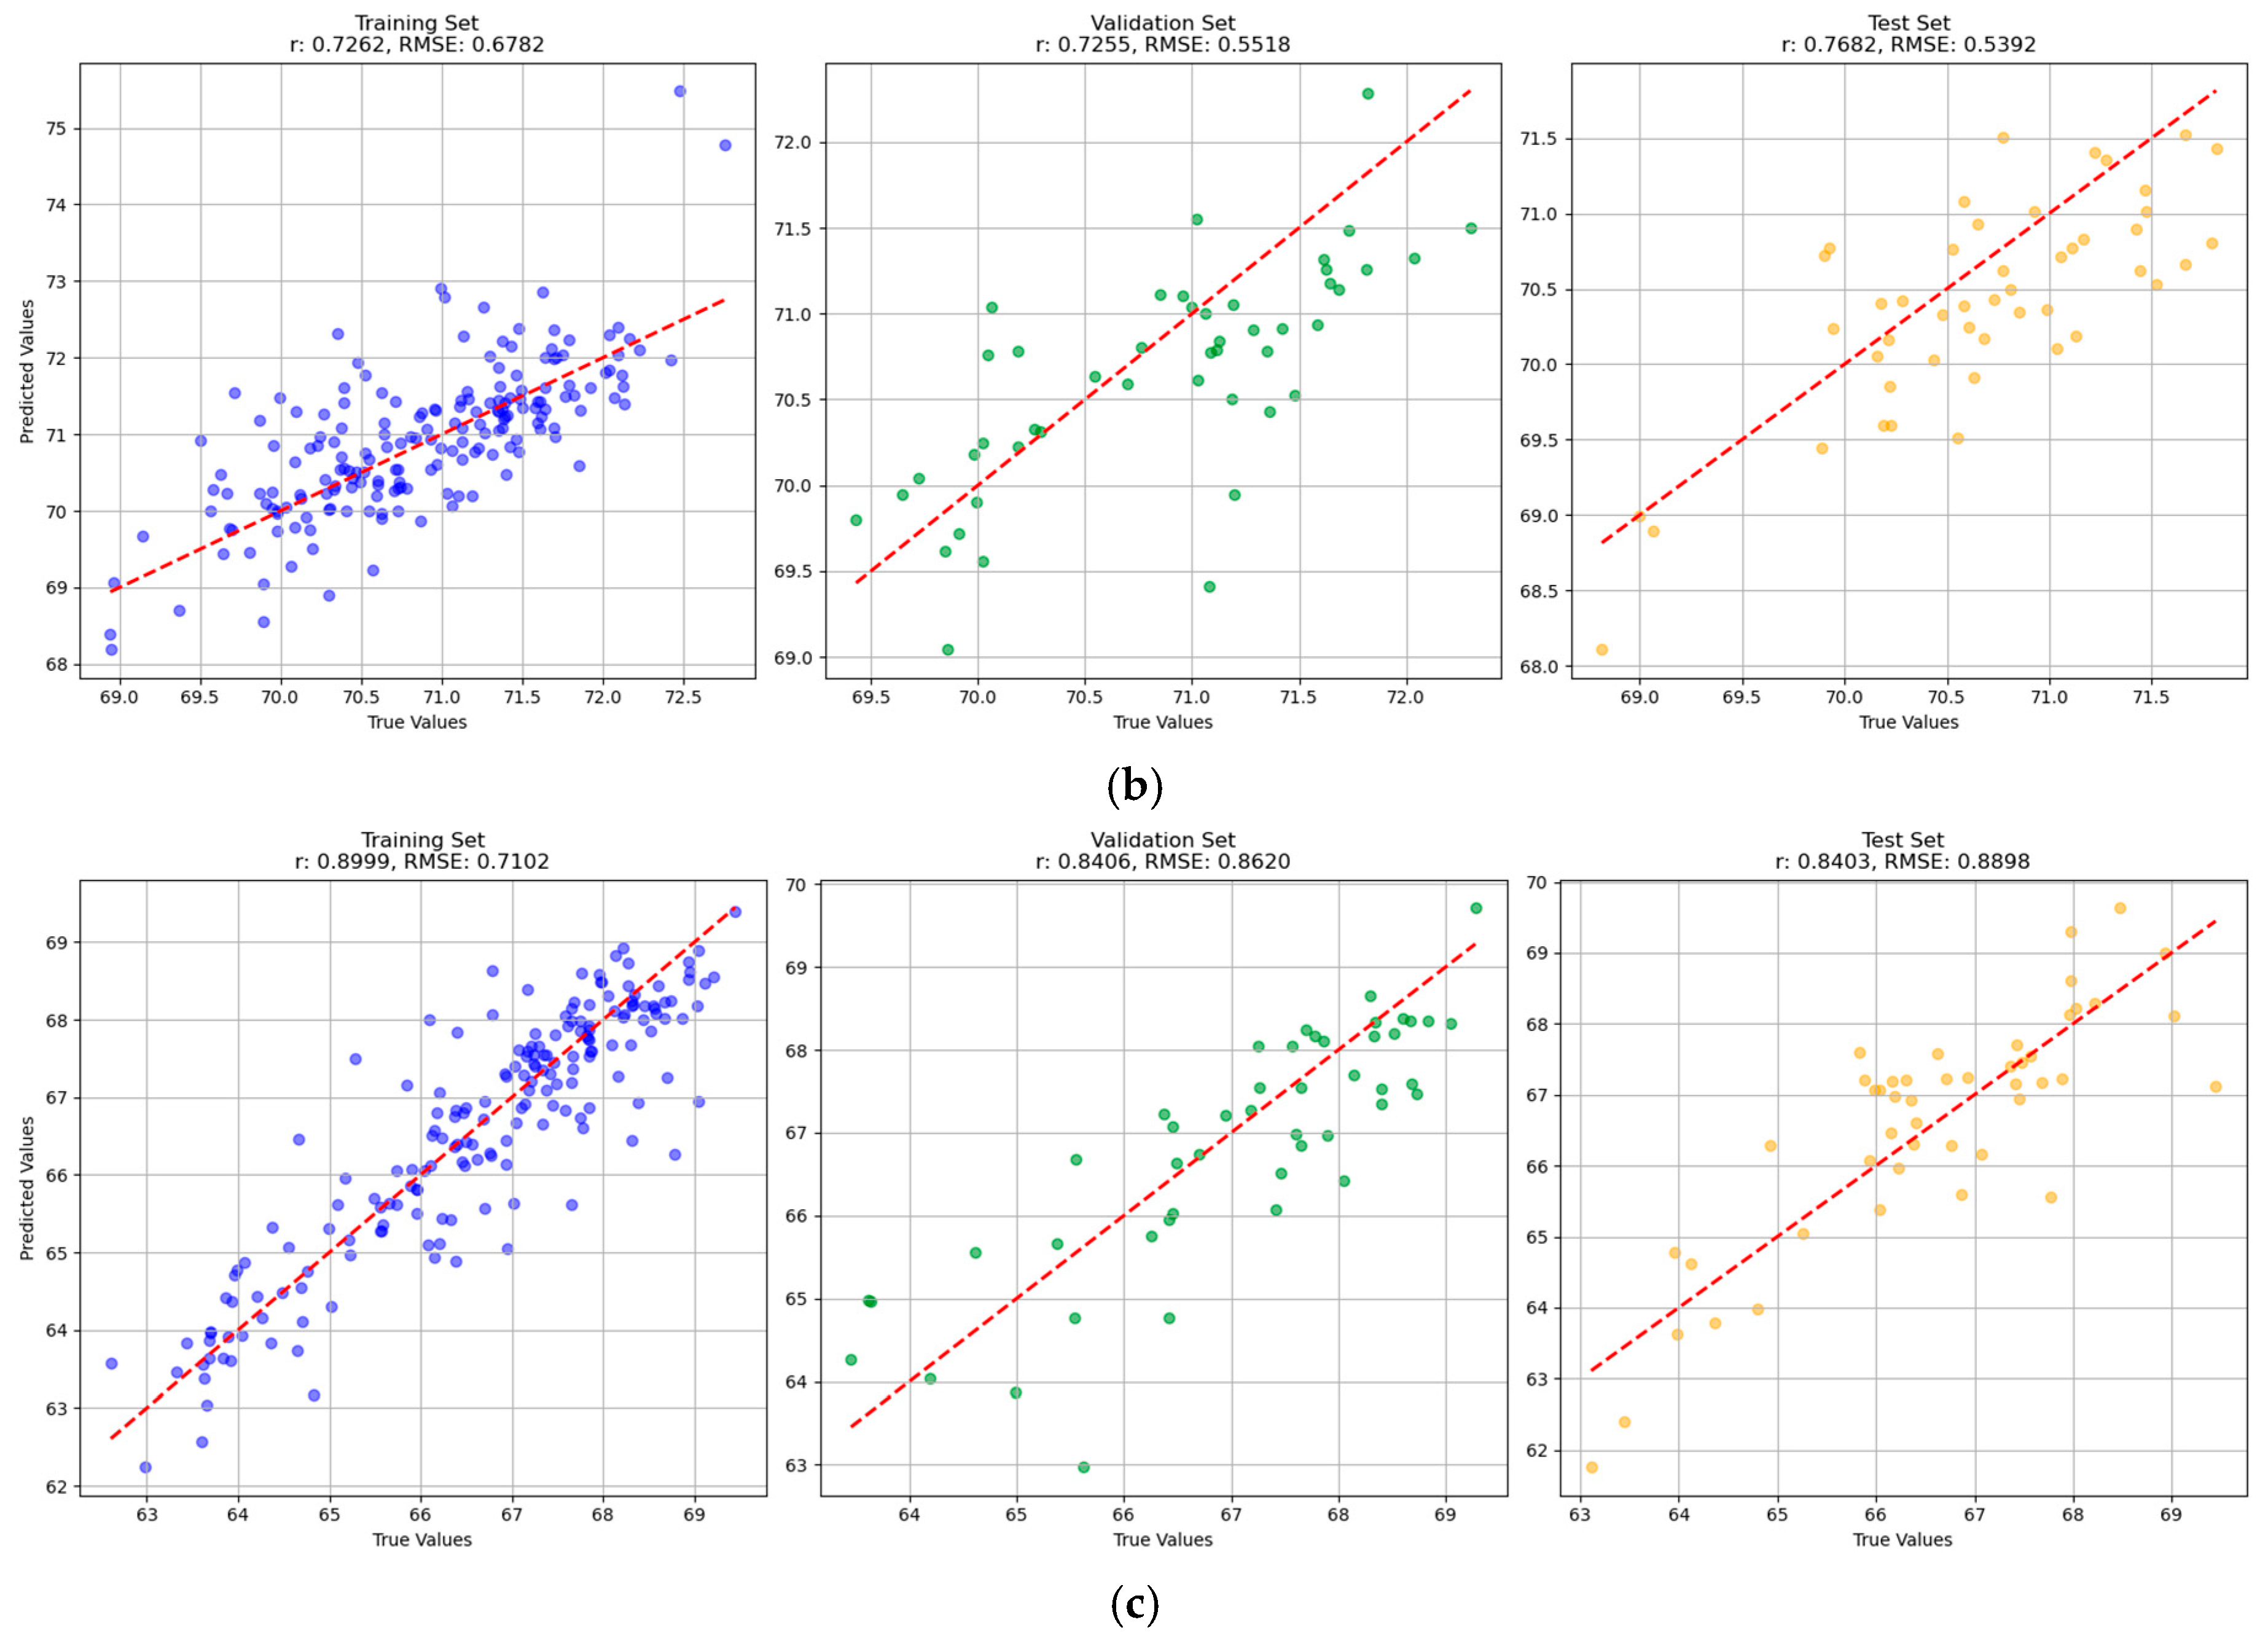
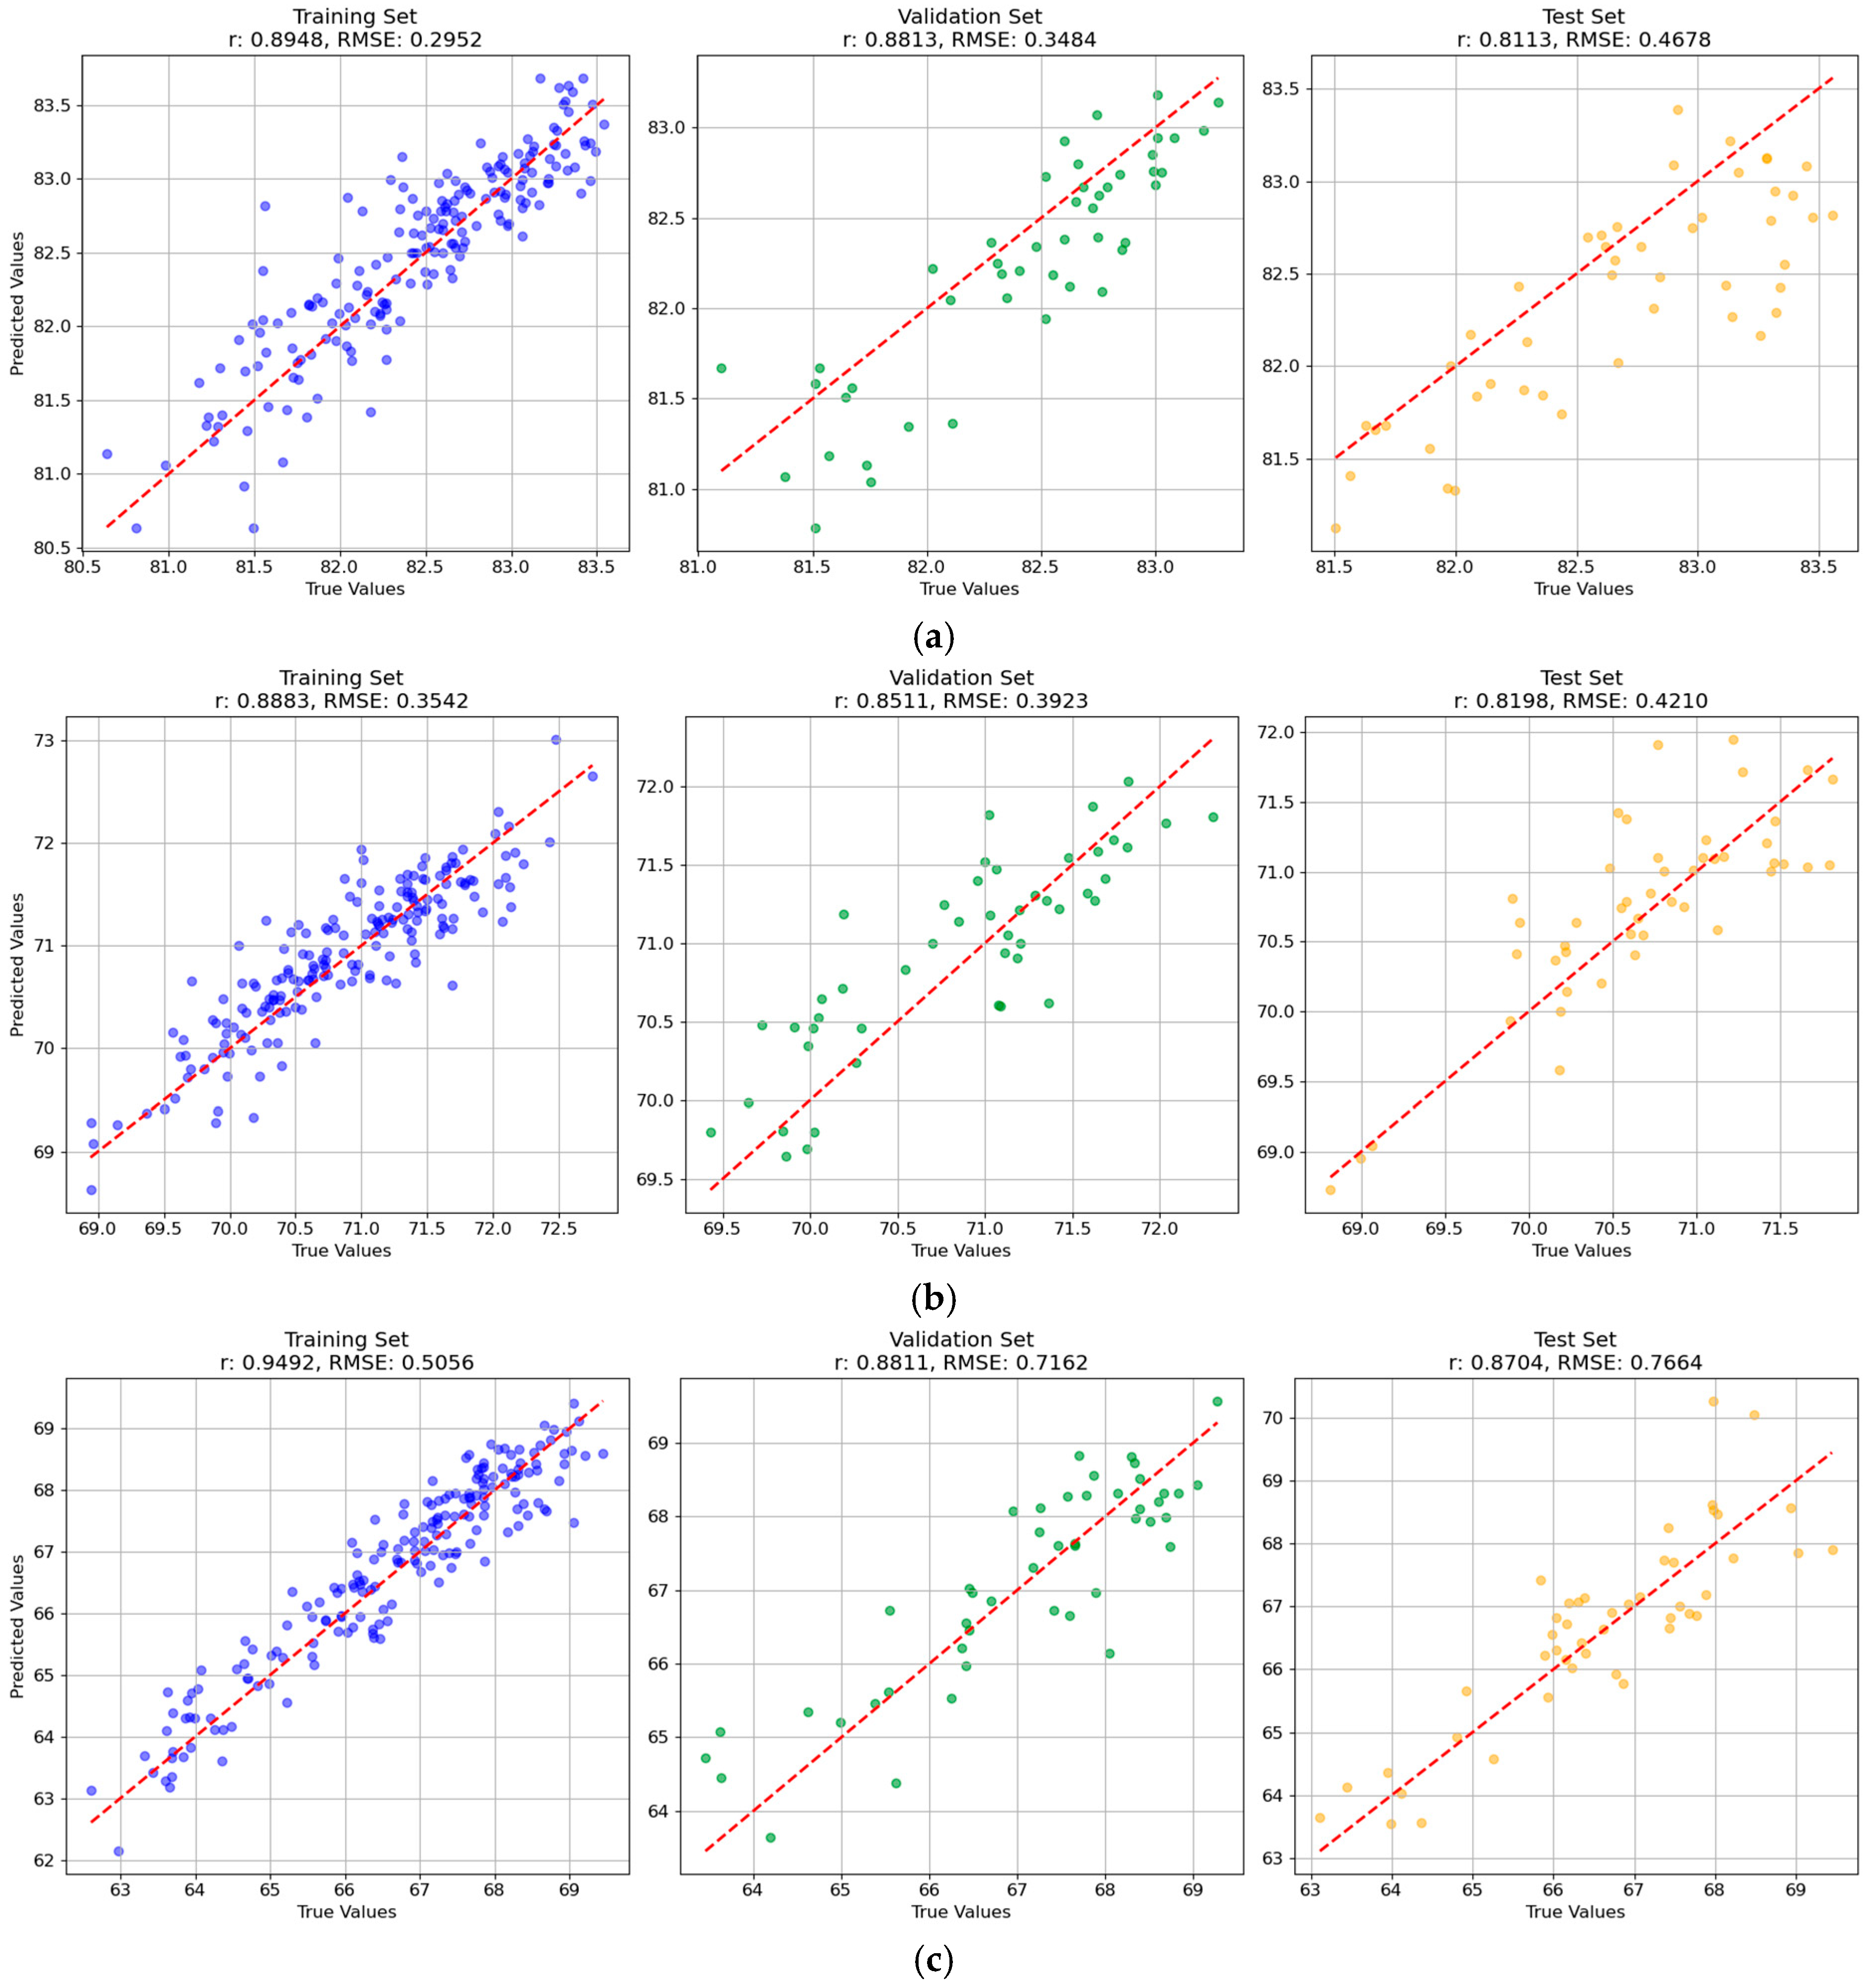
To systematically evaluate the predictive performance of the four models—Partial Least Squares Regression (PLSR), Support Vector Regression (SVR), Convolutional Neural Network (CNN), and Backpropagation Neural Network (BPNN)—on both single-task and multi-task scenarios, this study employed two key evaluation metrics: (1) the correlation coefficient (r) between predicted and true values, which measures the linear goodness-of-fit of the model; and (2) the root mean square error (RMSE) between predicted and true values, which assesses the predictive accuracy of the model. For each model, these two metrics were calculated on the training set, validation set, and test set. A value of r closer to 1 indicated better model fitting, while an RMSE closer to 0 signified a smaller prediction error. A model with a higher r and lower RMSE was treated as a better model.
2.9. Software and Hardware
All data processing and model development were performed on computer systems equipped with 32 GB RAM, an NVIDIA GeForce RTX 3060 GPU, and Intel i7-11700 CPU. The computational environment utilized Python (v3.9), with PyCharm IDEs (1 March 2022) as the programming platforms.
The data extraction and SHAP analysis were implemented in Python, while the machine learning algorithms were performed using scikit-learn and PyTorch 1.11.0. For deep learning, the PyTorch framework was employed.
4. Discussion
This study used hyperspectral imaging combined with machine learning and deep learning for the nondestructive evaluation of rice milling quality (brown rice rate, milled rice rate, and head rice rate). Overcoming the limitations of traditional destructive methods, our approach enabled the efficient quality assessment crucial for optimizing milling processes, enhancing commercial value, and meeting precision agriculture requirements.
Hyperspectral imaging has emerged as a powerful tool for agricultural products’ quality assessment due to its ability to capture detailed spectral signatures correlated with physical characteristics. In this study, machine learning and deep learning approaches were employed to predict rice milling quality with good performances. Compared with existing studies, our results exhibited certain differences and advantages. Specifically, Ageh et al. [
1] achieved prediction accuracy using a random forest model, with R² values of 0.801 for BRR, 0.714 for MRR, and 0.995 for HRR. Ebrahim et al. [
25] used an artificial neural network to predict the HRR, with the R
2 value of as high an accuracy as 0.98. In contrast, our study obtained correlation coefficients across training, validation, and test sets as follows: BRR (0.894, 0.881, 0.811), MRR (0.888, 0.851, 0.819), and HRR (0.949, 0.881, 0.870). Comparative analysis indicated that our BRR and HRR predictions were slightly lower than those of Ageh et al. [
1], while the MRR results were comparable. These discrepancies may be attributed to differences in sample processing methods, experimental design, and feature distribution. Furthermore, when compared with the near-infrared spectroscopy-based approach by Sun et al. [
26] (BRR: calibration R
2 = 0.68, validation R
2 = 0.65; MRR: calibration R
2 = 0.71, validation R
2 = 0.70; HRR: calibration R
2 = 0.69, validation R
2 = 0.67), our BRR results were similar, the MRR was marginally lower, and the HRR demonstrated superior performance. These findings suggested that the methodology adopted in this study was effective for assessing BRR, MRR, and HRR as key milling quality indicators. At present, there are few relevant studies, and more extensive studies are needed.
As presented in this study, the machine learning and deep learning models obtained differentiated performances. By comparing all the models, BPNN models obtained relatively better performances, and CNN models did not obtain the best performances. In some other studies, a similar phenomenon could be found that deep learning models did not exhibit better performances [
27,
28]. Multiple factors could potentially influence the prediction accuracy, including data distribution patterns, feature cluster selection, and model parameter configuration [
9]. The predictive performance of CNN models in this study exhibited limitations, primarily attributable to the following: (1) a data–model architecture mismatch phenomenon, where the spatial distribution characteristics of spectral features demonstrated incompatibility with the CNN local receptive field mechanism [
29]; and (2) a model complexity–data scale disparity, as CNN training required substantial datasets, whereas the currently available sample size remains constrained under existing experimental conditions [
27].
In this study, the single-task learning (STL) and multi-task learning (MTL) prediction models were constructed using machine learning and deep learning algorithms. The results showed that although the two modeling methods were similar in prediction accuracy, the multi-task learning model showed a better overall performance. The multi-task BPNN model obtained relatively better overall performances among all the models. The results of single-task and multi-task were different with different indicators and different models. As mentioned above, MTL was not universally superior to single-task learning (STL). Differentiated results for STL and MTL could also be found in the literature [
23,
30,
31,
32]. In these studies, the results of STL and MTL were also quite close. The advantage of MTL was obvious that it could achieve multi-tasks simultaneously, simplifying the prediction procedures and being more applicable for real-world applications. Although MTL could enhance data efficiency by leveraging inter-task correlations, task interference might degrade its performance. Thus, it is quite important to design the optimal learning strategies and optimal objective functions for MTL. The utilization of STL and MTL could be considered based on practical scenarios, regarding the generally close performances of STL and MTL.
Future research could be developed in the following directions: At the data level, the generalization ability of the model can be enhanced by expanding the dataset scale and improving data diversity; in terms of model architecture, more efficient network structure designs and parameter optimization methods can be explored; for multi-task learning, the focus can be on studying combination strategies for different loss functions and dynamic weight allocation mechanisms to further improve model performance. Further investigations should be conducted to improve the model performance and generalization ability for real-world applications.
5. Conclusions
This study established various models, including single-task PLSR, multi-task PLSR, single-task SVR, multi-output SVR, single-task CNN, multi-task CNN, single-task BPNN, and multi-task BPNN, to estimate the brown rice rate, milled rice rate, and head rice rate of different rice varieties. Overall, for BRR, multi-output SVR performed better in multi-task scenarios, while the multi-task PLSR and multi-task BPNN showed poorer performance. Single-task PLSR was generally worse compared to the other models, whereas the single-task BPNN performed better and was comparable to multi-output SVR. For MRR, SVR achieved the best performance in single-task scenarios, while single-task PLSR obtained a relatively poor performance. In multi-task scenarios, the BPNN performed the best, and the performance of PLSR was generally worse compared to the other models. The results for MRR in multi-task scenarios were better than those in single-task scenarios. For HRR, the BPNN yielded the best results in single-task scenarios, while PLSR performed relatively poorly compared to the other models. In multi-task scenarios, the BPNN performed the best, while PLSR and the CNN showed a relatively poorer performance compared to the other models. The results for HRR in multi-task scenarios were relatively better than those in single-task scenarios. Among the three milling quality indicators, milled rice rate predictions were relatively lower but could be improved in future studies through feature selection techniques and model optimization. The integration of hyperspectral imaging and deep learning showed tremendous potential for nondestructive rice milling quality detection.


