
Gluten-Free Bread Enriched with Potato and Cricket Powder: Comparative Study of the Effects of Protein on Physicochemical Properties Bonds and Molecular Interactions

 , ,
, ,  , , ,
, , ,  ,
,  ,
,  and
and
Abstract
1. Introduction
2. Materials and Methods
2.1. Raw Materials
2.2. Dough Preparation and Baking
2.3. Proximate Composition
2.4. Water Activity Measurement
2.5. Bread Quality Evaluation
2.6. Bread Crumb Color Analysis
2.7. FTIR Analysis
2.8. Low-Field NMR Relaxometry
2.9. Texture Analysis
2.10. Statistical Analysis
3. Results and Discussion
3.1. Nutritional Value of Analyzed Breads
3.2. Bread Volume, Baking and Cooling Losses
3.3. Crumb Color Analysis
3.4. Fourier Transform Infrared Spectroscopy
3.5. LF NMR Relaxometry
3.6. Textural Properties
4. Application Potential and Research Limitations
5. Conclusions
Author Contributions
Funding
Institutional Review Board Statement
Informed Consent Statement
Data Availability Statement
Conflicts of Interest
References
- Gu, D.; Andreev, K.; Dupre, M.E. Major Trends in Population Growth Around the World. China CDC Wkly. 2021, 3, 604–613. [Google Scholar] [CrossRef] [PubMed]
- Rybicka, I. The Handbook of Minerals on a Gluten-Free Diet. Nutrients 2018, 10, 1683. [Google Scholar] [CrossRef] [PubMed]
- Skendi, A.; Papageorgiou, M.; Varzakas, T. High Protein Substitutes for Gluten in Gluten-Free Bread. Foods 2021, 10, 1997. [Google Scholar] [CrossRef] [PubMed]
- do Nascimento, A.B.; Fiates, G.M.R.; dos Anjos, A.; Teixeira, E. Gluten-free is not enough—Perception and suggestions of celiac consumers. Int. J. Food Sci. Nutr. 2014, 65, 394–398. [Google Scholar] [CrossRef]
- Roman, L.; Belorio, M.; Gomez, M. Gluten-Free Breads: The Gap Between Research and Commercial Reality. Compr. Rev. Food Sci. Food Saf. 2019, 18, 690–702. [Google Scholar] [CrossRef]
- Šmídová, Z.; Rysová, J. Gluten-Free Bread and Bakery Products Technology. Foods 2022, 11, 480. [Google Scholar] [CrossRef]
- Kowalczewski, P.Ł.; Olejnik, A.; Świtek, S.; Bzducha-Wróbel, A.; Kubiak, P.; Kujawska, M.; Lewandowicz, G. Bioactive compounds of potato (Solanum tuberosum L.) juice: From industry waste to food and medical applications. CRC Crit. Rev. Plant Sci. 2022, 41, 52–89. [Google Scholar] [CrossRef]
- Herreman, L.C.M.; de Vos, A.M.; Cosijn, M.M.; Tjalma, L.F.; Spelbrink, R.E.J.; van der Voort Maarschalk, K.; Laus, M.C. Potato: A Sustainable Source of Functional and Nutritional Proteins. In Sustainable Protein Sources; Elsevier: Amsterdam, The Netherlands, 2024; pp. 471–491. [Google Scholar] [CrossRef]
- Kowalczewski, P.Ł.; Olejnik, A.; Białas, W.; Rybicka, I.; Zielińska-Dawidziak, M.; Siger, A.; Kubiak, P.; Lewandowicz, G. The Nutritional Value and Biological Activity of Concentrated Protein Fraction of Potato Juice. Nutrients 2019, 11, 1523. [Google Scholar] [CrossRef]
- Pęksa, A.; Miedzianka, J. Potato Industry By-Products as a Source of Protein with Beneficial Nutritional, Functional, Health-Promoting and Antimicrobial Properties. Appl. Sci. 2021, 11, 3497. [Google Scholar] [CrossRef]
- Liu, X.; Ji, Y.; Wang, H.; Zhang, Y.; Zhang, H. Effect of glycosylated potato protein on the characteristics of gluten-free dough and steamed bread. Int. J. Food Sci. Technol. 2023, 58, 5657–5668. [Google Scholar] [CrossRef]
- Akbari, N.; Mohammadzadeh Milani, J.; Biparva, P. Functional and conformational properties of proteolytic enzyme-modified potato protein isolate. J. Sci. Food Agric. 2020, 100, 1320–1327. [Google Scholar] [CrossRef] [PubMed]
- Witczak, T.; Juszczak, L.; Ziobro, R.; Korus, J. Rheology of gluten-free dough and physical characteristics of bread with potato protein. J. Food Process Eng. 2017, 40, e12491. [Google Scholar] [CrossRef]
- Liu, X.; Mu, T.; Sun, H.; Zhang, M.; Chen, J.; Fauconnier, M.L. Effect of ingredients on the quality of gluten-free steamed bread based on potato flour. J. Food Sci. Technol. 2019, 56, 2863–2873. [Google Scholar] [CrossRef] [PubMed]
- Alting, A.C.; Pouvreau, L.; Giuseppin, M.L.F.; van Nieuwenhuijzen, N.H. Potato proteins. In Handbook of Food Proteins; Elsevier: Amsterdam, The Netherlands, 2011; pp. 316–334. [Google Scholar] [CrossRef]
- Jeżowski, P.; Polcyn, K.; Tomkowiak, A.; Rybicka, I.; Radzikowska, D. Technological and antioxidant properties of proteins obtained from waste potato juice. Open Life Sci. 2020, 15, 379–388. [Google Scholar] [CrossRef]
- Kot, A.M.; Pobiega, K.; Piwowarek, K.; Kieliszek, M.; Błażejak, S.; Gniewosz, M.; Lipińska, E. Biotechnological Methods of Management and Utilization of Potato Industry Waste—A Review. Potato Res. 2020, 63, 431–447. [Google Scholar] [CrossRef]
- Bzducha-Wróbel, A.; Koczoń, P.; Błażejak, S.; Kozera, J.; Kieliszek, M. Valorization of Deproteinated Potato Juice Water into β-Glucan Preparation of C. utilis Origin: Comparative Study of Preparations Obtained by Two Isolation Methods. Waste Biomass Valoriz. 2019, 11, 3257–3271. [Google Scholar] [CrossRef]
- Bzducha-Wróbel, A.; Pobiega, K.; Błażejak, S.; Kieliszek, M. The scale-up cultivation of Candida utilis in waste potato juice water with glycerol affects biomass and β(1,3)/(1,6)-glucan characteristic and yield. Appl. Microbiol. Biotechnol. 2018, 102, 9131–9145. [Google Scholar] [CrossRef]
- van Huis, A. Potential of insects as food and feed in assuring food security. Annu. Rev. Entomol. 2013, 58, 563–583. [Google Scholar] [CrossRef]
- Zielińska, E.; Baraniak, B.; Karaś, M.; Rybczyńska, K.; Jakubczyk, A. Selected species of edible insects as a source of nutrient composition. Food Res. Int. 2015, 77, 460–466. [Google Scholar] [CrossRef]
- Wieczorek, M.; Kowalczewski, P.; Drabińska, N.; Różańska, M.; Jeleń, H. Effect of Cricket Powder Incorporation on the Profile of Volatile Organic Compounds, Free Amino Acids and Sensory Properties of Gluten-Free Bread. Polish J. Food Nutr. Sci. 2022, 72, 431–442. [Google Scholar] [CrossRef]
- Hassan, S.A.; Altemimi, A.B.; Hashmi, A.A.; Shahzadi, S.; Mujahid, W.; Ali, A.; Bhat, Z.F.; Naz, S.; Nawaz, A.; Abdi, G.; et al. Edible crickets as a possible way to curb protein-energy malnutrition: Nutritional status, food applications, and safety concerns. Food Chem. X 2024, 23, 101533. [Google Scholar] [CrossRef] [PubMed]
- da Rosa Machado, C.; Thys, R.C.S. Cricket powder (Gryllus assimilis) as a new alternative protein source for gluten-free breads. Innov. Food Sci. Emerg. Technol. 2019, 56, 102180. [Google Scholar] [CrossRef]
- Fu, C.; Cheema, W.A.; Mobashar, M.; Shah, A.A.; Alqahtani, M.M. Insects as Sustainable Feed: Enhancing Animal Nutrition and Reducing Livestock Environmental Impression. J. Anim. Physiol. Anim. Nutr. 2025, 109, 280–290. [Google Scholar] [CrossRef] [PubMed]
- Lisboa, H.M.; Nascimento, A.; Arruda, A.; Sarinho, A.; Lima, J.; Batista, L.; Dantas, M.F.; Andrade, R. Unlocking the Potential of Insect-Based Proteins: Sustainable Solutions for Global Food Security and Nutrition. Foods 2024, 13, 1846. [Google Scholar] [CrossRef]
- Magara, H.J.O.; Niassy, S.; Ayieko, M.A.; Mukundamago, M.; Egonyu, J.P.; Tanga, C.M.; Kimathi, E.K.; Ongere, J.O.; Fiaboe, K.K.M.; Hugel, S.; et al. Edible Crickets (Orthoptera) Around the World: Distribution, Nutritional Value, and Other Benefits—A Review. Front. Nutr. 2021, 7, 537915. [Google Scholar] [CrossRef]
- ISO 20483:2013; Cereals and pulses—Determination of the Nitrogen Content and Calculation of the Crude Protein Content—Kjeldahl Method. International Organization for Standardization: Geneva, Switzerland, 2013.
- ISO 2171:2007; Cereals, Pulses and by-Products—Determination of Ash Yield by Incineration. International Organization for Standardization: Geneva, Switzerland, 2007.
- AACC. Crude fat in wheat, corn, and soy flour, feeds, and mixed feeds. AACC Int. Approv. Methods 2000, 1, 356–357. [Google Scholar] [CrossRef]
- AACC. 44-19.01 Moisture—Air-oven method, drying at 135 degrees. In AACC International Approved Methods; AACC International: Eagan, MN, USA, 2009. [Google Scholar] [CrossRef]
- Montowska, M.; Kowalczewski, P.Ł.; Rybicka, I.; Fornal, E. Nutritional value, protein and peptide composition of edible cricket powders. Food Chem. 2019, 289, 130–138. [Google Scholar] [CrossRef]
- AACCI. 10-05.01 Guidelines for Measurement of Volume by Rapeseed Displacement. In AACC International Approved Methods; AACC International: Eagan, MN, USA, 2009. [Google Scholar] [CrossRef]
- Leuschner, R.G.K.; O’Callaghan, M.J.A.; Arendt, E.K. Optimization of baking parameters of part-baked and rebaked Irish brown soda bread by evaluation of some quality characteristics. Int. J. Food Sci. Technol. 1997, 32, 487–493. [Google Scholar] [CrossRef]
- Mokrzycki, W.; Tatol, M. Color difference Delta E—A survey. Mach. Graph. Vis. 2011, 20, 383–411. [Google Scholar]
- Brosio, E.; Gianferri, R.R. Low-resolution NMR—An analytical tool in foods characterization and traceability. In Basic NMR in Foods Characterization; Brosio, E., Ed.; Research Signpost: Kerala, India, 2009; pp. 9–37. [Google Scholar]
- Węglarz, W.P.; Harańczyk, H. Two-dimensional analysis of the nuclear relaxation function in the time domain: The program CracSpin. J. Phys. D. Appl. Phys. 2000, 33, 1909–1920. [Google Scholar] [CrossRef]
- Carr, H.Y.; Purcell, E.M. Effects of Diffusion on Free Precession in Nuclear Magnetic Resonance Experiments. Phys. Rev. 1954, 94, 630–638. [Google Scholar] [CrossRef]
- Meiboom, S.; Gill, D. Modified Spin-Echo Method for Measuring Nuclear Relaxation Times. Rev. Sci. Instrum. 1958, 29, 688–691. [Google Scholar] [CrossRef]
- Baranowska, H.M. Water molecular properties in forcemeats and finely ground sausages containing plant fat. Food Biophys. 2011, 6, 133–137. [Google Scholar] [CrossRef]
- Ayieko, M.A.; Ogola, H.J.; Ayieko, I.A. Introducing rearing crickets (gryllids) at household levels: Adoption, processing and nutritional values. J. Insects Food Feed 2016, 2, 203–211. [Google Scholar] [CrossRef]
- Ho, I.; Peterson, A.; Madden, J.; Huang, E.; Amin, S.; Lammert, A. Will It Cricket? Product Development and Evaluation of Cricket (Acheta domesticus) Powder Replacement in Sausage, Pasta, and Brownies. Foods 2022, 11, 3128. [Google Scholar] [CrossRef]
- Tapia, M.S.; Alzamora, S.M.; Chirife, J. Effects of Water Activity (aw) on Microbial Stability as a Hurdle in Food Preservation. In Water Activity in Foods; Barbosa-Cánovas, G.V., Fontana, A.J., Jr., Schmidt, S.J., Labuza, T.P., Eds.; Wiley: Hoboken, NJ, USA, 2020; pp. 323–355. [Google Scholar] [CrossRef]
- Bresciani, A.; Cardone, G.; Jucker, C.; Savoldelli, S.; Marti, A. Technological Performance of Cricket Powder (Acheta domesticus L.) in Wheat-Based Formulations. Insects 2022, 13, 546. [Google Scholar] [CrossRef]
- Bawa, M.; Songsermpong, S.; Kaewtapee, C.; Chanput, W. Nutritional, sensory, and texture quality of bread and cookie enriched with house cricket (Acheta domesticus) powder. J. Food Process. Preserv. 2020, 44, e14601. [Google Scholar] [CrossRef]
- Kowalczewski, P.; Różańska, M.; Makowska, A.; Jeżowski, P.; Kubiak, P. Production of wheat bread with spray-dried potato juice: Influence on dough and bread characteristics. Food Sci. Technol. Int. 2019, 25, 223–232. [Google Scholar] [CrossRef]
- Kowalczewski, P.Ł.; Gumienna, M.; Rybicka, I.; Górna, B.; Sarbak, P.; Dziedzic, K.; Kmiecik, D. Nutritional Value and Biological Activity of Gluten-Free Bread Enriched with Cricket Powder. Molecules 2021, 26, 1184. [Google Scholar] [CrossRef]
- Nath, P.; Pandey, N.; Samota, M.; Sharma, K.; Kale, S.; Kannaujia, P.; Sethi, S.; Chauhan, O.P. Browning Reactions in Foods. In Advances in Food Chemistry; Springer Nature: Singapore, 2022; pp. 117–159. [Google Scholar] [CrossRef]
- Starowicz, M.; Zieliński, H. How Maillard Reaction Influences Sensorial Properties (Color, Flavor and Texture) of Food Products? Food Rev. Int. 2019, 35, 707–725. [Google Scholar] [CrossRef]
- Guiné, R.P.F. Textural Properties of Bakery Products: A Review of Instrumental and Sensory Evaluation Studies. Appl. Sci. 2022, 12, 8628. [Google Scholar] [CrossRef]
- Monteiro, J.S.; Farage, P.; Zandonadi, R.P.; Botelho, R.B.A.; de Oliveira, L.L.; Raposo, A.; Shakeel, F.; Alshehri, S.; Mahdi, W.A.; Araújo, W.M.C. A Systematic Review on Gluten-Free Bread Formulations Using Specific Volume as a Quality Indicator. Foods 2021, 10, 614. [Google Scholar] [CrossRef] [PubMed]
- Kuhn, W. NMR Microscopy—Fundamentals, Limits and Possible Applications. Angew. Chem. Int. Ed. Engl. 1990, 29, 1–19. [Google Scholar] [CrossRef]
- Kirtil, E.; Oztop, M.H. 1H Nuclear Magnetic Resonance Relaxometry and Magnetic Resonance Imaging and Applications in Food Science and Processing. Food Eng. Rev. 2016, 8, 1–22. [Google Scholar] [CrossRef]
- Hirsch, A.J. Functional Properties of Protein and Chitin from Commercial Cricket Flour. Master’s Thesis, Purdue University, West Lafayette, IN, USA, 2018. [Google Scholar]
- Ruggeri, M.; Bianchi, E.; Vigani, B.; Sánchez-Espejo, R.; Spano, M.; Totaro Fila, C.; Mannina, L.; Viseras, C.; Rossi, S.; Sandri, G. Nutritional and Functional Properties of Novel Italian Spray-Dried Cricket Powder. Antioxidants 2023, 12, 112. [Google Scholar] [CrossRef]
- Kowalczewski, P.Ł.; Siejak, P.; Jarzębski, M.; Jakubowicz, J.; Jeżowski, P.; Walkowiak, K.; Smarzyński, K.; Ostrowska-Ligęza, E.; Baranowska, H.M. Comparison of technological and physicochemical properties of cricket powders of different origin. J. Insects Food Feed 2023, 9, 637–646. [Google Scholar] [CrossRef]
- McDonnell, C.K.; Allen, P.; Morin, C.; Lyng, J.G. The effect of ultrasonic salting on protein and water–protein interactions in meat. Food Chem. 2014, 147, 245–251. [Google Scholar] [CrossRef]
- Cônsolo, N.R.B.; de Paula, A.P.M.; Rezende-de-Souza, J.H.; Herreira, V.L.S.; Laura, S.M.; Gôngora, A.; Colnago, L.A.; Moraes, T.B.; Santos, P.M.; Nassu, R.T.; et al. Assessment of water relaxometry of meat under different ageing processes using time domain nuclear magnetic resonance relaxometry. Food Res. Int. 2024, 190, 114566. [Google Scholar] [CrossRef]
- Kazemi-Taskooh, Z.; Varidi, M. How can plant-based protein–polysaccharide interactions affect the properties of binary hydrogels? (A review). Food Funct. 2023, 14, 5891–5909. [Google Scholar] [CrossRef]

| Ingredient (%) | R | CP100 | CP80PP20 | CP60PP40 | CP40PP60 | CP20PP80 | PP100 |
|---|---|---|---|---|---|---|---|
| Flour mix | 50.00 | 46.67 | 46.67 | 46.67 | 46.67 | 46.67 | 46.67 |
| Guar gum | 1.00 | 1.00 | 1.00 | 1.00 | 1.00 | 1.00 | 1.00 |
| Pectin | 1.00 | 1.00 | 1.00 | 1.00 | 1.00 | 1.00 | 1.00 |
| Baker’s yeast | 2.20 | 2.20 | 2.20 | 2.20 | 2.20 | 2.20 | 2.20 |
| Sugar | 0.90 | 0.90 | 0.90 | 0.90 | 0.90 | 0.90 | 0.90 |
| Salt | 0.80 | 0.80 | 0.80 | 0.80 | 0.80 | 0.80 | 0.80 |
| Rapeseed oil | 1.60 | 1.60 | 1.60 | 1.60 | 1.60 | 1.60 | 1.60 |
| Potato protein | 0.00 | 0.00 | 0.67 | 1.33 | 2.00 | 2.67 | 3.33 |
| Cricket powder | 0.00 | 3.33 | 2.67 | 2.00 | 1.33 | 0.67 | 0.00 |
| Inulin | 0.83 | 0.83 | 0.83 | 0.83 | 0.83 | 0.83 | 0.83 |
| Water | 41.67 | 41.67 | 41.67 | 41.67 | 41.67 | 41.67 | 41.67 |
| Sample | Protein Content (%) | Ash Content (%) | Fat Content (%) | Carbohydrate Content (%) 1 | Energy Value (kcal/100 g) 2 | aw (-) |
|---|---|---|---|---|---|---|
| R | 11.15 ± 0.89 c | 0.60 ± 0.03 c | 0.87 ± 0.02 b | 44.27 | 229.5 | 0.976 ± 0.001 a |
| CP100 | 23.05 ± 1.43 b | 1.16 ± 0.11 a | 0.92 ± 0.03 a | 29.05 | 216.7 | 0.975 ± 0.001 a |
| CP80PP20 | 23.53 ± 1.06 b | 1.12 ± 0.06 a | 0.90 ± 0.03 a | 28.70 | 217.0 | 0.975 ± 0.001 a |
| CP60PP40 | 25.72 ± 0.97 ab | 1.01 ± 0.10 a | 0.89 ± 0.05 a | 26.69 | 217.6 | 0.975 ± 0.001 a |
| CP40PP60 | 28.46 ± 1.88 a | 0.92 ± 0.04 ab | 0.87 ± 0.04 ab | 25.41 | 216.2 | 0.975 ± 0.001 a |
| CP20PP80 | 29.99 ± 1.21 a | 0.82 ± 0.07 b | 0.83 ± 0.02 b | 22.60 | 217.8 | 0.975 ± 0.001 a |
| PP100 | 30.73 ± 2.23 a | 0.78 ± 0.09 b | 0.83 ± 0.04 b | 21.97 | 218.2 | 0.976 ± 0.001 a |
| Sample | Bread Volume (mL/100 g) | Baking Loss (%) | Cooling Loss (%) |
|---|---|---|---|
| R | 800 ± 18 a | 15.47 ± 3.55 a | 2.58 ± 0.11 b |
| CP100 | 800 ± 10 a | 10.50 ± 3.01 ab | 2.38 ± 0.09 b |
| CP80PP20 | 733 ± 58 ab | 10.69 ± 1.73 b | 3.21 ± 0.11 a |
| CP60PP40 | 600 ± 11 b | 9.27 ± 1.61 b | 2.78 ± 0.09 b |
| CP40PP60 | 570 ± 47 b | 9.80 ± 1.82 b | 1.85 ± 0.16 c |
| CP20PP80 | 567 ± 26 b | 9.63 ± 0.93 b | 2.11 ± 0.11 bc |
| PP100 | 516 ± 38 b | 9.03 ± 1.05 b | 2.35 ± 0.06 b |
| Sample | L* | a* | b* | ΔE | WI |
|---|---|---|---|---|---|
| Protein source | |||||
| CP | 47.12 ± 0.40 | 3.76 ± 0.03 | 9.64 ± 0.13 | - | - |
| PP | 63.03 ± 0.77 | 4.75 ± 0.07 | 12.53 ± 0.52 | - | - |
| Breads | |||||
| R | 70.40 ± 1.00 a | −1.01 ± 0.06 e | 13.75 ± 0.34 a | - | 67.35 |
| CP100 | 56.34 ± 0.12 d | 2.70 ± 0.02 a | 10.26 ± 0.06 b | 14.07 | 55.07 |
| CP80PP20 | 58.05 ± 0.45 c | 2.39 ± 0.06 b | 10.51 ± 0.06 b | 13.21 | 56.70 |
| CP60PP40 | 58.31 ± 0.74 c | 2.21 ± 0.09 b | 9.97 ± 0.18 b | 13.07 | 57.08 |
| CP40PP60 | 62.58 ± 0.29 b | 1.55 ± 0.02 c | 10.36 ± 0.04 b | 8.90 | 61.14 |
| CP20PP80 | 63.52 ± 0.13 b | 1.16 ± 0.13 c | 10.62 ± 0.04 b | 7.86 | 61.98 |
| PP100 | 68.26 ± 0.82 a | 0.44 ± 0.05 d | 10.27 ± 0.13 b | 2.15 | 66.63 |
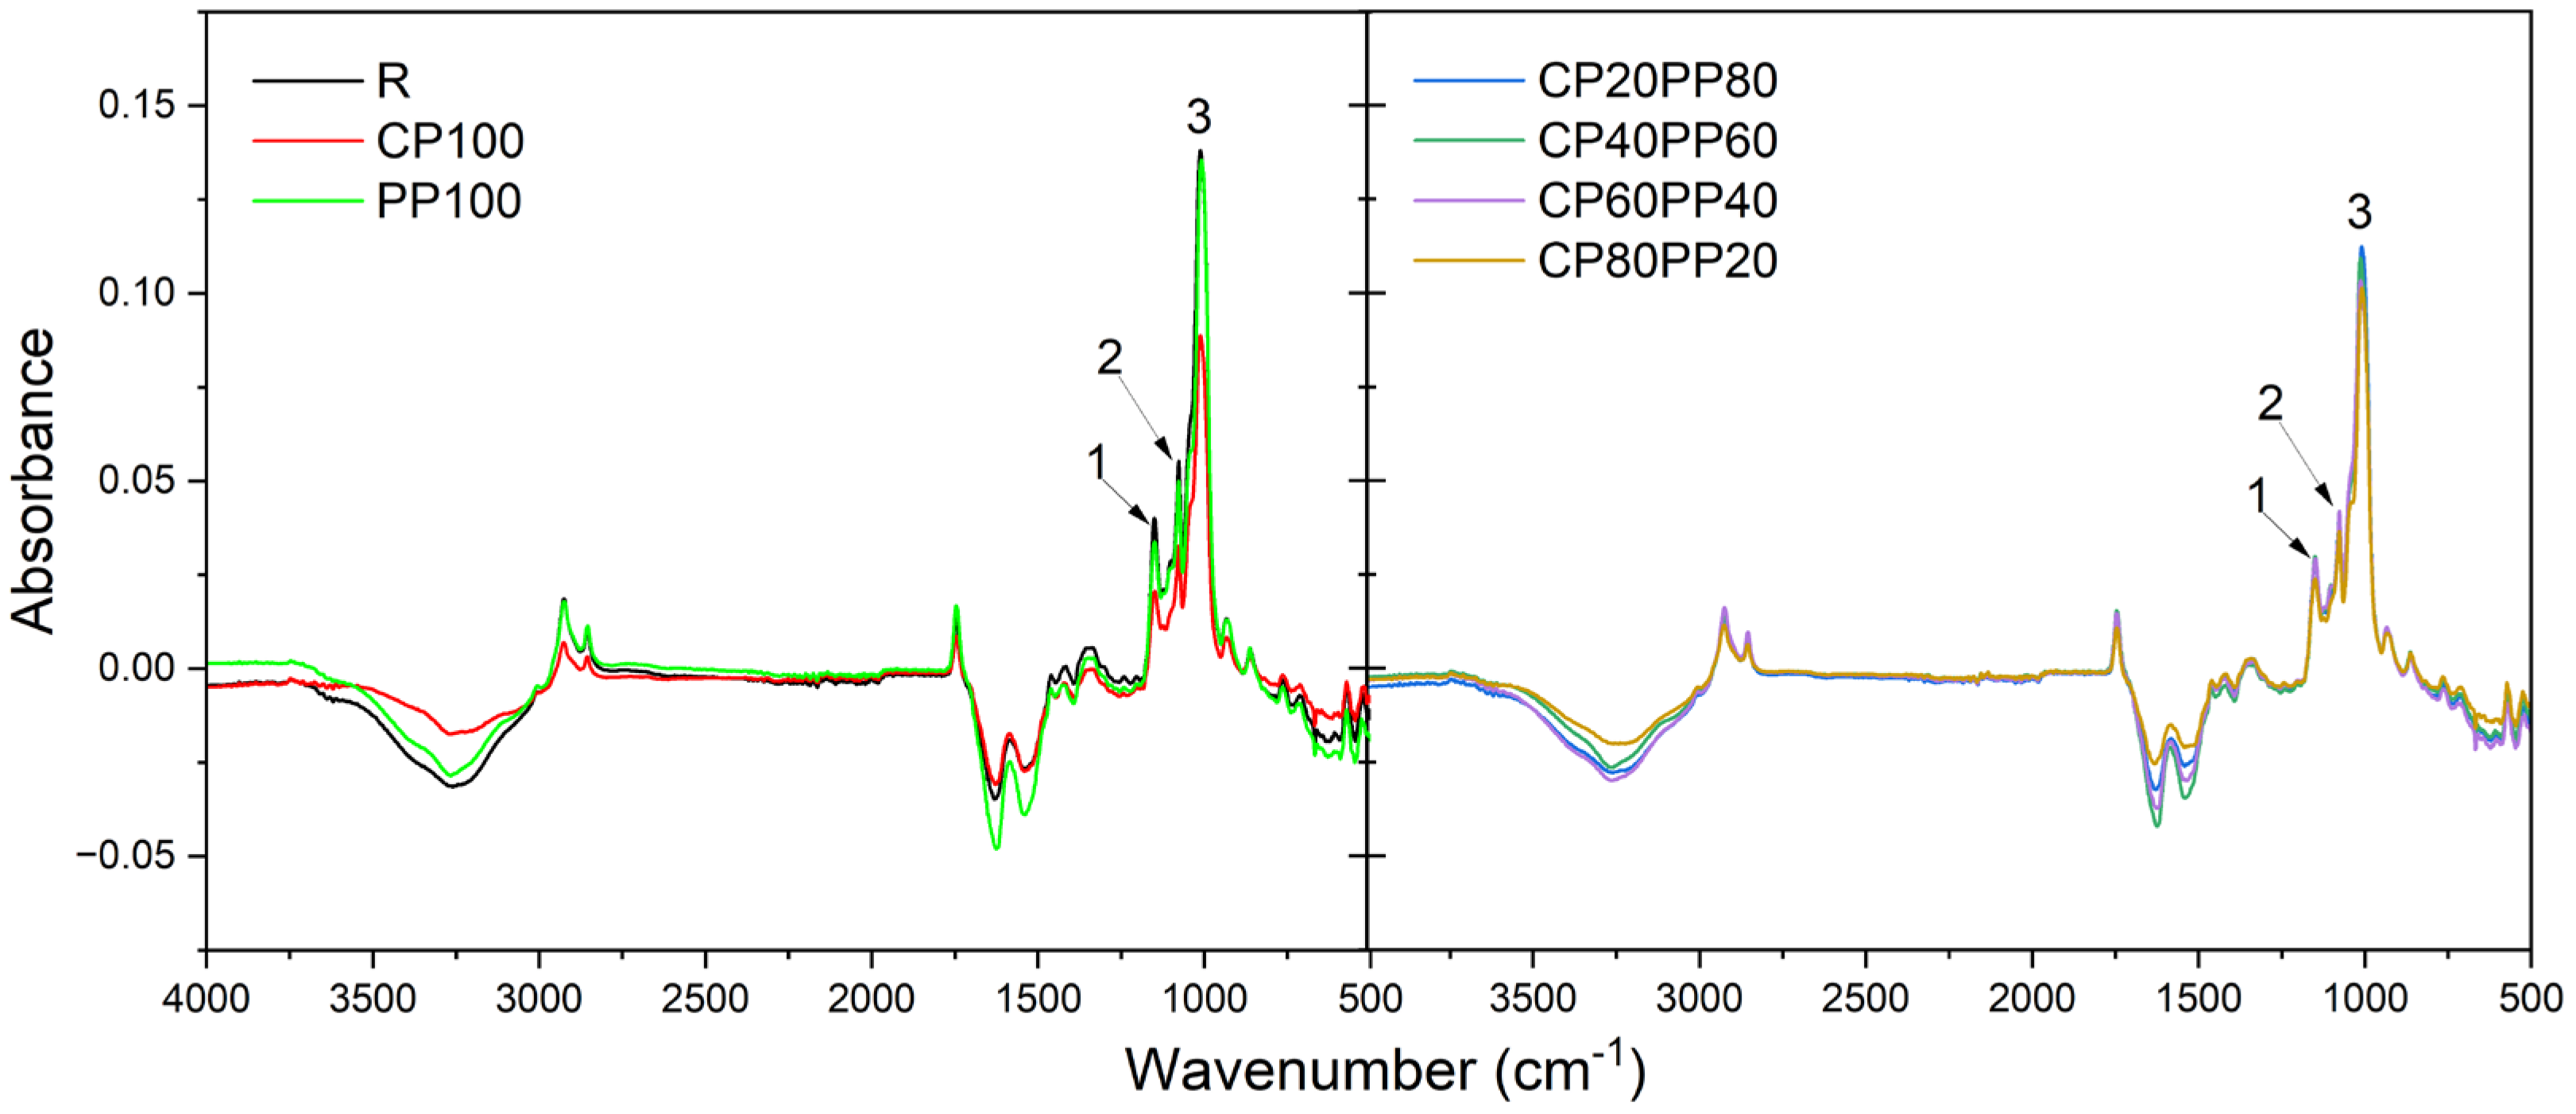
| Peak Number | Wavenumber (cm−1) | Absorbance Value of the Sample | ||||||
|---|---|---|---|---|---|---|---|---|
| R | CP100 | PP100 | CP80PP20 | CP60PP40 | CP40PP60 | CP20PP80 | ||
| 1 | 1150 | 0.0336 | 0.0298 | 0.0238 | 0.0292 | 0.0401 | 0.0206 | 0.0284 |
| 2 | 1078 | 0.0498 | 0.0415 | 0.0363 | 0.0419 | 0.0552 | 0.0325 | 0.0417 |
| 3 | 1014–1008 | 0.1355 | 0.1093 | 0.1013 | 0.1033 | 0.1380 | 0.0887 | 0.1123 |
| Sample | T1 (ms) | T21 (ms) | T22 (ms) |
|---|---|---|---|
| R | 122.3 ± 0.8 a | 10.71 ± 0.21 a | 69.56 ± 0.76 a |
| CP100 | 99.1 ± 0.8 b | 4.32 ± 0.14 d | 33.62 ± 0.88 d |
| CP80PP20 | 80.4 ± 0.7 e | 9.42 ± 0.19 b | 69.92 ± 0.71 a |
| CP60PP40 | 101.7 ± 0.8 b | 8.72 ± 0.20 c | 53.14 ± 0.69 b |
| CP40PP60 | 88.3 ± 0.6 c | 8.68 ± 0.43 c | 49.14 ± 0.83 c |
| CP20PP80 | 85.0 ± 0.9 d | 9.08 ± 0.32 bc | 67.62 ± 0.68 a |
| PP100 | 85.0 ± 0.6 d | 9.12 ± 0.27 b | 69.95 ± 0.77 a |
| Sample | Firmness (N) | Springiness (%) | Cohesiveness (-) | Chewiness (-) | Resilience (-) |
|---|---|---|---|---|---|
| R | 122 ± 24 c | 97 ± 1 a | 0.44 ± 0.05 b | 531 ± 197 c | 0.20 ± 0.05 ab |
| CP100 | 258 ± 13 a | 88 ± 4 b | 0.49 ± 0.05 ab | 1446 ± 43 a | 0.25 ± 0.03 b |
| CP80PP20 | 213 ± 35 a | 93 ± 1 ab | 0.50 ± 0.03 ab | 1343 ± 245 a | 0.25 ± 0.02 ab |
| CP60PP40 | 194 ± 30 a | 89 ± 5 b | 0.52 ± 0.05 ab | 1333 ± 167 a | 0.27 ± 0.02 ab |
| CP40PP60 | 159 ± 27 b | 92 ± 2 ab | 0.55 ± 0.02 a | 1258 ± 132 a | 0.29 ± 0.02 ab |
| CP20PP80 | 148 ± 31 b | 94 ± 2 ab | 0.57 ± 0.02 a | 1047 ± 111 ab | 0.30 ± 0.01 a |
| PP100 | 144 ± 14 b | 93 ± 1 ab | 0.58 ± 0.03 a | 912 ± 199 b | 0.32 ± 0.04 a |
Disclaimer/Publisher’s Note: The statements, opinions and data contained in all publications are solely those of the individual author(s) and contributor(s) and not of MDPI and/or the editor(s). MDPI and/or the editor(s) disclaim responsibility for any injury to people or property resulting from any ideas, methods, instructions or products referred to in the content. |
© 2025 by the authors. Licensee MDPI, Basel, Switzerland. This article is an open access article distributed under the terms and conditions of the Creative Commons Attribution (CC BY) license (https://creativecommons.org/licenses/by/4.0/).
Share and Cite
Królak, J.; Kucharski, J.J.; Kowalczewski, P.Ł.; Dudek, K.; Ruszkowska, M.; Jeżowski, P.; Masewicz, Ł.; Siejak, P.; Baranowska, H.M. Gluten-Free Bread Enriched with Potato and Cricket Powder: Comparative Study of the Effects of Protein on Physicochemical Properties Bonds and Molecular Interactions. Foods 2025, 14, 1959. https://doi.org/10.3390/foods14111959
Królak J, Kucharski JJ, Kowalczewski PŁ, Dudek K, Ruszkowska M, Jeżowski P, Masewicz Ł, Siejak P, Baranowska HM. Gluten-Free Bread Enriched with Potato and Cricket Powder: Comparative Study of the Effects of Protein on Physicochemical Properties Bonds and Molecular Interactions. Foods. 2025; 14(11):1959. https://doi.org/10.3390/foods14111959
Chicago/Turabian StyleKrólak, Jakub, Jan Jakub Kucharski, Przemysław Łukasz Kowalczewski, Klaudia Dudek, Millena Ruszkowska, Paweł Jeżowski, Łukasz Masewicz, Przemysław Siejak, and Hanna Maria Baranowska. 2025. "Gluten-Free Bread Enriched with Potato and Cricket Powder: Comparative Study of the Effects of Protein on Physicochemical Properties Bonds and Molecular Interactions" Foods 14, no. 11: 1959. https://doi.org/10.3390/foods14111959
APA StyleKrólak, J., Kucharski, J. J., Kowalczewski, P. Ł., Dudek, K., Ruszkowska, M., Jeżowski, P., Masewicz, Ł., Siejak, P., & Baranowska, H. M. (2025). Gluten-Free Bread Enriched with Potato and Cricket Powder: Comparative Study of the Effects of Protein on Physicochemical Properties Bonds and Molecular Interactions. Foods, 14(11), 1959. https://doi.org/10.3390/foods14111959