

Lipid-Lowering Effects of Alpha-Mangostin: A Systematic Review and Meta-Analysis in Hyperlipidemic Animal Models

 , , ,
, , ,  , ,
, ,
Abstract
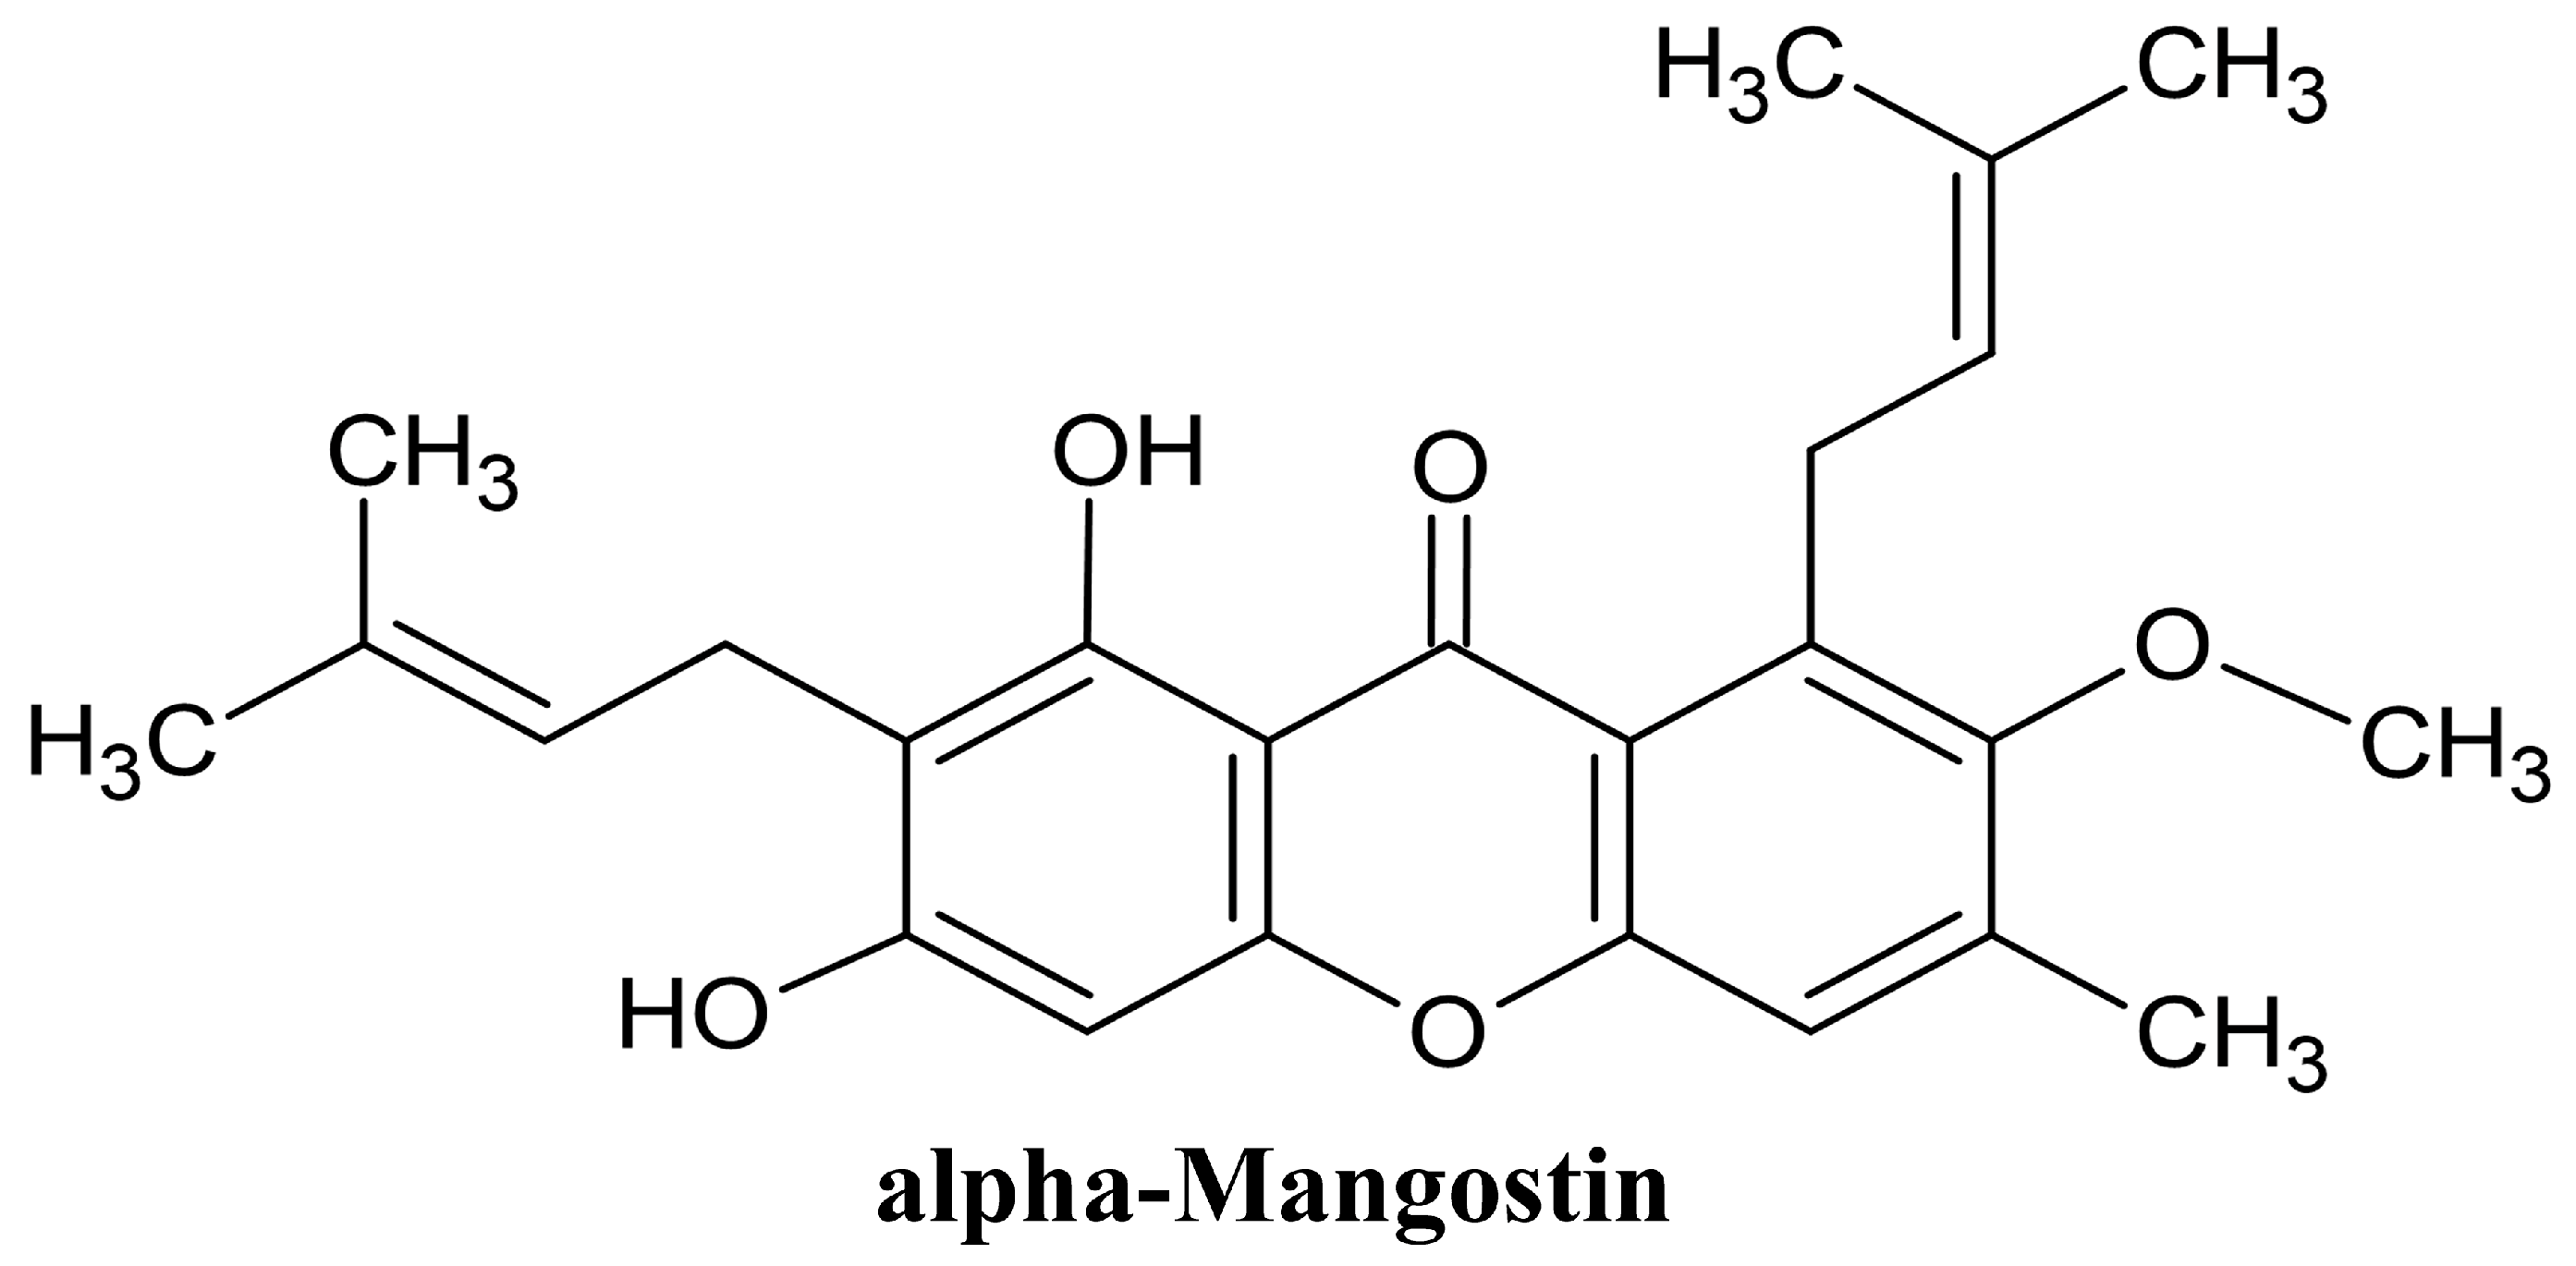
1. Introduction
2. Materials and Methods
2.1. Study Registration
2.2. Literature Search Strategy
2.3. Study Selection
2.4. Data Extraction
2.5. Quality Assessment
2.6. Data Synthesis and Analysis
3. Results
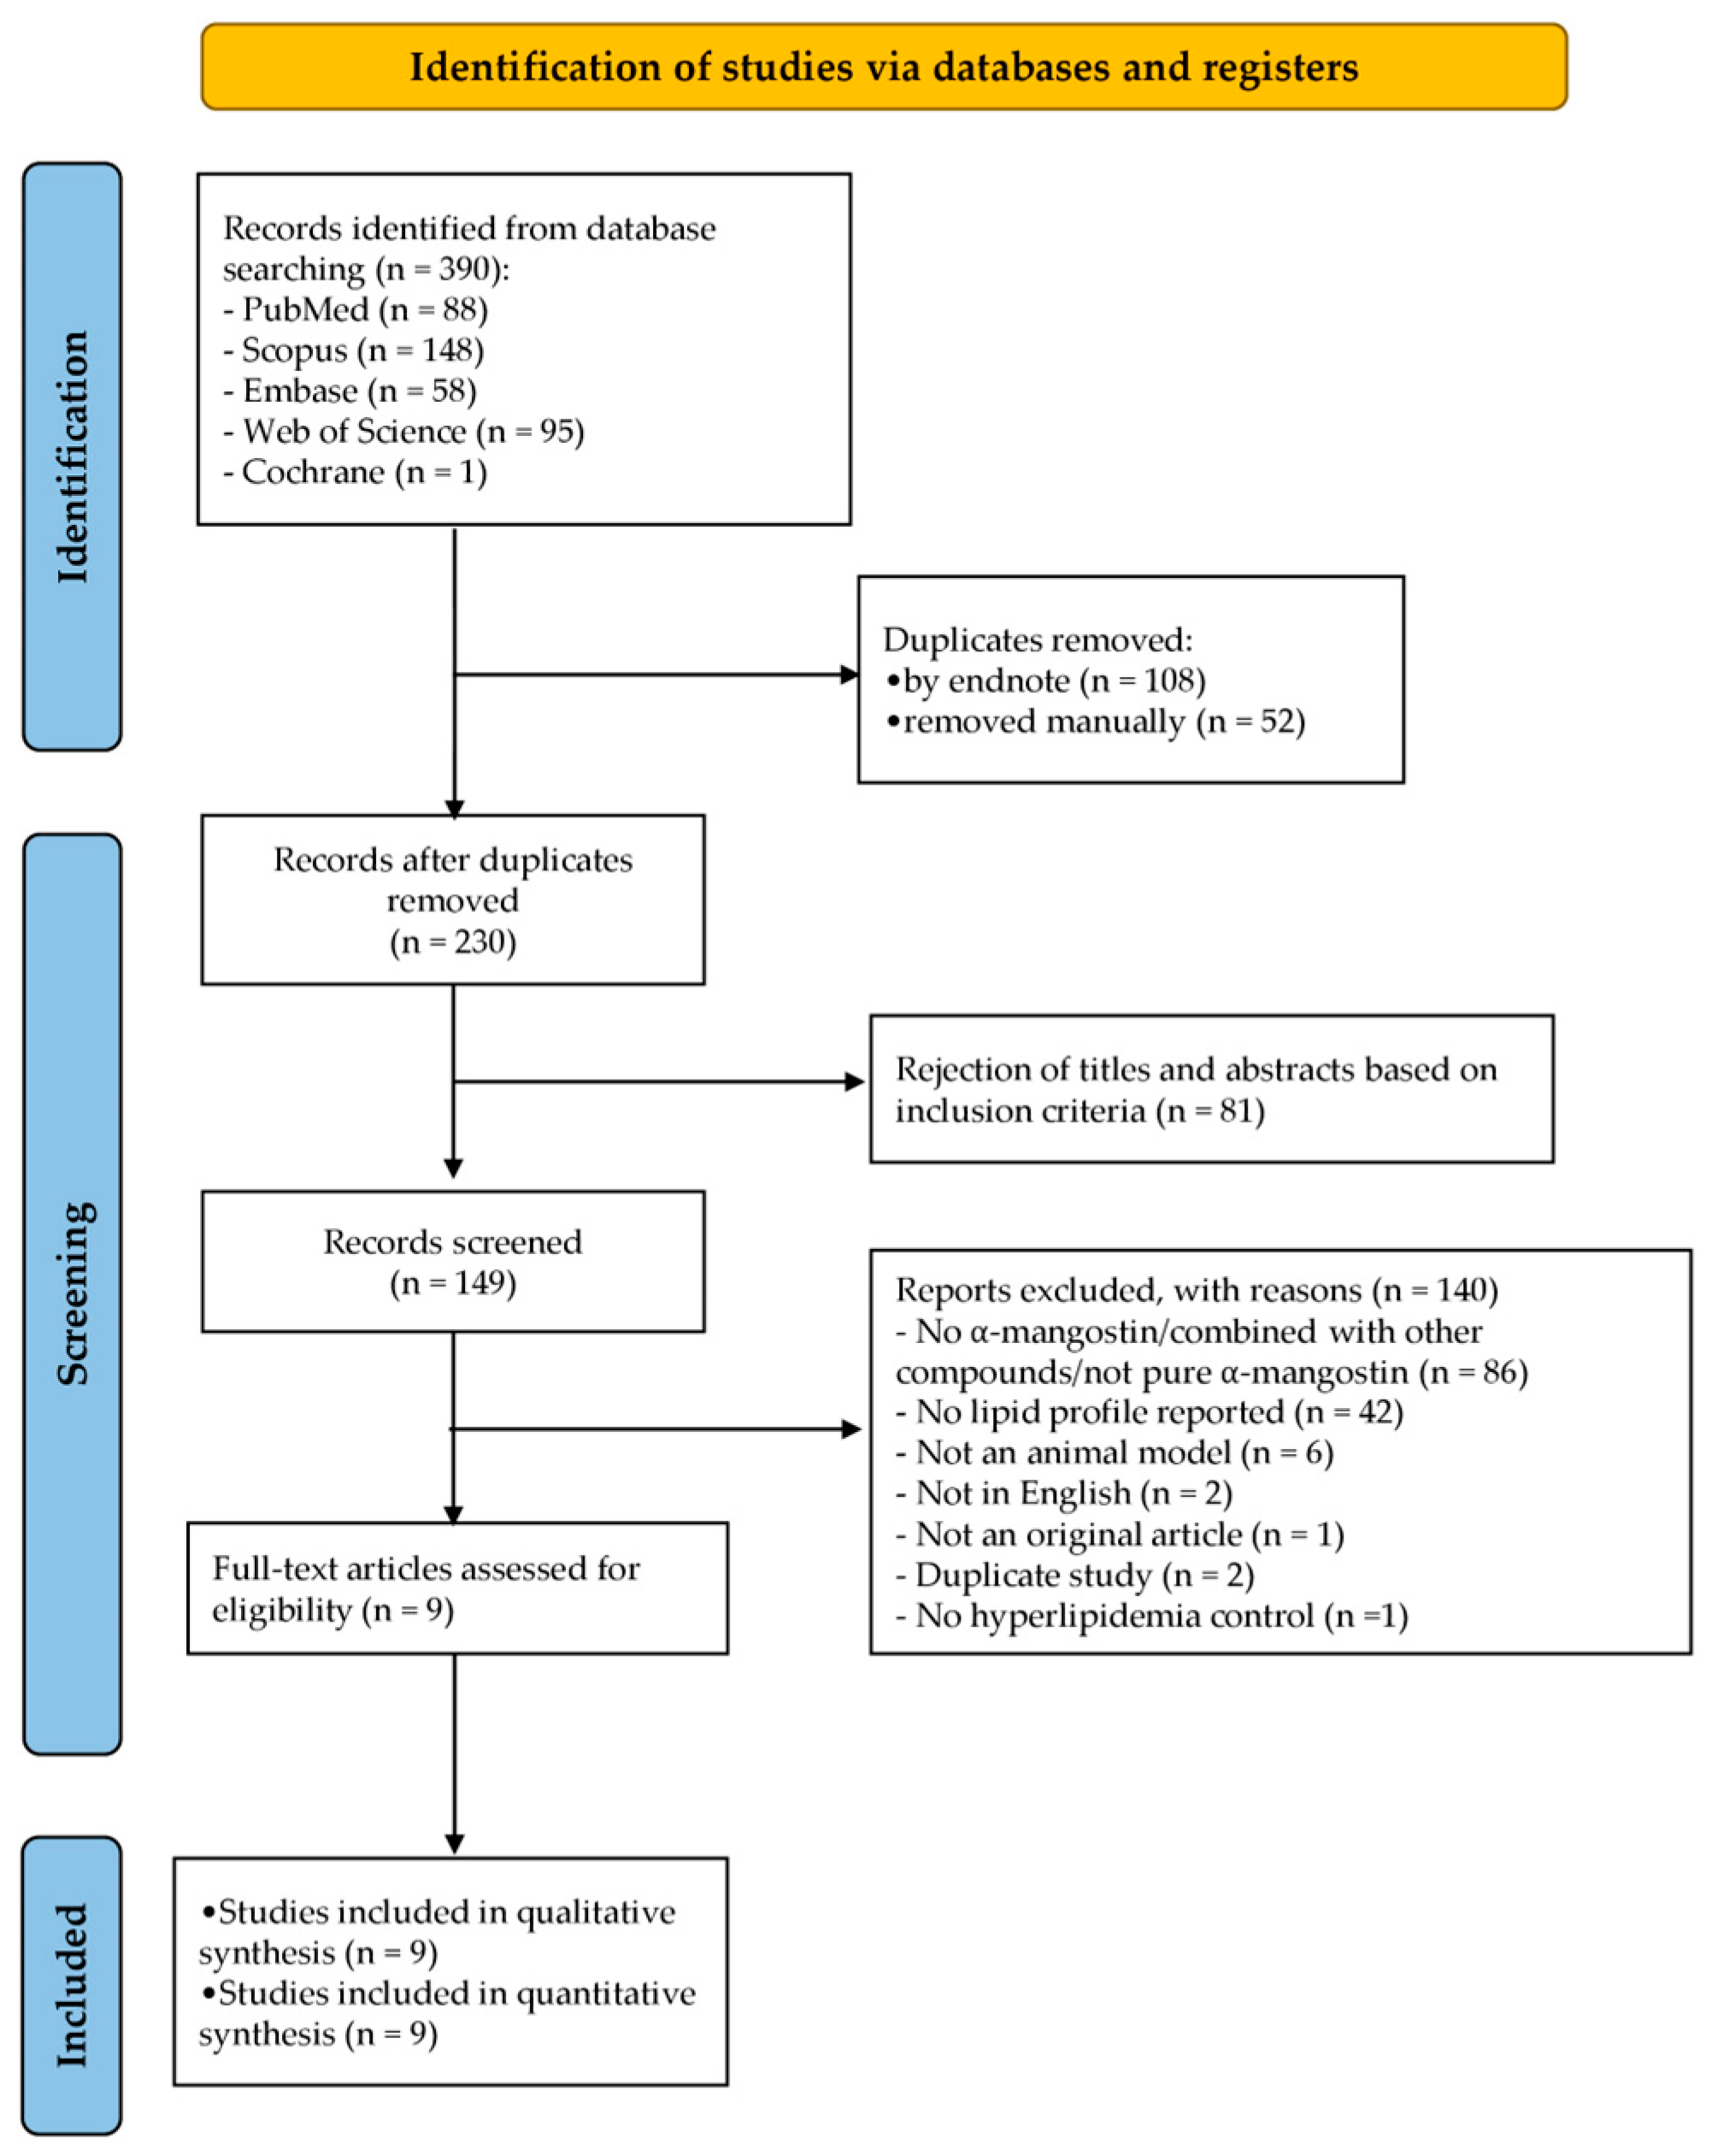
3.1. Literature Search
3.2. Study Characteristics
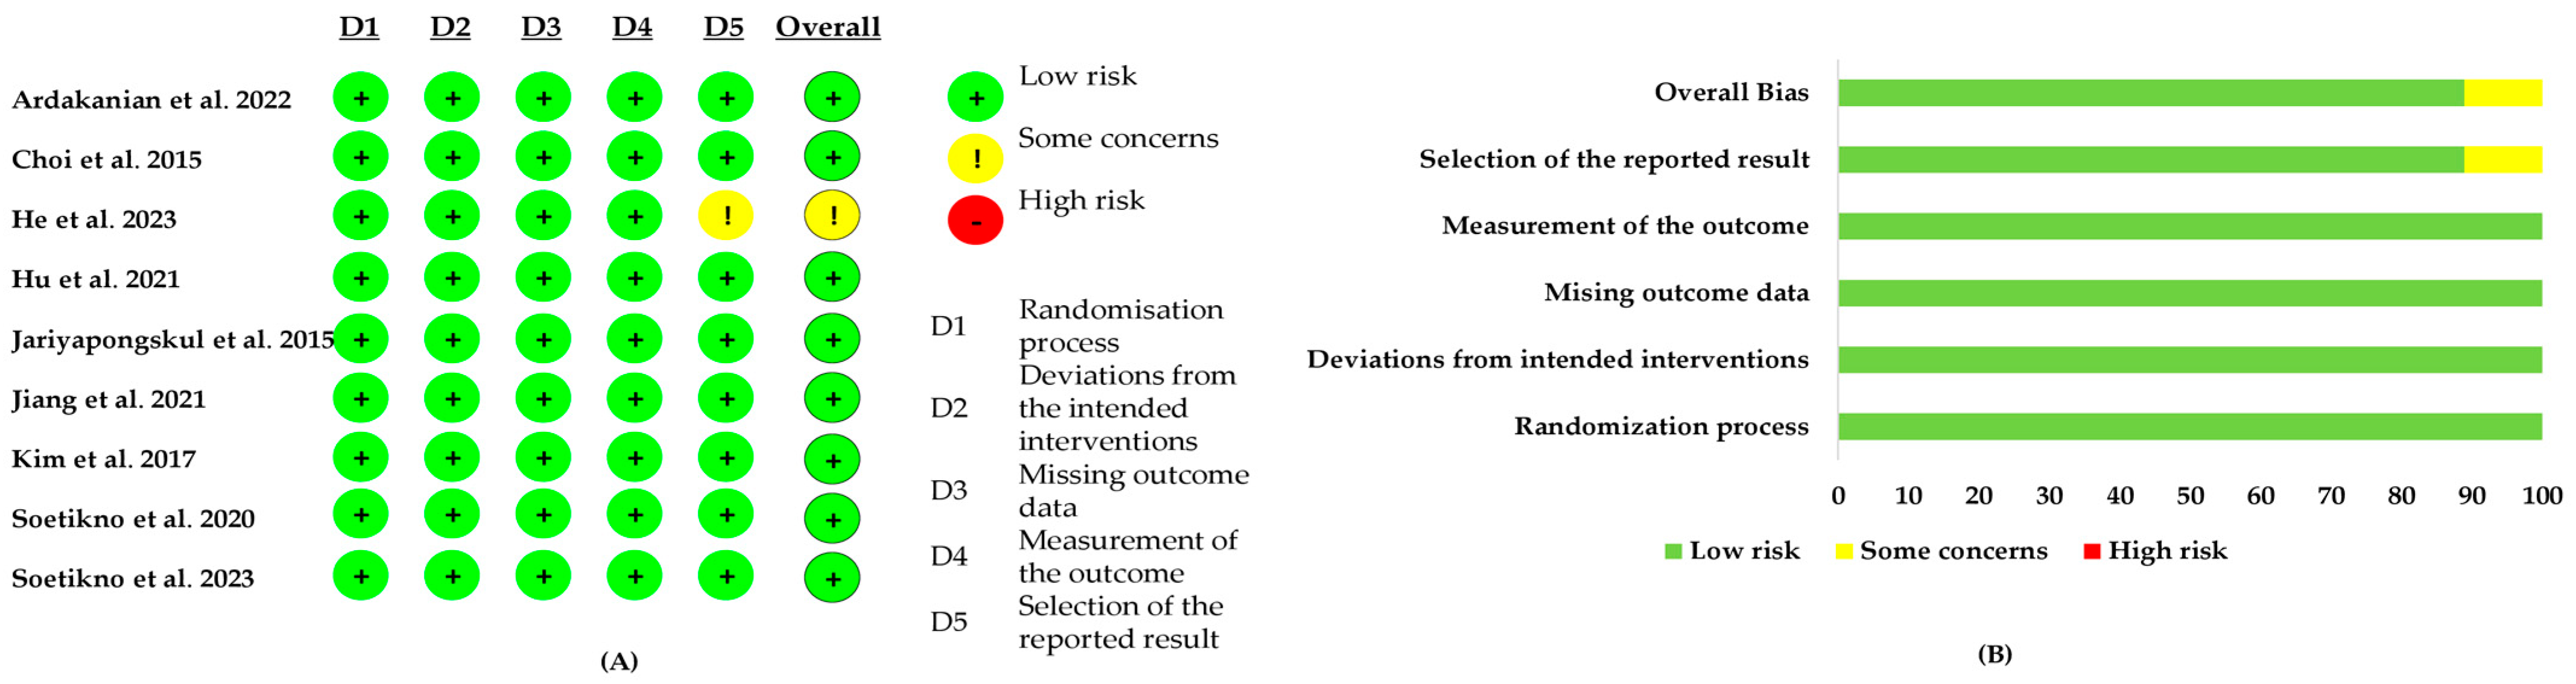
3.3. Risk-of-Bias Assessment
3.4. Result of Meta-Analysis
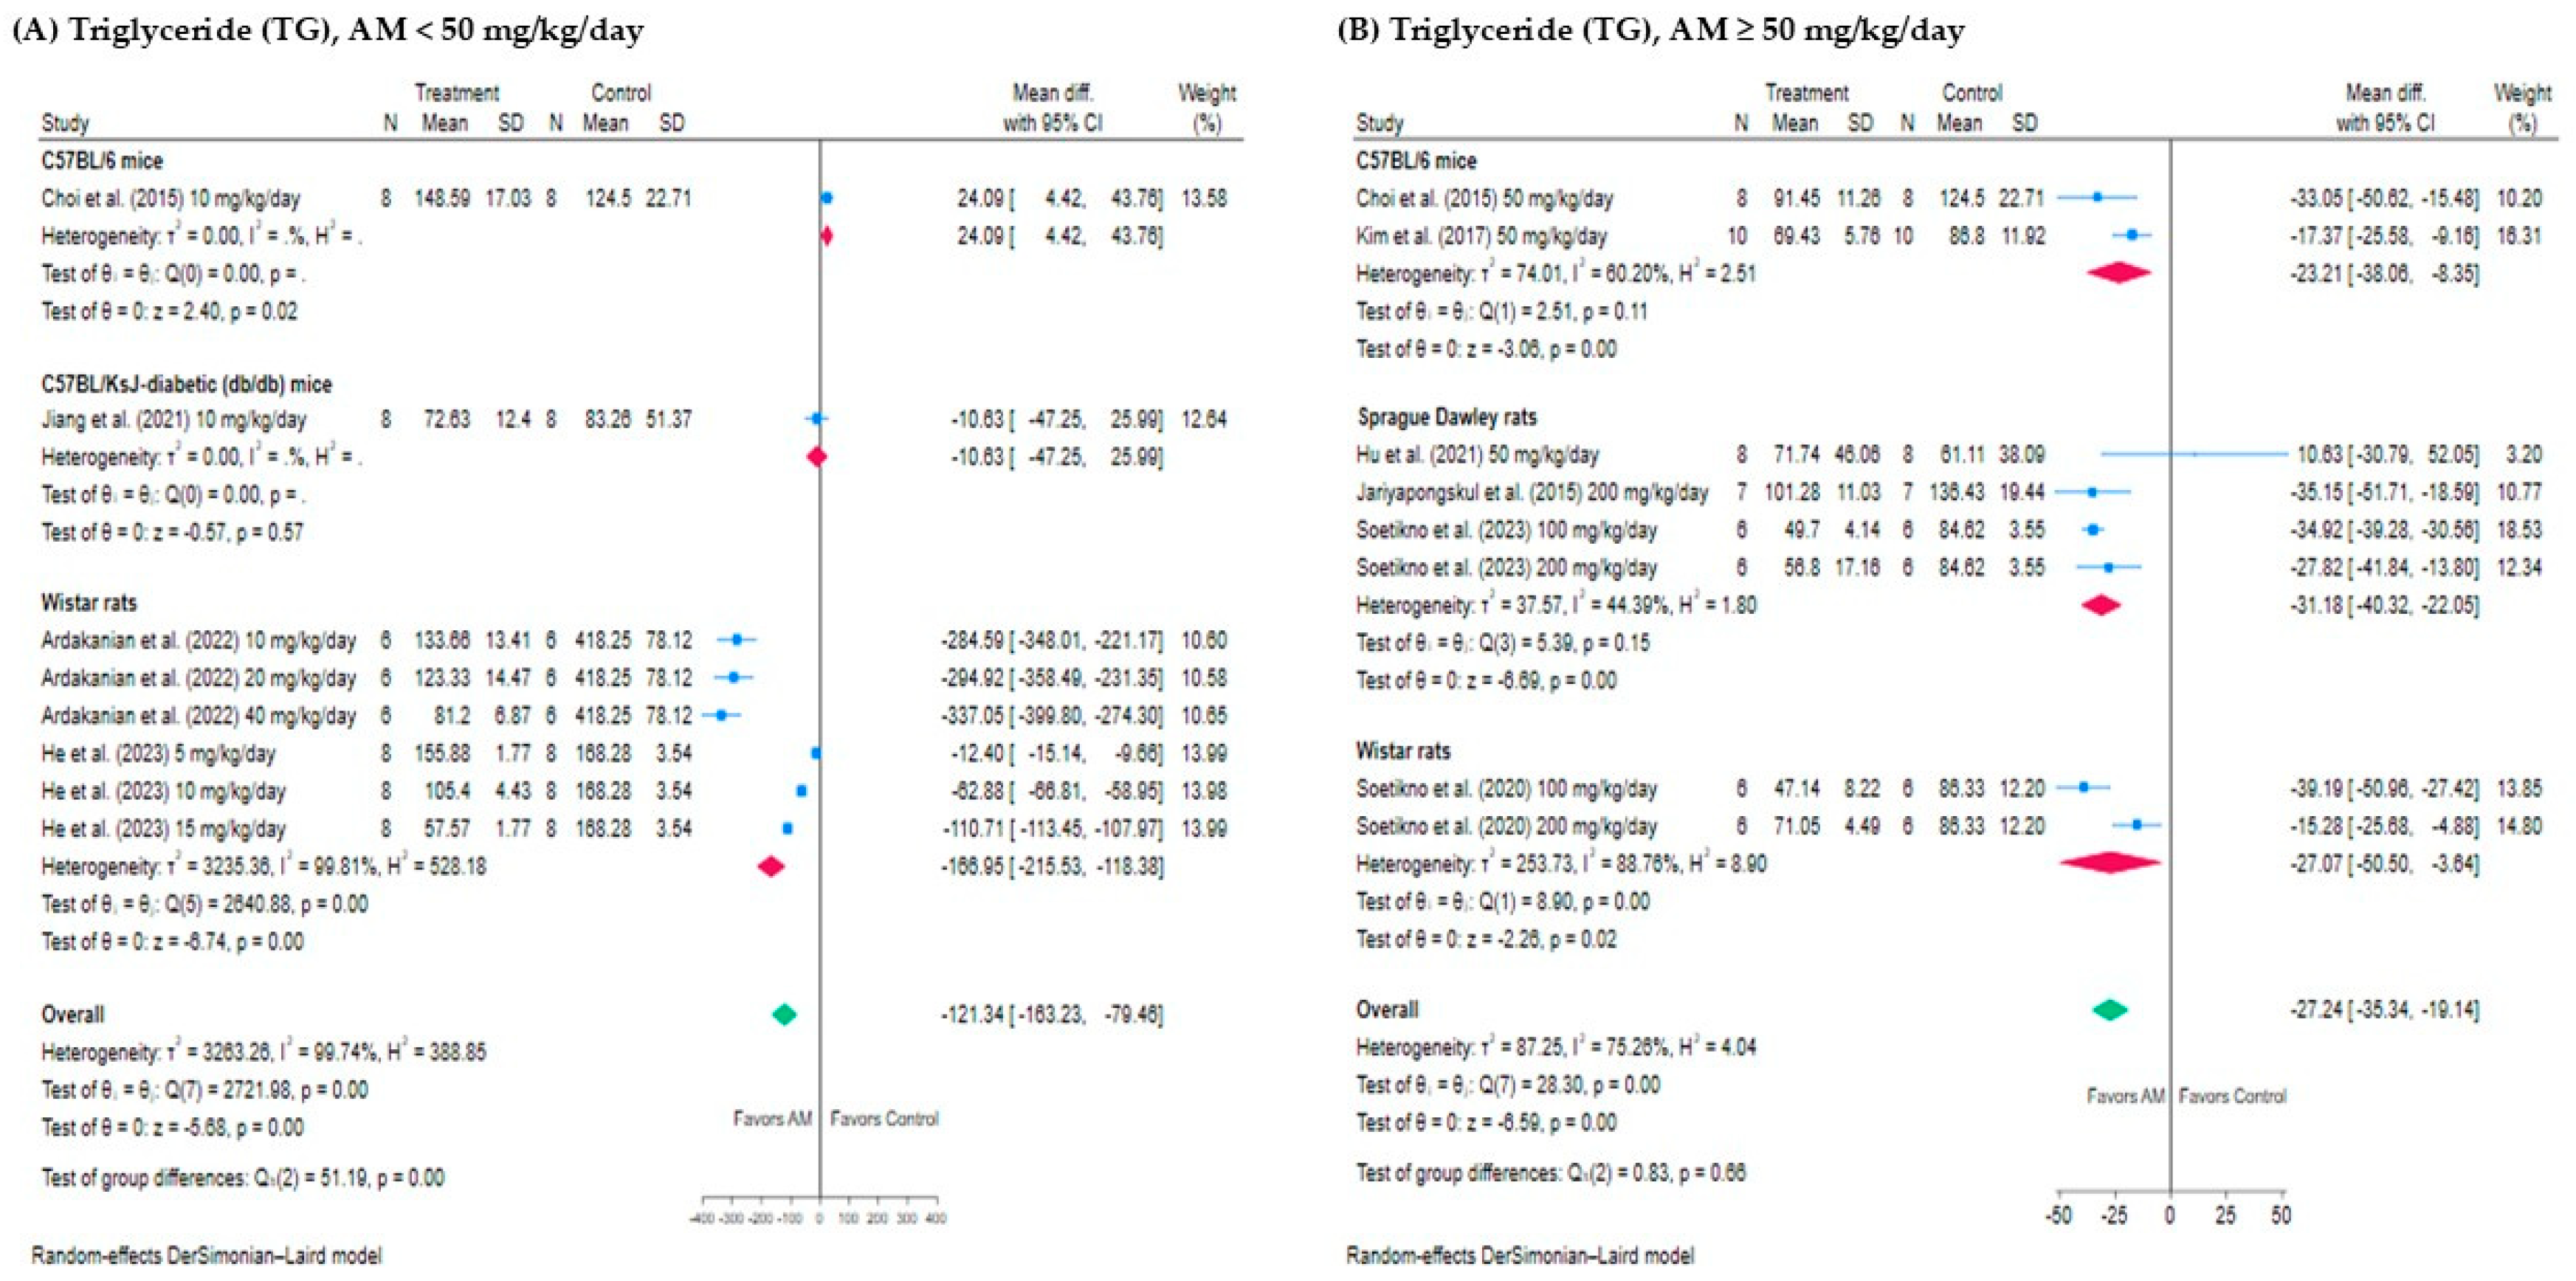
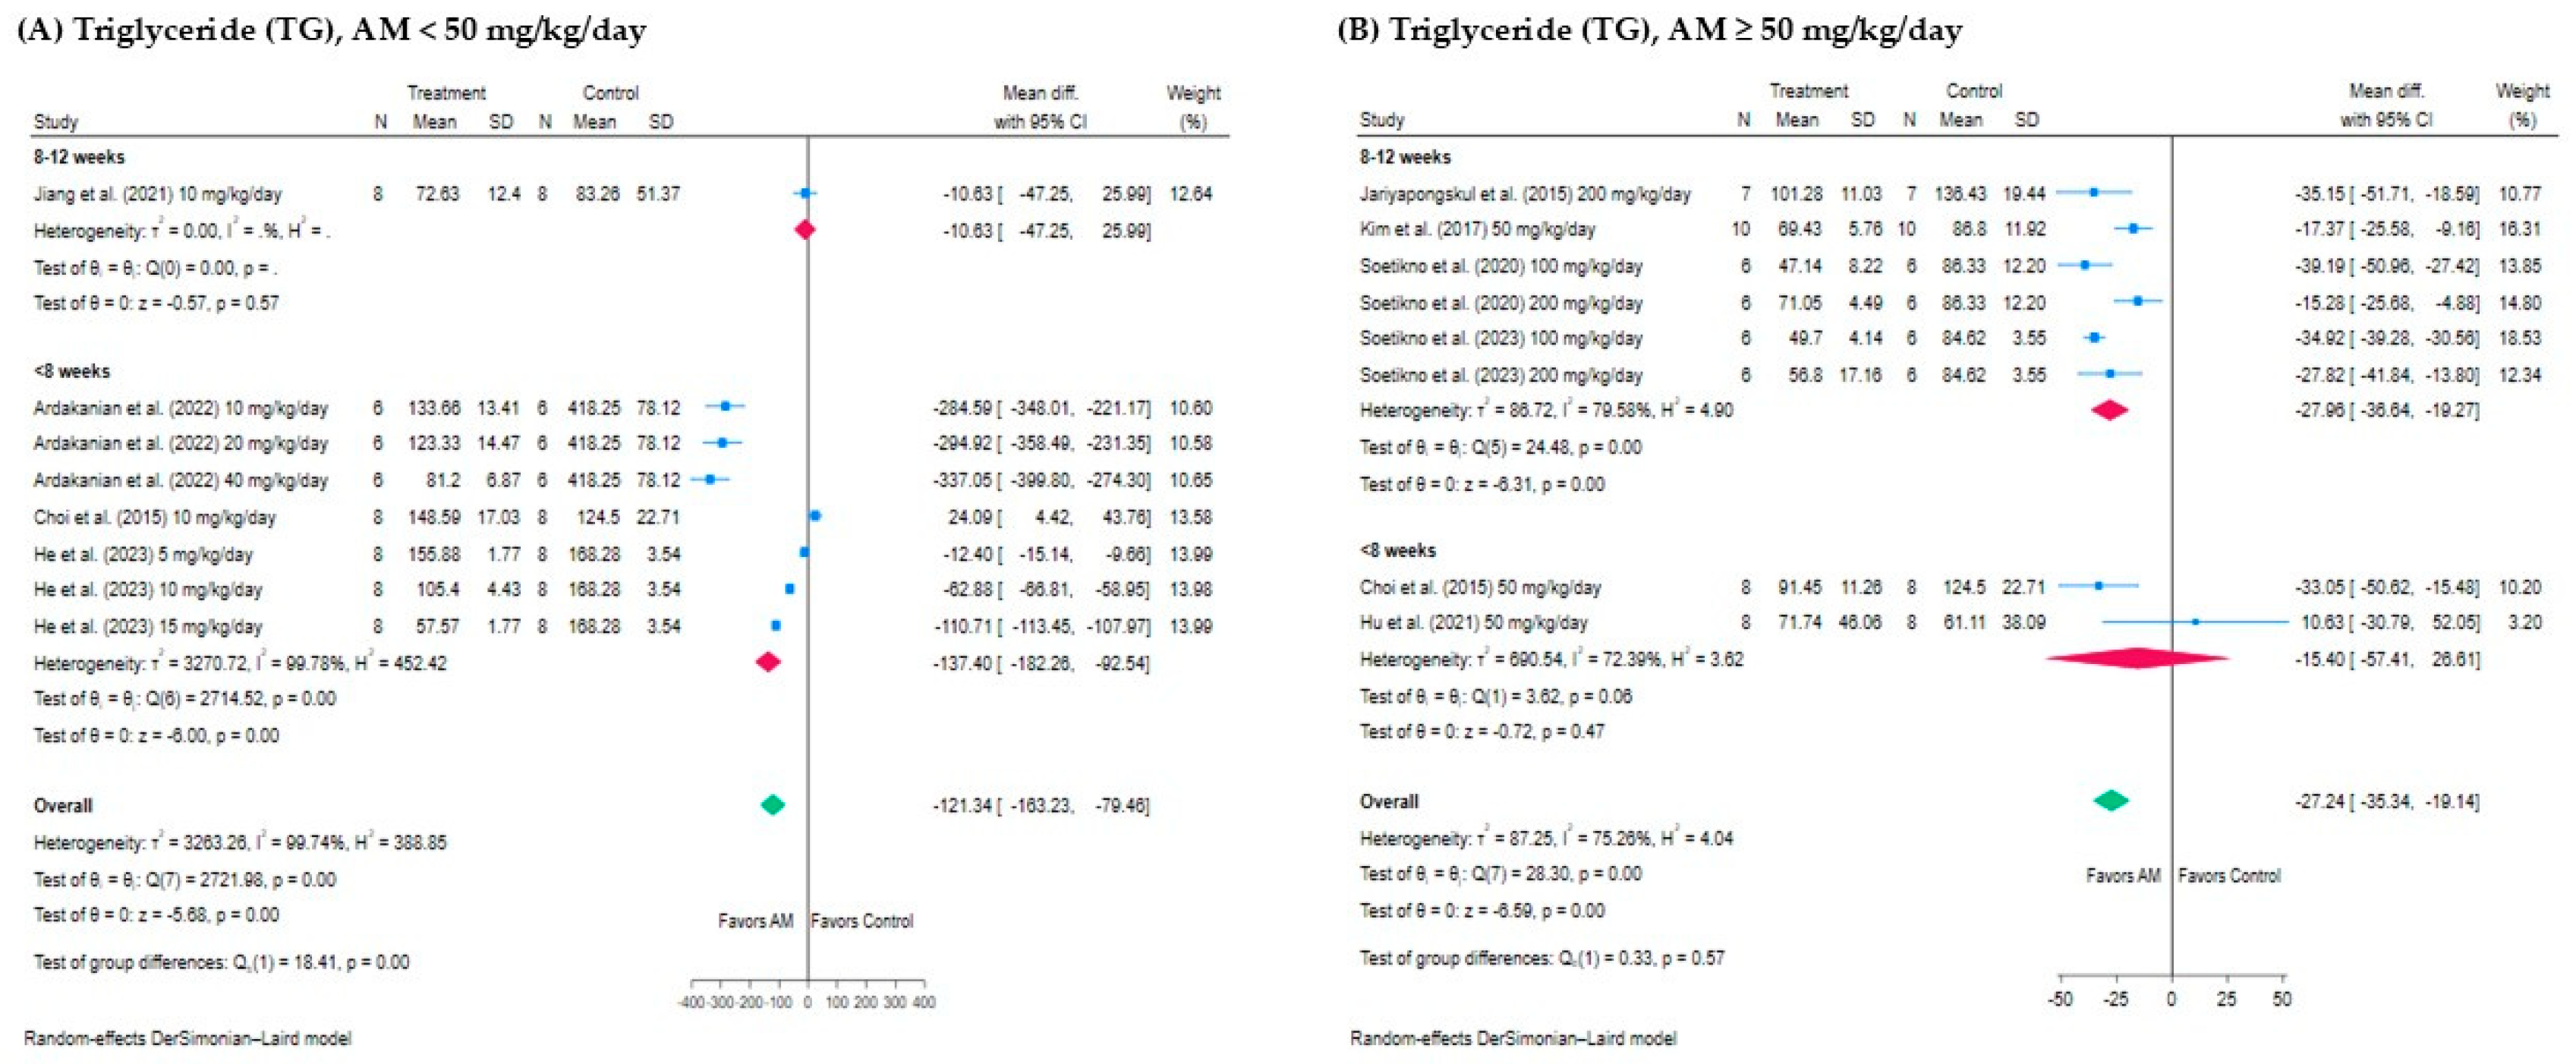
3.4.1. Effect of AM on Triglyceride (TG)
3.4.2. Effect of AM on Total Cholesterol (TC)
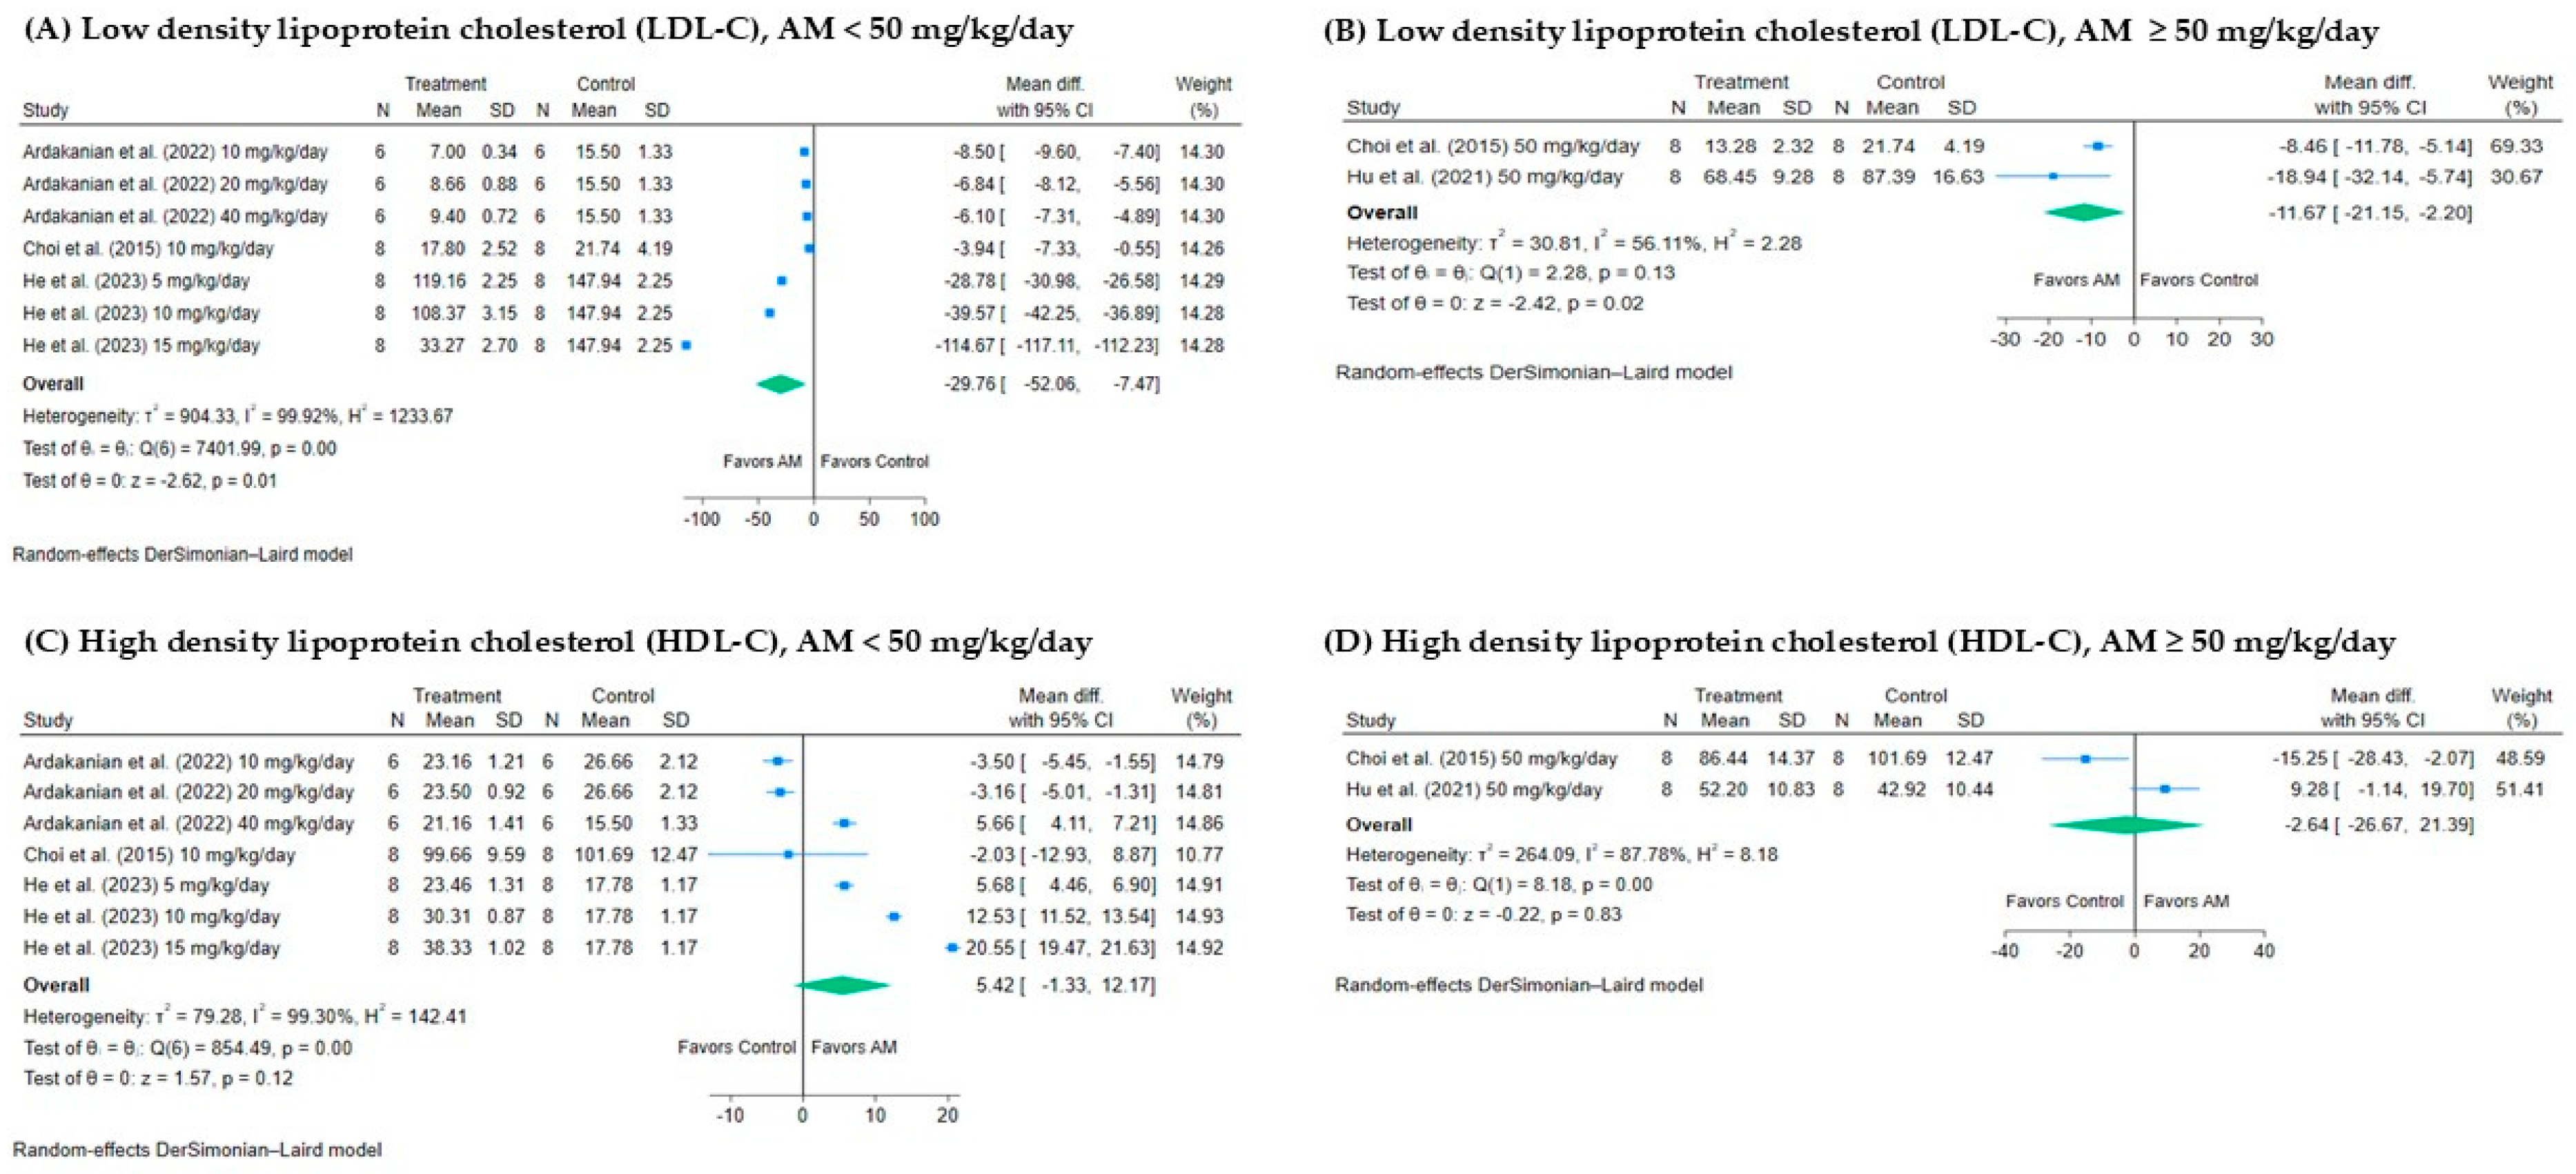
3.4.3. Effect of AM on Low-Density Lipoprotein Cholesterol (LDL-C)
3.4.4. Effect of AM on High-Density Lipoprotein Cholesterol (HDL-C)
3.5. Subgroup Analysis
3.5.1. Subgroup Analysis of the Effect of AM on TG Levels
3.5.2. Subgroup Analysis of the Effect of AM on TC Levels
3.5.3. Subgroup Analysis of the Effect of AM on LDL-C Levels
3.5.4. Subgroup Analysis of the Effect of AM on HDL-C Levels
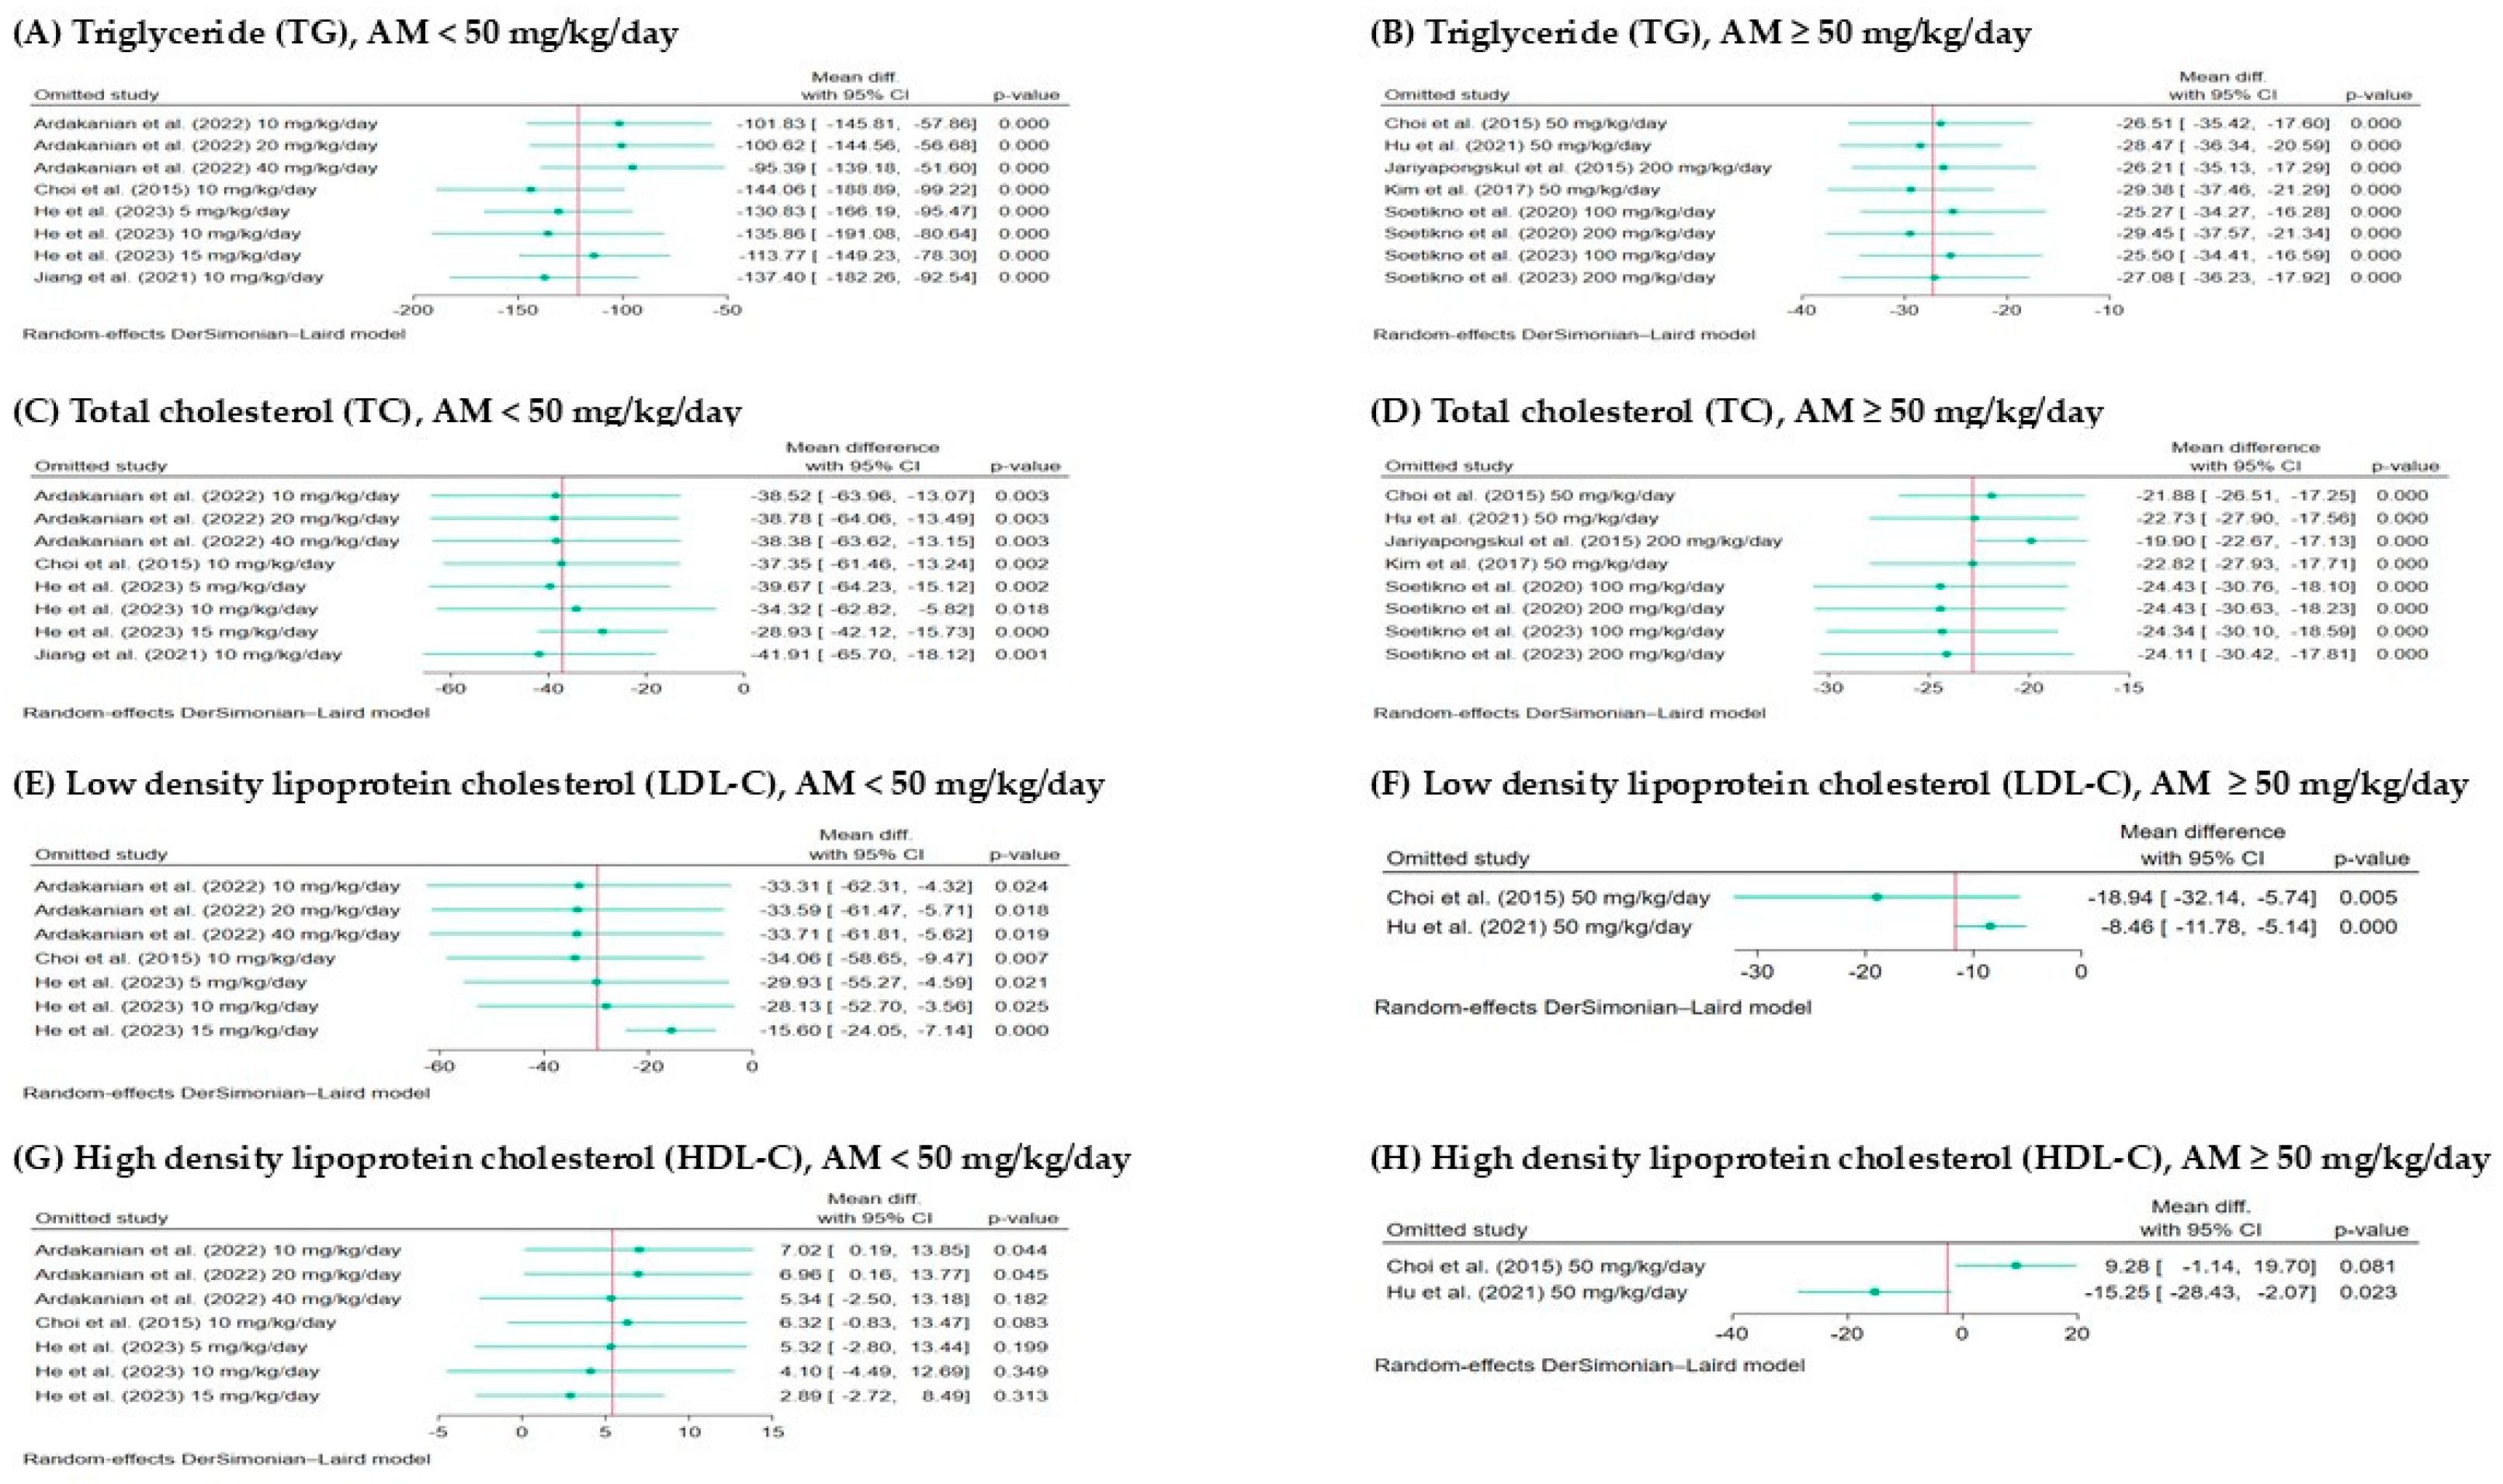
3.6. Sensitivity Analysis and Publication Bias
4. Discussion
5. Conclusions
Supplementary Materials
Author Contributions
Funding
Institutional Review Board Statement
Informed Consent Statement
Data Availability Statement
Acknowledgments
Conflicts of Interest
References
- Hedayatnia, M.; Asadi, Z.; Zare-Feyzabadi, R.; Yaghooti-Khorasani, M.; Ghazizadeh, H.; Ghaffarian-Zirak, R.; Nosrati-Tirkani, A.; Mohammadi-Bajgiran, M.; Rohban, M.; Sadabadi, F.; et al. Dyslipidemia and cardiovascular disease risk among the MASHAD study population. Lipids Health Dis. 2020, 19, 42. [Google Scholar] [CrossRef] [PubMed]
- Abbasi, S.; Khan, A.; Choudhry, M.W. New insights into the treatment of hyperlipidemia: Pharmacological updates and emerging treatments. Cureus 2024, 16, e63078. [Google Scholar] [CrossRef] [PubMed]
- Collins, R.; Reith, C.; Emberson, J.; Armitage, J.; Baigent, C.; Blackwell, L.; Blumenthal, R.; Danesh, J.; Smith, G.D.; DeMets, D.; et al. Interpretation of the evidence for the efficacy and safety of statin therapy. Lancet 2016, 388, 2532–2561. [Google Scholar] [CrossRef]
- Ruscica, M.; Ferri, N.; Banach, M.; Sirtori, C.R.; Corsini, A. Side effects of statins: From pathophysiology and epidemiology to diagnostic and therapeutic implications. Cardiovasc. Res. 2022, 118, 3288–3304. [Google Scholar] [CrossRef]
- Alam, M.; Rashid, S.; Fatima, K.; Adnan, M.; Shafie, A.; Akhtar, M.S.; Ganie, A.H.; Eldin, S.M.; Islam, A.; Khan, I.; et al. Biochemical features and therapeutic potential of α-Mangostin: Mechanism of action, medicinal values, and health benefits. Biomed. Pharmacother. 2023, 163, 114710. [Google Scholar] [CrossRef] [PubMed]
- Pedraza-Chaverri, J.; Cárdenas-Rodríguez, N.; Orozco-Ibarra, M.; Pérez-Rojas, J.M. Medicinal properties of mangosteen (Garcinia mangostana). Food Chem. Toxicol. 2008, 46, 3227–3239. [Google Scholar] [CrossRef]
- Chen, L.G.; Yang, L.L.; Wang, C.C. Anti-inflammatory activity of mangostins from Garcinia mangostana. Food Chem. Toxicol. 2008, 46, 688–693. [Google Scholar] [CrossRef]
- Majdalawieh, A.F.; Terro, T.M.; Ahari, S.H.; Abu-Yousef, I.A. α-Mangostin: A xanthone derivative in mangosteen with potent anti-cancer properties. Biomolecules 2024, 14, 1382. [Google Scholar] [CrossRef]
- Soontornwat, A.; Pongsuttiyakorn, T.; Rakmae, S.; Sritham, E.; Sirisomboon, P.; Pun, U.K.; Krusong, W.; Pornchaloempong, P. Mangosteen pericarp processing technology to create economic value and reduce biowaste. Foods 2024, 13, 2286. [Google Scholar] [CrossRef]
- Obolskiy, D.; Pischel, I.; Siriwatanametanon, N.; Heinrich, M. Garcinia mangostana L.: A phytochemical and pharmacological review. Phytother. Res. 2009, 23, 1047–1065. [Google Scholar] [CrossRef]
- Abate, M.; Pagano, C.; Masullo, M.; Citro, M.; Pisanti, S.; Piacente, S.; Bifulco, M. Mangostanin, a xanthone derived from Garcinia mangostana fruit, exerts protective and reparative effects on oxidative damage in human keratinocytes. Pharmaceuticals 2022, 15, 84. [Google Scholar] [CrossRef]
- Li, L.; Brunner, I.; Han, A.R.; Hamburger, M.; Kinghorn, A.D.; Frye, R.; Butterweck, V. Pharmacokinetics of α-mangostin in rats after intravenous and oral application. Mol. Nutr. Food Res. 2011, 55, S67–S74. [Google Scholar] [CrossRef] [PubMed]
- Choi, Y.H.; Bae, J.K.; Chae, H.-S.; Kim, Y.-M.; Sreymom, Y.; Han, L.; Jang, H.Y.; Chin, Y.-W. α-Mangostin regulates hepatic steatosis and obesity through SirT1-AMPK and PPARγ pathways in high-fat diet-induced obese mice. J. Agric. Food Chem. 2015, 63, 8399–8406. [Google Scholar] [CrossRef] [PubMed]
- Chae, H.S.; Kim, H.J.; Ko, H.J.; Lee, C.H.; Choi, Y.H.; Chin, Y.W. Transcriptome analysis illuminates a hub role of SREBP2 in cholesterol metabolism by α-mangostin. ACS Omega 2020, 5, 31126–31136. [Google Scholar] [CrossRef] [PubMed]
- Soetikno, V.; Andini, P.; Iskandar, M.; Matheos, C.C.; Herdiman, J.A.; Kyle, I.K.; Suma, M.N.I.; Louisa, M.; Estuningtyas, A. Alpha-mangosteen lessens high-fat/high-glucose diet and low-dose streptozotocin induced-hepatic manifestations in the insulin resistance rat model. Pharm. Biol. 2023, 61, 241–248. [Google Scholar] [CrossRef]
- Liu, T.; Duan, W.; Nizigiyimana, P.; Gao, L.; Liao, Z.; Xu, B.; Liu, L.; Lei, M. Alpha-mangostin attenuates diabetic nephropathy in association with suppression of acid sphingomyelianse and endoplasmic reticulum stress. Biochem. Biophys. Res. Commun. 2018, 496, 394–400. [Google Scholar] [CrossRef]
- Hu, Y.H.; Han, J.; Wang, L.; Shi, C.; Li, Y.; Olatunji, O.J.; Wang, X.; Zuo, J. α-Mangostin alleviated inflammation in rats with adjuvant-induced arthritis by disrupting adipocytes-mediated metabolism-immune feedback. Front. Pharmacol. 2021, 12, 692806. [Google Scholar] [CrossRef]
- Chatatikun, M.; Tedasen, A.; Phinyo, P.; Wongyikul, P.; Klangbud, W.K.; Kawakami, F.; Imai, M.; Chuaijit, S.; Rachmuangfang, S.; Phuwarinyodsakul, S.; et al. Hypoglycemic activity of Garcinia mangostana L. extracts on diabetes rodent models: A systematic review and network meta-analysis. Front. Pharmacol. 2024, 15, 1472419. [Google Scholar] [CrossRef]
- Tiago, F.; Vincenzo, R.; Marta, C.; Oleguer, C. Ranking sports science and medicine interventions impacting team performance: A protocol for a systematic review and meta-analysis of observational studies in elite football. BMJ Open Sport Exerc. Med. 2024, 10, e002196. [Google Scholar]
- Cumpston, M.S.; McKenzie, J.E.; Welch, V.A.; Brennan, S.E. Strengthening systematic reviews in public health: Guidance in the Cochrane Handbook for Systematic Reviews of Interventions, 2nd edition. J. Public Health 2022, 44, e588–e592. [Google Scholar] [CrossRef]
- Nejadghaderi, S.A.; Balibegloo, M.; Rezaei, N. The Cochrane risk of bias assessment tool 2 (RoB 2) versus the original RoB: A perspective on the pros and cons. Health Sci. Rep. 2024, 7, e2165. [Google Scholar] [CrossRef] [PubMed]
- Waitayangkoon, P.; Charoenngam, N.; Ratchataswan, T.; Ponvilawan, B.; Jaroenlapnopparat, A.; Ungprasert, P. Increased risk of systemic lupus erythematosus in patients with chronic urticaria: A systematic review and meta-analysis. Mediterr. J. Rheumatol. 2023, 34, 121–128. [Google Scholar] [CrossRef]
- Andrade, C. How to understand the 95% confidence interval around the relative risk, odds ratio, and hazard ratio: As simple as it gets. J. Clin. Psychiatry 2023, 84, 23f14933. [Google Scholar] [CrossRef]
- Dettori, J.R.; Norvell, D.C.; Chapman, J.R. Fixed-effect vs random-effects models for meta-analysis: 3 points to consider. Glob. Spine J. 2022, 12, 1624–1626. [Google Scholar] [CrossRef]
- Yang, Y.; Macleod, M.; Pan, J.; Lagisz, M.; Nakagawa, S. Advanced methods and implementations for the meta-analyses of animal models: Current practices and future recommendations. Neurosci. Biobehav. Rev. 2023, 146, 105016. [Google Scholar] [CrossRef] [PubMed]
- Michael, H. The power functions of Begg’s and Egger’s tests for publication bias. Stat. Neerl. 2025, 79, e12364. [Google Scholar] [CrossRef]
- Sterne, J.A.; Sutton, A.J.; Ioannidis, J.P.; Terrin, N.; Jones, D.R.; Lau, J.; Carpenter, J.; Rücker, G.; Harbord, R.M.; Schmid, C.H.; et al. Recommendations for examining and interpreting funnel plot asymmetry in meta-analyses of randomised controlled trials. Br. Med. J. 2011, 343, d4002. [Google Scholar] [CrossRef]
- He, W.; Ye, H.; Li, H.; Gao, Q. Alpha mangostin ameliorates gestational diabetes in rats via alteration of oxidative stress and inflammation reaction. Int. J. Pharmacol. 2023, 19, 1–13. [Google Scholar] [CrossRef]
- Jiang, M.; Huang, S.; Duan, W.; Liu, Q.; Lei, M. Alpha-mangostin improves endothelial dysfunction in db/db mice through inhibition of aSMase/ceramide pathway. J. Cell. Mol. Med. 2021, 25, 3601–3609. [Google Scholar] [CrossRef]
- Kim, H.M.; Kim, Y.M.; Huh, J.H.; Lee, E.S.; Kwon, M.H.; Lee, B.R.; Ko, H.-J.; Chung, C.H. α-Mangostin ameliorates hepatic steatosis and insulin resistance by inhibition C-C chemokine receptor 2. PLoS ONE 2017, 12, e0179204. [Google Scholar] [CrossRef]
- Soetikno, V.; Murwantara, A.; Andini, P.; Charlie, F.; Lazarus, G.; Louisa, M.; Arozal, W. Alpha-mangostin improves cardiac hypertrophy and fibrosis and associated biochemical parameters in high-fat/high-glucose diet and low-dose streptozotocin injection-induced type 2 diabetic rats. J. Exp. Pharmacol. 2020, 12, 27–38. [Google Scholar] [CrossRef] [PubMed]
- Ardakanian, A.; Ghasemzadeh Rahbardar, M.; Omidkhoda, F.; Razavi, B.M.; Hosseinzadeh, H. Effect of alpha-mangostin on olanzapine-induced metabolic disorders in rats. Iran. J. Basic Med. Sci. 2022, 25, 198–207. [Google Scholar]
- Jariyapongskul, A.; Areebambud, C.; Suksamrarn, S.; Mekseepralard, C. Alpha-mangostin attenuation of hyperglycemia-induced ocular hypoperfusion and blood retinal barrier leakage in the early stage of type 2 diabetes rats. BioMed Res. Int. 2015, 2015, 785826. [Google Scholar] [CrossRef] [PubMed]
- Cheng, F.; Dun, Y.; Cheng, J.; Ripley-Gonzalez, J.W.; Jiang, W.; You, B.; Liu, S. Exercise activates autophagy and regulates endoplasmic reticulum stress in muscle of high-fat diet mice to alleviate insulin resistance. Biochem. Biophys. Res. Commun. 2022, 601, 45–51. [Google Scholar] [CrossRef]
- Wang, J.; Zhao, H.; Yu, J.; Xu, X.; Liu, W.; Jing, H.; Li, N.; Tang, Y.; Li, Y.; Cai, J.; et al. MiR-92b targets p57kip2 to modulate the resistance of hepatocellular carcinoma (HCC) to ionizing radiation (IR) -based radiotherapy. Biomed. Pharmacother. 2019, 110, 646–655. [Google Scholar] [CrossRef] [PubMed]
- Cicero, A.F.G.; Fogacci, F.; Stoian, A.P.; Vrablik, M.; Al Rasadi, K.; Banach, M.; Toth, P.P.; Rizzo, M. Nutraceuticals in the management of dyslipidemia: Which, when, and for whom? could nutraceuticals help low-risk individuals with non-optimal lipid levels? Curr. Atheroscler. Rep. 2021, 23, 57. [Google Scholar] [CrossRef]
- Wathoni, N.; Rusdin, A.; Motoyama, K.; Joni, I.M.; Lesmana, R.; Muchtaridi, M. Nanoparticle drug delivery systems for α-mangostin. Nanotechnol. Sci. Appl. 2020, 13, 23–36. [Google Scholar] [CrossRef]


| Parameter | Description |
|---|---|
| Population (P) | Animal models with induced hyperlipidemia or naturally occurring elevated lipid profiles. |
| Intervention (I) | Administration of alpha-mangostin in varying dosages and routes. |
| Comparator (C) | Vehicle-treated or placebo-treated control groups. |
| Outcome (O) | Changes in lipid profiles, including triglycerides (TG), total cholesterol (TC), low-density lipoprotein cholesterol (LDL-C), and high-density lipoprotein cholesterol (HDL-C). |
| Study design (S) | Experimental animal studies with control groups. |
| Study ID | Year | Study Region | Type of Alpha-Mangostin | Route | Duration | Animal Species | Models | Number (Treatment/Control) | Treatment | Outcomes (Lipid Profile) |
|---|---|---|---|---|---|---|---|---|---|---|
| Ardakanian et al. [32] | 2022 | Iran | Purified alpha-mangostin (>90%) | Intraperitoneal injection | 14 days | Wistar rats | Olanzapine-induced metabolic disorders | (6/6) | 10, 20, 40 mg/kg/day | TC, TG, HDL-C, LDL-C |
| Choi et al. [13] | 2015 | South Korea | Purified alpha-mangostin (>98%) | Oral | 7 days | C57BL/6 mice | High-fat diet-induced hepatic steatosis and obesity | (8/8) | 10, 50 mg/kg/day | TC, TG, HDL-C, LDL-C |
| He et al. [28] | 2023 | China | Purified alpha-mangostin | Oral | 18 days | Swiss albino Wistar rats | Streptozotocin-induced gestational diabetes | (8/8) | 5, 10, 15 mg/kg/day | TC, TG, HDL-C, LDL-C |
| Hu et al. [17] | 2021 | China | Purified alpha-mangostin | Oral | 30 days | Sprague-Dawley rats | Adjuvant-Induced Arthritis | (6/6) | 50 mg/kg/day | TC, TG, HDL-C, LDL-C |
| Jariyapongskul et al. [33] | 2015 | Thailand | Purified alpha-mangostin (>95%) | Oral | 8 weeks | Sprague-Dawley rats | Streptozotocin-induced Type 2 diabeted mellitus | (7/7) | 200 mg/kg/day | TC, TG |
| Jiang et al. [29] | 2021 | China | Purified alpha-mangostin (≥98%) | Intraperitoneal injection | 12 weeks | C57BL/KsJ-diabetic (db/db) mice | Diabetes mellitus | (8/8) | 10 mg/kg/day | TC, TG |
| Kim et al. [30] | 2017 | South Korea | Purified alpha-mangostin (95–99%) | Oral | 12 weeks | C57BL/6 mice | High-fat diet-induced obesity | (10/10) | 50 mg/kg/day | TC, TG |
| Soetikno et al. [31] | 2020 | Indonesia | Purified alpha-mangostin (>98%) | Oral | 8 weeks | Wistar rats | High-fat/high-glucose diet and streptozotocin-induced Type 2 diabetes mellitus | (6/6) | 100, 200 mg/kg/day | TC, TG |
| Soetikno et al. [15] | 2023 | Indonesia | Purified alpha-mangostin (≥98%) | Oral | 11 weeks | Sprague-Dawley rats | High-fat/high-glucose diet and streptozotocin-induced insulin resistance | (6/6) | 100, 200 mg/kg/day | TC, TG |
Disclaimer/Publisher’s Note: The statements, opinions and data contained in all publications are solely those of the individual author(s) and contributor(s) and not of MDPI and/or the editor(s). MDPI and/or the editor(s) disclaim responsibility for any injury to people or property resulting from any ideas, methods, instructions or products referred to in the content. |
© 2025 by the authors. Licensee MDPI, Basel, Switzerland. This article is an open access article distributed under the terms and conditions of the Creative Commons Attribution (CC BY) license (https://creativecommons.org/licenses/by/4.0/).
Share and Cite
Chatatikun, M.; Tedasen, A.; Phinyo, P.; Wongyikul, P.; Poolbua, P.; Klangbud, W.K.; Huang, J.C.; Leelawattana, R.; Phongphithakchai, A. Lipid-Lowering Effects of Alpha-Mangostin: A Systematic Review and Meta-Analysis in Hyperlipidemic Animal Models. Foods 2025, 14, 1880. https://doi.org/10.3390/foods14111880
Chatatikun M, Tedasen A, Phinyo P, Wongyikul P, Poolbua P, Klangbud WK, Huang JC, Leelawattana R, Phongphithakchai A. Lipid-Lowering Effects of Alpha-Mangostin: A Systematic Review and Meta-Analysis in Hyperlipidemic Animal Models. Foods. 2025; 14(11):1880. https://doi.org/10.3390/foods14111880
Chicago/Turabian StyleChatatikun, Moragot, Aman Tedasen, Phichayut Phinyo, Pakpoom Wongyikul, Passakorn Poolbua, Wiyada Kwanhian Klangbud, Jason C. Huang, Rattana Leelawattana, and Atthaphong Phongphithakchai. 2025. "Lipid-Lowering Effects of Alpha-Mangostin: A Systematic Review and Meta-Analysis in Hyperlipidemic Animal Models" Foods 14, no. 11: 1880. https://doi.org/10.3390/foods14111880
APA StyleChatatikun, M., Tedasen, A., Phinyo, P., Wongyikul, P., Poolbua, P., Klangbud, W. K., Huang, J. C., Leelawattana, R., & Phongphithakchai, A. (2025). Lipid-Lowering Effects of Alpha-Mangostin: A Systematic Review and Meta-Analysis in Hyperlipidemic Animal Models. Foods, 14(11), 1880. https://doi.org/10.3390/foods14111880