3.1. Sensory Evaluation Analysis
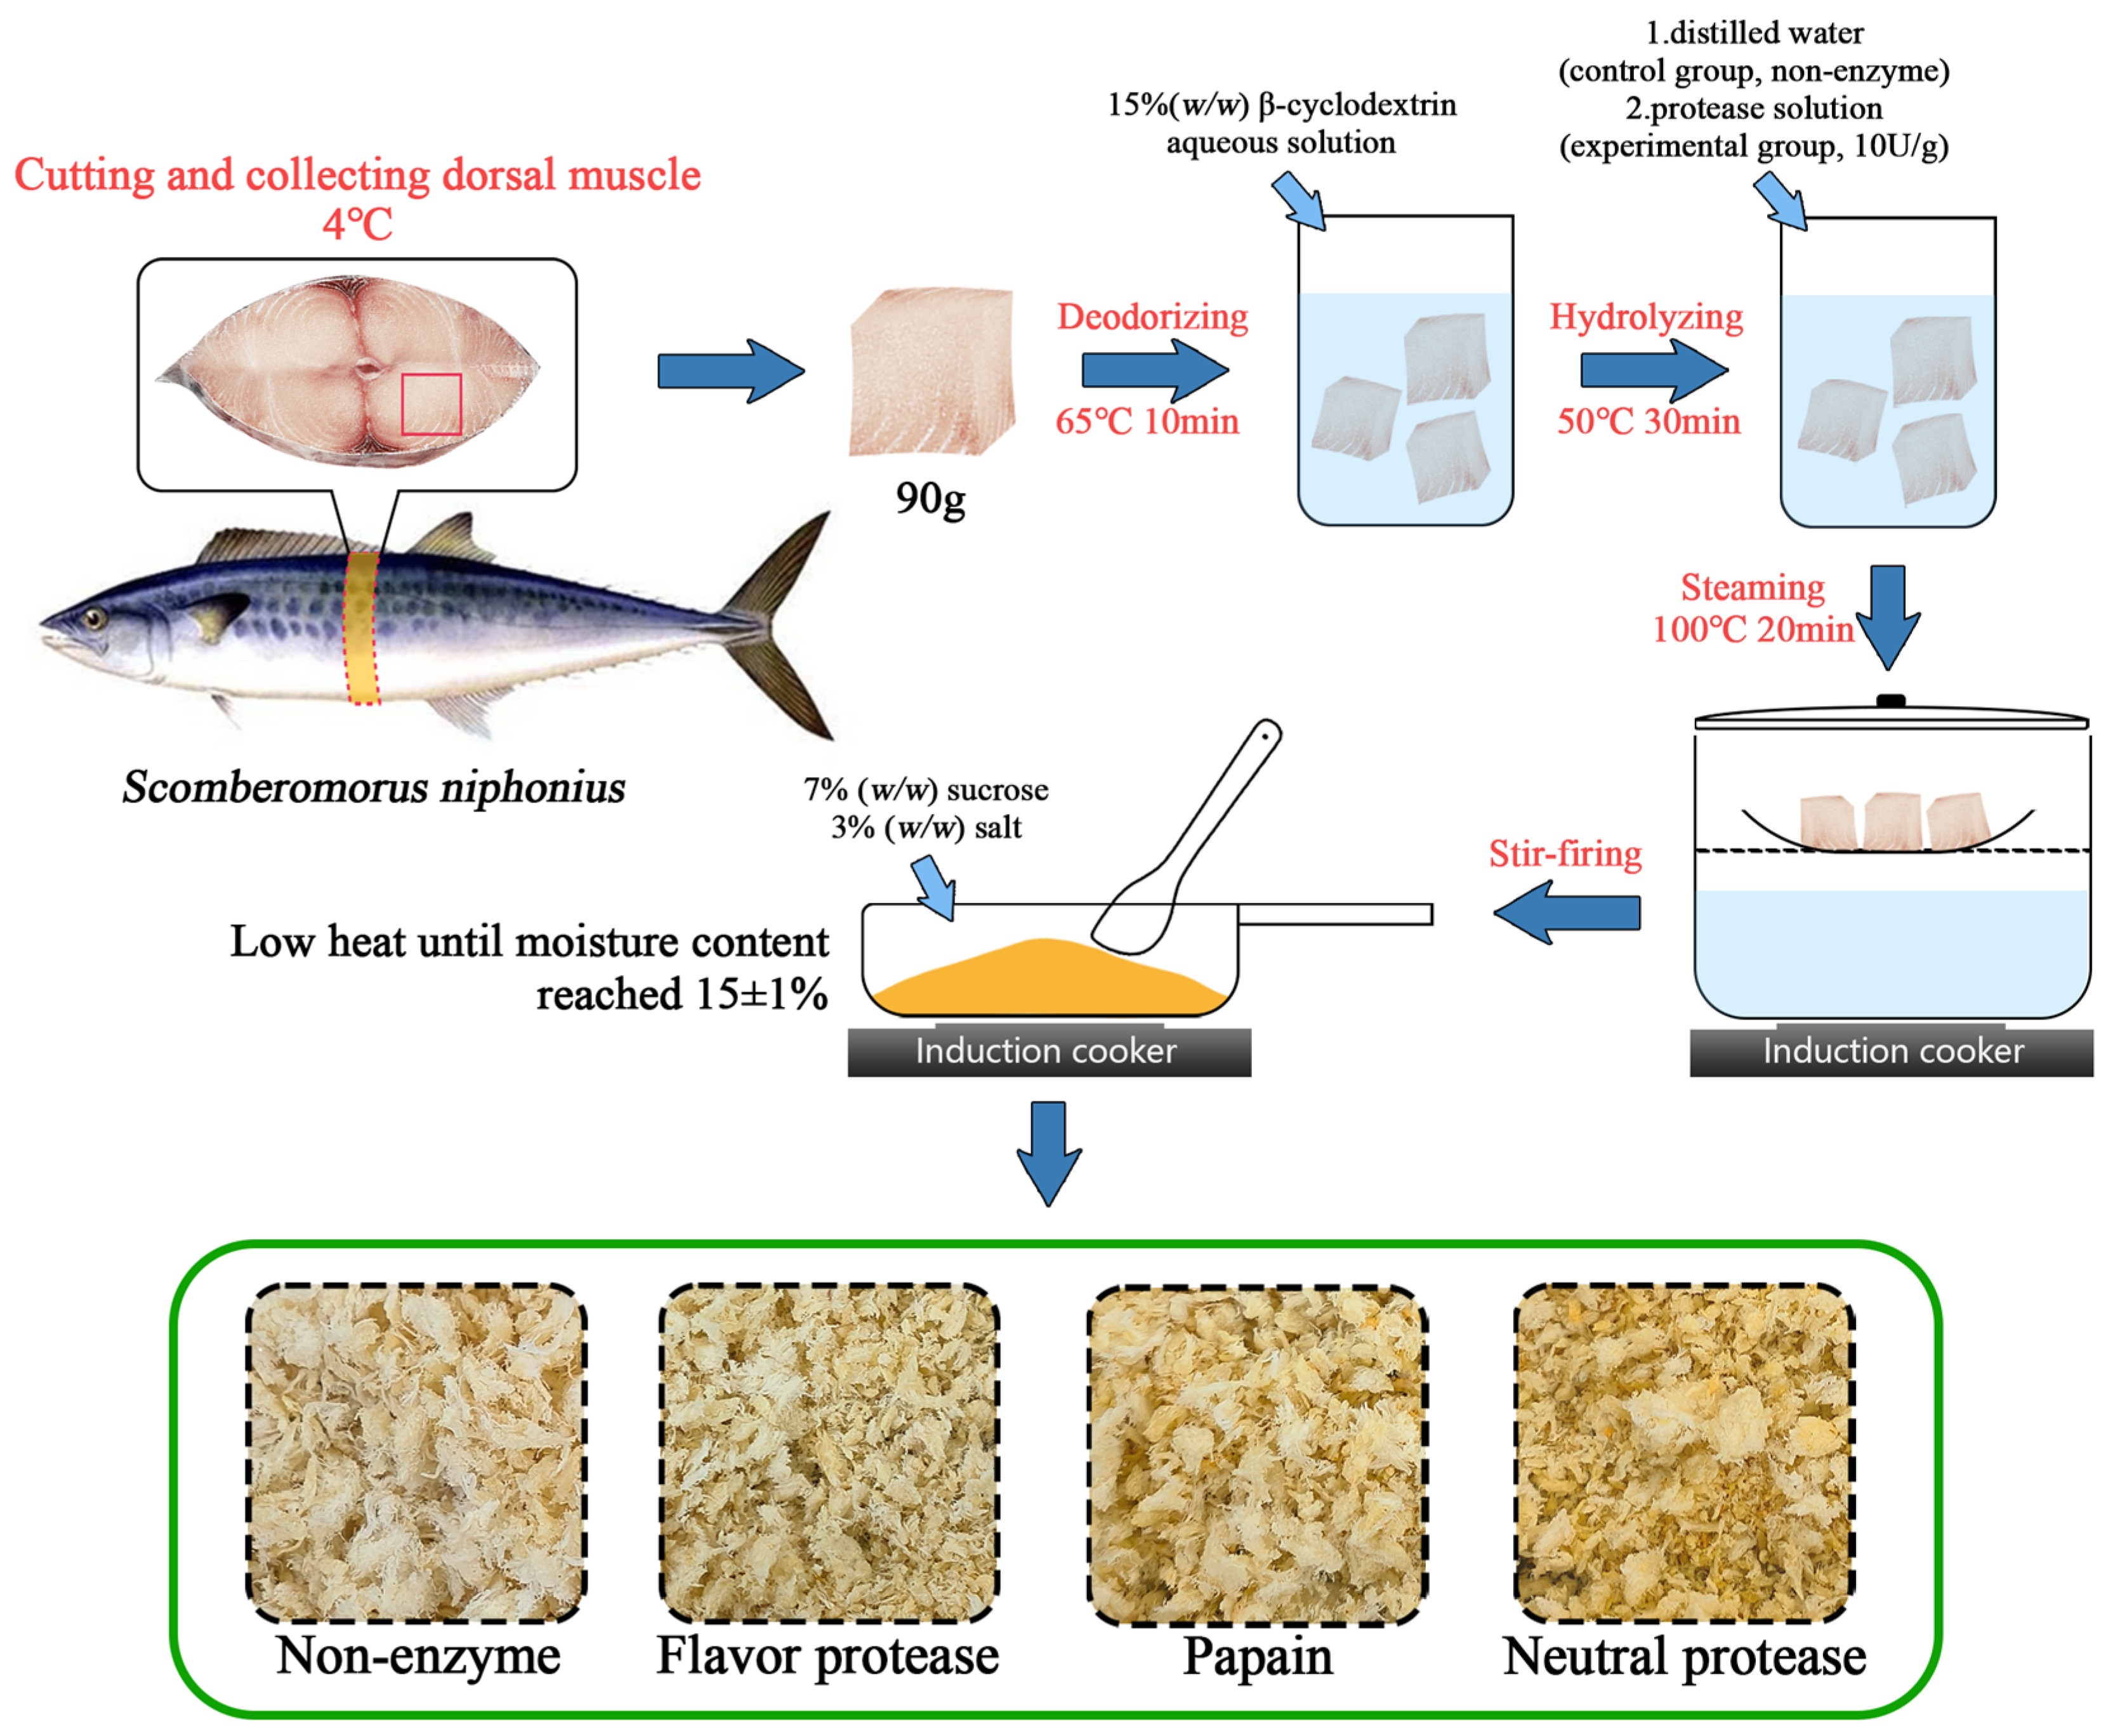
The sensory scores of DMF are presented
Table 3, and the texture and color characteristics are also presented in the green box of
Figure 1, which shows that there was no significant difference in texture of the samples among all groups. In terms of color, NP performed better, with a score of 84.30, showing a significant difference (
p < 0.05). This might be attributed to the specificity of NP, as the fish muscle generated more melanoidin precursors for melanoidin formation after enzymatic hydrolysis. In terms of odor, FP, PP, and NP were all significantly better than NON (
p < 0.05). In terms of taste, PP was significantly better than NON, FP, and NP (
p < 0.05). This is because, after protein enzymatic hydrolysis, aroma precursors and flavor-contributing substances (such as FAAs [
24] and umami peptides [
11]) were provided for lipid oxidation and the MR. In terms of the total score, FP and PP were also significantly better than NON (
p < 0.05). These findings suggest that, regardless of which protease was used, the samples showed certain advantages in odor and taste scores, effectively enhancing the flavor of DMF.
Although sensory evaluation is simple to operate and can capture complex sensory experiences, it is highly subjective, and the evaluators are susceptible to sensory fatigue, which may lead to significant variability in the results.
3.2. E-Nose Analysis
An E-nose is an instrument that emulates the human olfactory system through a gas sensor array and pattern recognition algorithms to characterize the VOCs profile of samples. By utilizing sensor-derived data, this approach eliminates potential human bias, thereby ensuring high objectivity. Notably, higher response values indicate a greater content of the corresponding VOCs, rendering them more olfactorily detectable. The E-nose sensors demonstrate selective responsiveness to specific VOCs, with response values ≥ 0.45 being considered valid for reliable detection [
27]. Therefore, analysis was restricted to sensors with valid response values. The specific VOCs corresponding to each sensor are listed in
Table 2. A radar plot constructed using the response values of each sensor to the samples is shown in
Figure 2A (
Table S1), where sensors meeting the requirement for valid response values (response value > 0.45) are highlighted in red. Sensors in the P series, such as P10/1 (chloride, fluoride), P30/1 (carbon oxide, ethanol, hydrocarbon, ammonia), P30/2 (aldehyde, ethanol, hydrocarbon, hydrogen sulfide), and PA/2 (ethanol, ammonia, amines), exhibit relatively high response values. This indicates that one or more components among aldehydes, alcohols, and hydrocarbons make significant contributions to the odor of DMF. Additionally, the response values of P30/2 and PA/2 in the NON group were significantly higher than those in the enzyme-treated group (
p < 0.05), suggesting that enzymatic treatment may reduce the content of irritating and unpleasant odors such as ammonia, amines, hydrogen sulfide, or aldehydes.
Sensors in the T series, including T30/1 (polar organic compounds, hydrogen sulfide), T40/2 (chlorides, fluorides), T70/2 (toluene, xylene), and LY2/LG (chlorides, fluorides, nitrogen oxides, sulfides), exhibited relatively low response values. However, the signal intensity of different groups was still different, which was speculated to be due to the different types and contents of odor precursors produced in different enzymatic processes. Moreover, no significant differences were found in the response values of LY2/LG, indicating that the content of nitrogen oxides (e.g., furans) did not vary substantially and the sensor could not reflect the content of nitrogen–hydrogen compounds such as pyrazines—another class of Maillard reaction products [
18].
Figure 2B presents the PCA score plot of response values for the different samples, with PC1 and PC2 accounting for a cumulative variance of 80.8%, which exceeds 75%. This indicates that the model retains most of the sample information. Notably, after different enzymatic treatments, the 95% confidence ellipses of the samples are well separated, demonstrating significant differences between the samples [
5,
30]. These results confirm that the E-nose can effectively and significantly distinguish differences between the different samples.
In summary, the results demonstrate that E-nose analysis can effectively detect significant differences in DMF odor profiles following enzymatic treatment. While this technique exhibits high sensitivity to global odor profile variations and is well suited for rapid odor classification, it lacks the capacity to resolve individual chemical components within complex mixtures. To comprehensively evaluate whether an enzymatic treatment enhances the flavor quality of fish floss and to elucidate the underlying mechanisms of characteristic flavor formation, more detailed analyses are required.
3.4. Effects of Different Proteases on FAAs
The present study focused specifically on FAAs as the primary flavor compounds for investigation, based on the following considerations: (1) Although other taste-active components (including free nucleotides, organic acids, inorganic salt ions, etc.) [
35] contribute to flavor perception, they remain unaffected by protease treatment and were, therefore, excluded from analysis; (2) While umami peptides represent potential flavor enhancers, their post-hydrolysis diversity and ill-defined threshold values precluded systematic evaluation [
36]; (3) As final products of protease hydrolysis, FAAs demonstrate pronounced quantitative changes following enzymatic treatment and represent the greatest contributors to taste profiles [
37], making them the most functionally relevant targets for this investigation.
Amino acids exhibit distinct taste attributes, categorized as follows: umami amino acids (UAAs): aspartic acid (Asp) and glutamic acid (Glu); sweet amino acids (SAAs): threonine (Thr), serine (Ser), glycine (Gly), alanine (Ala), and proline (Pro); and bitter amino acids (BAAs): valine (Val), methionine (Met), isoleucine (Ile), leucine (Leu), tyrosine (Tyr), phenylalanine (Phe), lysine (Lys), histidine (His), and arginine (Arg) [
28]. To enhance the DMF taste profile, it is essential to promote the content of UAAs and SAAs while either reducing BAAs content or ensuring that their increase occurs at a slower rate compared to that of UAAs and SAAs.
As shown in the PLS-DA score plot (
Figure 5A), the cumulative variance of components 1 and component 2 reached as high as 92.7%, which is greater than 75%, indicating that the model retains most of the information of the samples, and the samples can be well distinguished [
5,
30]. Among them, the PP group exhibited higher scores along component 2, the NP group dominated component 1, and the non-enzyme group gathered in the third quadrant with lower scores. This spatial separation indicates significant differences in FAA composition between enzyme-treated and non-enzyme-treated groups, demonstrating that the enzymatic hydrolysis process plays a key role in amino acid liberation and taste.
The loading plot (
Figure 5B,
Table S5) presents distinct spatial distributions of amino acids, as follows:, Pro, Asp, Tyr, and Phe are located in the first quadrant; Val and Leu are located in the third quadrant; Cys and Ile are located in the fourth quadrant near the coordinate axis; His is largely deviated from the other points in the fourth quadrant; while other points are concentrated at the origin of coordinates. Combined with
Figure 5A and
Table S4, it can be seen that Val and Leu (BAAs) showed positive correlations with the non-enzyme group, serving as effective discriminators for enzyme-treated groups. The FP group gradually approached the origin, with the number of positive correlation types progressively increasing. The positive correlation degree exhibited a rise with UAA (Glu) and SAAs (Gly, Ala), whereas it declined with Val and Leu, ultimately contributing to an enhancement in the DMF taste profile.
The PP group exhibited the closest to the origin in the PLS-DA plot, while Asp, Gly, and Pro were positively correlated with PP as amino acids of umami and sweet taste, respectively, indicating that the PP group not only had the richest flavor profile, but also the most active flavor characteristics. This conclusion can be further supported by taste scores of sensory evaluation shown in
Table 3. In contrast, the NP group was primarily located in the fourth quadrant, displaying stronger correlations with BAAs (Tyr, Phe, Cys, Ile, His), Asp and Pro, which were significantly different from the other two groups. The PLS-DA model was verified by a permutation test, random arrangement calculation was adopted [
33], and after 100 permutation fittings,
Figure 3E shows that
p < 0.01, indicating that no random grouping model had better results than this model, and the model fitting effect was good.
As shown in
Table 5 and
Table 6, protease treatment significantly increased the liberation of FAAs that contribute to flavor enhancement in DMF. Previous studies have demonstrated that different sources and types of proteases have different effects on the structure of myofibrillar proteins, primarily attributed to variations in the characteristics of the active site of enzyme-activated proteins and the mechanism of the formation of flavor substances [
38,
39,
40]. Consequently, both the content and type of hydrolyzed amino acids showed different variations. In terms of content, the amino acid content of both PP and NP groups increased compared with that of the NON group. Regarding types, the total increase in UAAs and SAAs was higher than that of BAAs. Specifically, the PP treatment induced 26.68% and 25.98% increments in UAAs and SAAs, respectively, which was higher than that of BAAs (11.99%), while the increase in UAAs in the NP group was 34.96% and 15.84%, respectively, which was higher than that of BAAs (23.35%). These results suggest that both PP and NP could positively enhance the flavor of DMF, with PP demonstrating the most pronounced enhancement. Conversely, the negative increase in UAAs and BAAs and the slight increase in SAAs in the FP group may be due to the different binding sites of FPs, which produce more peptides than FAAs, or due to targeted cleavage of specific peptide bonds, which exposes more fats to FAAs in an MR that generates unidentified flavor substances.
To further analyze the taste characteristics of FAAs in DMF, the key taste substances were screened by calculating taste activity value (TAV), with TAV > 1 indicating primary taste contributors. Moreover, higher TAV of UAAs and SAAs were found to produce more pronounced flavor enhancement effects, as illustrated in
Figure 6 (
Table S4), and the TAV of the His of four groups can be seen in
Table S4. The TAV of Glu (UAA) and Ala (SAA) were all greater than 1. Still, the TAV of the enzyme-treated group were higher, making their freshness and sweetness characteristics more pronounced; moreover, the PP group in particular showed the highest TAV for both Glu (2.61) and Ala (2.04) among all groups. In addition, Pro (SAA) demonstrated TAV > 1 exclusively in the FP and PP groups, establishing its role as a key taste-active component in these treatments. However, the TAV of the PP group was still the highest, at 1.23. Other amino acids exhibited TAV < 1 across all groups, indicating negligible flavor contributions. Regarding BAAs, His consistently exhibited the highest TAV among all four groups. Phe transitioned from TAV < 1 in the non-enzyme group to TAV > 1 in the enzyme-treated group, while Val had TAV > 1 in the non-enzyme group and TAV < 1 in the enzyme-treated group. Cross-referencing with
Table 6 suggests no substantial alteration in bitter taste perception. In summary, the TAV analysis of FAAs revealed that PP most significantly enhanced the taste profile of DMF, which is consistent with the results presented in
Table 3. Additionally, His can be enzymatically converted to histamine via bacterial decarboxylation, which leads to uncomfortable symptoms such as dizziness and rapid heartbeat in humans [
41], whereas the His content (
Table S4) in the NP group of enzyme-treated samples was significantly higher than that of the FP and PP groups (
p < 0.05). This difference likely arises from the stronger proteolytic activity of the NP group, which also exhibited the highest levels of most other FAAs (
p < 0.05). To reduce His content in the NP group while retaining flavor-enhancing FAAs, optimization approaches may include modifying ingredient formulations and adjusting MR conditions. Further investigation is required to determine the most effective strategies.
3.5. Flavor Correlation Analysis
Previous studies have shown that the flavor of fish floss primarily originates from MR and lipid oxidation pathways [
5]. For the MR, amino acids not only act as flavor-presenting substances, but also can participate in the MR as precursors for flavor compound synthesis. This process initiates through carbonyl-amine condensation between amino groups and reducing sugar-derived carbonyl/aldehyde groups, progressing sequentially via Amadori rearrangement, Heyns rearrangement, and Strecker degradation, ultimately generating characteristic VOCs [
42]. For lipid oxidation, depending on the carbon chain length, unsaturation, and positional isomerism of double bonds of different fatty acids, the substances produced by oxidation are different [
43], and they can be broadly categorized as aldehydes, ketones, alcohols, and carboxylic acids. Given the substantial lipid content and high polyunsaturated fatty acid composition characteristic of mackerel, lipid oxidation also contributes significantly to the flavor of fish floss [
3,
44].
Due to the diverse range of VOCs detected, a targeted screening of critical substances was implemented to assist in focused correlation analysis. Based on the initial data presented in
Figure 3B, the VIP scores of the top 15 VOCs were determined (
Figure 7A,
Table S6). Compounds with VIP scores > 1 were designated as key VOCs [
30]. This analysis identified hexanal, ethyl propanoate, 2-methyl-3-(methythio)furan, nonanal, ethanol, ethyl acetate, 2,5-dimethylpyrazine, and furan as the primary contributors to the flavor of the DMF. These results demonstrate substantial agreement with the ROAV analysis of VOCs.
A correlation heatmap was constructed with FAAs as the x-axis and key VOCs as the y-axis (
Figure 7B,
Table S7). For a clearer discussion, the VOCs were classified into two groups: hydrocarbons and nitrogen-containing compounds.
For hydrocarbons, ethyl acetate exhibited a positive correlation (
p < 0.01) with Val and Leu, while showing negative correlations (
p < 0.01) with Asp, Gly, Cys, Ile, Tyr, and Phe. Negative correlations (
p < 0.05) were also observed with Glu and Pro. This phenomenon may be attributed to the polar nature of Asp, Cys, Tyr, and Glu, which exhibit limited solubility in ethyl acetate. Given the low moisture content of DMF, these FAAs may have been predominantly consumed through MR due to exposure to air. Conversely, nonpolar amino acids (Gly, Ile, Phe, Val, Leu, and Pro) demonstrate solubility in lipids and ethyl acetate. During the stir-frying process, the interplay between MR and lipid oxidation generates complex interactions [
5]. Partial lipids remained intact, while others underwent oxidation to generate aldehydes, ketones, and acids. These degradation products subsequently underwent dehydration–condensation under high-temperature conditions to form esters, suggesting that reduced lipid availability may enhance ester formation through this pathway. Due to the inherent diversity and structural complexity of the intermediate products, there are uncertainties in the overall properties of the dynamic intermolecular interactions, resulting in a positive correlation between Val and Leu being more soluble in esters, and a negative correlation between Gly, Ile, Phe, and Pro being more soluble in other nonpolar substances. The specific reasons need to be further investigated.
Nonanal, a characteristic VOC of mackerel lipid oxidation [
45], showed positive correlations with Glu and Pro (
p < 0.05), but negative correlations with Val and Leu. This observation suggests potential solubility preferences of Pro and Glu in nonanal. Hexanal exhibited a negative correlation with Ala (
p < 0.01), but a positive correlation with ethyl propanoate, suggesting preferential solubility of Ala in ethyl propanoate. These correlation patterns between nonanal and hexanal corroborate the proposed ethyl acetate interaction mechanisms. Additional observations include ethanol’s negative correlations with Cys, Tyr, and Ile (
p < 0.05), and ethyl propanoate’s negative correlations with Thr, Ser, and Lys (
p < 0.01). These findings align with the correlation patterns observed in the ethyl acetate analysis.
For nitrogen-containing compounds, FAAs serve as essential reactants in MR, undergoing complex transformations, including Amadori rearrangement, Heyns rearrangement, and Strecker degradation, to yield low-molecular-weight nitrogen-containing compounds [
42]. In this study, these compounds primarily included flavor-active substances such as furan, 2,5-dimethylpyrazine, and 2-methyl-3-(methylthio)furan. Furan demonstrated negative correlations (
p < 0.05) with Asp, Tyr, Phe, Gly, Cys, and Ile. Conversely, 2,5-dimethylpyrazine and 2-methyl-3-(methylthio)furan exhibited positive correlations (
p < 0.05, except for the 2-methyl-3-(methylthio)furan-Ile interaction) with these amino acids. These findings suggest competitive pathways in nitrogen-containing formation during MR, where specific amino acids suppress furan generation while promoting the production of pyrazine and thioether derivatives.
Notably, furan demonstrated positive correlations with Val and Leu (p < 0.05), contrasting with the negative correlations (p < 0.05) observed between 2-methyl-3-(methylthio)furan and these branched-chain amino acids. Such divergence implies that Val and Leu preferentially participate in reaction pathways favoring furan synthesis over thioether compound formation. His, the most abundant BAA with the highest taste activity value (TAV) in DMF, exhibited a strong positive correlation with 2,5-dimethylpyrazine (p < 0.01). It can be inferred that the MR can consume part of His to produce new VOCs, as the enzyme-treated group produced His faster than the consumption rate, and thus showed an increasing trend of His content.
Based on the correlation analysis of hydrocarbons with nitrogen-containing compounds (
Figure 7C,
Table S7), and taking into account the previous finding that enzymatic hydrolysis of prawn myofibrillar protein promotes the formation of pyrazines [
46], the main pathways and key control points for the formation of VOCs through lipid oxidation and MR can be inferred. There was a positive correlation between ethyl acetate and furan derivatives (
p < 0.01). This correlation results from the accumulation of ethyl acetate through the dehydrated condensation of acetic acid and ethanol derived from lipid oxidation. The enhanced solubility of Val and Leu in ethyl acetate helps to improve their availability as furan precursors. Subsequent complex reactions, including Amadori rearrangement, Heyns rearrangement, and Strecker degradation, under specific conditions drive furan formation. The formation pathways and key mechanisms of other compounds follow similar principles: (1) Val and Leu serve as precursors for furan formation. Asp, Tyr, Phe, Gly, Cys, and Ile act as precursors for 2,5-dimethylpyrazine and 2-methyl-3-(methylthio)furan. (2) Ethyl acetate indirectly suppresses the formation of 2-methyl-3-(methylthio)furan, and ethanol indirectly suppresses the formation of 2,5-dimethylpyrazine. Furthermore, competitive interactions were observed among key VOCs: 2,5-dimethylpyrazine exhibited mutual inhibition with 2-methyl-3-(methylthio)furan, and furan also exhibited mutual inhibition with both 2-methyl-3-(methylthio)furan and 2,5-dimethylpyrazine.


