
Comparative Analysis of Omega-3, Omega-6, and Endocannabinoid Content of Human, Cattle, Goat, and Formula Milk


Abstract
1. Introduction
2. Materials and Methods
2.1. Chemicals and Reagents
2.2. Milk Samples
2.3. Preparation of Standards and Samples
2.4. Determination of Lipid Concentrations with UHPLC–MS
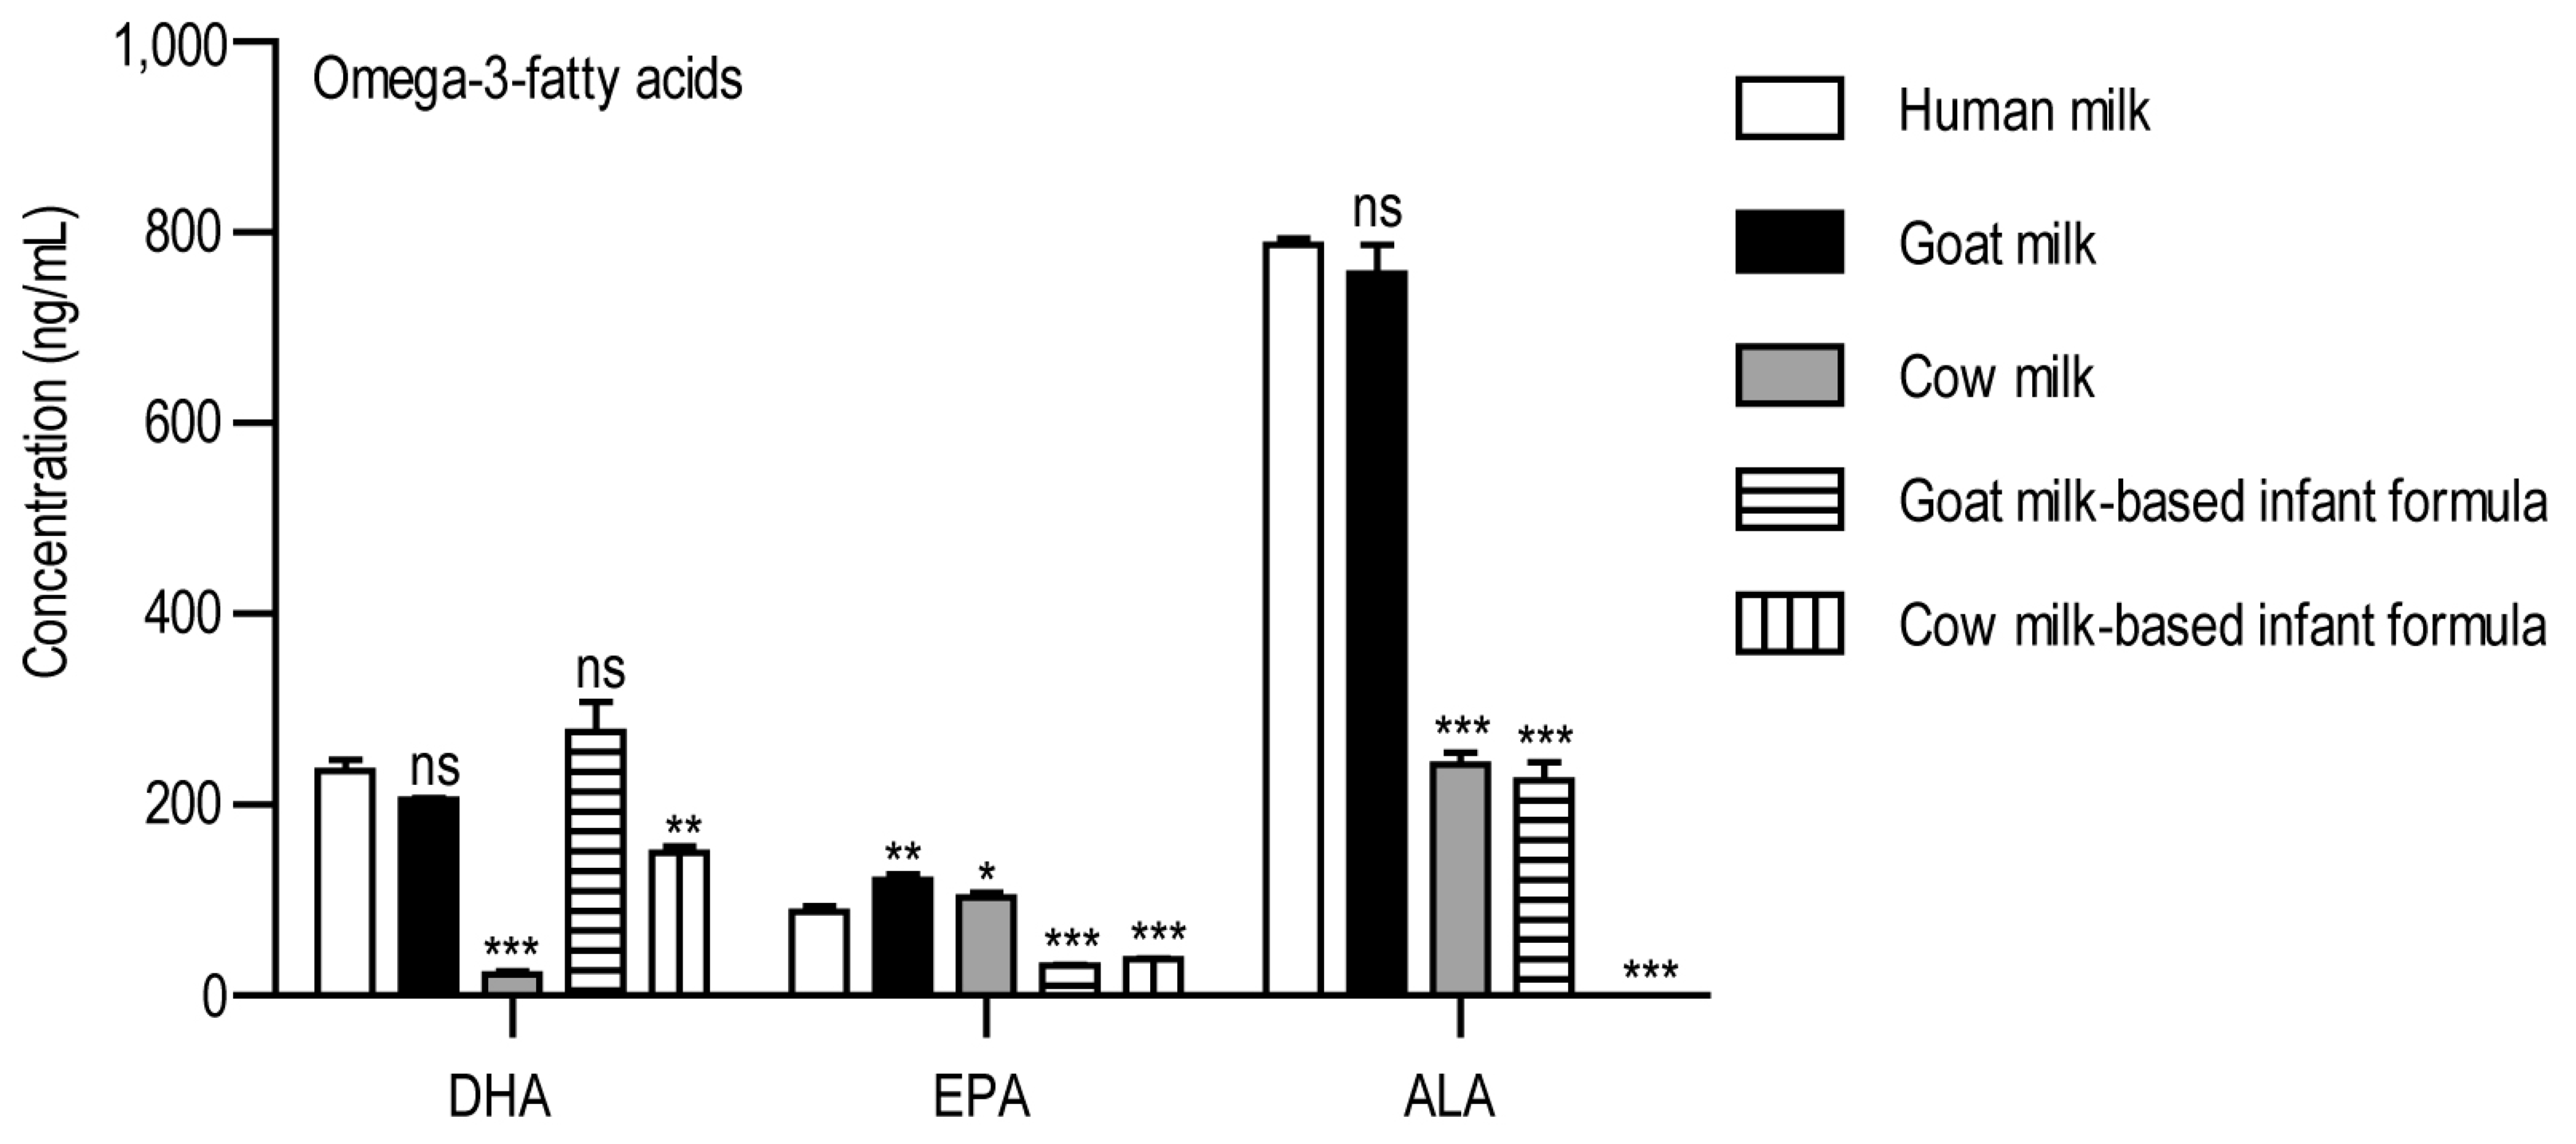
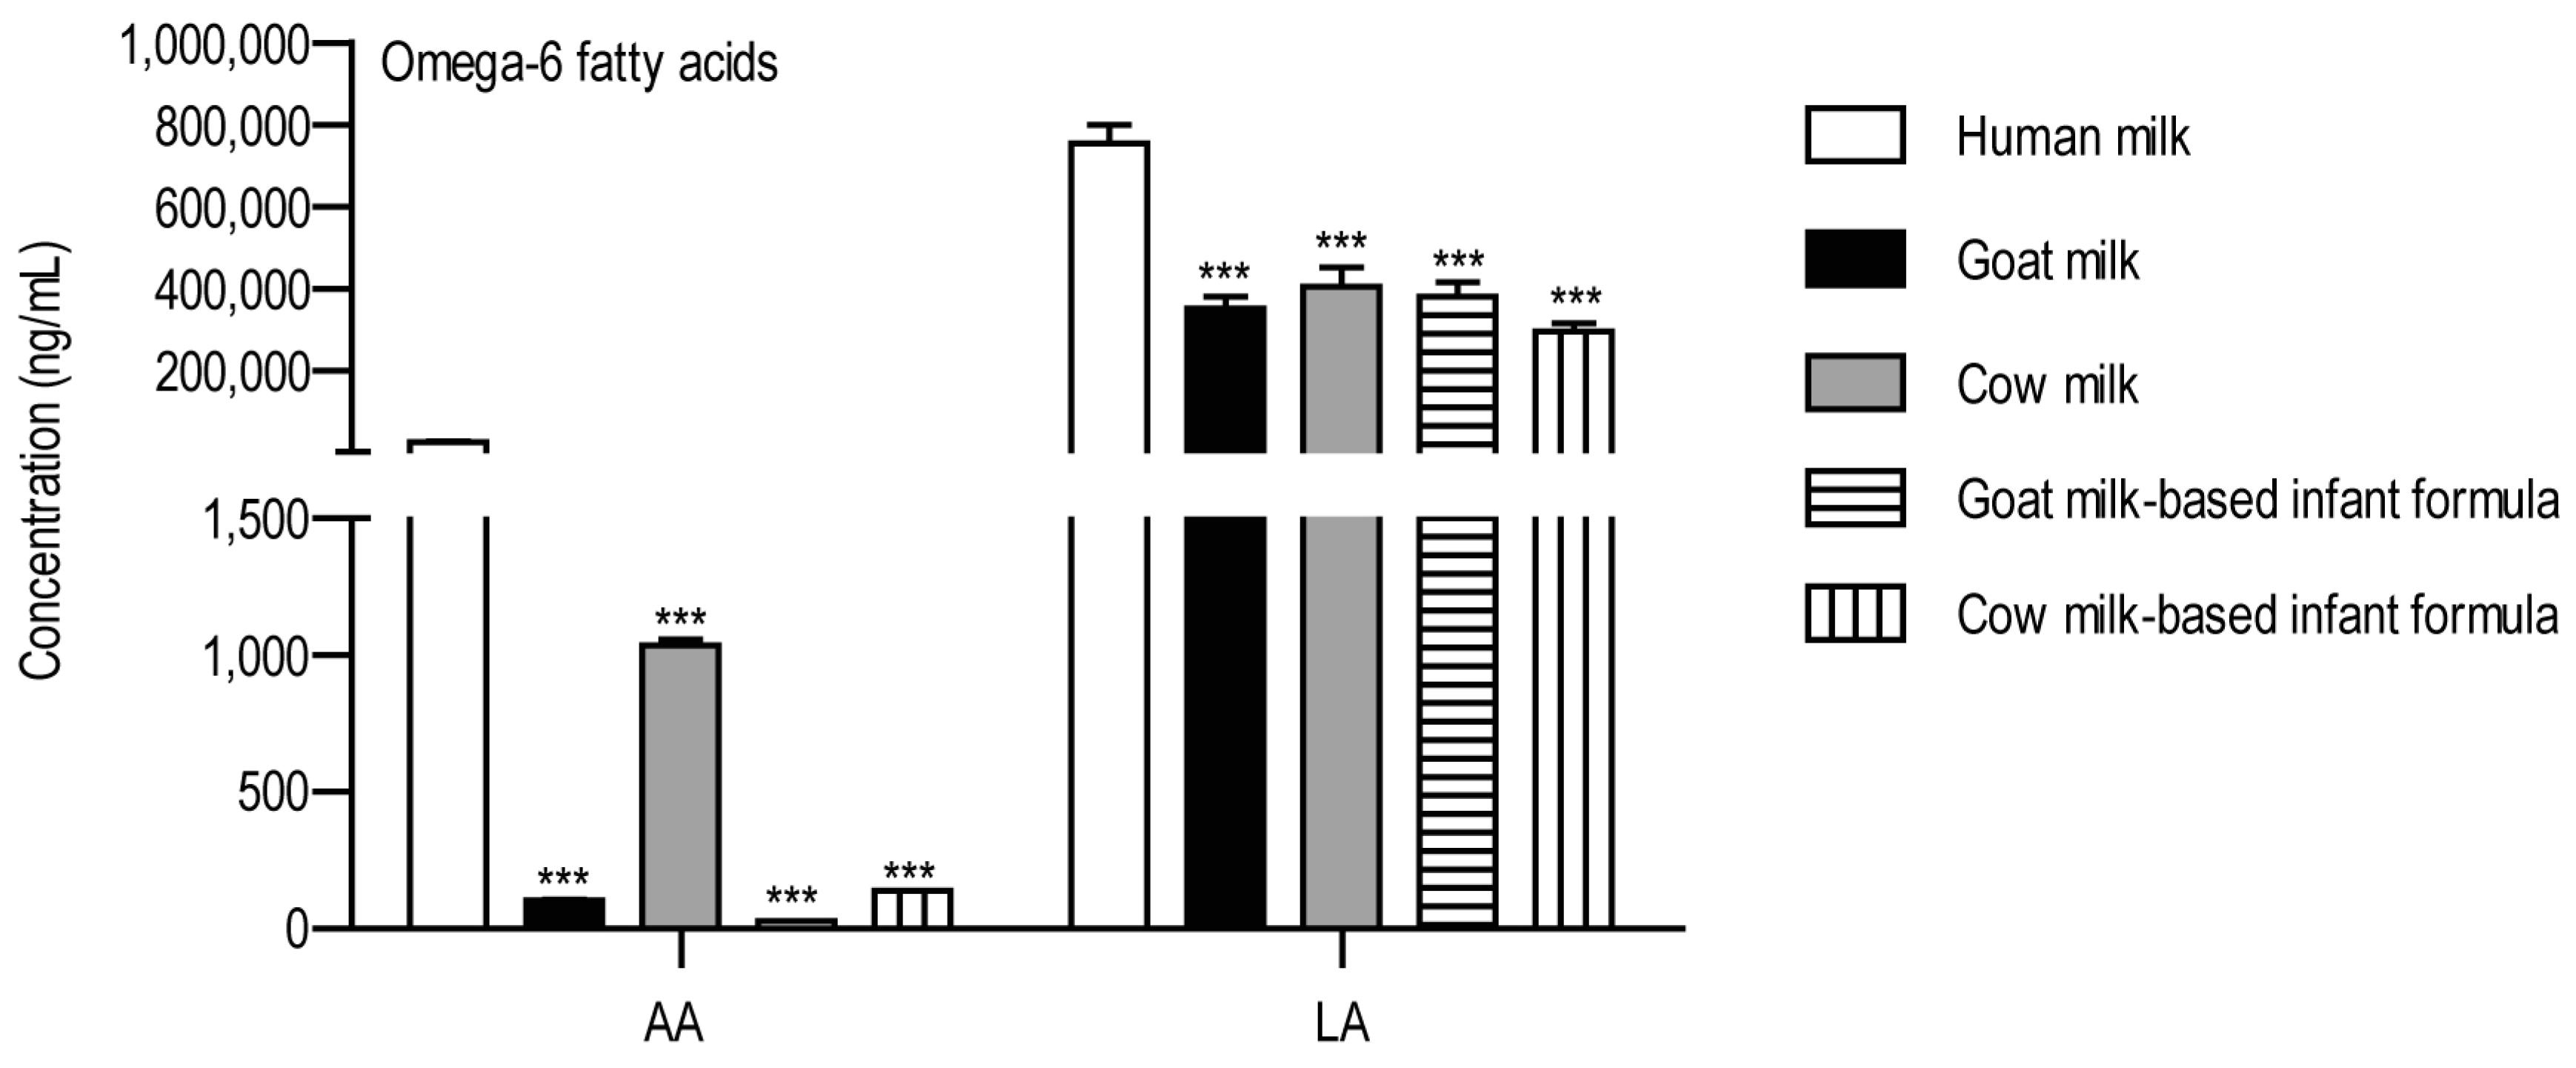
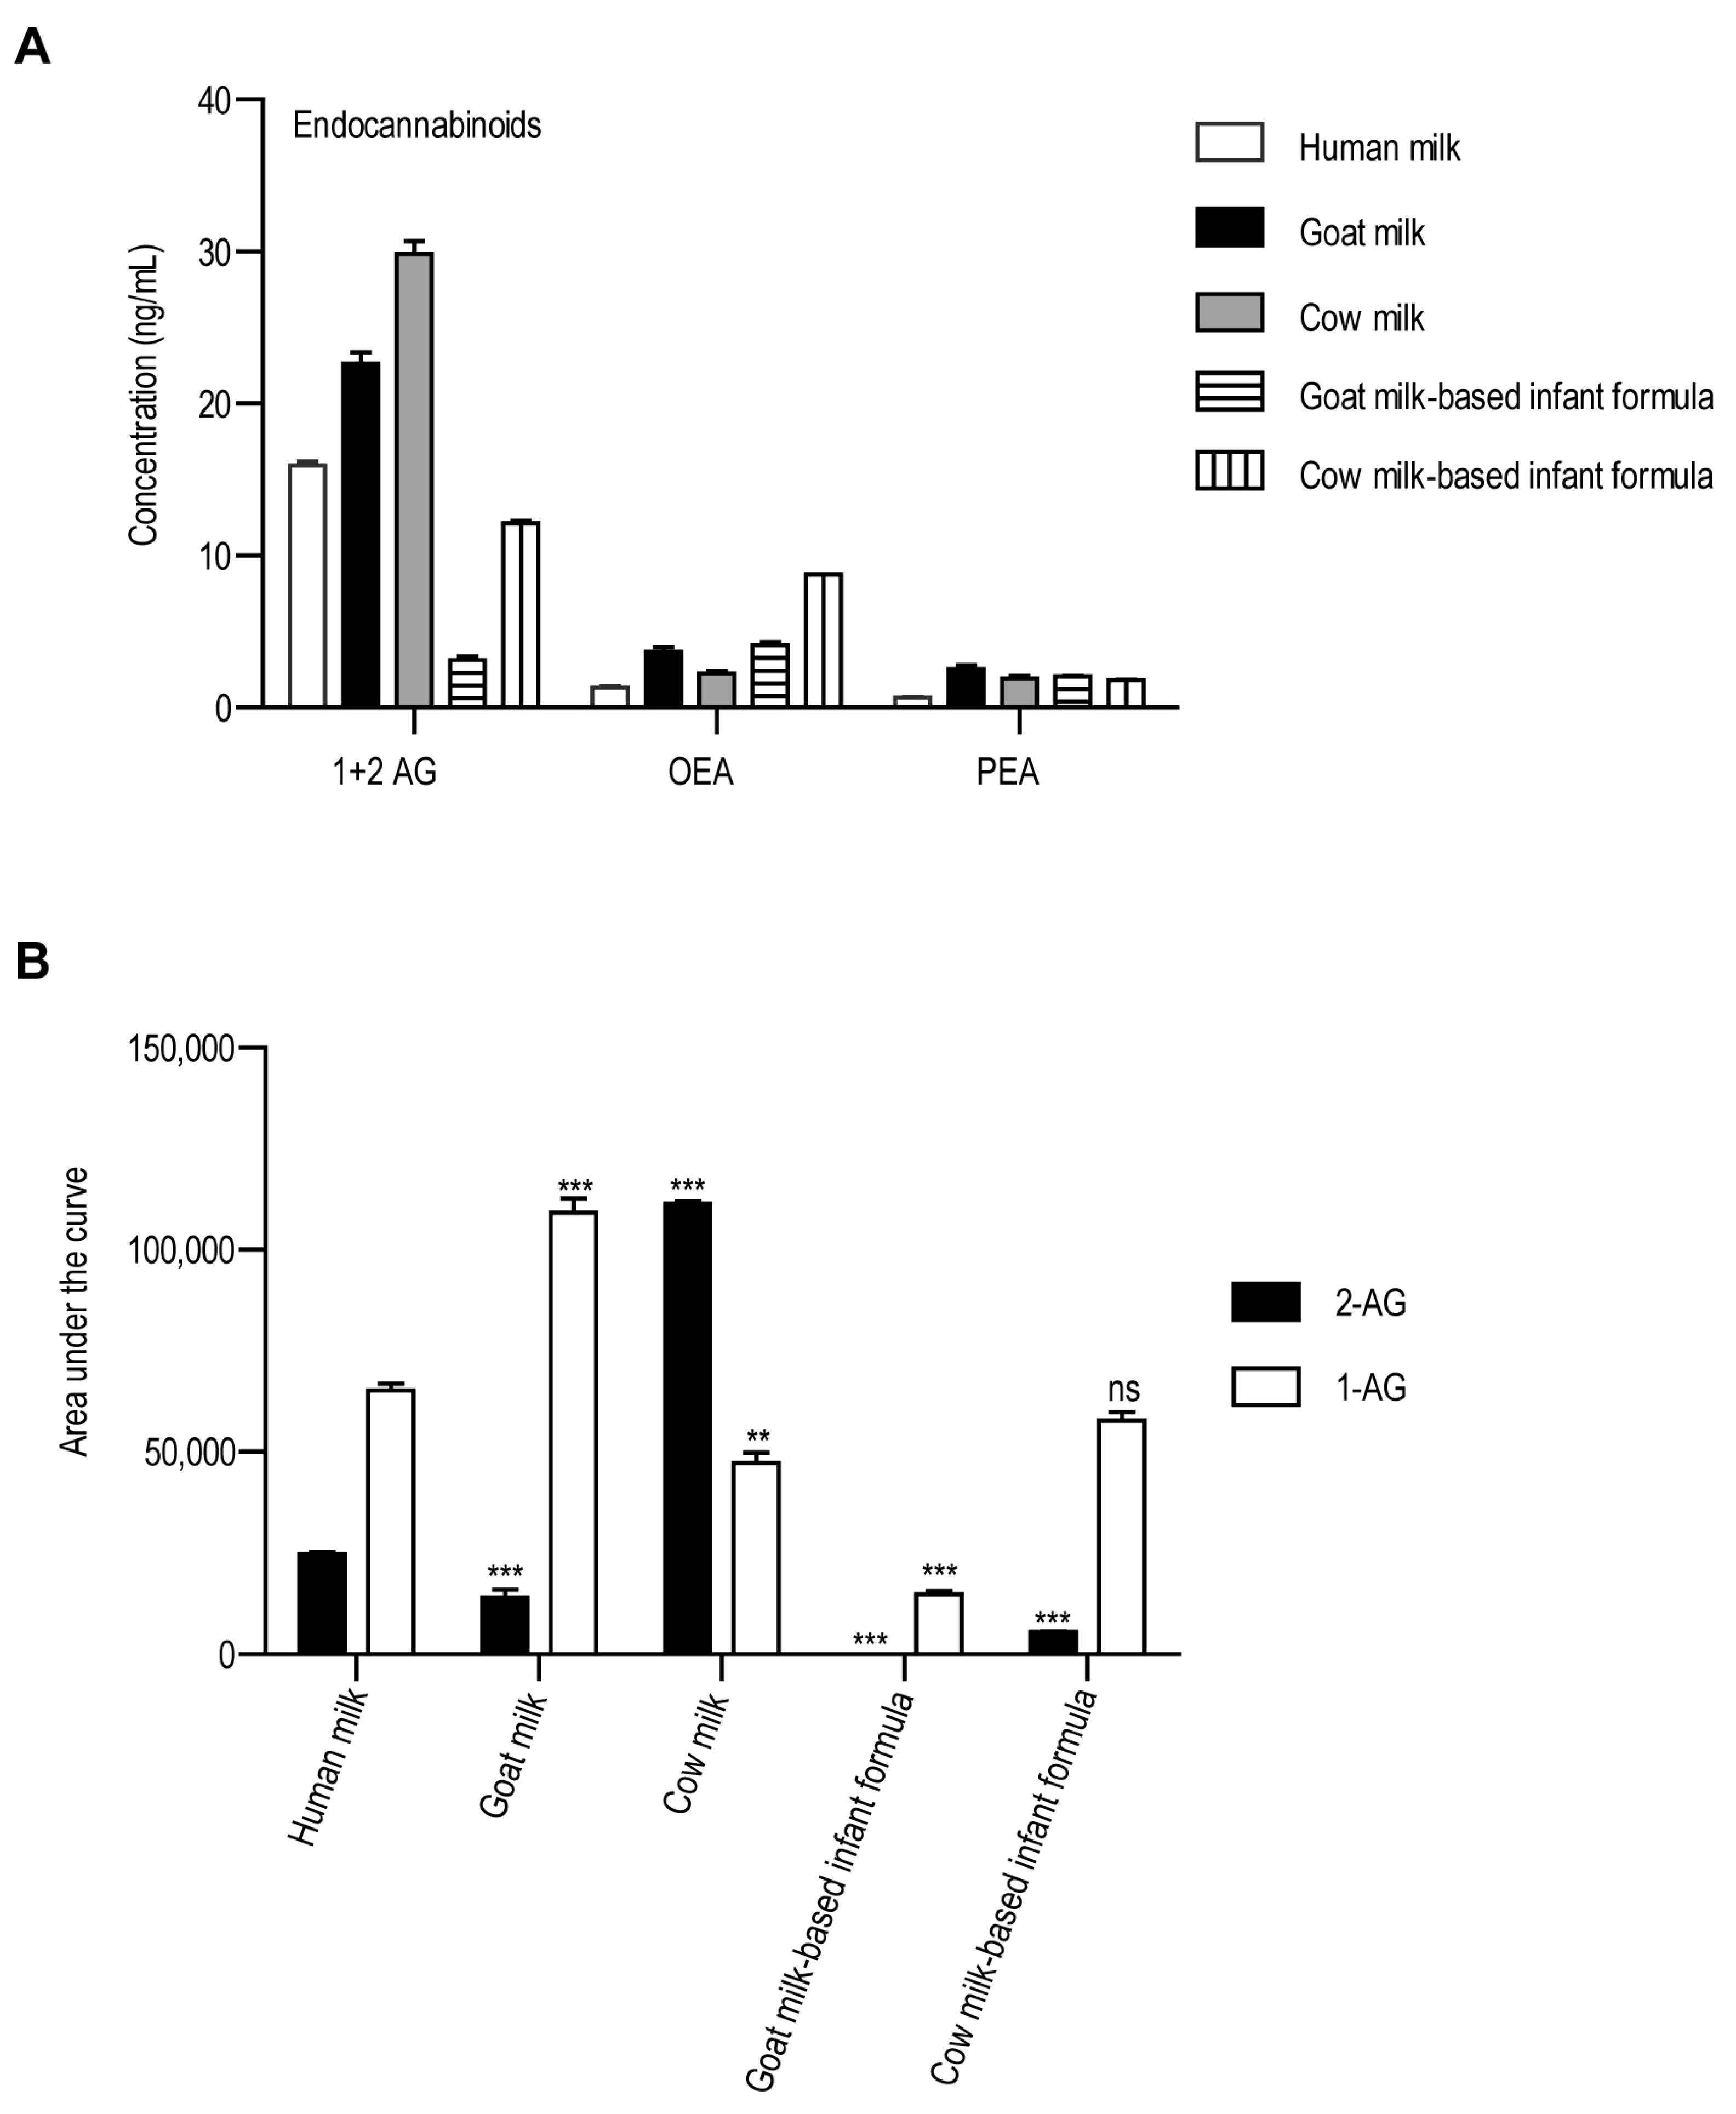
3. Results
4. Discussion
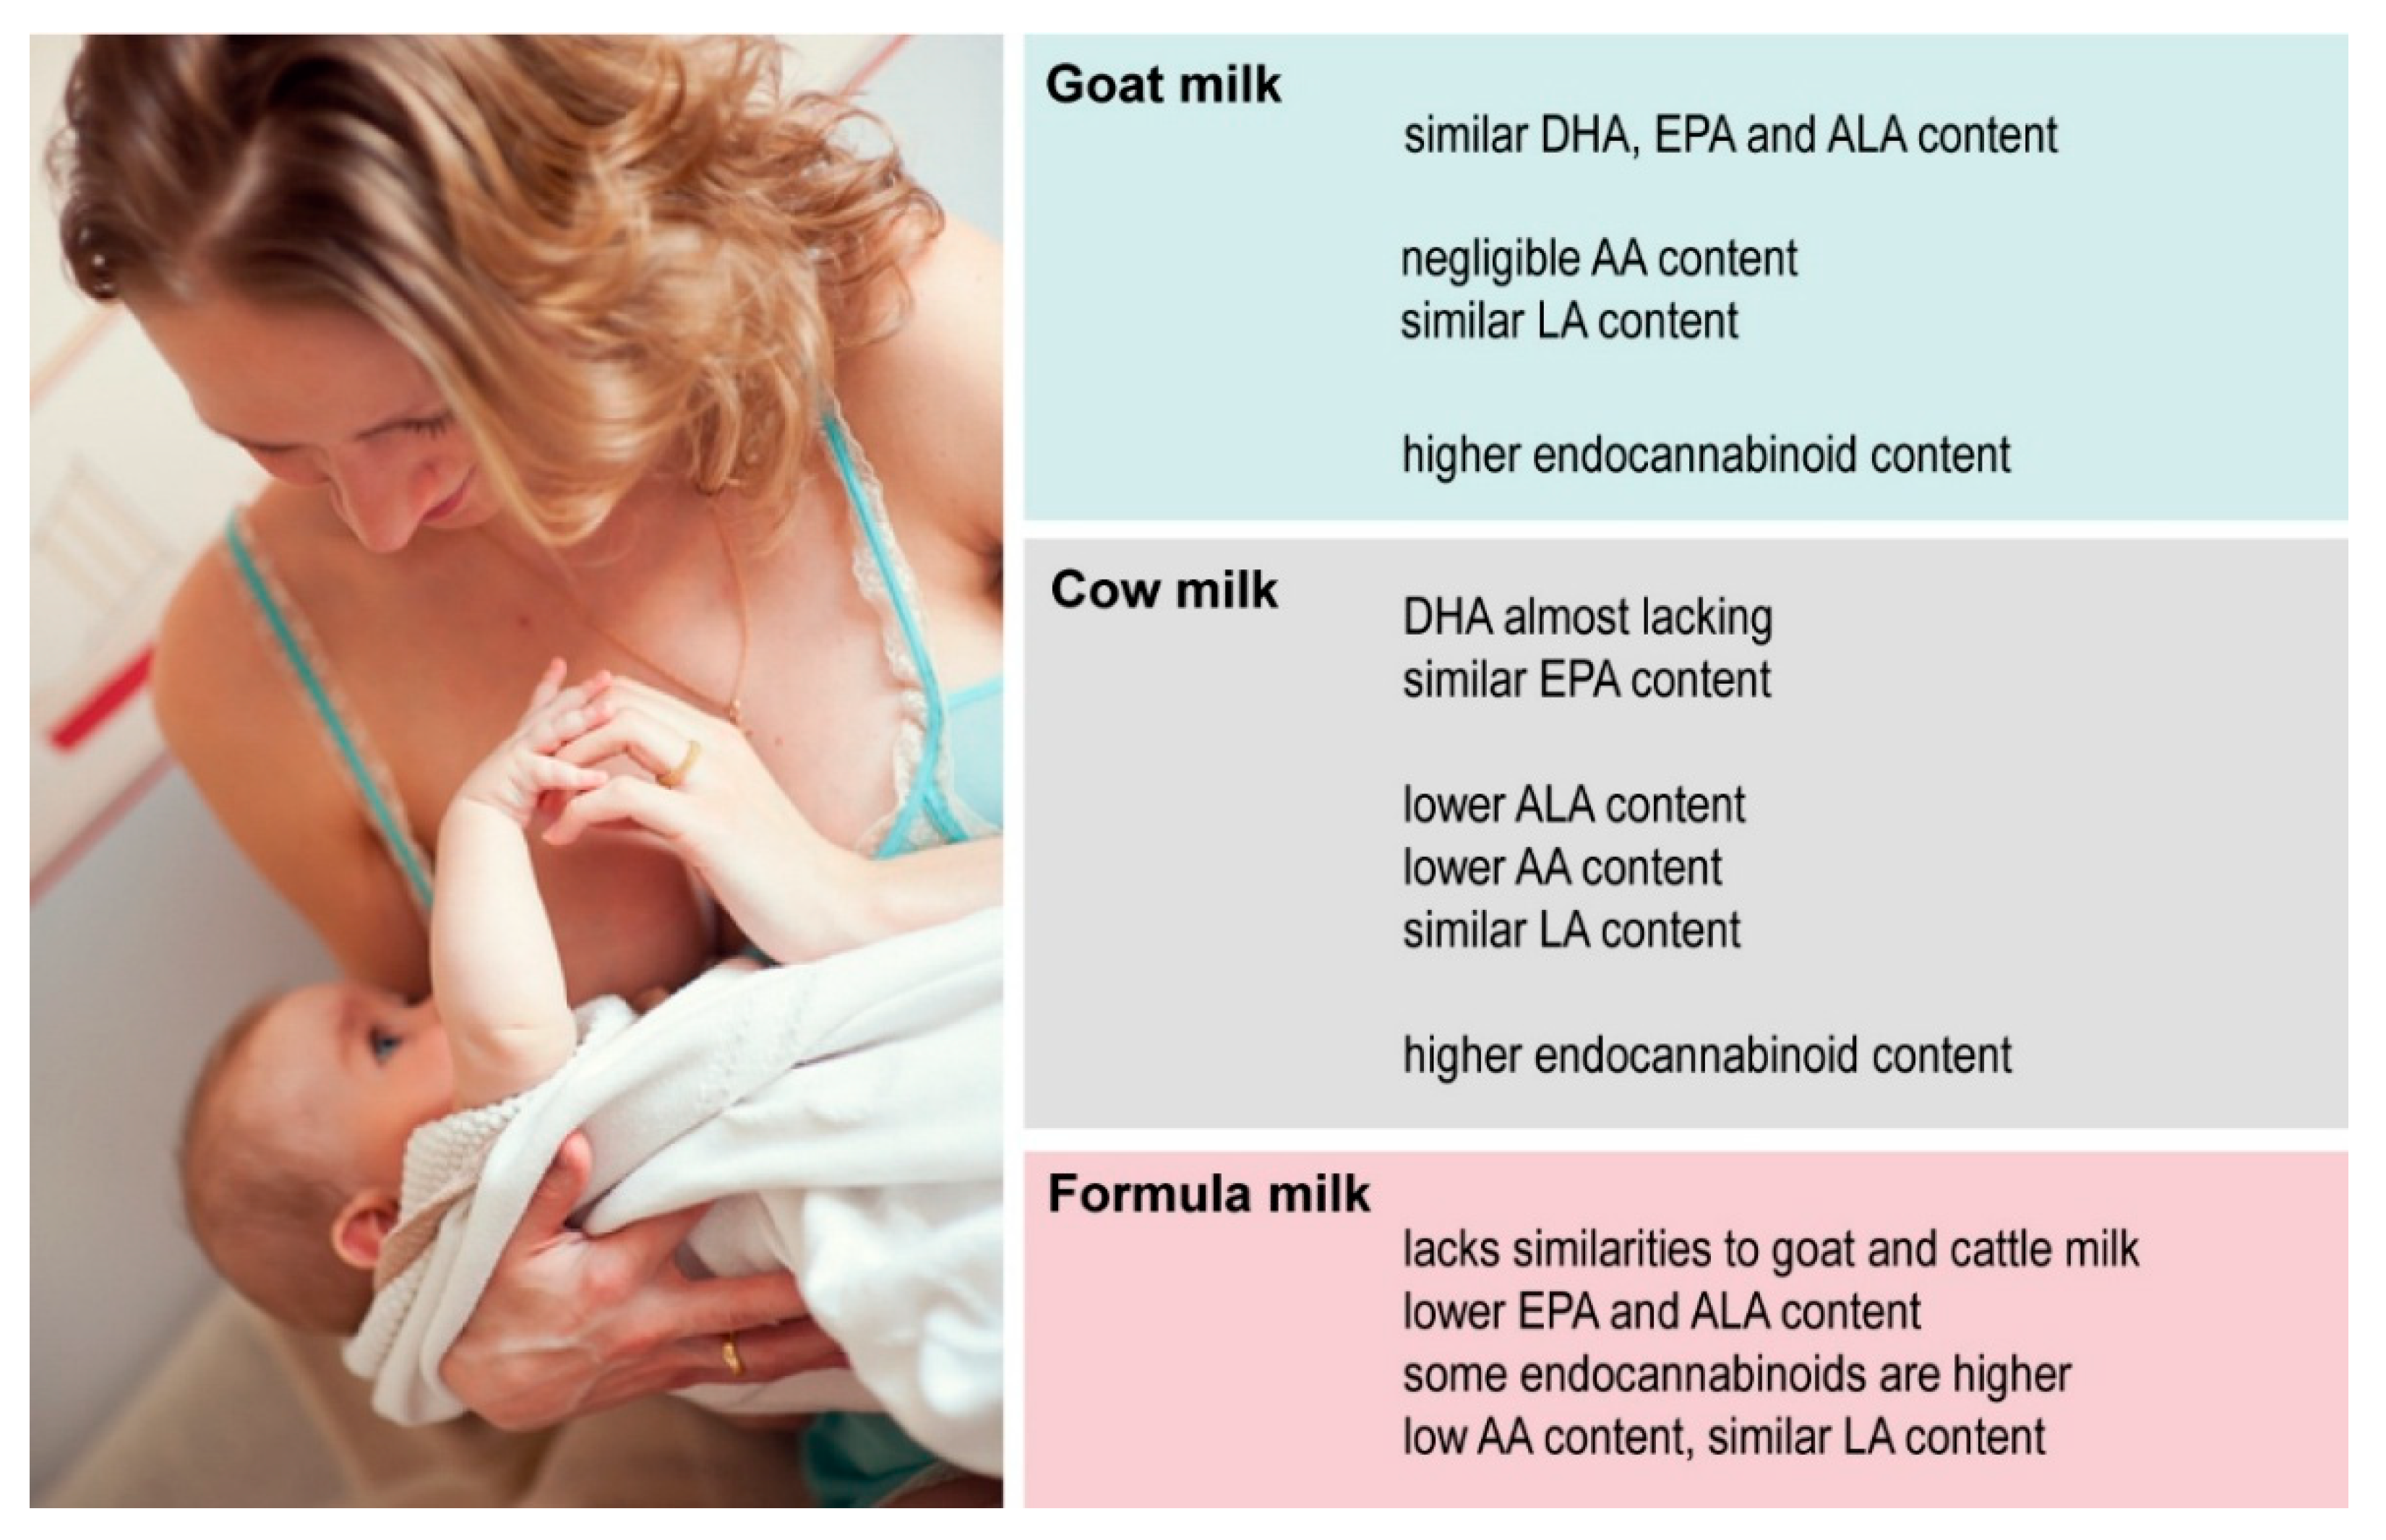
5. Conclusions
Author Contributions
Funding
Institutional Review Board Statement
Informed Consent Statement
Data Availability Statement
Conflicts of Interest
Abbreviations
| AA | Arachidonic acid |
| ALA | Alpha-linolenic acid |
| DHA | Docosahexaenoic acid |
| EPA | Eicosapentaenoic acid |
| LA | Linoleic acid |
| OEA | Oleoylethanolamide |
| PEA | Palmitoylethanolamide |
| PUFA | Polyunsaturated fatty acid |
References
- Herrera, E.; Amusquivar, E. Lipid metabolism in the fetus and the newborn. Diabetes/Metab. Res. Rev. 2000, 16, 202–210. [Google Scholar] [CrossRef] [PubMed]
- Persson, B. Carbohydrate and Lipid Metabolism in the Newborn Infant. Acta Anaesthesiol. Scand. 1974, 18, 50–57. [Google Scholar] [CrossRef]
- Van Aerde, J.E.; Wilke, M.S.; Feldman, M.; Clandinin, M.T. Chapter 40-Accretion of Lipid in the Fetus and Newborn. In Fetal and Neonatal Physiology, 3rd ed.; Polin, R.A., Fox, W.W., Abman, S.H., Eds.; W.B. Saunders: St. Louis, MO, USA, 2004; pp. 388–404. [Google Scholar]
- Whyte, R.K.; Bayley, H.S. Energy Metabolism of the Newborn Infant. In Advances in Nutritional Research; Draper, H.H., Ed.; Springer: Boston, MA, USA, 1990; pp. 79–108. [Google Scholar]
- Gallagher, D.; Andres, A.; Fields, D.A.; Evans, W.J.; Kuczmarski, R.; Lowe, W.L., Jr.; Lumeng, J.C.; Oken, E.; Shepherd, J.A.; Sun, S.; et al. Body Composition Measurements from Birth through 5 Years: Challenges, Gaps, and Existing & Emerging Technologies-A National Institutes of Health workshop. Obes. Rev. 2020, 21, e13033. [Google Scholar] [CrossRef] [PubMed]
- Harrington, T.A.M.; Thomas, E.L.; Frost, G.; Modi, N.; Bell, J.D. Distribution of Adipose Tissue in the Newborn. Pediatr. Res. 2004, 55, 437–441. [Google Scholar] [CrossRef]
- Koletzko, B. Response to and range of acceptable fat intakes in infants and children. Eur. J. Clin. Nutr. 1999, 53 (Suppl. S1), S78–S83. [Google Scholar] [CrossRef]
- Fomon, S.J.; Haschke, F.; Ziegler, E.E.; Nelson, S.E. Body composition of reference children from birth to age 10 years. Am. J. Clin. Nutr. 1982, 35, 1169–1175. [Google Scholar] [CrossRef] [PubMed]
- Wen, X.; Kleinman, K.; Gillman, M.W.; Rifas-Shiman, S.L.; Taveras, E.M. Childhood body mass index trajectories: Modeling, characterizing, pairwise correlations and socio-demographic predictors of trajectory characteristics. BMC Med. Res. Methodol. 2012, 12, 38. [Google Scholar] [CrossRef]
- Rolland-Cachera, M.F.; Deheeger, M.; Bellisle, F.; Sempé, M.; Guilloud-Bataille, M.; Patois, E. Adiposity rebound in children: A simple indicator for predicting obesity. Am. J. Clin. Nutr. 1984, 39, 129–135. [Google Scholar] [CrossRef]
- Rolland-Cachera, M.F.; Deheeger, M.; Guilloud-Bataille, M.; Avons, P.; Patois, E.; Sempé, M. Tracking the development of adiposity from one month of age to adulthood. Ann. Hum. Biol. 1987, 14, 219–229. [Google Scholar] [CrossRef]
- Arisaka, O.; Ichikawa, G.; Koyama, S.; Sairenchi, T. Childhood obesity: Rapid weight gain in early childhood and subsequent cardiometabolic risk. Clin. Pediatr. Endocrinol. Case Rep. Clin. Investig. Off. J. Jpn. Soc. Pediatr. Endocrinol. 2020, 29, 135–142. [Google Scholar] [CrossRef]
- Furse, S.; Billing, G.; Snowden, S.; Smith, J.; Goldberg, G.; Koulman, A. Relationship between the lipid composition of maternal plasma and infant plasma through breast milk. Metabolomics 2019, 15, 1–12. [Google Scholar] [CrossRef] [PubMed]
- Yin, J.; Quinn, S.; Dwyer, T.; Ponsonby, A.L.; Jones, G. Maternal diet, breastfeeding and adolescent body composition: A 16-year prospective study. Eur. J. Clin. Nutr. 2012, 66, 1329–1334. [Google Scholar] [CrossRef]
- Insull, W., Jr.; Hirsch, J.; James, T.; Ahrens, E.H., Jr. The fatty acids of human milk. II. Alterations produced by manipulation of caloric balance and exchange of dietary fats. J. Clin. Investig. 1959, 38, 443–450. [Google Scholar] [CrossRef]
- George, A.D.; Paul, S.; Wang, T.; Huynh, K.; Giles, C.; Mellett, N.; Duong, T.; Nguyen, A.; Geddes, D.; Mansell, T.; et al. Defining the lipid profiles of human milk, infant formula, and animal milk: Implications for infant feeding. Front. Nutr. 2023, 10, 1227340. [Google Scholar] [CrossRef]
- Yu, H.; Dilbaz, S.; Coßmann, J.; Hoang, A.C.; Diedrich, V.; Herwig, A.; Harauma, A.; Hoshi, Y.; Moriguchi, T.; Landgraf, K.; et al. Breast milk alkylglycerols sustain beige adipocytes through adipose tissue macrophages. J. Clin. Investig. 2019, 129, 2485–2499. [Google Scholar] [CrossRef]
- Hewelt-Belka, W.; Garwolinska, D.; Mlynarczyk, M.; Kot-Wasik, A. Comparative Lipidomic Study of Human Milk from Different Lactation Stages and Milk Formulas. Nutrients 2020, 12, 2165. [Google Scholar] [CrossRef] [PubMed]
- Hamosh, M. Lingual lipase and fat digestion in the neonatal period. J. Pediatr. Gastroenterol. Nutr. 1983, 2 (Suppl. S1), S236–S241. [Google Scholar] [CrossRef] [PubMed]
- Wolfs, D.; Lynes, M.D.; Tseng, Y.H.; Pierce, S.; Bussberg, V.; Darkwah, A.; Tolstikov, V.; Narain, N.R.; Rudolph, M.C.; Kiebish, M.A.; et al. Brown fat-activating lipokine 12,13-diHOME in human milk is associated with infant adiposity. J. Clin. Endocrinol. Metab. 2020, 106, e943–e956. [Google Scholar] [CrossRef]
- Azad, M.B.; Vehling, L.; Chan, D.; Klopp, A.; Nickel, N.C.; McGavock, J.M.; Becker, A.B.; Mandhane, P.J.; Turvey, S.E.; Moraes, T.J.; et al. Infant Feeding and Weight Gain: Separating Breast Milk From Breastfeeding and Formula From Food. Pediatrics 2018, 142, e20181092. [Google Scholar] [CrossRef]
- Stewart, C.J.; Ajami, N.J.; O’Brien, J.L.; Hutchinson, D.S.; Smith, D.P.; Wong, M.C.; Ross, M.C.; Lloyd, R.E.; Doddapaneni, H.; Metcalf, G.A.; et al. Temporal development of the gut microbiome in early childhood from the TEDDY study. Nature 2018, 562, 583–588. [Google Scholar] [CrossRef]
- Hummel, S.; Weiß, A.; Bonifacio, E.; Agardh, D.; Akolkar, B.; Aronsson, C.A.; Hagopian, W.A.; Koletzko, S.; Krischer, J.P.; Lernmark, Å.; et al. Associations of breastfeeding with childhood autoimmunity, allergies, and overweight: The Environmental Determinants of Diabetes in the Young (TEDDY) study. Am. J. Clin. Nutr. 2021, 114, 134–142. [Google Scholar] [CrossRef] [PubMed]
- Röszer, T. Co-Evolution of Breast Milk Lipid Signaling and Thermogenic Adipose Tissue. Biomolecules 2021, 11, 1705. [Google Scholar] [CrossRef]
- Miliku, K.; Moraes, T.J.; Becker, A.B.; Mandhane, P.J.; Sears, M.R.; Turvey, S.E.; Subbarao, P.; Azad, M.B. Breastfeeding in the First Days of Life Is Associated With Lower Blood Pressure at 3 Years of Age. J. Am. Heart Assoc. 2021, 10, e019067. [Google Scholar] [CrossRef]
- He, Y.; Lawlor, N.T.; Newburg, D.S. Human Milk Components Modulate Toll-Like Receptor-Mediated Inflammation. Adv. Nutr. 2016, 7, 102–111. [Google Scholar] [CrossRef] [PubMed]
- Ortega-García, J.A.; Olano-Soler, H.A.; Martínez-Álvarez, A.; Campillo-López, F.; Gomariz-Peñalver, V.; Mendiola-Olivares, J.; Iglesias-Gómez, C.; Escribano-Muñoz, A. Breastfeeding Duration and Anogenital Distance in 2-Year-Old Infants. Breastfeed. Med. 2016, 11, 350–355. [Google Scholar] [CrossRef] [PubMed]
- Paredes, A.; Justo-Méndez, R.; Jiménez-Blasco, D.; Núñez, V.; Calero, I.; Villalba-Orero, M.; Alegre-Martí, A.; Fischer, T.; Gradillas, A.; Sant’Anna, V.A.R.; et al. γ-Linolenic acid in maternal milk drives cardiac metabolic maturation. Nature 2023, 618, 365–373. [Google Scholar] [CrossRef]
- Dei Cas, M.; Paroni, R.; Signorelli, P.; Mirarchi, A.; Cerquiglini, L.; Troiani, S.; Cataldi, S.; Codini, M.; Beccari, T.; Ghidoni, R.; et al. Human breast milk as source of sphingolipids for newborns: Comparison with infant formulas and commercial cow’s milk. J. Transl. Med. 2020, 18, 481. [Google Scholar] [CrossRef] [PubMed]
- Röszer, T. Further Evidence that Breast Milk Lipids Control Adiposity. J. Clin. Endocrinol. Metab. 2021, 106, e1458–e1459. [Google Scholar] [CrossRef]
- Rudolph, M.C.; Young, B.E.; Lemas, D.J.; Palmer, C.E.; Hernandez, T.L.; Barbour, L.A.; Friedman, J.E.; Krebs, N.F.; MacLean, P.S. Early infant adipose deposition is positively associated with the n-6 to n-3 fatty acid ratio in human milk independent of maternal BMI. Int. J. Obes. 2017, 41, 510–517. [Google Scholar] [CrossRef]
- Campoy, C.; Escolano-Margarit, M.V.; Anjos, T.; Szajewska, H.; Uauy, R. Omega 3 fatty acids on child growth, visual acuity and neurodevelopment. Br. J. Nutr. 2012, 107, S85–S106. [Google Scholar] [CrossRef]
- Dias-Rocha, C.P.; Costa, J.C.B.; Oliveira, Y.S.; Fassarella, L.B.; Woyames, J.; Atella, G.C.; Santos, G.R.C.; Pereira, H.M.G.; Pazos-Moura, C.C.; Almeida, M.M.; et al. Maternal high-fat diet decreases milk endocannabinoids with sex-specific changes in the cannabinoid and dopamine signaling and food preference in rat offspring. Front. Endocrinol. 2023, 14, 1087999. [Google Scholar] [CrossRef] [PubMed]
- de la Garza Puentes, A.; Martí Alemany, A.; Chisaguano, A.M.; Montes Goyanes, R. The Effect of Maternal Obesity on Breast Milk Fatty Acids and Its Association with Infant Growth and Cognition-The PREOBE Follow-Up. Nutrients 2019, 11, 2154. [Google Scholar] [CrossRef] [PubMed]
- Albracht-Schulte, K.; Kalupahana, N.S.; Ramalingam, L.; Wang, S.; Rahman, S.M.; Robert-McComb, J.; Moustaid-Moussa, N. Omega-3 fatty acids in obesity and metabolic syndrome: A mechanistic update. J. Nutr. Biochem. 2018, 58, 1–16. [Google Scholar] [CrossRef]
- Grummer-Strawn, L.M.; Zehner, E.; Stahlhofer, M.; Lutter, C.; Clark, D.; Sterken, E.; Harutyunyan, S.; Ransom, E.I.; WHO/UNICEF NetCode. New World Health Organization guidance helps protect breastfeeding as a human right. Matern. Child. Nutr. 2017, 13, e12491. [Google Scholar] [CrossRef] [PubMed]
- Victora, C.G.; Bahl, R.; Barros, A.J.; França, G.V.; Horton, S.; Krasevec, J.; Murch, S.; Sankar, M.J.; Walker, N.; Rollins, N.C. Breastfeeding in the 21st century: Epidemiology, mechanisms, and lifelong effect. Lancet 2016, 387, 475–490. [Google Scholar] [CrossRef]
- Turck, D. Cow’s milk and goat’s milk. World Rev. Nutr. Diet. 2013, 108, 56–62. [Google Scholar] [CrossRef]
- Pietrobelli, A.; Agosti, M.; MeNu Group. Nutrition in the First 1000 Days: Ten Practices to Minimize Obesity Emerging from Published Science. Int. J. Environ. Res. Public. Health 2017, 14, 1491. [Google Scholar] [CrossRef]
- Einerhand, A.W.C.; Mi, W.; Haandrikman, A.; Sheng, X.Y.; Calder, P.C. The Impact of Linoleic Acid on Infant Health in the Absence or Presence of DHA in Infant Formulas. Nutrients 2023, 15, 2187. [Google Scholar] [CrossRef]
- Purkiewicz, A.; Pietrzak-Fiećko, R. Determination of the Fatty Acid Profile and Lipid Quality Indices in Selected Infant Formulas. Molecules 2024, 29, 2044. [Google Scholar] [CrossRef]
- Much, D.; Brunner, S.; Vollhardt, C.; Schmid, D.; Sedlmeier, E.M.; Brüderl, M.; Heimberg, E.; Bartke, N.; Boehm, G.; Bader, B.L.; et al. Breast milk fatty acid profile in relation to infant growth and body composition: Results from the INFAT study. Pediatr. Res. 2013, 74, 230–237. [Google Scholar] [CrossRef]
- Rohrbach, S. Effects of Dietary Polyunsaturated Fatty Acids on Mitochondria. Curr. Pharm. Des. 2009, 15, 4103–4116. [Google Scholar] [CrossRef] [PubMed]
- Banaszak, M.; Dobrzyńska, M.; Kawka, A.; Górna, I.; Woźniak, D.; Przysławski, J.; Drzymała-Czyż, S. Role of Omega-3 fatty acids eicosapentaenoic (EPA) and docosahexaenoic (DHA) as modulatory and anti-inflammatory agents in noncommunicable diet-related diseases-Reports from the last 10 years. Clin. Nutr. ESPEN 2024, 63, 240–258. [Google Scholar] [CrossRef] [PubMed]
- Desoye, G.; Herrera, E. Adipose tissue development and lipid metabolism in the human fetus: The 2020 perspective focusing on maternal diabetes and obesity. Progress. Lipid Res. 2021, 81, 101082. [Google Scholar] [CrossRef]
- Bayram, S.; Kızıltan, G. The Role of Omega-3 Polyunsaturated Fatty Acids in Diabetes Mellitus Management: A Narrative Review. Curr. Nutr. Rep. 2024, 13, 527–551. [Google Scholar] [CrossRef]
- Willumsen, N.; Hexeberg, S.; Skorve, J.; Lundquist, M.; Berge, R.K. Docosahexaenoic acid shows no triglyceride-lowering effects but increases the peroxisomal fatty acid oxidation in liver of rats. J. Lipid Res. 1993, 34, 13–22. [Google Scholar] [CrossRef]
- Bertoni, C.; Abodi, M.; D’Oria, V.; Milani, G.P.; Agostoni, C.; Mazzocchi, A. Alpha-Linolenic Acid and Cardiovascular Events: A Narrative Review. Int. J. Mol. Sci. 2023, 24, 14319. [Google Scholar] [CrossRef]
- Pan, A.; Chen, M.; Chowdhury, R.; Wu, J.H.; Sun, Q.; Campos, H.; Mozaffarian, D.; Hu, F.B. α-Linolenic acid and risk of cardiovascular disease: A systematic review and meta-analysis. Am. J. Clin. Nutr. 2012, 96, 1262–1273. [Google Scholar] [CrossRef] [PubMed]
- Rustan, A.C.; Christiansen, E.N.; Drevon, C.A. Serum lipids, hepatic glycerolipid metabolism and peroxisomal fatty acid oxidation in rats fed omega-3 and omega-6 fatty acids. Biochem. J. 1992, 283 Pt 2, 333–339. [Google Scholar] [CrossRef]
- Sun, G.Y.; Simonyi, A.; Fritsche, K.L.; Chuang, D.Y.; Hannink, M.; Gu, Z.; Greenlief, C.M.; Yao, J.K.; Lee, J.C.; Beversdorf, D.Q. Docosahexaenoic acid (DHA): An essential nutrient and a nutraceutical for brain health and diseases. Prostaglandins Leukot. Essent. Fat. Acids 2018, 136, 3–13. [Google Scholar] [CrossRef]
- Rahman, M.S. Prostacyclin: A major prostaglandin in the regulation of adipose tissue development. J. Cell Physiol. 2019, 234, 3254–3262. [Google Scholar] [CrossRef]
- Neuringer, M.; Connor, W.E.; Van Petten, C.; Barstad, L. Dietary omega-3 fatty acid deficiency and visual loss in infant rhesus monkeys. J. Clin. Investig. 1984, 73, 272–276. [Google Scholar] [CrossRef] [PubMed]
- Mulder, K.A.; King, D.J.; Innis, S.M. Omega-3 fatty acid deficiency in infants before birth identified using a randomized trial of maternal DHA supplementation in pregnancy. PLoS ONE 2014, 9, e83764. [Google Scholar] [CrossRef]
- Pavlovski, C.J. Screening for essential fatty acid deficiency in at risk infants. Med. Hypotheses 2009, 73, 910–916. [Google Scholar] [CrossRef]
- Hauner, H.; Much, D.; Vollhardt, C.; Brunner, S.; Schmid, D.; Sedlmeier, E.M.; Heimberg, E.; Schuster, T.; Zimmermann, A.; Schneider, K.T.; et al. Effect of reducing the n-6:n-3 long-chain PUFA ratio during pregnancy and lactation on infant adipose tissue growth within the first year of life: An open-label randomized controlled trial. Am. J. Clin. Nutr. 2012, 95, 383–394. [Google Scholar] [CrossRef]
- Rao, K.; Cuna, A.; Chavez-Bueno, S.; Menden, H.; Yu, W.; Ahmed, I.; Srinivasan, P.; Umar, S.; Sampath, V. Effect of Various Preterm Infant Milk Formulas on NEC-Like Gut Injury in Mice. Front. Pediatr. 2022, 10, 902798. [Google Scholar] [CrossRef] [PubMed]
- Caplan, M.S.; Russell, T.; Xiao, Y.; Amer, M.; Kaup, S.; Jilling, T. Effect of Polyunsaturated Fatty Acid (PUFA) Supplementation on Intestinal Inflammation and Necrotizing Enterocolitis (NEC) in a Neonatal Rat Model. Pediatr. Res. 2001, 49, 647–652. [Google Scholar] [CrossRef]
- Ohtsuka, Y.; Okada, K.; Yamakawa, Y.; Ikuse, T.; Baba, Y.; Inage, E.; Fujii, T.; Izumi, H.; Oshida, K.; Nagata, S.; et al. ω-3 fatty acids attenuate mucosal inflammation in premature rat pups. J. Pediatr. Surg. 2011, 46, 489–495. [Google Scholar] [CrossRef] [PubMed]
- Lu, J.; Jilling, T.; Li, D.; Caplan, M.S. Polyunsaturated Fatty Acid Supplementation Alters Proinflammatory Gene Expression and Reduces the Incidence of Necrotizing Enterocolitis in a Neonatal Rat Model. Pediatr. Res. 2007, 61, 427–432. [Google Scholar] [CrossRef]
- Alshaikh, B.N.; Reyes Loredo, A.; Yusuf, K.; Maarouf, A.; Fenton, T.R.; Momin, S. Enteral long-chain polyunsaturated fatty acids and necrotizing enterocolitis: A systematic review and meta-analysis. Am. J. Clin. Nutr. 2023, 117, 918–929. [Google Scholar] [CrossRef]
- Bu, S.Y. Genetically Mediated Lipid Metabolism and Risk of Insulin Resistance: Insights from Mendelian Randomization Studies. J. Lipid Atheroscler. 2019, 8, 132–143. [Google Scholar] [CrossRef]
- Varshney, R.; Das, S.; Trahan, G.D.; Farriester, J.W.; Mullen, G.P.; Kyere-Davies, G.; Presby, D.M.; Houck, J.A.; Webb, P.G.; Dzieciatkowska, M.; et al. Neonatal intake of Omega-3 fatty acids enhances lipid oxidation in adipocyte precursors. iScience 2023, 26, 105750. [Google Scholar] [CrossRef] [PubMed]
- Morena, M.; Patel, S.; Bains, J.S.; Hill, M.N. Neurobiological Interactions Between Stress and the Endocannabinoid System. Neuropsychopharmacology 2016, 41, 80–102. [Google Scholar] [CrossRef] [PubMed]
- Fride, E. The endocannabinoid-CB(1) receptor system in pre- and postnatal life. Eur. J. Pharmacol. 2004, 500, 289–297. [Google Scholar] [CrossRef] [PubMed]
- Annuzzi, G.; Piscitelli, F.; Di Marino, L.; Patti, L.; Giacco, R.; Costabile, G.; Bozzetto, L.; Riccardi, G.; Verde, R.; Petrosino, S.; et al. Differential alterations of the concentrations of endocannabinoids and related lipids in the subcutaneous adipose tissue of obese diabetic patients. Lipids Health Dis. 2010, 9, 43. [Google Scholar] [CrossRef]
- Baggelaar, M.P.; Maccarrone, M.; van der Stelt, M. 2-Arachidonoylglycerol: A signaling lipid with manifold actions in the brain. Progress. Lipid Res. 2018, 71, 1–17. [Google Scholar] [CrossRef]
- Ruiz de Azua, I.; Mancini, G.; Srivastava, R.K.; Rey, A.A.; Cardinal, P.; Tedesco, L.; Zingaretti, C.M.; Sassmann, A.; Quarta, C.; Schwitter, C.; et al. Adipocyte cannabinoid receptor CB1 regulates energy homeostasis and alternatively activated macrophages. J. Clin. Investig. 2017, 127, 4148–4162. [Google Scholar] [CrossRef]
- Watson, S.; Chambers, D.; Hobbs, C.; Doherty, P.; Graham, A. The endocannabinoid receptor, CB1, is required for normal axonal growth and fasciculation. Mol. Cell. Neurosci. 2008, 38, 89–97. [Google Scholar] [CrossRef]
- Kurtov, M.; Rubinić, I.; Likić, R. The endocannabinoid system in appetite regulation and treatment of obesity. Pharmacol. Res. Perspect. 2024, 12, e70009. [Google Scholar] [CrossRef]
- Fride, E.; Foox, A.; Rosenberg, E.; Faigenboim, M.; Cohen, V.; Barda, L.; Blau, H.; Mechoulam, R. Milk intake and survival in newborn cannabinoid CB1 receptor knockout mice: Evidence for a "CB3" receptor. Eur. J. Pharmacol. 2003, 461, 27–34. [Google Scholar] [CrossRef]
- Kratz, D.; Sens, A.; Schäfer, S.M.G.; Hahnefeld, L.; Geisslinger, G.; Thomas, D.; Gurke, R. Pre-analytical challenges for the quantification of endocannabinoids in human serum. J. Chromatogr. B Anal. Technol. Biomed. Life Sci. 2022, 1190, 123102. [Google Scholar] [CrossRef]
- Clayton, P.; Hill, M.; Bogoda, N.; Subah, S.; Venkatesh, R. Palmitoylethanolamide: A Natural Compound for Health Management. Int. J. Mol. Sci. 2021, 22, 5305. [Google Scholar] [CrossRef]
- Guzmán, M.; Lo Verme, J.; Fu, J.; Oveisi, F.; Blázquez, C.; Piomelli, D. Oleoylethanolamide stimulates lipolysis by activating the nuclear receptor peroxisome proliferator-activated receptor alpha (PPAR-alpha). J. Biol. Chem. 2004, 279, 27849–27854. [Google Scholar] [CrossRef]
- Bowen, K.J.; Kris-Etherton, P.M.; Shearer, G.C.; West, S.G.; Reddivari, L.; Jones, P.J.H. Oleic acid-derived oleoylethanolamide: A nutritional science perspective. Progress. Lipid Res. 2017, 67, 1–15. [Google Scholar] [CrossRef]
- Drummen, M.; Tischmann, L.; Gatta-Cherifi, B.; Cota, D.; Matias, I.; Raben, A.; Adam, T.; Westerterp-Plantenga, M. Role of Endocannabinoids in Energy-Balance Regulation in Participants in the Postobese State-a PREVIEW Study. J. Clin. Endocrinol. Metab. 2020, 105, e2511–e2520. [Google Scholar] [CrossRef]
- Ventura, A.K. Does Breastfeeding Shape Food Preferences? Links to Obesity. Ann. Nutr. Metab. 2017, 70 (Suppl. S3), 8–15. [Google Scholar] [CrossRef]

| Time (min) | Flow Rate (mL/min) | Solvent A (%) | Solvent B (%) |
|---|---|---|---|
| 0.00 | 0.40 | 75.00 | 25.00 |
| 3.00 | 0.40 | 60.00 | 40.00 |
| 4.00 | 0.40 | 40.00 | 60.00 |
| 5.00 | 0.40 | 30.00 | 70.00 |
| 6.00 | 0.40 | 14.00 | 86.00 |
| 10.00 | 0.40 | 11.00 | 89.00 |
| 10.50 | 0.40 | 0.00 | 100.00 |
| 12.00 | 0.40 | 0.00 | 100.00 |
| 13.50 | 0.40 | 75.00 | 25.00 |
| 15.00 | 0.40 | 75.00 | 25.00 |
| Compound | Detection Mode | Q1 (m/z) | Q3 (m/z) | tR Window (Min) | DP (eV) | CE (eV) |
|---|---|---|---|---|---|---|
| 2-AG | Positive | 379.00 | 305.00 | 5.7–7.5 | 100 | 30 |
| 2-AG | Positive | 379.00 | 287.00 | 5.7–7.5 | 100 | 30 |
| 2-AG | Positive | 379.00 | 269.00 | 5.7–7.5 | 100 | 30 |
| 2-AG | Positive | 379.00 | 259.00 | 5.7–7.5 | 100 | 30 |
| OEA | Positive | 326.00 | 265.00 | 5.9–7.7 | 100 | 30 |
| OEA | Positive | 326.00 | 247.00 | 5.9–7.7 | 100 | 30 |
| OEA | Positive | 326.00 | 135.00 | 5.9–7.7 | 100 | 30 |
| OEA | Positive | 326.00 | 121.00 | 5.9–7.7 | 100 | 30 |
| OEA | Positive | 326.00 | 62.00 | 5.9–7.7 | 100 | 30 |
| PEA | Positive | 300.00 | 283.00 | 5.7–7.5 | 100 | 30 |
| PEA | Positive | 300.00 | 123.00 | 5.7–7.5 | 100 | 30 |
| PEA | Positive | 300.00 | 109.00 | 5.7–7.5 | 100 | 30 |
| PEA | Positive | 300.00 | 95.00 | 5.7–7.5 | 100 | 30 |
| PEA | Positive | 300.00 | 62.00 | 5.7–7.5 | 100 | 30 |
| PEA-d4 | Positive | 304.00 | 287.00 | 5.7–7.5 | 100 | 30 |
| PEA-d4 | Positive | 304.00 | 97.00 | 5.7–7.5 | 100 | 30 |
| PEA-d4 | Positive | 304.00 | 62.00 | 5.7–7.5 | 100 | 30 |
| DHA | Negative | 327.00 | 283.00 | 6.0–7.8 | −220 | −20 |
| DHA | Negative | 327.00 | 281.00 | 6.0–7.8 | −220 | −20 |
| DHA | Negative | 327.00 | 229.00 | 6.0–7.8 | −220 | −20 |
| EPA | Negative | 301.00 | 257.00 | 5.7–7.5 | −220 | −25 |
| EPA | Negative | 301.00 | 255.00 | 5.7–7.5 | −220 | −25 |
| EPA | Negative | 301.00 | 203.00 | 5.7–7.5 | −220 | −25 |
| AA | Negative | 303.00 | 259.00 | 6.2–8.0 | −220 | −30 |
| AA | Negative | 303.00 | 231.00 | 6.2–8.0 | −220 | −30 |
| AA | Negative | 303.00 | 205.00 | 6.2–8.0 | −220 | −30 |
| AA | Negative | 303.00 | 177.00 | 6.2–8.0 | −220 | −30 |
| LA | Negative | 279.00 | 261.00 | 6.3–8.1 | −220 | −35 |
| LA | Negative | 279.00 | 127.00 | 6.3–8.1 | −220 | −35 |
| LA | Negative | 279.00 | 71.00 | 6.3–8.1 | −220 | −35 |
| ALA | Negative | 277.00 | 233.00 | 5.8–7.6 | −220 | −38 |
| ALA | Negative | 277.00 | 127.00 | 5.8–7.6 | −220 | −38 |
| ALA | Negative | 277.00 | 71.00 | 5.8–7.6 | −220 | −38 |
Disclaimer/Publisher’s Note: The statements, opinions and data contained in all publications are solely those of the individual author(s) and contributor(s) and not of MDPI and/or the editor(s). MDPI and/or the editor(s) disclaim responsibility for any injury to people or property resulting from any ideas, methods, instructions or products referred to in the content. |
© 2025 by the authors. Licensee MDPI, Basel, Switzerland. This article is an open access article distributed under the terms and conditions of the Creative Commons Attribution (CC BY) license (https://creativecommons.org/licenses/by/4.0/).
Share and Cite
Csatári-Kovács, R.; Röszer, T.; Csősz, É. Comparative Analysis of Omega-3, Omega-6, and Endocannabinoid Content of Human, Cattle, Goat, and Formula Milk. Foods 2025, 14, 1786. https://doi.org/10.3390/foods14101786
Csatári-Kovács R, Röszer T, Csősz É. Comparative Analysis of Omega-3, Omega-6, and Endocannabinoid Content of Human, Cattle, Goat, and Formula Milk. Foods. 2025; 14(10):1786. https://doi.org/10.3390/foods14101786
Chicago/Turabian StyleCsatári-Kovács, Renáta, Tamás Röszer, and Éva Csősz. 2025. "Comparative Analysis of Omega-3, Omega-6, and Endocannabinoid Content of Human, Cattle, Goat, and Formula Milk" Foods 14, no. 10: 1786. https://doi.org/10.3390/foods14101786
APA StyleCsatári-Kovács, R., Röszer, T., & Csősz, É. (2025). Comparative Analysis of Omega-3, Omega-6, and Endocannabinoid Content of Human, Cattle, Goat, and Formula Milk. Foods, 14(10), 1786. https://doi.org/10.3390/foods14101786