
Nutritional Components and Digestibility Profiles of Some Potential Plant-Based Protein Sources

 , , , ,
Abstract
1. Introduction
2. Materials and Methods
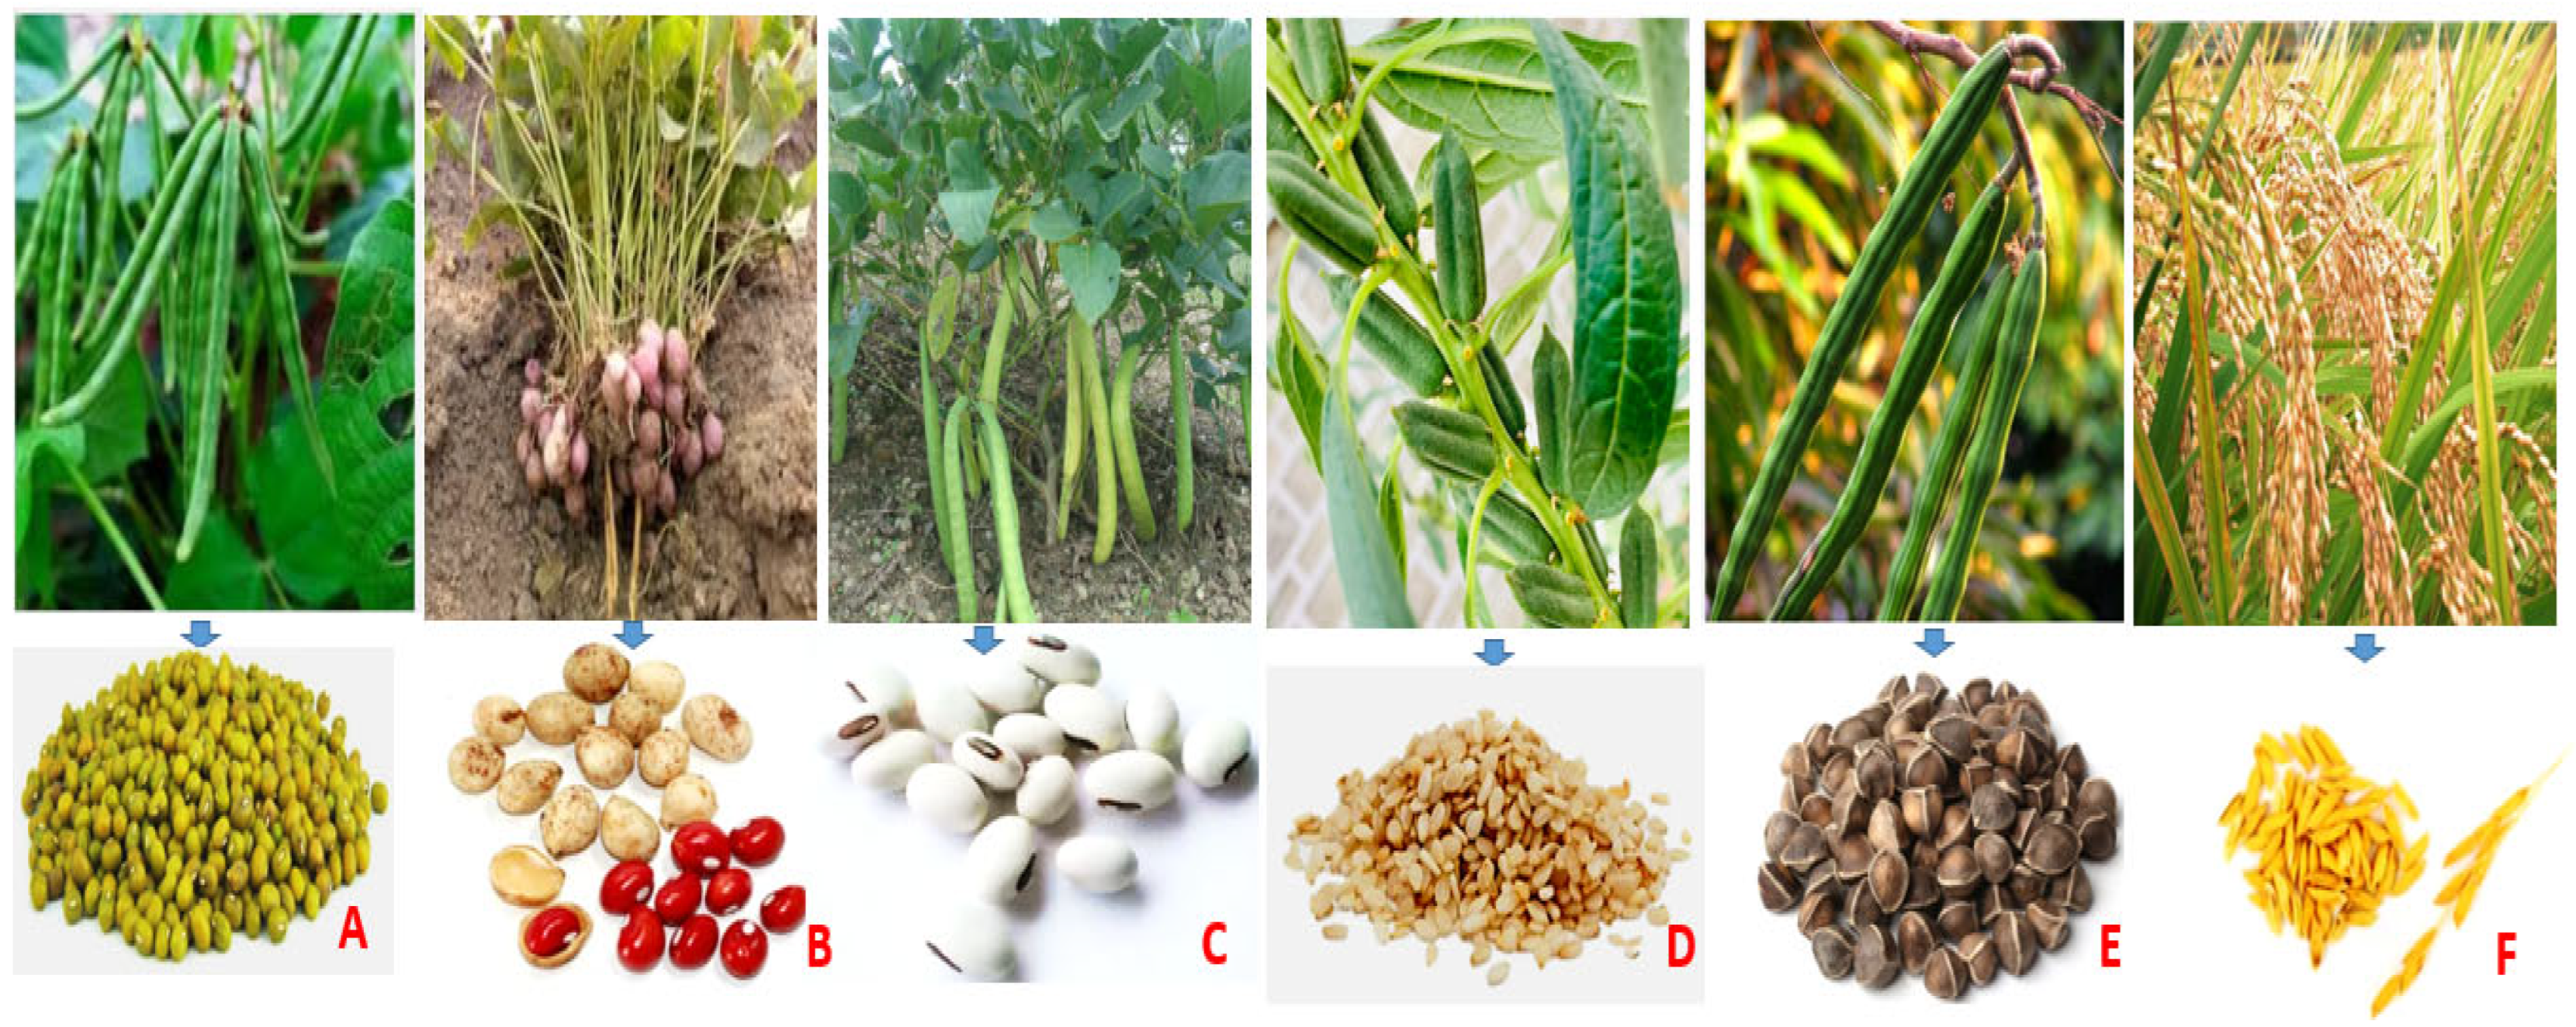
2.1. Plant Materials and Chemicals
2.2. Sample Processing
2.3. Chemical Composition, Anti-Nutritional Compound, and Proximate Analysis
2.3.1. Proximate Analysis
2.3.2. Determination of Tannin Content
2.3.3. Determination of Phytic Acid Content
2.3.4. Determination of Oxalic Acid Content
2.4. Physicochemical Properties Determination
2.4.1. Color Attribute Determination
2.4.2. Bulk Density Determination
2.4.3. Water Activity Determination
2.4.4. Swelling Capacity Determination
2.4.5. Protein Solubility Evaluation
2.5. Protein Quality and Digestibility Determination
2.5.1. In Vitro Gastrointestinal Digestion Assay
2.5.2. Electrophoresis
2.5.3. Amino Acid Analysis
2.5.4. Estimation of Biological Quality of Protein
2.6. Statistical Analysis
3. Results
3.1. Proximate Composition and Anti-Nutritional Factors of Plant Protein Sources
3.2. Physicochemical Properties Determination
3.2.1. Bulk Density, Swelling Capacity, and Water Activity
3.2.2. Color Attributes
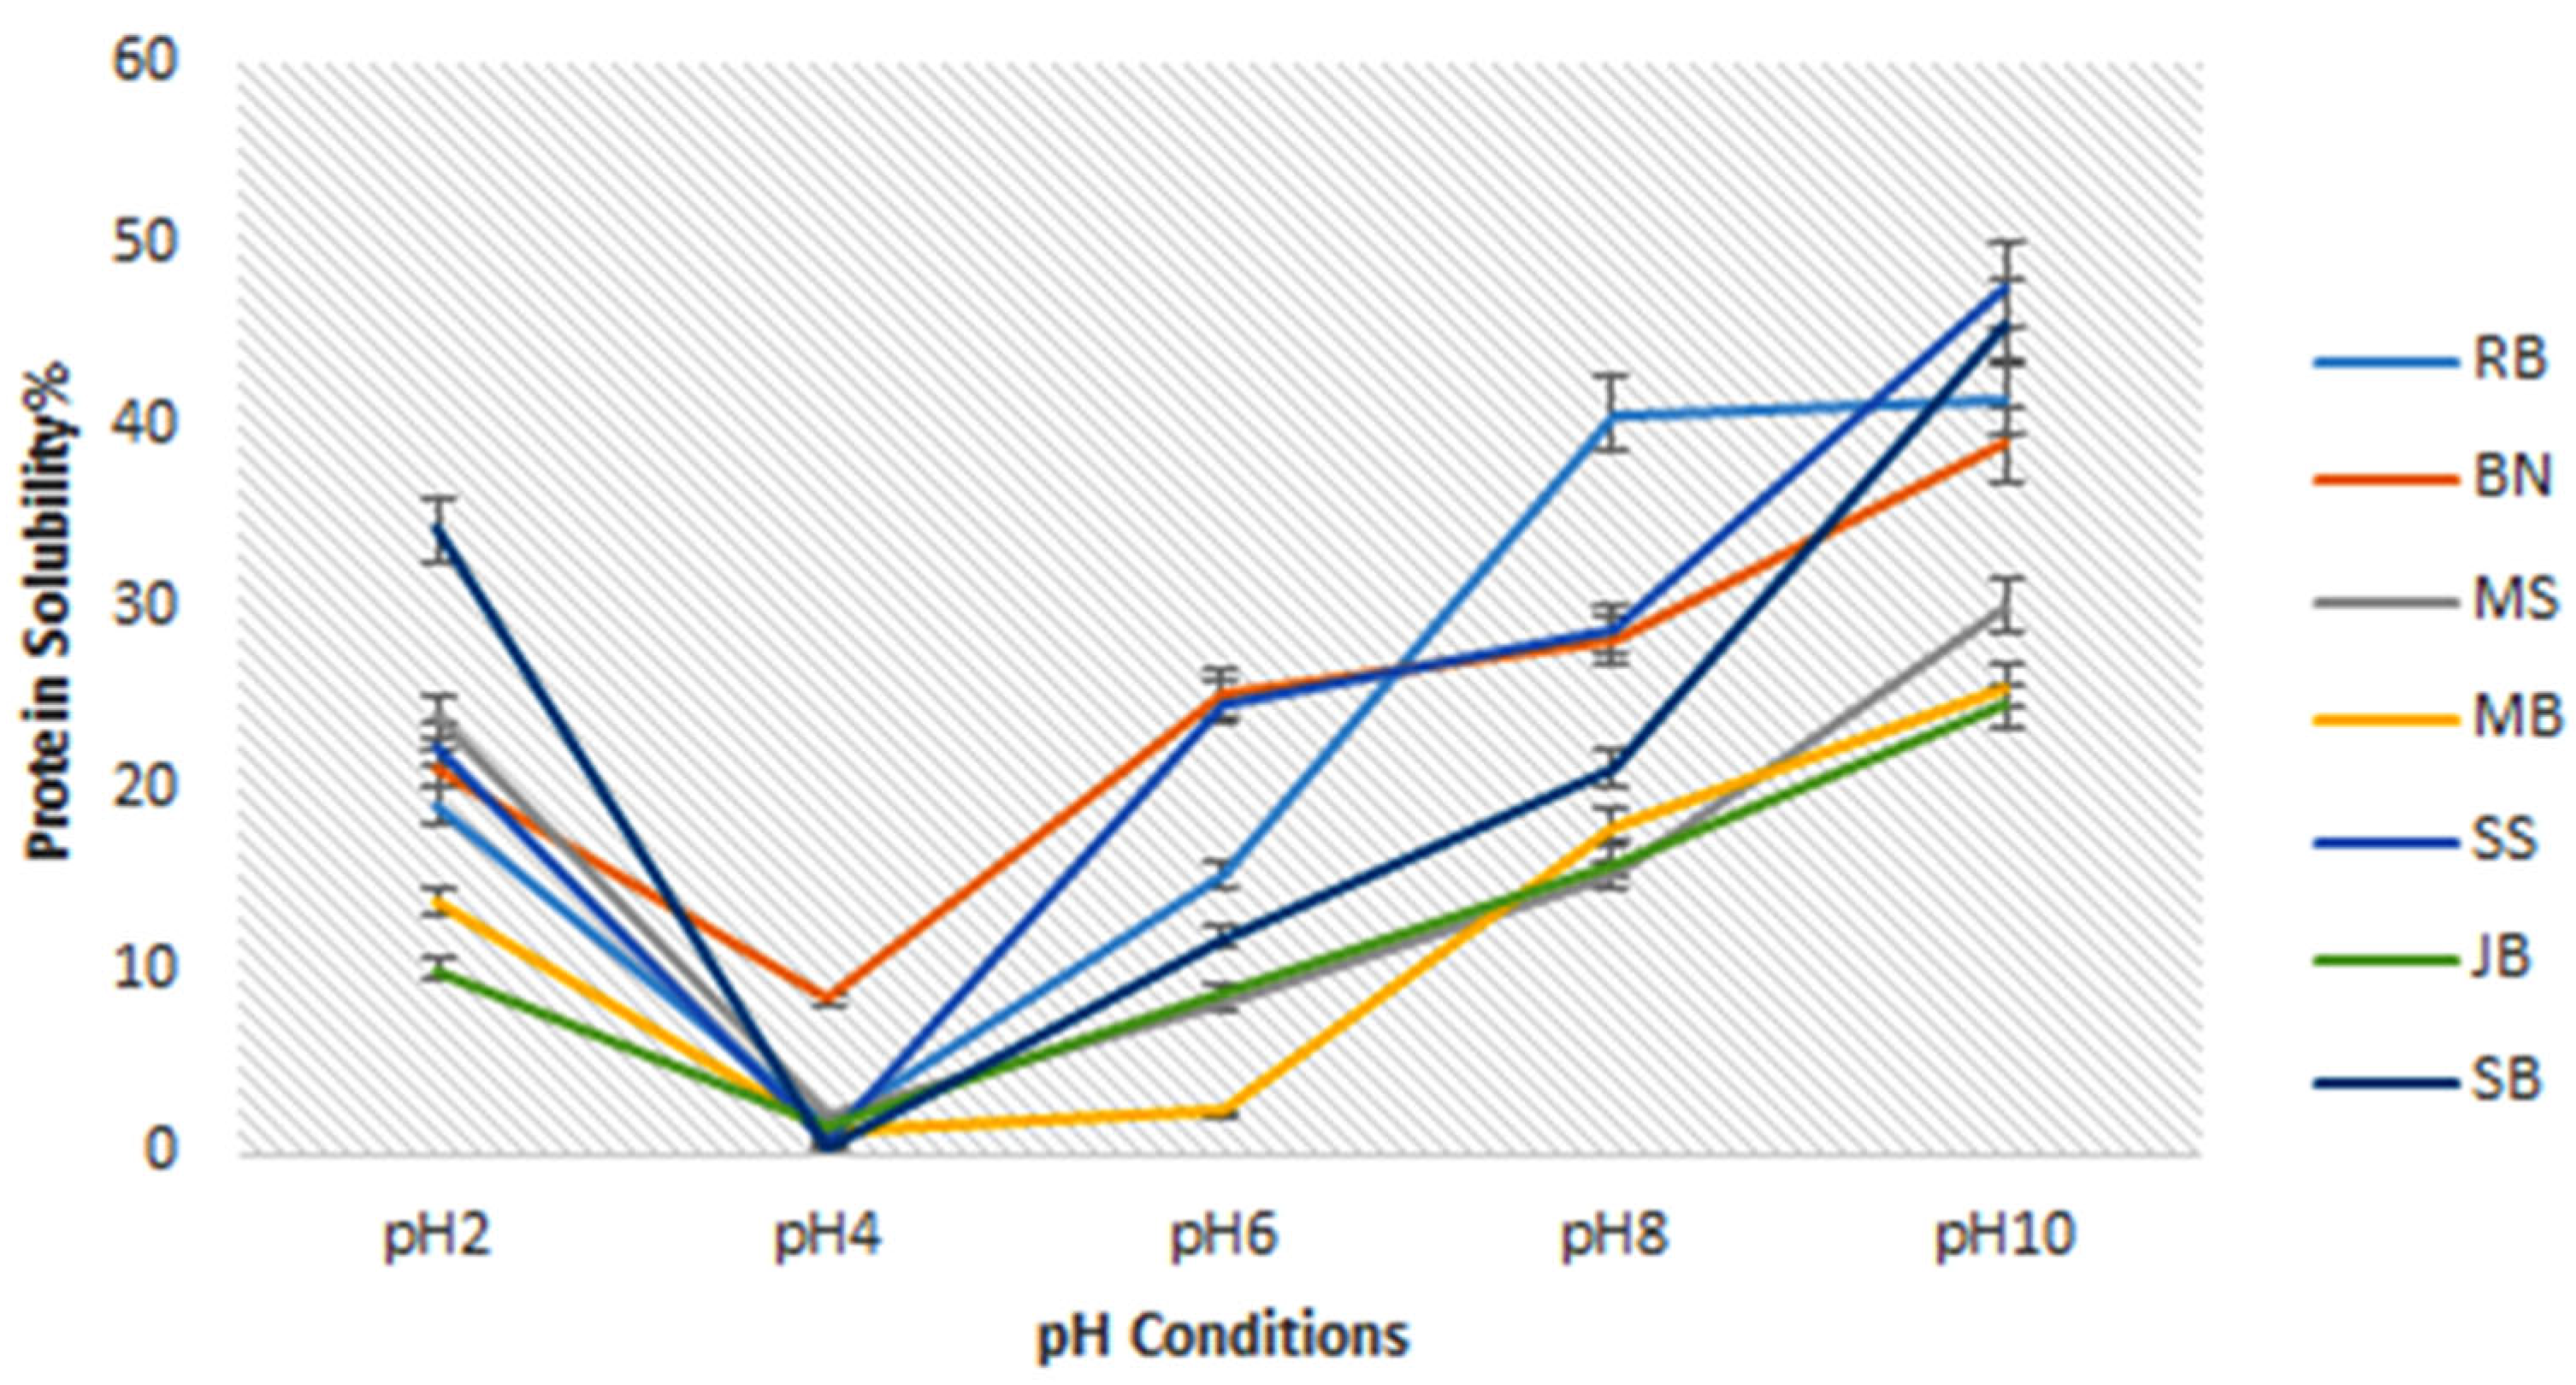
3.2.3. Protein Solubility
3.3. Protein Quality and Digestibility Determination
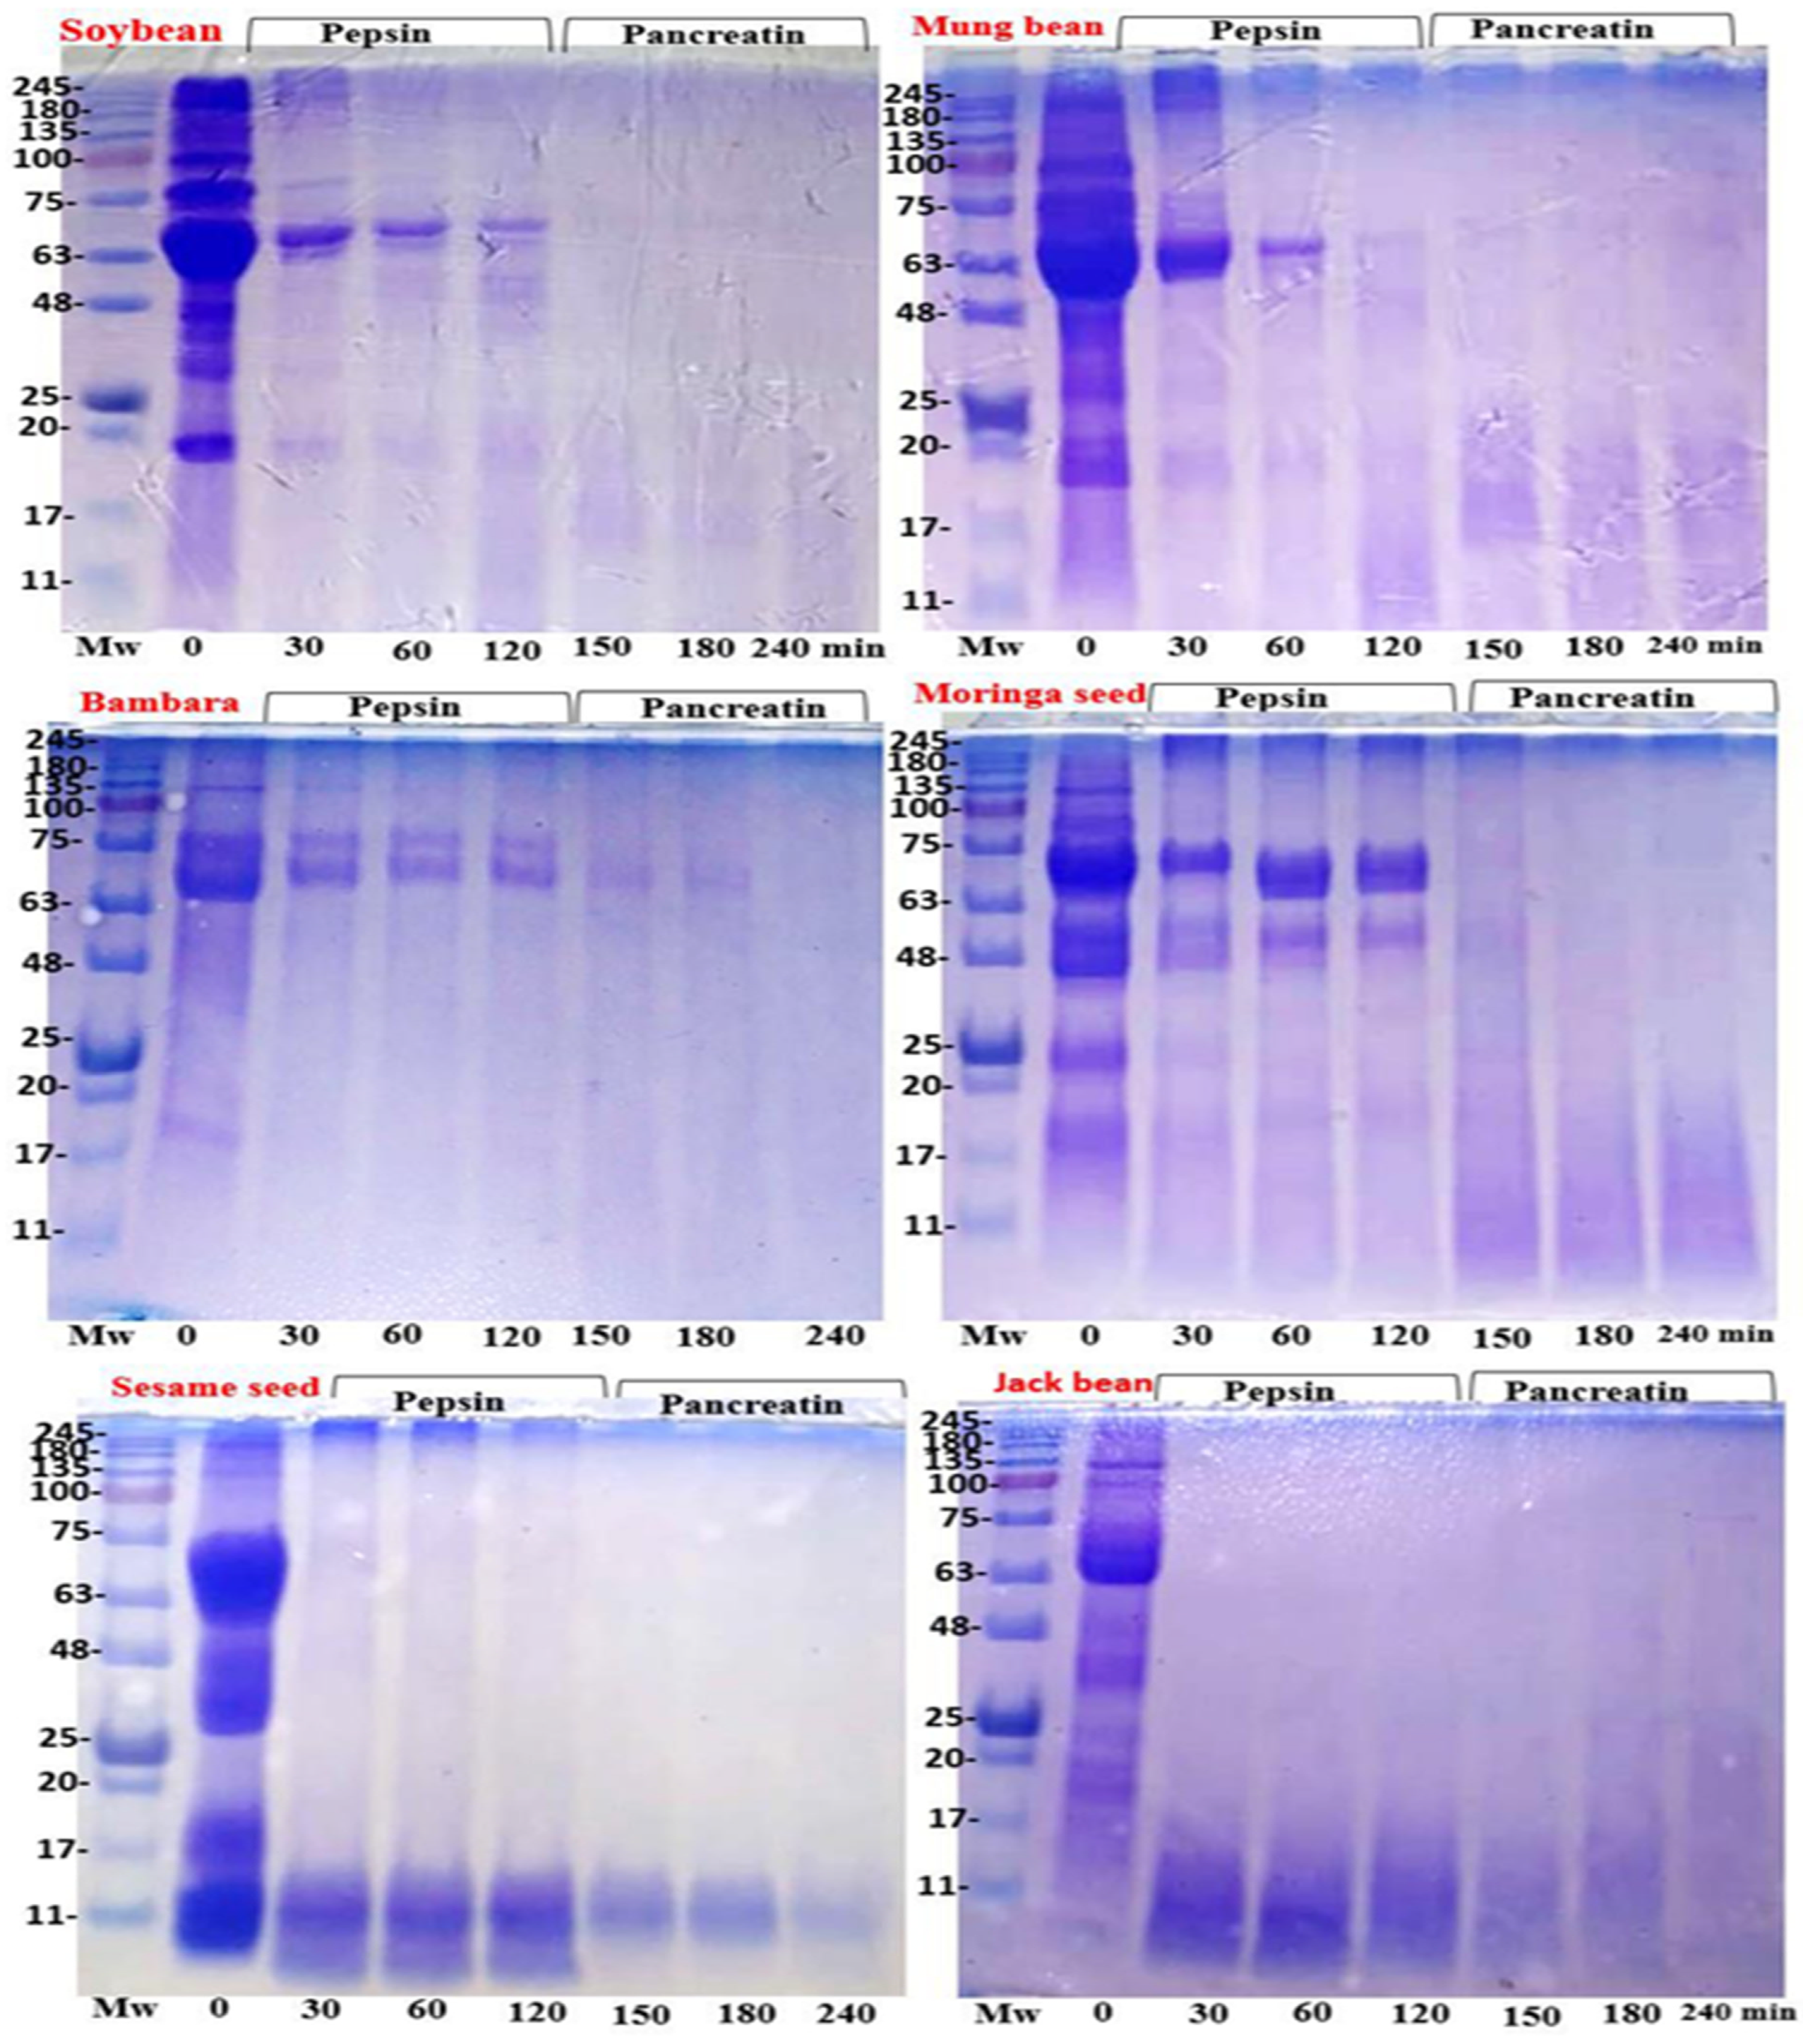
3.3.1. Protein Patterns of Plant Proteins
3.3.2. In Vitro Protein Digestibility Pattern
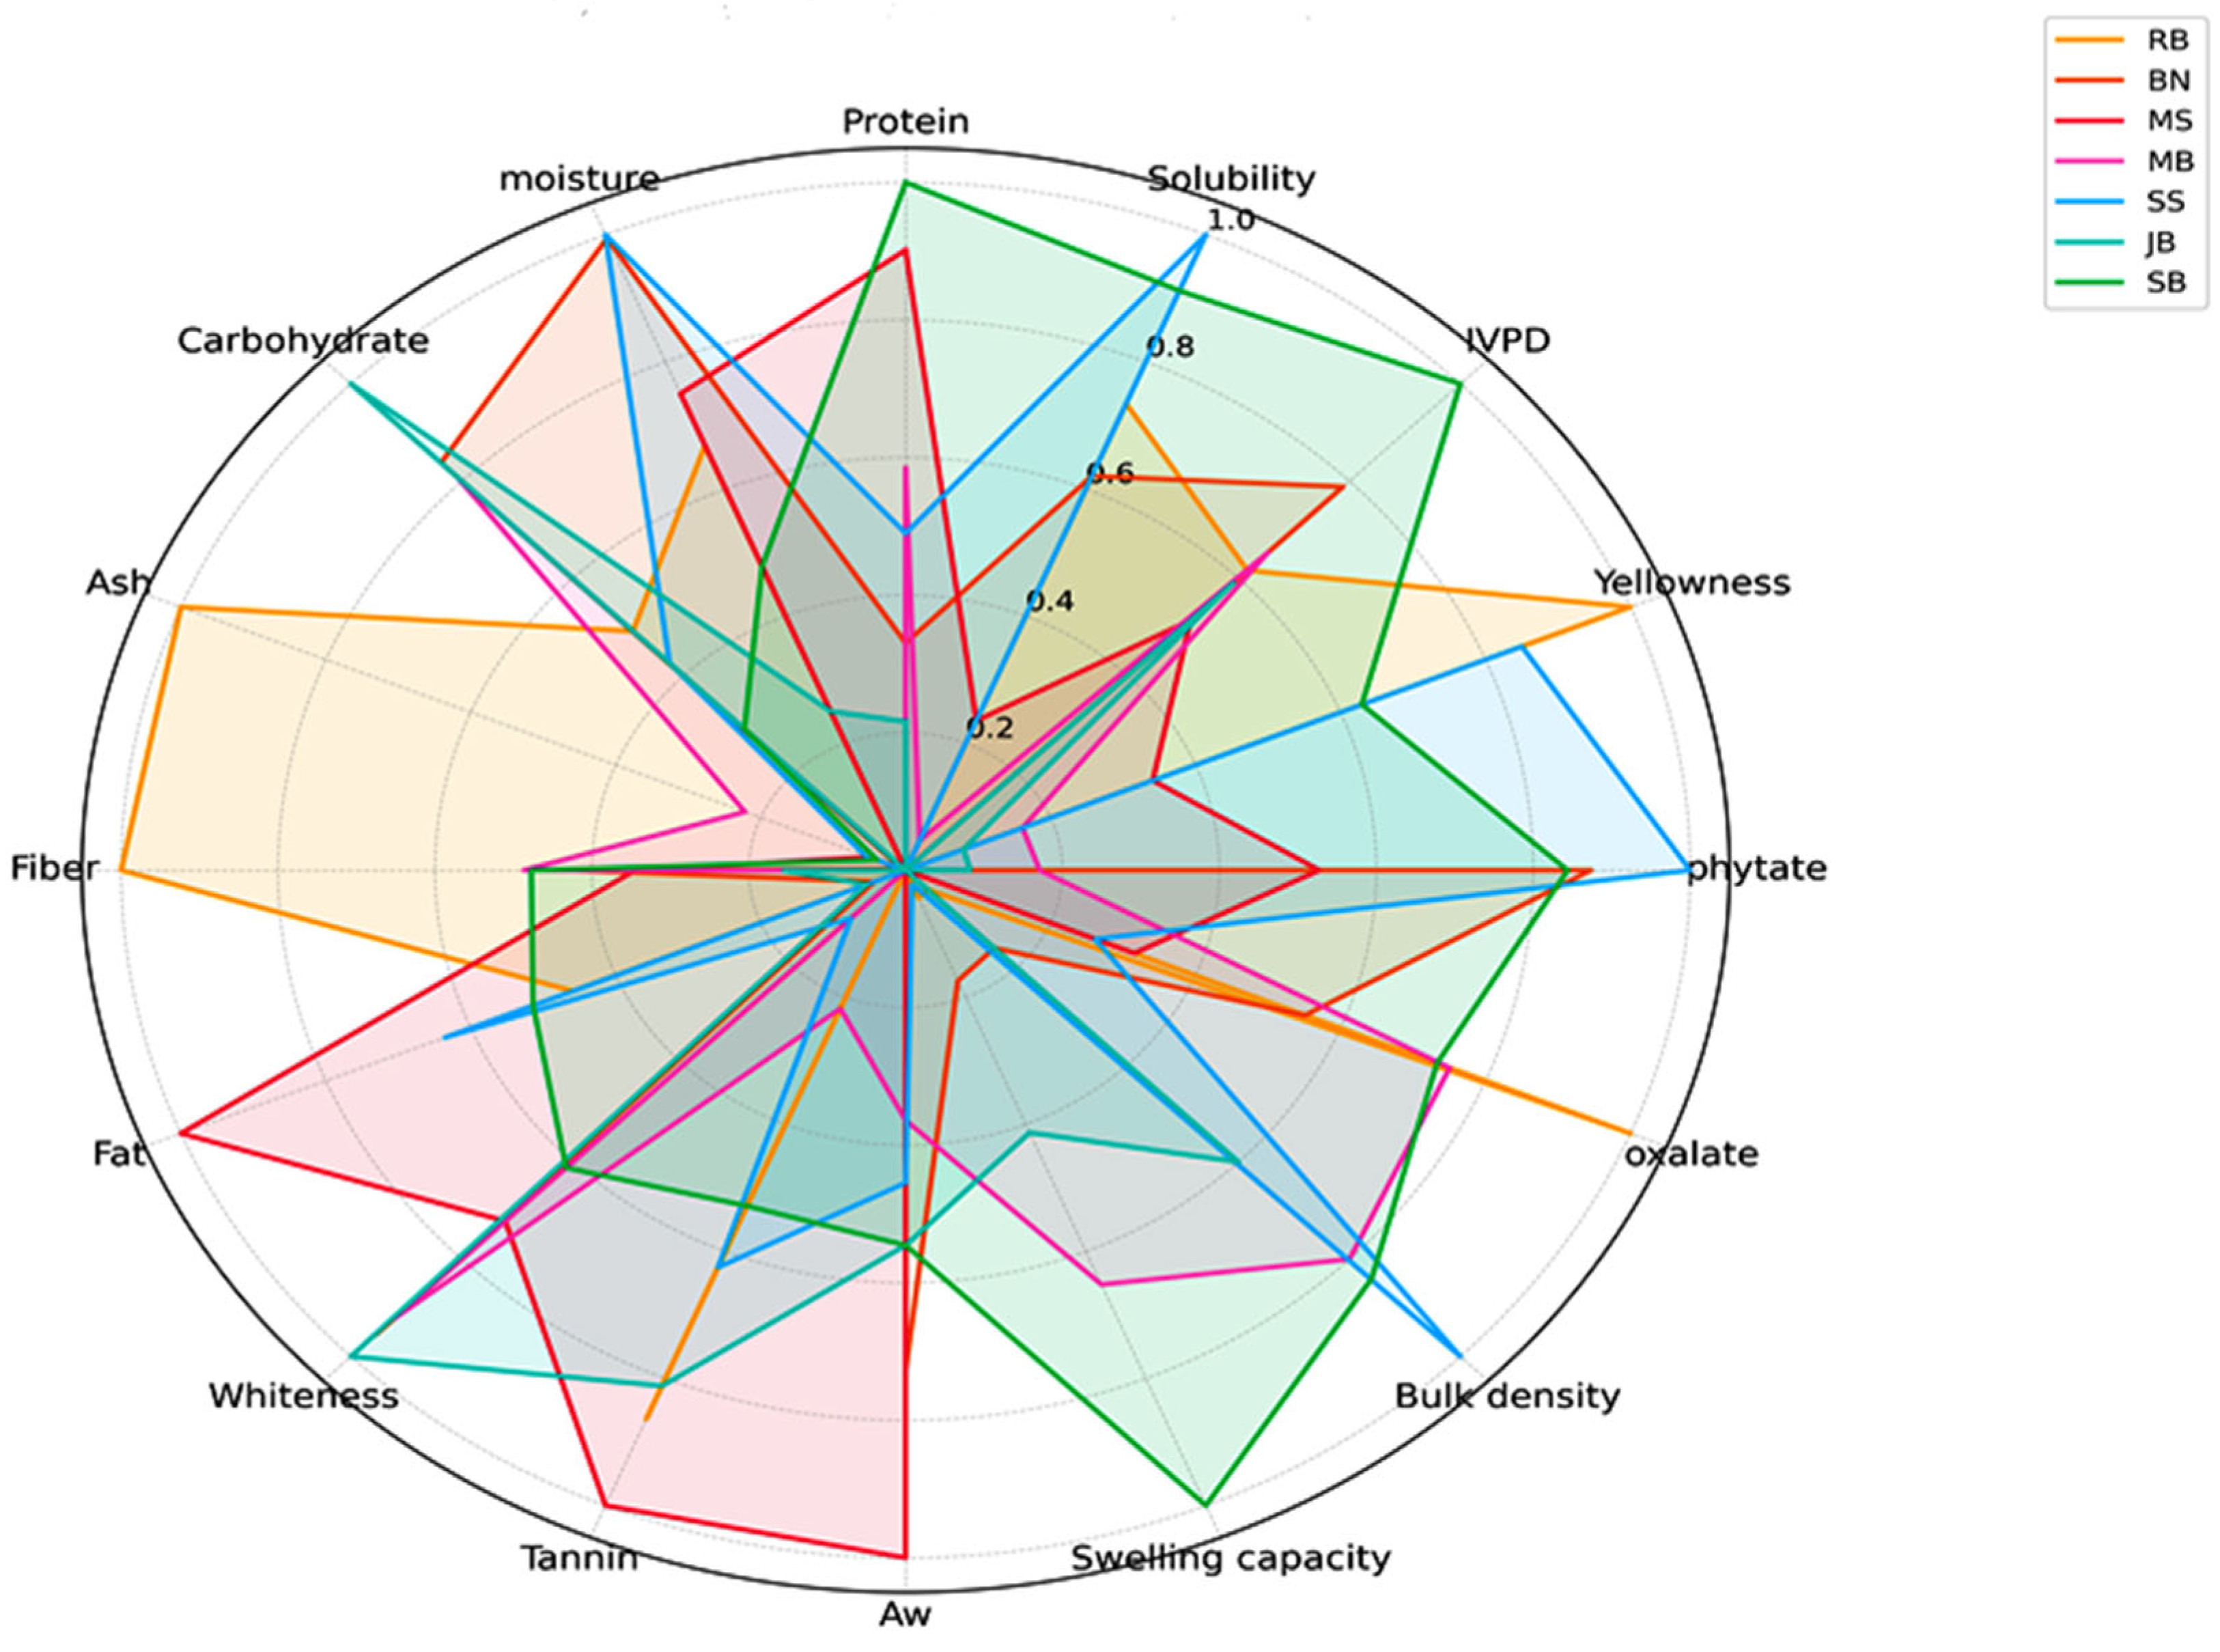
3.3.3. Comparative Radar Analysis
3.3.4. Amino Acid Composition
4. Discussion
4.1. Proximate Compositions
4.2. Anti-Nutritional Factors
4.3. Bulk Density, Swelling Capacity, and Water Activity
4.4. Color Attributes
4.5. Protein Solubility
4.6. Protein Patterns
4.7. In Vitro Simulated Protein Digestion Pattern
4.8. Amino Acid Profile
4.9. Biological Quality of Protein
5. Conclusions
Author Contributions
Funding
Institutional Review Board Statement
Informed Consent Statement
Data Availability Statement
Acknowledgments
Conflicts of Interest
References
- Khan, Z.S.; Wani, S.A.; Fayaz, S. Novel Plant Protein Processing: Developing the Foods of the Future, 1st ed.; CRC Press: Boca Raton, FL, USA, 2023. [Google Scholar] [CrossRef]
- Chandran, A.S.; Kashyap, P.; Thakur, M. Effect of extraction methods on functional properties of plant proteins: A review. Foods 2024, 5, e151. [Google Scholar] [CrossRef]
- Tarahi, M.; Abdolalizadeh, L.; Hedayati, S. Mung bean protein isolate: Extraction, structure, physicochemical properties, modifications, and food applications. Food Chem. 2024, 444, 138626. [Google Scholar] [CrossRef]
- Anyiam, P.N.; Phongthai, S.; Grossmann, L.; Jung, Y.H.; Sai-Ut, S.; Onsaard, E.; Rawdkuen, S. Potential plant proteins for functional food ingredients: Composition, utilization and its challenges. NFS J. 2025, 38, 100216. [Google Scholar] [CrossRef]
- Manzoor, A.; Pandey, V.K.; Dar, A.H.; Fayaz, U.; Dash, K.; Sham, R.; Ahmad, S.; Bashir, I.; Fayaz, J.; Singh, P.; et al. Rice bran: Nutritional, phytochemical and pharmacological profile and its contribution to human health promotion. Food Chem. Adv. 2023, 2, 100296. [Google Scholar] [CrossRef]
- Wunsch, N. Value of the Plant-Based Food Market Worldwide from 2020 to 2030; Statista: Hamburg, Germany, 2024; Available online: https://www.statista.com/statistics/1280394/global-plant-based-food-market-value/ (accessed on 21 January 2025).
- Shrestha, S.; van’t Hag, L.; Haritos, V.S.; Dhital, S. Lentil and mung bean protein isolates: Processing, functional properties and potential food applications. Food Hydrocoll. 2022, 135, 108142. [Google Scholar] [CrossRef]
- Tamangwa, M.W.; Djikeng, F.T.; Feumba, R.D.; Sylvia, V.Z.N.; Loungaing, V.D.; Womeni, H.M. Nutritional composition, phytochemical, and functional properties of six soybean varieties cultivated in cameroun. Legum. Sci. 2023, 5, e210. [Google Scholar] [CrossRef]
- Dimopoulou, M.; Vareltzis, P.; Gortzi, O. A systematic review of the twelve most popular bean varieties, highlighting their potential as functional foods based on the health benefits derived from their nutritional profiles, focused on non-communicable diseases. Appl. Sci. 2024, 14, 10215. [Google Scholar] [CrossRef]
- Barrera, W.J.; Maucieri, C.; Borin, M.; Morbidini, F.; Pogacar, J.; Flajsman, M.; Ghinassi, G.; Verdi, L.; Marta, A.D.; Ferrise, R. Projecting the impacts of climate change on soybean production and water requirements using AguaCrop model. Eur. J. Agron. 2025, 165, 127538. [Google Scholar] [CrossRef]
- Thomasz, E.O.; Perez-Franco, I.; Garcia-Garcia, A. Assessing the impact of climate change in soybean production in Argentina. Clim. Serv. 2024, 4, 100458. [Google Scholar] [CrossRef]
- Pui, L.-P. Drought-tolerant bambara groundnuts as future food: A comprehensive review of its properties and applications in food. Br. Food J. 2022, 124, 3680–3694. [Google Scholar] [CrossRef]
- Maphosa, Y.; Jideani, V.A.; Maphosa, L. Bambara groundnut production, grain composition and nutritional value: Opportunities for improvements. J. Agric. Sci. 2022, 160, 448–458. [Google Scholar] [CrossRef]
- Purwandari, F.A.; Westerbos, C.; Lee, K.; Foglian, O.V.; Capuano, E. Proximate composition, microstructure, and protein and starch digestibility of seven collections of jack bean (Canavalia ensiformis) with different optimal cooking times. Food Res. Int. 2023, 170, 112956. [Google Scholar] [CrossRef] [PubMed]
- Arise, A.K.; Malomo, S.A.; Cynthia, C.I.; Aliyu, N.A.; Arise, R.O. Influence of processing methods on the antinutrients, morphology and in-vitro protein digestibility of jack bean. Food Chem. Adv. 2022, 1, 100078. [Google Scholar] [CrossRef]
- Nouska, C.; Deligeorgaki, M.; Kyrkou, C.; Michaelidou, A.-M.; Moschakis, T.; Biliaderis, C.G.; Lazaridou, A. Structural and physico-chemical properties of sesame cake protein isolates obtained by different extraction methods. Food Hydrocoll. 2024, 151, 109757. [Google Scholar] [CrossRef]
- Kumar, M.; Selvasekaran, P.; Kapoor, S.; Barbhai, M.; Lorenzo, J.M.; Saurabh, V.; Potkule, J.; Changan, S.; ElKelish, A.; Selim, S.; et al. Moringa oleifera Lam. Seed proteins: Extraction, preparation of protein hydrolysates, bioactivities, functional food properties and industrial application. Food Hydrocoll. 2022, 131, 107791. [Google Scholar] [CrossRef]
- Anyiam, P.N.; Nwuke, C.P.; Uhuo, E.N.; Ajah, O.; Uche, P.C.; Kalu, E.M.; Kelechi, P.C.; Eddie-Nkwoh, B.M. Fermented Moringa oleifera seed-cassava inclusion improves protein and selected biochemical indices in alloxan-induced diabetes in animal model. Recent Adv. Nat. Sci. 2024, 2, 106. [Google Scholar] [CrossRef]
- Meza, S.L.; Canizares, L.; Peres, B.; Rodriques, A.; Leaon, M.; Gaioso, C.A.; Egea, I.; de Oliveira, M. Sustainable rice bran protein: Composition, extraction, quality properties and applications. Trends Food Sci. Technol. 2024, 145, 104355. [Google Scholar] [CrossRef]
- Krul, E.S.; Sa, A.G.A.; Goldberg, E.M.; House, J.D. In vitro protein digestibility to replace in vivo digestibility for purposes of nutrient content claim substantiation in North America’s context. Front. Nutr. 2024, 11, 1390146. [Google Scholar] [CrossRef]
- Veldsman, Z.; Pretorius, B.; Schönfeldt, H.C. Examining the contribution of an underutilized food source, bambara-groundnut, in improving protein intake in Sub-Saharan Africa. Front. Sustain. Food Syst. 2023, 7, 1183890. [Google Scholar] [CrossRef]
- FAO; WHO; UNU Expert Consultation. Protein and amino acid requirements in human nutrition. World Health Organ. Tech. Rep. Ser. 2007, 935, 1–265. [Google Scholar]
- Association of Official Analytical Chemists. Official Methods of Analysis of AOAC International, 18th ed.; Association of Official Analytical Chemists: Rockville, MD, USA, 2019. [Google Scholar]
- Makkar, H.P.S.; Bluemmel, M.; Borowy, N.K.; Becker, K. Gravimetric determination of tannins and their correlations with chemical and protein precipitation method. J. Sci. Food Agric. 1993, 61, 161–165. [Google Scholar] [CrossRef]
- Reddy, N.R.; Balakrishnan, C.V.; Salunkekhe, D.K. Phytate phosphorous and mineral changes during germination and cooking of black gram (Phaseolus mungo) seeds. J. Food Sci. 1978, 43, 540–543. [Google Scholar] [CrossRef]
- Anyiam, P.N.; Nwuke, P.C.; Uhuo, E.N.; Ije, U.E.; Salvador, E.M. Effect of fermentation time on nutritional, antinutritional factors and in-vitro protein digestibility of Macrotermes nigeriensis-cassava mahewu. Meas. Food 2023, 11, 100096. [Google Scholar] [CrossRef]
- Ramatsetse, K.E.; Ramashia, S.E.; Mashau, M.E. Effect of partial mutton meat substitution with bambara groundnut (Vigna substerranea (L.) Verdc) flour on physicochemical properties, lipid oxidation and sensory acceptability of low-fat patties. Food Sci. Nutr. 2024, 12, 4017–4037. [Google Scholar] [CrossRef]
- Wang, F.; Zhang, Y.; Xu, L.; Ma, H. An efficient ultrasound-assisted extraction method of pea protein and its effect on protein functional properties and biological activities. LWT-Food Sci. Technol. 2020, 127, 109348. [Google Scholar] [CrossRef]
- Di, Y.; Li, X.; Chang, X.; Gu, R.; Duan, X.; Liu, F.; Liu, X.; Wang, Y. Impact of germination on structural, functional properties and in-vitro protein digestibility of sesame (Sesamum indicum L.) protein. LWT-Food Sci. Technol. 2022, 154, 112651. [Google Scholar] [CrossRef]
- Rawdkuen, S.; D’Amico, S.; Schoenlechner, R. Physicochemical, Functional, and In-vitro Digestibility of Protein Isolates from Thai and Peru Sacha Inchi (Plukenetia volubilis L.) Oil Press-Cakes. Foods 2022, 11, 1869. [Google Scholar] [CrossRef]
- Laemmli, U.K. Cleavage of structural proteins during the assembly of the head of bacteriophage T4. Nature 1970, 227, 680. [Google Scholar] [CrossRef]
- Samaei, S.P.; Ghorbani, M.; Tagliazucchi, D.; Martini, S.; Gotti, R.; Themelis, T.; Tesini, F.; Gianotti, A.; Toschi, T.G.; Babini, E. Functional, nutritional, antioxidant, sensory properties and comparative peptidomic profile of faba bean (Vicia faba, L.) seed protein hydrolysates and fortified apple juice. Food Chem. 2020, 330, 127120. [Google Scholar] [CrossRef]
- Zhang, T.; Guo, Q.; Xin, Y.; Liu, Y. Comprehensive review in moisture retention mechanism of polyssacharides from algae, plants, bacteria and fungus. Arab. J. Chem. 2022, 15, 104163. [Google Scholar] [CrossRef]
- Anuntagool, J.; Soonthonsun, S. Effect of particle size classification on properties of flour from jack bean. An underutilized high protein legume. LWT-Food Sci. Technol. 2023, 189, 115418. [Google Scholar] [CrossRef]
- Li, H.; Sun, J.; Zhang, Y.; Wang, N.; Li, T.; Dong, H.; Yang, M.; Xu, C.; Hu, L.; Liu, C.; et al. Soybean oil and protein: Biosynthesis, regulation and strategies for genetic improvement. Plant Cell Environ. 2024, 10, 15272. [Google Scholar] [CrossRef] [PubMed]
- Antonets, K.S.; Belousov, M.V.; Sulatskaya, A.I.; Belousova, M.E.; Kosolapova, A.O.; Sulatsky, M.I.; Andreeva, E.A.; Zykin, P.A.; Malovichko, Y.V.; Shtark, O.Y.; et al. Accumulation of storage proteins in plant seeds is mediated by amyloid formation. PLOS Biol. 2020, 18, e3000564. [Google Scholar] [CrossRef]
- Illingworth, K.A.; Lee, Y.Y.; Siow, L.F. Functional properties of Moringa oleifera protein isolates as influenced by different isolation techniques, pH and ionic strength. Food Bioprocess Technol. 2022, 17, 3060–3073. [Google Scholar] [CrossRef]
- Qin, P.; Wang, T.; Luo, Y. A review on plant-based proteins from soybean: Health benefits and soy product development. J. Agric. Food Res. 2022, 7, 100265. [Google Scholar] [CrossRef]
- Fan, Y.; Yuang, Y.; Gong, Z.; Wang, Y.; Mei, X.; Yan, F.; Wang, T.; Deng, F.; Chen, Y.; Lei, X.; et al. Rice bran is a key structure affecting high nutrition and low toxicity of Indica hybrid rice (Oryza sativa L.). J. Cereal Sci. 2023, 114, 103808. [Google Scholar] [CrossRef]
- Wisetkomolmat, J.; Arjin, C.; Satsook, A.; Seel-Audom, M.; Ruksiriwanich, W.; Prom-U-Thai, C.; Sringarm, K. Comparative Analysis of Nutritional Components and Phytochemical Attributes of Selected Thai Rice Bran. Front. Nutr. 2022, 24, 833730. [Google Scholar] [CrossRef]
- Liu, Y.; Zhang, H.; Yi, C.; Quan, K.; Lin, B. Chemical composition, structure, physicochemical and functional properties of rice bran dietary fiber modified by cellulase treatment. Food Chem. 2021, 342, 128352. [Google Scholar] [CrossRef]
- Beshaw, T.; Demssie, K.; Tefera, M.; Guadie, A. Determination of proximate compositions, selected essential and heavy metals in sesame seeds (Sesamum indicum L.) from the Ethiopian markets and assessment of the associated health risks. Toxicol. Rep. 2022, 9, 1806–1812. [Google Scholar] [CrossRef]
- Bu, M.; Fan, W.; Li, R.; He, B.; Cui, P. Lipid metabolism and improvement in oilseed crops: Recent advances in multi-omics studies. Metabolites 2023, 13, 1170. [Google Scholar] [CrossRef]
- Torabi, S.; Sukumaran, A.; Dhaubhadel, S.; Johnson, S.E.; LaFayette, P.; Parrott, W.A.; Rajcan, I.; Eskandari, M. Effects of type I Diacylglycerol O-acyltransferase (DGAT1) genes on soybean (Glycine max L.) seed composition. Sci. Rep. 2021, 11, 2556. [Google Scholar] [CrossRef] [PubMed]
- Xu, D.; Hao, J.; Wang, Z.; Liang, D.; Wang, J.; Ma, Y. Physicochemical properties, fatty acid compositions, bioactive compounds, antioxidant activity and thermal behavior of rice bran oil obtained with aqueous enzymatic extraction. LWT-Food Sci. Technol. 2021, 149, 111817. [Google Scholar] [CrossRef]
- Salim, R.; Nehvi, I.B.; Mir, R.A.; Tyagi, A.; Ali, S.; Bhat, O.M. A review on anti-nutritional factors: Unraveling the natural gateways to human health. Front. Nutr. 2023, 31, 1215873. [Google Scholar] [CrossRef] [PubMed]
- León-López, L.; Escobar-Zúñiga, Y.; Milán-Carrillo, J.; Domínguez-Arispuro, D.M.; Gutiérrez-Dorado, R.; CuevasRodríguez, E.O. Chemical proximate composition, antinutritional factors content, and antioxidant capacity of anatomical seed fractions of Moringa oleifera. Acta Univ. 2020, 30, e2892. [Google Scholar] [CrossRef]
- Kunatsa, Y.; Chidewe, C.; Zvidzai, C.J. Phytochemical and anti-nutrient composition from selected marginalized Zimbabwean edible insects and vegetables. J. Agric. Food Res. 2020, 2, 100027. [Google Scholar] [CrossRef]
- Blazek, J.; Copeland, L. Pasting and swelling properties of wheat flour and starch in relation to amylose content. Carbohydr. Polym. 2008, 71, 380–387. [Google Scholar] [CrossRef]
- Awuchi, C.G.; Igwe, V.S.; Echeta, C.K. The functional properties of foods and flours. Int. J. Adv. Res. Sci. Technol. Eng. 2019, 5, 139–160. [Google Scholar]
- Wintersohle, C.; Kracke, I.; Ignatzy, L.M.; Etzbach, L.; Schweiggert-Weisz, U. Physico-chemical and chemical properties of mung bean protein isolate affected by the isolation procedure. Curr. Res. Food Sci. 2023, 7, 101582. [Google Scholar] [CrossRef]
- Gharsallah, K.; Rezig, L.; Rajoka, M.S.R.; Mehwish, H.M.; Ali, M.A.; Chew, S.C. Moringa oleifera: Processing, phytochemical composition and industrial applications. S. Afr. J. Bot. 2023, 160, 180–193. [Google Scholar] [CrossRef]
- Grossmann, L.; McClements, D.J. Current insights into protein solubility: A review of its importance for alternative proteins. Food Hydrocoll. 2023, 137, 108416. [Google Scholar] [CrossRef]
- Alabi, O.O.; Ali, N.; Nwachukwu, I.D.; Aluko, R.E.; Amonsou, E.O. Composition and some functional properties of bambara groundnut vicilin fraction. LWT-Food Sci. Technol. 2020, 125, 109256. [Google Scholar] [CrossRef]
- Cattan, Y.; Patil, D.; Vaknin, Y.; Rytwo, G.; Lakemond, C.; Benjamin, O. Characterization of moringa oleifera leaf and seed protein extract functionality in emulsion model system. Innov. Food Sci. Emerg. Technol. 2022, 75, 102905. [Google Scholar] [CrossRef]
- Tandjung, W.I.; Sutedja, A.M.; Ristiarini, S.; Trisnawati, C.Y. Effect of soaking and boiling time on the functional properties of jack bean flour. Food Sci. J. 2024, 6, 2685–4279. [Google Scholar] [CrossRef]
- Idowu, A.O.; Alashi, A.M.; Nwachukwu, I.D.; Fagbemi, T.N.; Aluko, R.E. Functional properties of sesame (Sesamum indicum Linn) seed protein fractions. Food Prod. Process. Nutr. 2021, 3, 4. [Google Scholar] [CrossRef]
- Dumitrascu, L.; Stanciuc, N.; Grigore-Gurgu, A.I. Spectroscopic and molecular modelling investigations on heat induced behaviour of soy proteins. Emir. J. Food Agric. 2019, 31, 569–579. [Google Scholar] [CrossRef]
- Peraza-Juan, M.; Espinoza-sanchez, E.A.; Lara-Reyes, J.A.; Sandate-Flores, L.; Méndez-Zamora, G.; Rascón-Cruz, Q.; Garcia-Zambrano, E.A.; Zavala-Garcia, F.; Sinagawa-Garcia, S.R. Characterization of seed storage protein of moringa oleifera and analyses on their bioactive peptides nutraceutical properties. Acta Sci. Pol. Technol. Aliment. 2022, 21, 311–320. [Google Scholar] [CrossRef]
- Sibt-e-Abbas, M.; Butt, M.S.; Riaz, M.N.; Teferra, T.F.; Ul-Haq, I. Amino acid profiling and SDS-PAGE analysis of protein isolates obtained from non-conventional sources. J. Food Qual. 2022, 22, 1926527. [Google Scholar] [CrossRef]
- Calvo-Lerma, J.; Asensio-Grau, A.; García-Hernández, J.; Heredia, A.; Andrés, A. Exploring the Impact of Solid-State Fermentation on Macronutrient Profile and Digestibility in Chia (Salvia hispanica) and Sesame (Sesamum indicum) Seeds. Foods 2022, 11, 410. [Google Scholar] [CrossRef]
- Vissamsetti, N.; Simon-Collins, M.; Lin, S.; Bandyopadhyay, S.; Kuriyan, R.; Sybesma, W.; Tome, D. Local sources of protein in low-and middle-income countries: How to improve the protein quality. Curr. Dev. Nutr. 2024, 8, 102049. [Google Scholar] [CrossRef]
- Machado, M.; Machado, S.; Pimentel, F.B.; Freitas, V.; Alves, R.C.; Oliveira, M.B.P.P. Amino acid profile and protein quality assessment of macroalgae produced in an integrated multitrophic aquaculture system. Foods 2020, 9, 1382. [Google Scholar] [CrossRef]


| Sample | Moisture | Ash | Protein | Fiber | Fat | Carbohydrate |
|---|---|---|---|---|---|---|
| Rice bran | 4.80 ± 0.35 bc | 9.92 ± 0.10 a | 14.98 ± 2.18 d | 8.18 ± 0.11 a | 18.09 ± 1.83 c | 44.01 ± 1.83 c |
| Bambara bean | 6.00 ± 0.51 a | 3.14 ± 0.11 d | 20.59 ± 1.41 c | 5.13 ± 0.34 b | 6.41 ± 0.64 d | 58.72 ± 2.21 b |
| Moringa seed | 5.10 ± 0.22 b | 3.45 ± 0.06 c | 30.29 ± 2.20 a | 4.72 ± 0.02 b | 33.30 ± 0.79 a | 23.12 ± 2.15 e |
| Mung bean | 2.34 ± 0.78 d | 4.62 ± 0.15 b | 24.90 ± 0.08 b | 5.47 ± 1.21 b | 5.19 ± 1.05 d | 57.45 ± 1.12 b |
| Sesame seeds | 6.02 ± 0.39 a | 3.49 ± 0.23 c | 23.30 ± 1.54 b | 2.90 ± 0.10 c | 23.05 ± 0.98 b | 41.21 ± 2.56 c |
| Jack bean | 3.16 ± 0.07 d | 3.11 ± 0.08 d | 18.65 ± 0.99 c | 3.72 ± 0.22 c | 6.70 ± 1.22 d | 65.65 ± 1.19 a |
| Soy bean | 4.10 ± 0.54 c | 3.38 ± 0.06 c | 31.96 ± 1.32 a | 5.42 ± 0.68 b | 19.64 ± 1.81 c | 35.47 ± 3.20 d |
| Sample | Physicochemical Properties | Anti-Nutritional Properties | ||||
|---|---|---|---|---|---|---|
| Bulk Density (g/mL) | Swelling Capacity (mL/g) | Water Activity | Phytate (mg/g) | Oxalate (mg/100 g) | Tannin (mg/100 g) | |
| Rice bran | 0.50 ± 0.0 b | 0.27 ± 0.0 d | 0.38 ± 0.0 f | 37.19 ± 2.81 a | 6.50 ± 0.26 e | 7.01 ± 0.40 e |
| Bambara bean | 0.53 ± 0.1 b | 0.33 ± 0.0 cd | 0.54 ± 0.0 b | 14.65 ± 1.21 d | 8.30 ± 0.29 c | 10.79 ± 2.57 a |
| Moringa seed | 0.49 ± 0.1 b | 0.25 ± 0.0 d | 0.60 ± 0.0 a | 19.29 ± 2.97 c | 9.71 ± 1.09 b | 6.64 ± 0.17 e |
| Mung bean | 0.69 ± 0.0 a | 0.55 ± 0.0 b | 0.46 ± 0.0 e | 28.60 ± 1.10 c | 7.39 ± 0.53 d | 9.50 ± 0.77 b |
| Sesame seed | 0.74 ± 0.1 a | 0.26 ± 0.1 d | 0.48 ± 0.0 d | 13.47 ± 2.92 d | 10.10 ± 0.52 b | 7.76 ± 0.57 cd |
| Jack bean | 0.64 ± 0.0 a | 0.44 ± 0.1 bc | 0.50 ± 0.0 c | 32.47 ± 2.29 b | 12.56 ± 0.44 a | 7.16 ± 0.20 de |
| Soy bean | 0.70 ± 0.0 a | 0.71 ± 0.1 a | 0.50 ± 0.0 c | 14.96 ± 0.73 d | 7.46 ± 0.16 d | 8.11 ± 0.60 c |
| Sample | Appearance | L* | a* | b* | WI | YI | ΔE |
|---|---|---|---|---|---|---|---|
| Rice bran | 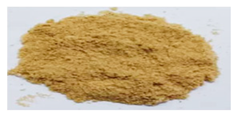 | 76.37 ± 0.52 d | 3.36 ± 0.06 a | 20.72 ± 0.01 a | 68.38 ± 0.39 f | 38.76 ± 0.25 a | 19.33 ± 0.52 a |
| Bambara bean |  | 89.09 ± 1.07 c | 1.23 ± 0.16 b | 8.11 ± 0.21 f | 86.33 ± 0.88 ab | 13.07 ± 0.42 g | 9.61 ± 0.41 c |
| Moringa seed | 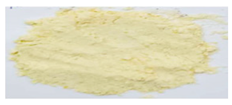 | 87.97 ± 0.47 c | 0.77 ± 0.01 c | 13.44 ± 0.53 c | 81.94 ± 0.59 c | 21.83 ± 0.91 d | 18.55 ± 0.61 a |
| Mung bean | 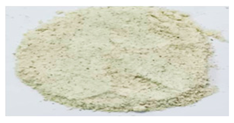 | 90.90 ± 1.39 b | -0.30 ± 0.07 f | 10.95 ± 0.47 d | 85.71 ± 0.77 b | 17.21 ± 0.66 e | 13.01 ± 0.57 b |
| Sesame seed | 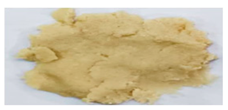 | 76.96 ± 0.59 d | 0.71 ± 0.03 c | 18.81 ± 0.64 b | 70.23 ± 0.14 e | 34.91 ± 0.93 b | 10.44 ± 0.13 c |
| Jack bean |  | 91.63 ± 0.12 b | 0.49 ± 0.05 d | 9.70 ± 0.09 e | 87.17 ± 0.03 a | 15.12 ± 0.13 f | 9.73 ± 0.90 c |
| Soy bean |  | 95.14 ± 1.31 a | 0.16 ± 0.11 e | 19.43 ± 0.14 b | 79.88 ± 0.44 d | 29.24 ± 0.62 c | NA |
| Amino acid | Moringa Seed | Bambara Bean | FAO/WHO Reference |
|---|---|---|---|
| Essential amino acids | Children | ||
| Threonine | 2.52 | 4.10 | 3.40 |
| Valine | 3.78 | 5.36 | 3.50 |
| Phenylalanine | 4.41 | 5.68 | 6.30 |
| Isoleucine | 3.17 | 4.12 | 2.80 |
| Leucine | 5.78 | 7.50 | 6.60 |
| Histidine | 2.43 | 3.03 | 1.90 |
| Lysine | 2.82 | 6.57 | 5.80 |
| Methionine | 1.98 | 1.68 | 2.50 |
| Tryptophan | 0.81 | 1.03 | 0.85 |
| Non-essential amino acids | |||
| Serine | 3.17 | 5.89 | NA |
| Aspartic acid | 4.76 | 11.52 | NA |
| Glutamic acid | 20.66 | 14.65 | NA |
| Glycine | 4.73 | 3.92 | NA |
| Alanine | 4.02 | 4.11 | NA |
| Tyrosine | 1.65 | 2.80 | NA |
| Cystine | 2.83 | 0.72 | NA |
| Proline | 5.49 | 3.70 | NA |
| Arginine | 13.94 | 5.60 | NA |
| TAA (g/100 g) | 88.99 | 91.98 | NA |
| TEAA(g/100 g) | 27.74 | 39.07 | NA |
| TNEAA (g/100 g) | 66.25 | 52.91 | NA |
| % TEAA | 31.17 | 42.47 | NA |
| BCAAs (g/100 g) | 12.73 | 12.90 | NA |
| AAAs (g/100 g) | 6.87 | 9.51 | NA |
| AAS (%) | 49.31 (Lys) | 67.20 (Meth) | NA |
| PDCAAS% | 41.42 | 58.46 | NA |
| E/T (%) | 31.17 | 42.47 | NA |
| EAAI (%) | 86.26 | 116.96% | NA |
Disclaimer/Publisher’s Note: The statements, opinions and data contained in all publications are solely those of the individual author(s) and contributor(s) and not of MDPI and/or the editor(s). MDPI and/or the editor(s) disclaim responsibility for any injury to people or property resulting from any ideas, methods, instructions or products referred to in the content. |
© 2025 by the authors. Licensee MDPI, Basel, Switzerland. This article is an open access article distributed under the terms and conditions of the Creative Commons Attribution (CC BY) license (https://creativecommons.org/licenses/by/4.0/).
Share and Cite
Anyiam, P.N.; Phongthai, S.; Sai-Ut, S.; Kingwascharapong, P.; Jung, Y.H.; Zhang, W.; Rawdkuen, S. Nutritional Components and Digestibility Profiles of Some Potential Plant-Based Protein Sources. Foods 2025, 14, 1769. https://doi.org/10.3390/foods14101769
Anyiam PN, Phongthai S, Sai-Ut S, Kingwascharapong P, Jung YH, Zhang W, Rawdkuen S. Nutritional Components and Digestibility Profiles of Some Potential Plant-Based Protein Sources. Foods. 2025; 14(10):1769. https://doi.org/10.3390/foods14101769
Chicago/Turabian StyleAnyiam, Paul Ndubuisi, Suphat Phongthai, Samart Sai-Ut, Passakorn Kingwascharapong, Young Hoon Jung, Wanli Zhang, and Saroat Rawdkuen. 2025. "Nutritional Components and Digestibility Profiles of Some Potential Plant-Based Protein Sources" Foods 14, no. 10: 1769. https://doi.org/10.3390/foods14101769
APA StyleAnyiam, P. N., Phongthai, S., Sai-Ut, S., Kingwascharapong, P., Jung, Y. H., Zhang, W., & Rawdkuen, S. (2025). Nutritional Components and Digestibility Profiles of Some Potential Plant-Based Protein Sources. Foods, 14(10), 1769. https://doi.org/10.3390/foods14101769