
Comparative Analysis of Biochemical Parameters, Thermal Behavior, Rheological Features, and Gelling Characteristics of Thai Ligor Hybrid Chicken and Broiler Meats

 ,
, 
Abstract
1. Introduction
2. Materials and Methods
2.1. Chemical
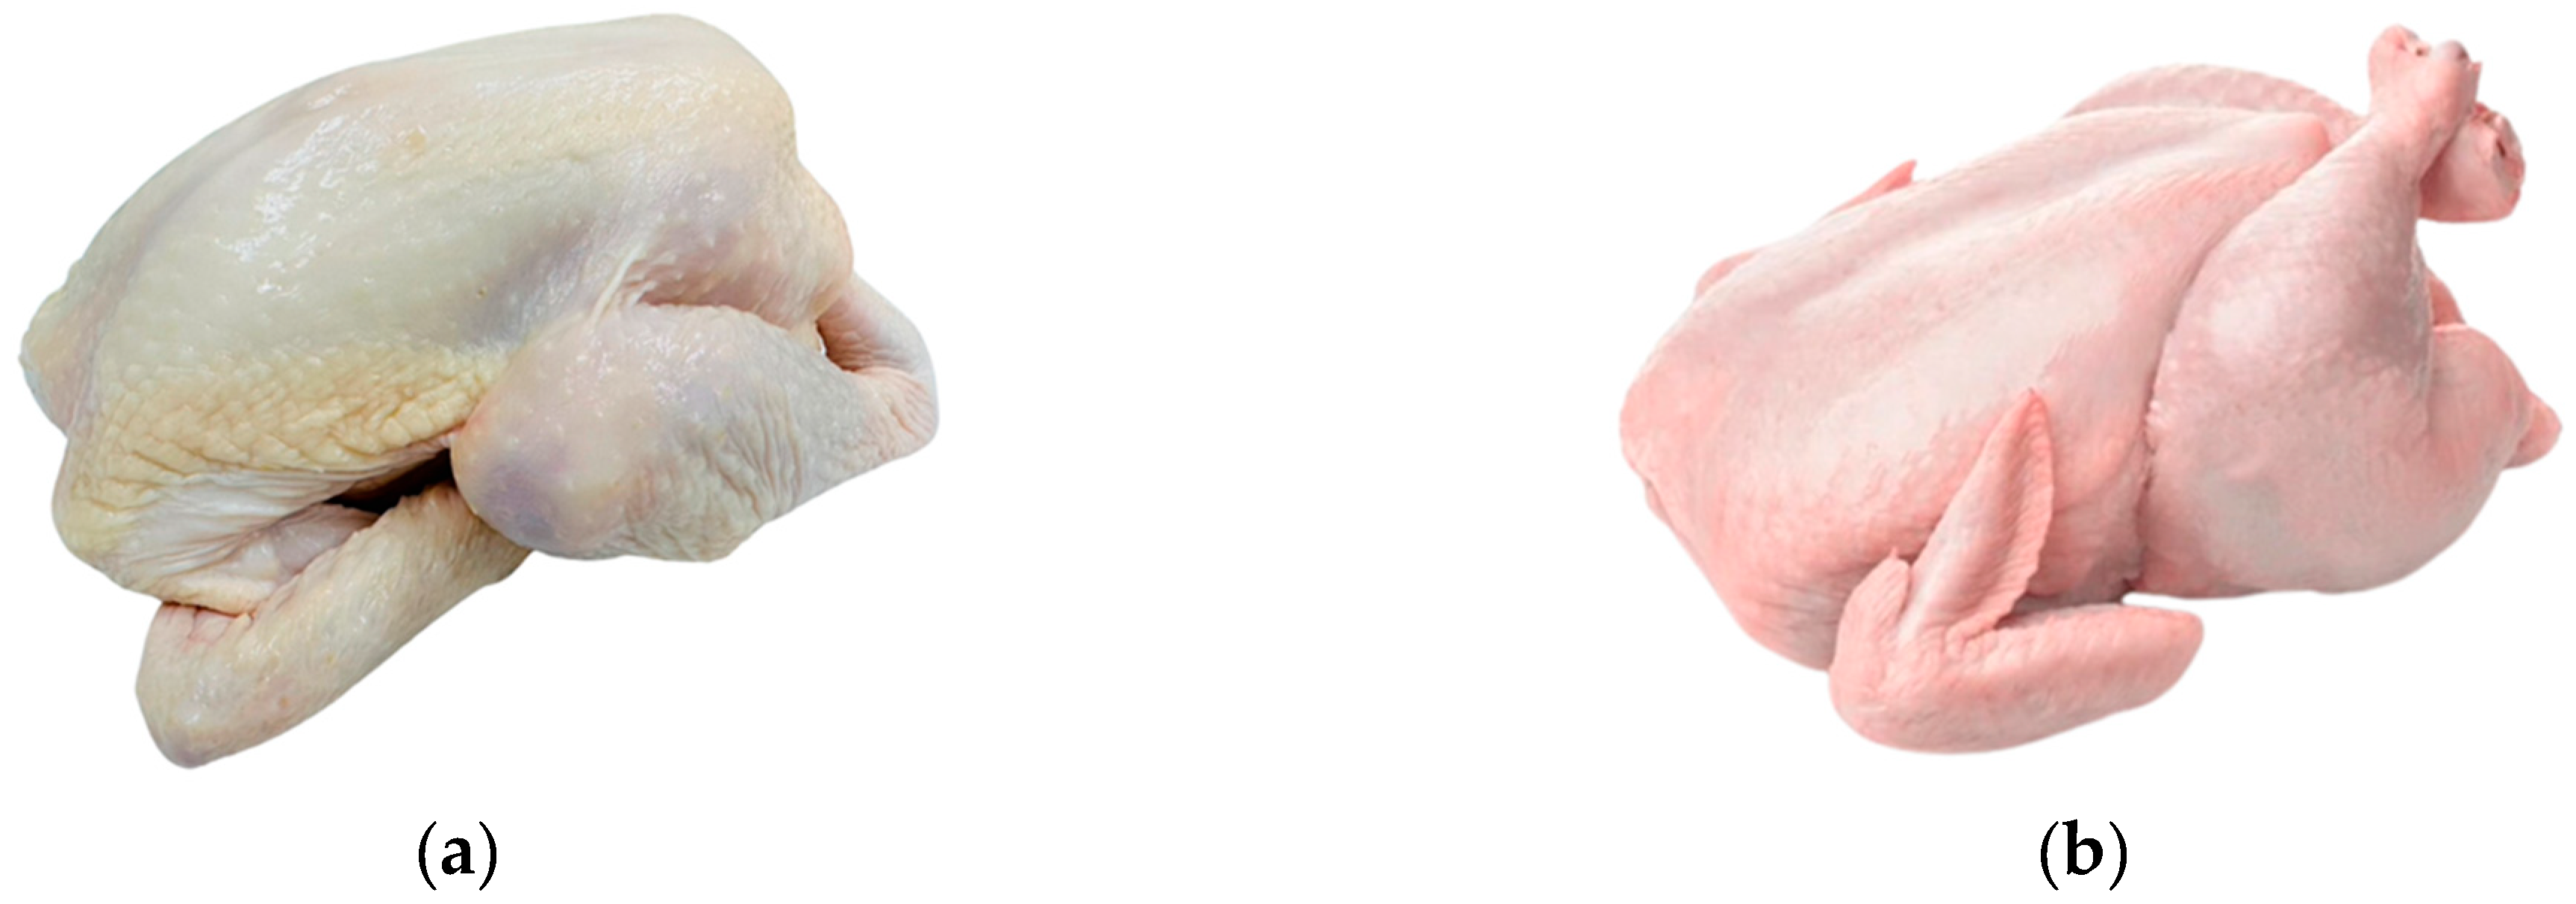
2.2. Chicken Meat
2.3. pH Determination
2.4. Ca2+-ATPase Activity
2.5. Reactive Sulfhydryl (SH) Content
2.6. Hydrophobicity
2.7. TCA-Soluble Peptide
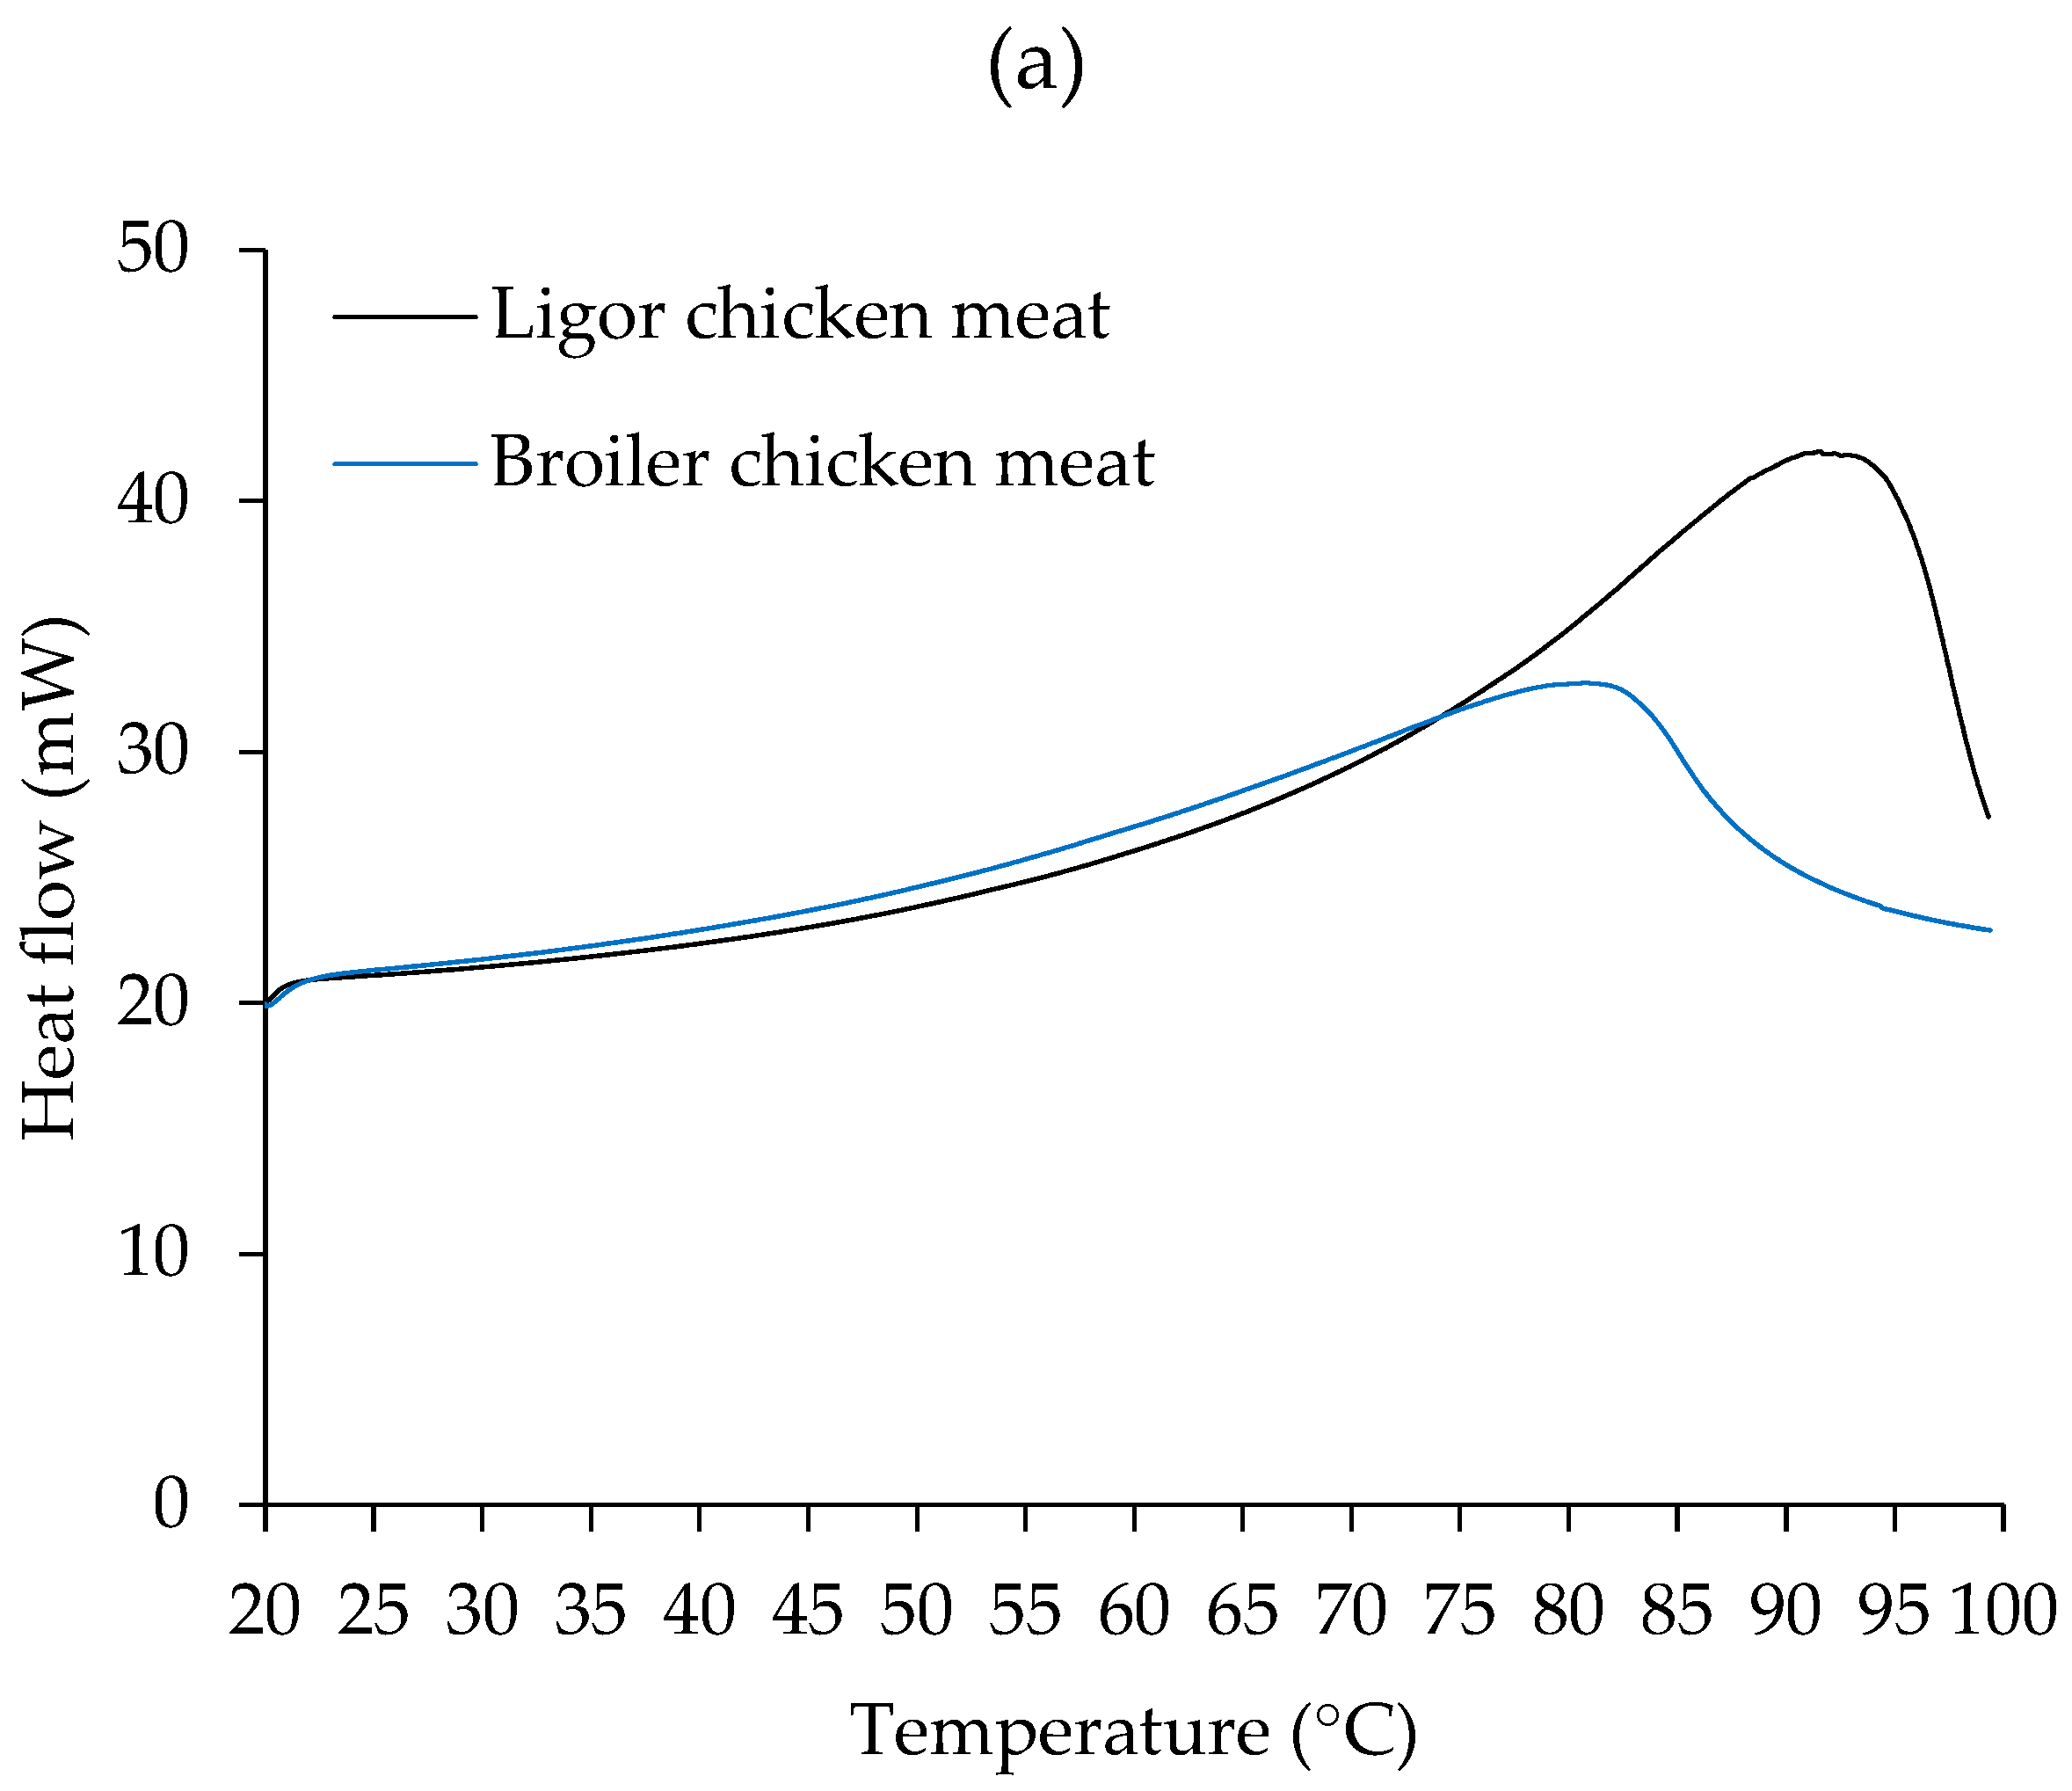
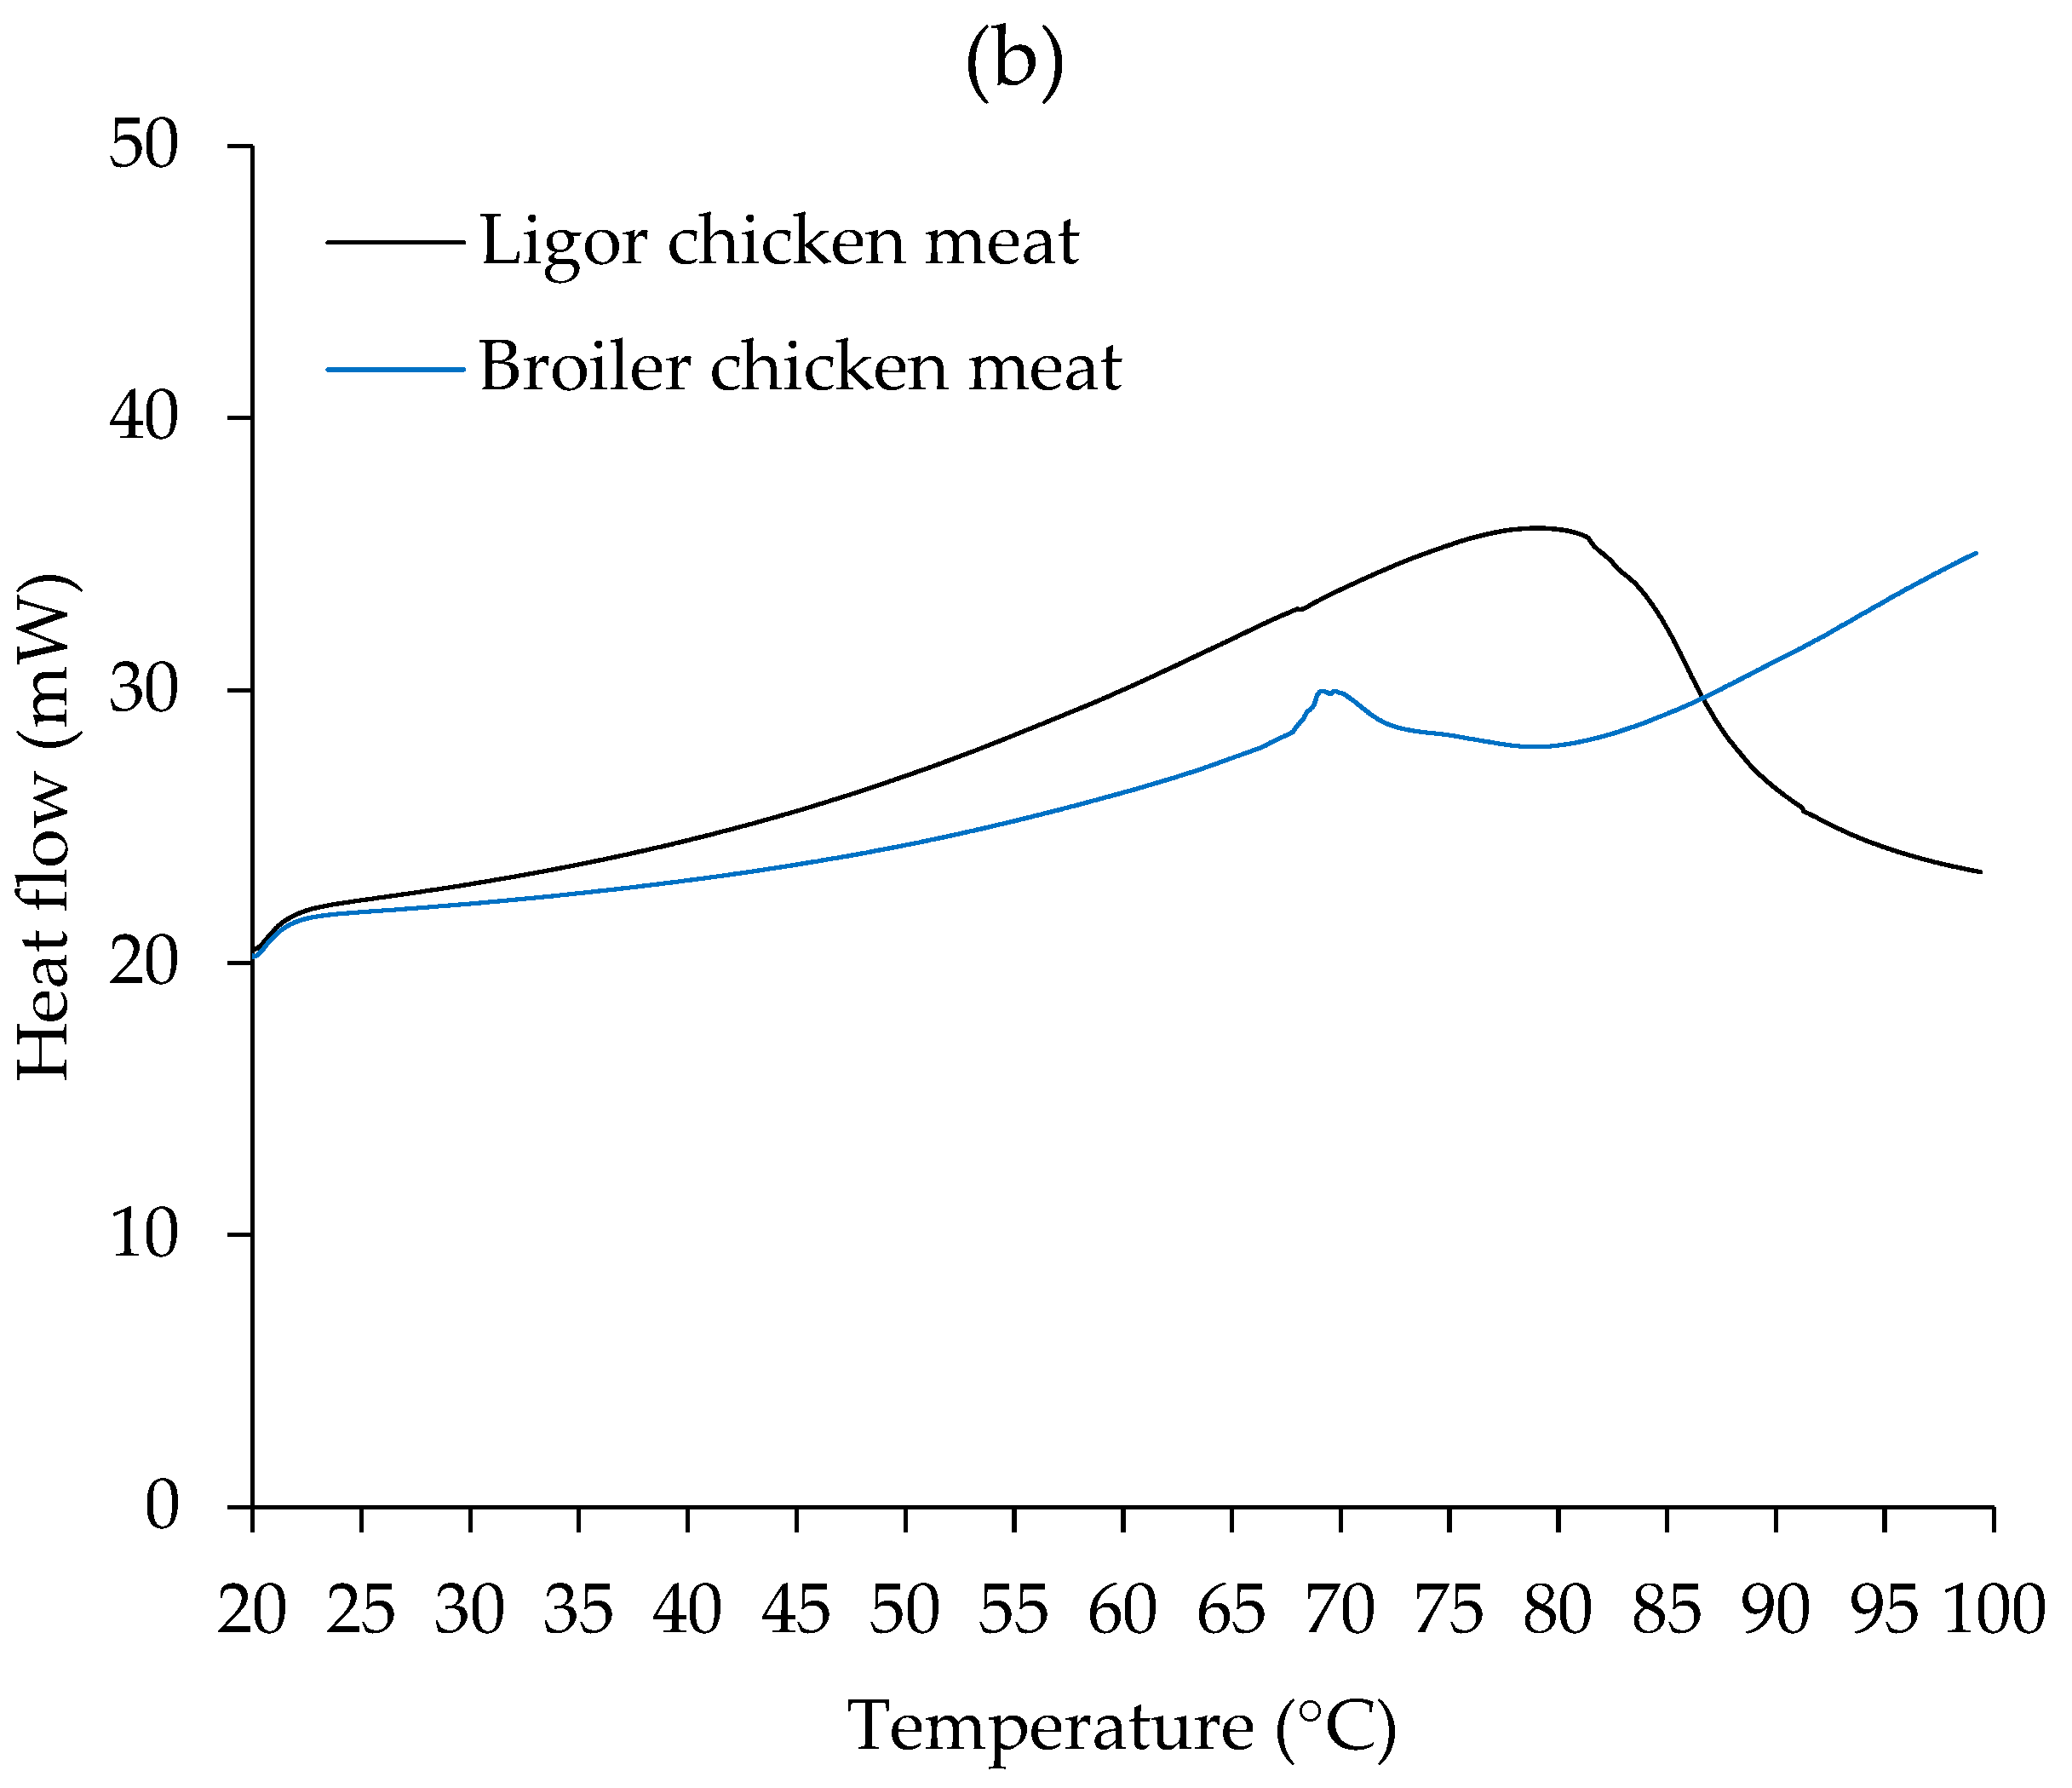
2.8. Thermal Property
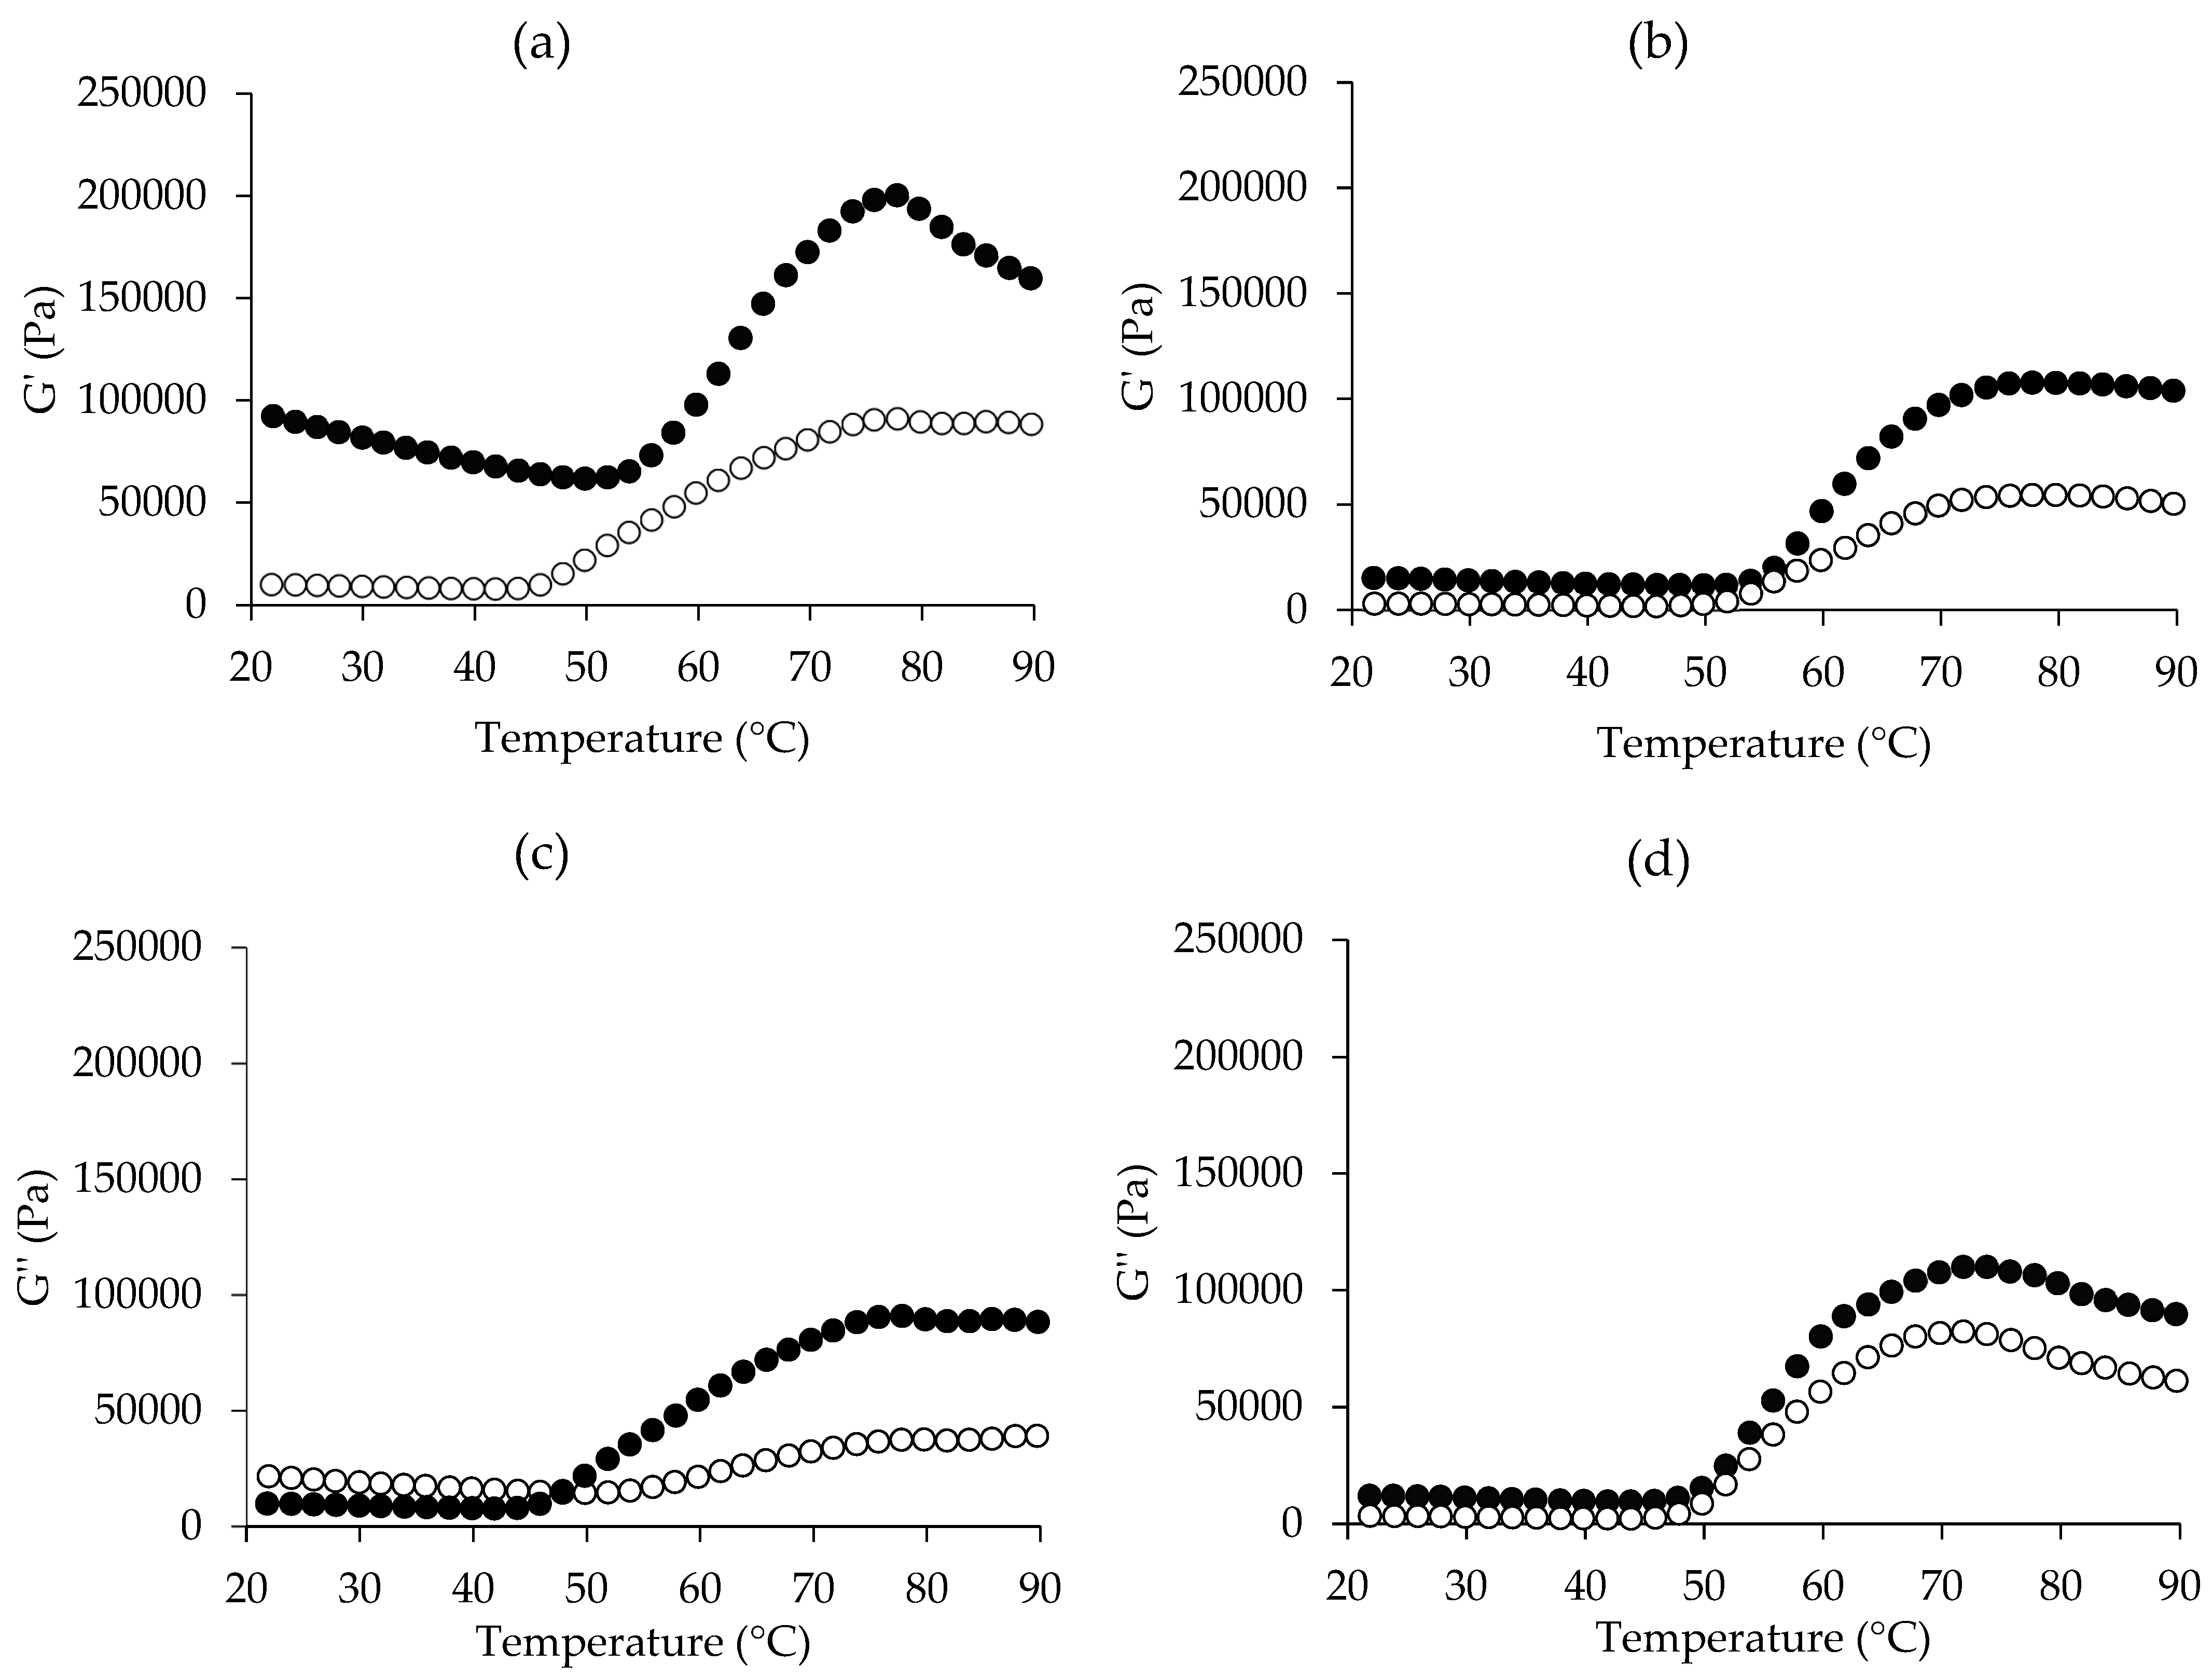
2.9. Rheological Property
2.10. Gelation Functionality and Analyses
2.10.1. Textural Profile Analyses (TPA)
2.10.2. Expressible Drip
2.10.3. pH
2.10.4. Whiteness
2.10.5. Thiobarbituric Acid Reactive Substances (TBARS)
2.11. Statistical Analysis
3. Results and Discussion
3.1. pH
3.2. Ca2+-ATPase Activity, Reactive SH Content, Hydrophobicity, and TCA-Soluble Peptide
3.3. Thermal Property
3.4. Dynamic Rheological Properties
3.5. Gelation Functionality
3.5.1. TPA
3.5.2. pH, Expressible Moisture Content, and Whiteness
3.5.3. TBARS
4. Conclusions
Author Contributions
Funding
Institutional Review Board Statement
Informed Consent Statement
Data Availability Statement
Acknowledgments
Conflicts of Interest
References
- Alsubhi, M.; Blake, M.; Nguyen, T.; Majmudar, I.; Moodie, M.; Ananthapavan, J. Consumer willingness to pay for healthier food products: A systematic review. Obes. Rev. 2023, 24, e13525. [Google Scholar] [CrossRef] [PubMed]
- Xu, C.; Yin, Z. Unraveling the flavor profiles of chicken meat: Classes, biosynthesis, influencing factors in flavor development, and sensory evaluation. Compr. Rev. Food Sci. Food Saf. 2024, 23, e13391. [Google Scholar] [CrossRef] [PubMed]
- Panpipat, W.; Chaijan, M.; Karnjanapratum, S.; Keawtong, P.; Tansakul, P.; Panya, A.; Phonsatta, N.; Aoumtes, K.; Quan, T.H.; Petcharat, T. Quality characterization of different parts of broiler and Ligor hybrid chickens. Foods 2022, 11, 1929. [Google Scholar] [CrossRef]
- Katemala, S.; Molee, A.; Thumanu, K.; Yongsawatdigul, J. Meat quality and Raman spectroscopic characterization of Korat hybrid chicken obtained from various rearing periods. Poult. Sci. 2021, 100, 1248–1261. [Google Scholar] [CrossRef] [PubMed]
- Jaturasitha, S.; Chaiwang, N.; Kreuzer, M. Thai native chicken meat: An option to meet the demands for specific meat quality by certain groups of consumers: A review. Anim. Prod. Sci. 2017, 57, 1582–1587. [Google Scholar] [CrossRef]
- Maliwan, P.; Khempaka, S.; Molee, W. Evaluation of various feeding programmes on growth performance, carcass and meat qualities of Thai indigenous crossbred chickens. S. Afr. J. Anim. Sci. 2017, 47, 16–25. [Google Scholar] [CrossRef]
- Katemala, S.; Molee, A.; Thumanu, K.; Yongsawatdigul, J. A comparative study of meat quality and vibrational spectroscopic properties of different chicken breeds. Poult. Sci. 2022, 101, 101829. [Google Scholar] [CrossRef] [PubMed]
- Sharma, S.; Pathak, V.; Singh, V.P.; Awasthi, M.; Bharti, S. Comparative quality assessment of meat nuggets prepared from meat of different food animals. Int. J. Livest. Res. 2018, 8, 139–148. [Google Scholar] [CrossRef]
- Sun, X.; You, J.; Xu, L.; Zhou, D.; Cai, H.; Maynard, C.J.; Caldas-Cueva, J.P. Quality properties of chicken meatballs prepared with varying proportions of woody breast meat. J. Food Sci. Technol. 2022, 59, 666–676. [Google Scholar] [CrossRef] [PubMed]
- Petracci, M.; Bianchi, M.; Mudalal, S.; Cavani, C. Functional ingredients for poultry meat products. Trends Food Sci. Technol. 2013, 33, 27–39. [Google Scholar] [CrossRef]
- Saleem, R.; Hasnain, A.U.; Ahmad, R. Changes in some biochemical indices of stability of broiler chicken actomyosin at different levels of sodium bicarbonate in presence and absence of sodium chloride. Int. J. Food Prop. 2015, 18, 1373–1384. [Google Scholar] [CrossRef]
- Bonoli, M.; Caboni, M.; Rodriguezestrada, M.; Lercker, G. Effect of feeding fat sources on the quality and composition of lipids of precooked ready-to-eat fried chicken patties. Food Chem. 2007, 101, 1327–1337. [Google Scholar] [CrossRef]
- Barbut, S.; Leishman, E.M. Quality and processability of modern poultry meat. Animals 2022, 12, 2766. [Google Scholar] [CrossRef]
- Sun, X.D.; Holley, R.A. Factors influencing gel formation by myofibrillar proteins in muscle foods. Compr. Rev. Food Sci. Food Saf. 2011, 10, 33–51. [Google Scholar] [CrossRef]
- Panpipat, W.; Chaijan, M. Biochemical and physicochemical characteristics of protein isolates from bigeye snapper (Priacanthus tayenus) head by-product using pH shift method. Turk. J. Fish. Aquat. Sci. 2016, 16, 41–50. [Google Scholar]
- Balange, A.K.; Benjakul, S. Cross-linking activity of oxidized tannic acid towards mackerel muscle proteins as affected by protein types and setting temperatures. Food Chem. 2010, 120, 268–277. [Google Scholar] [CrossRef]
- Fiske, C.H.; Subbarow, Y. The colorimetric determination of phosphorus. J. Biol. Chem. 1925, 66, 375–400. [Google Scholar] [CrossRef]
- Panpipat, W.; Chaijan, M. Effect of atmospheric pressure cold plasma on biophysical properties and aggregation of natural actomyosin from threadfin bream (Nemipterus bleekeri). Food Bioprocess Technol. 2020, 13, 851–859. [Google Scholar] [CrossRef]
- Somjid, P.; Panpipat, W.; Cheong, L.Z.; Chaijan, M. Reduced washing cycle for sustainable mackerel (Rastrelliger kanagurta) surimi production: Evaluation of bio-physico-chemical, rheological, and gel-forming properties. Foods 2021, 10, 2717. [Google Scholar] [CrossRef] [PubMed]
- Chumthong, K.; Saelee, N.; Panpipat, W.; Panya, A.; Phonsatta, N.; Thangvichien, S.; Mala-In, W.; Grossmann, L.; Chaijan, M. Utilizing the pH-Shift Method for Isolation and Nutritional Characterization of Mantis Shrimp (Oratosquilla nepa) Protein: A Strategy for Developing Value-Added Ingredients. Foods 2024, 13, 2312. [Google Scholar] [CrossRef] [PubMed]
- Lowry, O.; Rosebrough, N.; Farr, A.L.; Randall, R. Protein measurement with the Folin phenol reagent. J. Biol. Chem. 1951, 193, 265–275. [Google Scholar] [CrossRef]
- Panpipat, W.; Chaijan, M. Physicochemical and techno-functional properties of acid-aided pH-shifted protein isolate from over-salted duck egg (Anas platyrhucus) albumen. Int. J. Food Sci. Tech. 2020, 55, 2619–2629. [Google Scholar] [CrossRef]
- Li, K.; Chen, L.; Zhao, Y.-Y.; Li, Y.-P.; Wu, N.; Sun, H.; Xu, X.-L.; Zhou, G.-H. A comparative study of chemical composition, color, and thermal gelling properties of normal and PSE-like chicken breast meat. CyTA—J. Food 2014, 13, 213–219. [Google Scholar] [CrossRef]
- Buege, J.A.; Aust, S.D. Microsomal lipid peroxidation. Methods Enzymol. 1978, 52, 302–310. [Google Scholar]
- Le Bihan-Duval, E.; Debut, M.; Berri, C.M.; Sellier, N.; Santé-Lhoutellier, V.; Jégo, Y.; Beaumont, C. Chicken meat quality: Genetic variability and relationship with growth and muscle characteristics. BMC Genet. 2008, 9, 53. [Google Scholar] [CrossRef]
- Alnahhas, N.; Berri, C.; Boulay, M.; Baéza, E.; Jégo, Y.; Baumard, Y.; Chabault, M.; Le Bihan-Duval, E. Selecting broiler chickens for ultimate pH of breast muscle: Analysis of divergent selection experiment and phenotypic consequences on meat quality, growth, and body composition traits. J. Anim. Sci. 2014, 92, 3816–3824. [Google Scholar] [CrossRef]
- Hammemi, C.; Askri, A.; Létourneau-Montminy, M.P.; Alnahhas, N. Current state of breast meat quality in standard-yielding broiler strains. J. Appl. Poult. Res. 2024, 33, 100383. [Google Scholar] [CrossRef]
- Wattanachant, S.; Benjakul, S.; Ledward, D.A. Composition, color, and texture of Thai indigenous and broiler chicken muscles. Poult. Sci. 2004, 83, 123–128. [Google Scholar] [CrossRef]
- Díaz, O.; Rodríguez, L.; Torres, A.; Cobos, A. Chemical composition and physico-chemical properties of meat from capons as affected by breed and age. Span. J. Agric. Res. 2010, 8, 91–99. [Google Scholar] [CrossRef]
- Zhang, L.; Barbut, S. Rheological characteristics of fresh and frozen PSE, normal and DFD chicken breast meat. Br. Poult. Sci. 2005, 46, 687–693. [Google Scholar] [CrossRef] [PubMed]
- Brewer, V.B.; Kuttappan, V.A.; Emmert, J.L.; Meullenet, J.F.; Owens, C.M. Big-bird programs: Effect of strain, sex, and debone time on meat quality of broilers. Poult. Sci. 2012, 91, 248–254. [Google Scholar] [CrossRef]
- Maynard, C.J.; Jackson, A.R.; Caldas-Cueva, J.P.; Mauromoustakos, A.; Kidd, M.T.; Rochell, S.J.; Owens, C.M. Meat quality attributes of male and female broilers from 4 commercial strains processed for 2 market programs. Poult. Sci. 2023, 102, 102570. [Google Scholar] [CrossRef] [PubMed]
- Wei, Q.; Cui, H.; Hu, Y.; Li, J.; Yue, S.; Tang, C.; Zhao, Q.; Yu, Y.; Li, H.; Qin, Y.; et al. Comparative characterization of Taihe silky chicken and Cobb chicken using LC/MS-based lipidomics and GC/MS-based volatilomics. LWT 2022, 163, 113554. [Google Scholar] [CrossRef]
- Fanatico, A.C.; Pillai, P.B.; Emmert, J.L.; Owens, C.M. Meat quality of slow- and fast-growing chicken genotypes fed low-nutrient or standard diets and raised indoors or with outdoor access. Poult. Sci. 2007, 86, 2245–2255. [Google Scholar] [CrossRef]
- Zhang, M.; Li, F.; Diao, X.; Kong, B.; Xia, X. Moisture migration, microstructure damage and protein structure changes in porcine longissimus muscle as influenced by multiple freeze-thaw cycles. Meat Sci. 2017, 133, 10–18. [Google Scholar] [CrossRef]
- Wang, Y.; Zhou, X.; Liu, M.; Zang, H.; Zhang, R.; Yang, H.; Jin, S.; Qi, X.; Shan, A.; Feng, X. Quality of chicken breast meat improved by dietary pterostilbene referring to up-regulated antioxidant capacity and enhanced protein structure. Food Chem. 2023, 405, 134848. [Google Scholar] [CrossRef]
- Xu, D.; Wang, Y.; Jiao, N.; Qiu, K.; Zhang, X.; Wang, L.; Wang, L.; Yin, J. The coordination of dietary valine and isoleucine on water holding capacity, pH value and protein solubility of fresh meat in finishing pigs. Meat Sci. 2020, 163, 108074. [Google Scholar] [CrossRef]
- Wang, B.; Kong, B.; Li, F.; Liu, Q.; Zhang, H.; Xia, X. Changes in the thermal stability and structure of protein from porcine longissimus dorsi induced by different thawing methods. Food Chem. 2020, 316, 126–375. [Google Scholar] [CrossRef] [PubMed]
- Liu, G.; Xiong, Y.L. Gelation of chicken muscle myofibrillar proteins treated with protease inhibitors and phosphates. J. Agric. Food Chem. 1997, 45, 3437–3442. [Google Scholar] [CrossRef]
- Cofrades, S.; Bañon, S.; Carballo, J.; Colmenero, F.J. Role of cathepsin D activity in gelation of chicken meat heated under pressure. Food Chem. 2003, 80, 241–247. [Google Scholar] [CrossRef]
- Zhang, Z.; Yang, Y.; Tang, X.; Chen, Y.; You, Y. Chemical forces and water holding capacity study of heat-induced myofibrillar protein gel as affected by high pressure. Food Chem. 2015, 188, 111–118. [Google Scholar] [CrossRef] [PubMed]
- Chen, X.; Chen, C.-g.; Zhou, Y.-z.; Li, P.-j.; Ma, F.; Nishiumi, T.; Suzuki, A. Effects of high-pressure processing on the thermal gelling properties of chicken breast myosin containing κ-carrageenan. Food Hydrocoll. 2014, 40, 262–272. [Google Scholar] [CrossRef]
- Lei, Z.; Fu, Y.; Zheng, Y.; Xu, P.; Zhou, C. Effects of l-lysine on thermal gelation properties of chicken breast actomyosin. Food Sci. Biotechnol. 2017, 26, 549–556. [Google Scholar] [CrossRef]
- Li, K.; Liu, J.Y.; Fu, L.; Zhao, Y.Y.; Bai, Y.H. Comparative study of thermal gelation properties and molecular forces of actomyosin extracted from normal and pale, soft and exudative-like chicken breast meat. Asian-Australas. J. Anim. Sci. 2019, 32, 721–733. [Google Scholar] [CrossRef]
- Tolano-Villaverde, I.J.; Torres-Arreola, W.; Ocaño-Higuera, V.M.; Marquez-Rios, E. Thermal gelation of myofibrillar proteins from aquatic organisms. CyTA-J. Food 2016, 14, 502–508. [Google Scholar] [CrossRef]
- Kim, Y.; Park, J.A.E.; Choi, Y. New approaches for the effective recovery of fish proteins and their physicochemical characteristics. Fish. Sci. 2003, 69, 1231–1239. [Google Scholar] [CrossRef]
- Huang, Y.; Guo, L.; Xiong, S.; Li, A. Property and structure changes of myofibril protein in pork treated by high pressure combined with heat. Food Sci. Technol. Int. 2016, 22, 647–662. [Google Scholar] [CrossRef] [PubMed]
- Benjakul, S.; Bauer, F. Biochemical and physicochemical changes in catfish (Silurus glanis Linne) muscle as influenced by different freeze–thaw cycles. Food Chem. 2001, 72, 207–217. [Google Scholar] [CrossRef]
- Ko, W.-C.; Yu, C.-C.; Hsu, K.-C. Changes in conformation and sulfhydryl groups of tilapia actomyosin by thermal treatment. LWT—Food Sci. Technol. 2007, 40, 1316–1320. [Google Scholar] [CrossRef]
- Yongsawatdigul, J.; Park, J.W. Thermal denaturation and aggregation of threadfin bream actomyosin. Food Chem. 2003, 83, 409–416. [Google Scholar] [CrossRef]
- You, J.; Pan, J.; Shen, H.; Luo, Y. Changes in physicochemical properties of bighead carp (Aristichthys mobilis) actomyosin by thermal treatment. Int. J. Food Prop. 2012, 15, 1276–1285. [Google Scholar] [CrossRef]
- Cardamone, M.; Puri, N. Spectrofluorimetric assessment of the surface hydrophobicity of proteins. Biochem. J. 1992, 282, 589–593. [Google Scholar] [CrossRef]
- Alizadeh-Pasdar, N.; Li-Chan, E.C. Comparison of protein surface hydrophobicity measured at various pH values using three different fluorescent probes. J. Agric. Food Chem. 2000, 48, 328–334. [Google Scholar] [CrossRef] [PubMed]
- Tornberg, E. Effects of heat on meat proteins—Implications on structure and quality of meat products. Meat Sci. 2005, 70, 493–508. [Google Scholar] [CrossRef] [PubMed]
- Chelh, I.; Gatellier, P.; Sante-Lhoutellier, V. Technical note: A simplified procedure for myofibril hydrophobicity determination. Meat Sci. 2006, 74, 681–683. [Google Scholar] [CrossRef] [PubMed]
- Mitra, B.; Rinnan, A.; Ruiz-Carrascal, J. Tracking hydrophobic state, aggregation behavior and structural modifications of pork proteins under the influence of assorted heat treatments. Food Res. Int. 2017, 101, 266–273. [Google Scholar] [CrossRef]
- Zheng, H.; Han, M.; Bai, Y.; Xu, X.; Zhou, G. Combination of high pressure and heat on the gelation of chicken myofibrillar proteins. Innov. Food Sci. Emerg. Technol. 2019, 52, 122–130. [Google Scholar] [CrossRef]
- Liu, H.; Gao, L.; Ren, Y.; Zhao, Q. Chemical interactions and protein conformation changes during silver carp (Hypophthalmichthys molitrix) surimi gel formation. Int. J. Food Prop. 2014, 17, 1702–1713. [Google Scholar] [CrossRef]
- Chaijan, M.; Srirattanachot, K.; Panpipat, W. Biochemical property and gel-forming ability of surimi-like material from goat meat. Int. J. Food Sci. Technol. 2020, 56, 988–998. [Google Scholar] [CrossRef]
- Jiang, Y.R.; Yoshida, A.; Sun, X.M.; Higashitani, H.; Yamada, K.; Miyazaki, R.; Noguchi, E.; Kuwahara, K.; Osatomi, K. Identification of a tissue inhibitor of metalloproteinase-2: An endogenous inhibitor of modori-inducing insoluble metalloproteinase from Yellowtail Seriola quinqueradiata muscle. J. Agric. Food Chem. 2023, 71, 3414–3423. [Google Scholar] [CrossRef]
- Wongwichian, C.; Chaijan, M.; Panpipat, W.; Klomklao, S.; Benjakul, S. Autolysis and characterization of sarcoplasmic and myofibril associated proteinases of oxeye scad (Selar boops) muscle. J. Aquat. Food Product. Technol. 2016, 25, 1132–1143. [Google Scholar] [CrossRef]
- Zhang, Y.; Kim, Y.H.B.; Puolanne, E.; Ertbjerg, P. Role of freezing-induced myofibrillar protein denaturation in the generation of thaw loss: A review. Meat Sci. 2022, 190, 108841. [Google Scholar] [CrossRef] [PubMed]
- Van Laack, R.L.J.M.; Lane, J.L. Denaturation of myofibrillar proteins from chickens as affected by pH, temperature, and adenosine triphosphate concentration. Poult. Sci. 2000, 79, 105–109. [Google Scholar] [CrossRef] [PubMed]
- Pighin, D.G.; Sancho, A.M.; Gonzalez, C.B. Effect of salt addition on the thermal behavior of proteins of bovine meat from Argentina. Meat Sci. 2008, 79, 549–556. [Google Scholar] [CrossRef]
- Antonov, Y.A.; Zhuravleva, I.L. Complexation of lysozyme with lambda carrageenan: Complex characterization and protein stability. Food Hydrocoll. 2019, 87, 519–529. [Google Scholar] [CrossRef]
- Lee, J.; Choi, M.J.; Xiong, Y.L. Comparative effects of micro vs. submicron emulsions on textural properties of myofibrillar protein composite gels. Food Struct. 2023, 38, 100353. [Google Scholar]
- Chanted, J.; Panpipat, W.; Cheong, L.Z.; Chaijan, M. Recovery of functional proteins from pig brain using pH-shift processes. Foods 2022, 11, 695. [Google Scholar] [CrossRef]
- Lamsal, B.P.; Jung, S.; Johnson, L.A. Rheological properties of soy protein hydrolysates obtained from limited enzymatic hydrolysis. LWT—Food Sci. Technol. 2007, 40, 1215–1223. [Google Scholar] [CrossRef]
- Xiong, Y.L.; Blanchard, S.P. Myofibrillar protein gelation: Viscoelastic changes related to heating procedures. J. Food Sci. 1994, 59, 734–738. [Google Scholar] [CrossRef]
- Abril, B.; Bou, R.; García-Pérez, J.V.; Benedito, J. Role of enzymatic reactions in meat processing and use of emerging technologies for process intensification. Foods 2023, 12, 1940. [Google Scholar] [CrossRef] [PubMed]
- Hamann, D.D.; Amato, P.M.; Wu, M.C.; Foegeding, E.A. Inhibition of modori (gel weakening) in surimi by plasma hydrolysate and egg white. J. Food Sci. 1990, 55, 665–669. [Google Scholar] [CrossRef]
- Draper, A.M.; Zeece, M.G. Thermal stability of cathepsin D. J. Food Sci. 1989, 54, 1651–1652. [Google Scholar] [CrossRef]
- Rico, E.; Toldrá, F.; Flores, J. Assay of cathepsin D activity in fresh pork muscle and dry-cured ham. Meat Sci. 1991, 29, 287–293. [Google Scholar] [CrossRef] [PubMed]
- Van Jaarsveld, F.P.; Naudé, R.J.; Oelofsen, W. Optimization of calcium-dependent protease and cathepsin D assays in ostrich muscle and the effect of chemical and physical dry-curing parameters. Meat Sci. 1997, 47, 287–299. [Google Scholar] [CrossRef] [PubMed]
- Toldrá, F.; Aristoy, M.C.; Part, C.; Cerveró, C.; Rico, E.; Motilva, M.J.; Flores, J. Muscle and adipose tissue aminopeptidase activities in raw and dry-cured ham. J. Food Sci. 1992, 57, 816–818. [Google Scholar] [CrossRef]
- Spanier, A.M.; McMillin, K.W.; Miller, J.A. Enzyme activity levels in beef: Effect of postmortem aging and end-point cooking temperature. J. Food Sci. 1990, 55, 318–322. [Google Scholar] [CrossRef]
- Smyth, A.B.; O’neill, E. Heat-induced gelation properties of surimi from mechanically separated chicken. J. Food Sci. 1997, 62, 326–330. [Google Scholar] [CrossRef]
- Miller, D.K.; Acevedo, N.C.; Lonergan, S.M.; Sebranek, J.G.; Tarte, R. Rheological characteristics of mechanically separated chicken and chicken breast trim myofibril solutions during thermal gelation. Food Chem. 2020, 307, 125557. [Google Scholar] [CrossRef] [PubMed]
- Leelapunnawut, S.; Ngamwonglumlert, L.; Devahastin, S.; Derossi, A.; Caporizzi, R.; Chiewchan, N. Effects of texture modifiers on physicochemical properties of 3D-printed meat mimics from pea protein isolate-alginate gel mixture. Foods 2022, 11, 3947. [Google Scholar] [CrossRef] [PubMed]
- Xu, L.; Lv, Y.; Su, Y.; Chang, C.; Gu, L.; Yang, Y.; Li, J. Enhancing gelling properties of high internal phase emulsion-filled chicken gels: Effect of droplet fractions and salts. Food Chem. 2022, 367, 130663. [Google Scholar] [CrossRef]
- Iwasaki, T.; Masuda, Y.; Hasegawa, Y.; Maeda, N. Effect of actomyosin form extracted from skeletal fast muscle on the structural and rheological properties of heat-induced gels. Food Struct. 2018, 15, 1–8. [Google Scholar] [CrossRef]
- Buamard, N.; Singh, A.; Zhang, B.; Hong, H.; Singh, P.; Benjakul, S. Ethanolic extract of Duea Ching fruit: Extraction, characterization and its effect on the properties and storage stability of sardine surimi gel. Foods 2023, 12, 1635. [Google Scholar] [CrossRef]
- Riquelme, N.; Savignones, C.; López, A.; Zúñiga, R.N.; Arancibia, C. Effect of gelling agent type on the physical properties of nanoemulsion-based gels. Colloids Interfaces 2023, 7, 49. [Google Scholar] [CrossRef]
- Wang, K.; Li, Y.; Zhang, Y.; Luo, X.; Sun, J. Improving myofibrillar proteins solubility and thermostability in low-ionic strength solution: A review. Meat Sci. 2022, 189, 108822. [Google Scholar] [CrossRef]
- Lesiow, T.; Xiong, Y.L. Chicken muscle homogenate gelation properties: Effect of pH and muscle fiber type. Meat Sci. 2003, 64, 399–403. [Google Scholar] [CrossRef] [PubMed]
- Jo, H.G.; Chilakala, R.; Kim, M.J.; Sin, Y.S.; Lee, K.S.; Cheong, S.H. Assessment of the effects of salt and Salicornia herbacea L. on physiochemical, nutritional, and quality parameters for extending the shelf-life of semi-dried mullets (Chelon haematocheilus). Foods 2022, 11, 597. [Google Scholar] [CrossRef] [PubMed]
- Domínguez, R.; Pateiro, M.; Gagaoua, M.; Barba, F.J.; Zhang, W.; Lorenzo, J.M. A comprehensive review on lipid oxidation in meat and meat products. Antioxidants 2019, 8, 429. [Google Scholar] [CrossRef]

| Parameters | Ligor Chicken Meat | Broiler Chicken Meat | p-Value |
|---|---|---|---|
| pH | 5.91 ± 0.09 b | 6.09 ± 0.04 a | 0.028 |
| Ca2+-ATPase activity (µmol/mg protein/min) | 0.29 ± 0.14 b | 0.51 ± 0.24 a | 0.022 |
| Reactive sulfhydryl (SH) content (mol/108 g protein) | 2.66 ± 1.88 a | 2.87 ± 1.75 a | 0.227 |
| Hydrophobicity (BPB bound; µg) | 121.21 ± 1.56 a | 82.58 ± 6.27 b | 0.000 |
| TCA-soluble peptide (µmol tyrosine/g) | 5.03 ± 1.77 b | 7.71 ± 3.75 a | 0.001 |
| Parameters | Ligor Chicken Meat | Broiler Chicken Meat | p-Value |
|---|---|---|---|
| Appearance | 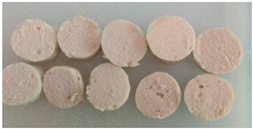 | 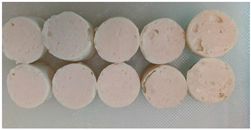 | - |
| TPA * | |||
| Hardness (N) | 9.81 ± 1.16 a | 5.87 ± 0.38 b | 0.013 |
| Springiness (cm) | 0.11 ± 0.05 a | 0.10 ± 0.04 a | 0.887 |
| Cohesiveness | 0.39 ± 0.08 a | 0.35 ± 0.02 b | 0.016 |
| Gumminess (N) | 3.83 ± 1.27 a | 2.02 ± 0.19 b | 0.027 |
| Chewiness (N.cm) | 39.44 ± 16.64 a | 20.37 ± 2.75 b | 0.004 |
| Expressible moisture content (%) | 5.77 ± 2.64 a | 3.85 ± 0.12 b | 0.005 |
| pH | 5.97 ± 0.01 b | 6.14 ± 0.01 a | 0.002 |
| Whiteness | 55.33 ± 0.92 b | 57.57 ± 0.27 a | 0.008 |
| TBARS (mg MDA equivalent/kg) ** | |||
| Day 0 | 0.75 ± 0.03 a | 0.78 ± 0.02 a | 0.096 |
| Day 4 | 1.07 ± 0.05 b | 1.19 ± 0.02 a | 0.011 |
| Day 8 | 1.15 ± 0.04 b | 1.23 ± 0.04 a | 0.043 |
Disclaimer/Publisher’s Note: The statements, opinions and data contained in all publications are solely those of the individual author(s) and contributor(s) and not of MDPI and/or the editor(s). MDPI and/or the editor(s) disclaim responsibility for any injury to people or property resulting from any ideas, methods, instructions or products referred to in the content. |
© 2024 by the authors. Licensee MDPI, Basel, Switzerland. This article is an open access article distributed under the terms and conditions of the Creative Commons Attribution (CC BY) license (https://creativecommons.org/licenses/by/4.0/).
Share and Cite
Mussa, N.J.; Wongnen, C.; Kitpipit, W.; Panpipat, W.; Yin, M.; Kim, S.R.; Chaijan, M. Comparative Analysis of Biochemical Parameters, Thermal Behavior, Rheological Features, and Gelling Characteristics of Thai Ligor Hybrid Chicken and Broiler Meats. Foods 2025, 14, 55. https://doi.org/10.3390/foods14010055
Mussa NJ, Wongnen C, Kitpipit W, Panpipat W, Yin M, Kim SR, Chaijan M. Comparative Analysis of Biochemical Parameters, Thermal Behavior, Rheological Features, and Gelling Characteristics of Thai Ligor Hybrid Chicken and Broiler Meats. Foods. 2025; 14(1):55. https://doi.org/10.3390/foods14010055
Chicago/Turabian StyleMussa, Ngassa Julius, Chantira Wongnen, Warangkana Kitpipit, Worawan Panpipat, Mingyu Yin, Siriporn Riebroy Kim, and Manat Chaijan. 2025. "Comparative Analysis of Biochemical Parameters, Thermal Behavior, Rheological Features, and Gelling Characteristics of Thai Ligor Hybrid Chicken and Broiler Meats" Foods 14, no. 1: 55. https://doi.org/10.3390/foods14010055
APA StyleMussa, N. J., Wongnen, C., Kitpipit, W., Panpipat, W., Yin, M., Kim, S. R., & Chaijan, M. (2025). Comparative Analysis of Biochemical Parameters, Thermal Behavior, Rheological Features, and Gelling Characteristics of Thai Ligor Hybrid Chicken and Broiler Meats. Foods, 14(1), 55. https://doi.org/10.3390/foods14010055