Article

Development of a Simultaneous Normal-Phase HPLC Analysis of Lignans, Tocopherols, Phytosterols, and Squalene in Sesame Oil Samples

by
Jitkunya Yuenyong
1,2,
Chonlada Bennett
1,3,
Sudarat Jiamyangyuen
4,
Sugunya Mahatheeranont
1,3,5,6 and
Phumon Sookwong
1,3,6,*
1
Rice and Cereal Chemistry Research Laboratory, Department of Chemistry, Faculty of Science, Chiang Mai University, Chiang Mai 50200, Thailand
2
The Graduate School, Chiang Mai University, Chiang Mai 50200, Thailand
3
Material Science Research Center, Faculty of Science, Chiang Mai University, Chiang Mai 50200, Thailand
4
Division of Food Science and Technology, Faculty of Agro-Industry, Chiang Mai University, Chiang Mai 50100, Thailand
5
Center of Excellence for Innovation in Chemistry, Faculty of Science, Chiang Mai University, Chiang Mai 50200, Thailand
6
The Functional Food Research Center for Well-Being, Multidisciplinary Research Institute, Chiang Mai University, Chiang Mai 50200, Thailand
*
Author to whom correspondence should be addressed.
Foods 2024, 13(9), 1368; https://doi.org/10.3390/foods13091368
Submission received: 2 April 2024 / Revised: 24 April 2024 / Accepted: 25 April 2024 / Published: 28 April 2024

Abstract

:
The objective of this study was to develop a simultaneous analytical method for the determination of lignans, tocols, phytosterols, and squalene using high-performance liquid chromatography coupled with a diode array and fluorescence detector (HPLC-DAD-FLD). The method employed a VertisepTM UPS silica HPLC column (4.6 × 250 mm, 5 µm) with a mobile phase mixture of n-hexane/tetrahydrofuran/2-propanol. This approach enabled the simultaneous analysis of ten compounds within 22 min. The linear correlation (R2) exceeded 0.9901. The limit of detection (LOD) and limit of quantitation (LOQ) were up to 0.43 µg mL−1 for lignans and tocopherols and up to 326.23 µg mL−1 for phytosterol and squalene. The precision and accuracy of the intra-day and inter-day variation were less than 1.09 and 3.32% relative standard deviations (RSDs). Furthermore, the developed method was applied for the analysis of targeted compounds in twenty-eight sesame oil samples (1775–8965 µg g−1 total lignans, 29.7–687.9 µg g−1 total tocopherols, 2640–9500 µg g−1 phytosterol, and 245–4030 µg g−1 squalene). The HPLC method that has been developed was proven to be a reliable and effective tool for the determination of those functional compounds among sesame oil samples.

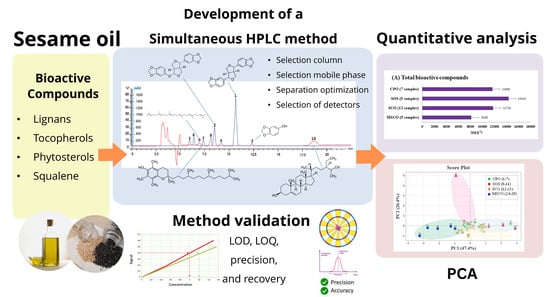
Graphical Abstract

1. Introduction

Sesamum indicum L., commonly known as sesame, is an annual herbaceous plant belonging to the Pedaliaceae family. The seeds come in a small, flat, oval shape, and exhibit a range of colors from white to black, which is contingent upon the particular cultivar. The sesame plant is one of the most important oilseed crops cultivated for essential dietary oils in Asian (such as China, Korea, Japan, Thailand, and India) and Western countries (such as France, Portugal, Spain, and Mexico) [1,2]. In general, cooking sesame oil is derived from solvent extraction with oil refining processes, involving filtering, bleaching, and deodorizing to remove impurities and enhance the stability of the oil. Refined sesame oil has a light color, mild flavor, and higher smoke point, making it suitable for cooking, frying, and salad dressings [3]. Another type of unrefined sesame oil, also known as virgin sesame oil or cold-pressed sesame oil (CPO), is the oil extracted from sesame seeds using mechanical pressing methods without any chemical refining. It retains more of the natural flavor, aroma, and nutrients of the sesame seeds, making it ideal for use in traditional cooking, flavoring, and medicinal applications [4]. Compared with other oils, sesame oil is highly valued in food products and medicinal and cosmetic applications due to its superior quality, rich functional compound content, unique flavor, and fragrance [5,6,7].
Key components in sesame oil are lignans, including sesamin, sesamolin, sesamol, and asarinin. These compounds have been reported to offer various health benefits such as lowering cholesterol levels through the inhibition of absorption and biosynthesis, as well as demonstrating antihypertensive and anticancer properties [8,9]. Sesame oil also contains other functional compounds including tocopherols, phytosterols, and squalene [5,6]. The oxidative stability of sesame oil is attributed to its antioxidant properties, particularly the tocopherol-sparing effects, hypotensive effects, and anti-aging effects. Among the different tocopherol isoforms, γ-tocopherol is the predominant tocopherol in sesame oil, with δ-tocopherol accounting for less than 5% of the total tocopherols and β-tocopherol being present in trace amounts [5]. Sesame oil is one of the richest oil sources of phytosterols containing as much as 1.9% of the total sterols, in which β-sitosterol is the most abundant sterol. Consumption of phytosterol may decrease cholesterol absorption in the intestine and lower serum low-density lipoprotein-cholesterol concentration, leading to anti-inflammatory benefits and the prevention of chronic disorders such as cardiovascular diseases and diabetes [10]. Several studies have indicated that squalene is an important dietary cancer chemopreventive agent [11,12]. The protective effects of squalene may be attributed to its capacity to enhance cellular antioxidant levels [13]. Therefore, to maximize the health advantages, it is necessary to conduct a quantitative and qualitative analysis of the functional compounds present in sesame oil.
HPLC is a chromatographic technique effective for the separation, identification, and quantification of individual components in complex mixtures depending on the type of stationary phase employed, mobile phase (solvent), stationary phase (column), sample injector, detector, and data acquisition system [14]. Until now, HPLC has enabled the separation and quantification of lignan groups from complex matrices such as seeds, grains, and plant extracts [15]. HPLC with ultraviolet (UV) or fluorescence detection allows for the precise determination of tocopherol isoforms (α, β, γ, δ) in various food and biological samples [16]. HPLC with a suitable detector (e.g., UV, evaporative light scattering) enables the separation and quantification of phytosterols in food products, dietary supplements, and biological samples [17]. Although the high capability of HPLC for the determination of each compound group was well documented, the development of a single HPLC system for the simultaneous determination of lignans, tocopherols, phytosterols, and squalene in a single run is still very challenging.
To the best of our knowledge, there has been no simultaneous analysis of lignans, tocopherols, phytosterols, and squalene in sesame oils that can quantify each compound accurately and precisely. This could potentially be achieved by selecting a suitable separation column, choosing an appropriate mobile phase, and combining the detection of suitable detectors for targeted compounds. For instance, Pokkanta et al., developed an HPLC method that utilized a hydrophobic phase column modified with pentafluorophenyl-propyl groups, along with fluorescence and diode array detectors, to simultaneously separate and quantify tocopherols, γ-oryzanols, phytosterols, squalene, cholecalciferol, and phylloquinone in vegetable oil [18]. Accordingly, this study had an objective to develop an HPLC method for the efficient separation and quantification of the targeted compounds in sesame oil samples, including lignans (sesamin, sesamolin, asarinin, sesamol), tocopherols (α-, β-, γ-, and δ-tocopherol), phytosterols, and squalene. After the HPLC method was developed, method validation was performed to certify the usability and effectiveness of the method, including linearity of the calibration curve, accuracy, limit of detection (LOD), limit of quantification (LOQ), and instrument precision. Subsequently, the developed method was applied for the determination of targeted compounds in twenty-eight different sesame oil samples.

2. Materials and Methods

2.1. Chemicals

Standard sesamin (PubChem CID: 72307, purity ≥ 98%) and sesamolin (PubChem CID: 101746, purity ≥ 98%) were purchased from Biopurity Phytochemicals Ltd. (Chengdu, China). Sesamol (PubChem CID: 68289, purity ≥ 97%) was purchased from Sigma Aldrich Corp., Ltd. (St. Louis, MO, USA). L-Asarinin (PubChem CID: 1869417, purity ≥ 98%) was purchased from Toronto Research Chemicals (TRC, North York, ON, Canada). Standard α-, β-, γ-, and δ-tocopherols (PubChem CID: 14985, 6857447, 92729, and 92094, respectively, purity ≥ 95%) were purchased from Eisai Food & Chemical Co., Ltd. (Tokyo, Japan). Standard phytosterols (PubChem CID: 87575667, purity ≥ 95%) and squalene (PubChem CID: 637072, purity ≥ 98%) were purchased from Tokyo Chemical Industry Co., Ltd. (Tokyo, Japan). HPLC-grade solvents including n-hexane (PubChem CID: 8058), tetrahydrofuran (PubChem CID: 8028), acetonitrile (PubChem CID: 6342), and 2-propanol (PubChem CID: 3776) were purchased from RCI Labscan Co., Ltd. (Bangkok, Thailand).

2.2. Sesame Oil Samples

Twenty-eight commercialized sesame oil samples were purchased from the local markets and the internet in Thailand. The oils were categorized into 4 groups, including cold-pressed sesame oil (CPO, 7 samples), sesame oil supplements (SOS, 4 samples), sesame cooking oil (SCO, 12 samples), and sesame cooking oil mixed with other oils (MSCO, 5 samples). The sesame oil products were manufactured in different countries including Thailand (16 samples), China (6 samples), Korea (2 samples), Singapore (2 samples), Japan (1 sample), and India (1 sample). Details of the sample oils (such as type of sesame, pre-treatment of sesame seeds, and composition of other vegetable oils) are described in Supplementary Table S1. The oils were stored below 4 °C in a refrigerator prior to analysis.

2.3. Sample Preparation

Sesame oil samples (0.010 g) were weighed into a 10 mL volumetric flask and diluted with n-hexane to make a final volume of 10.00 mL. The solution was filtered through a 0.45 µm syringe nylon filter before HPLC analysis.

2.4. HPLC-DAD-FLD Analysis

The HPLC system consisted of an Agilent HPLC 1100 connected to a diode array detector (DAD, model G1315 A, Agilent Technologies, Palo Alto, CA, USA) and a fluorescence detector (FLD, model 1046A, Hewlett Packard, Palo Alto, CA, USA). The separation column used a VertisepTM UPS silica HPLC column (4.6 × 250 mm, 5 µm, Vertical Chromatography Co., Ltd., Bangkok, Thailand). The mobile phase consisted of n-hexane, tetrahydrofuran, 2-propanol, and acetonitrile. The column temperature was set at 30 °C and the flow rate was 0.8 mL min−1. Lignans and tocopherols were detected in FLD with an excitation wavelength of 295 nm and an emission wavelength of 330 nm. DAD was used for the quantification of phytosterols and squalene at 210 nm. The concentrations of the targeted compounds were calculated with the calibration curve of their standards and the quantitative data were represented as µg g−1 of the sample.

2.5. Method Validation

The external standard method was used to obtain the standard curves using five to ten concentrations for each compound. The standard curves were validated to ensure the suitability of the curve for quantitative analysis. The parameters to be evaluated included linearity, LOD, LOQ, recovery, and precision (intra-day and inter-day). A correlation coefficient (R2) of more than 0.9900 was considered acceptable for accessing the linearity of the curves, indicating a very good fit of the standard curves to the data. The LOD and LOQ are the terminologies used for assessing the method’s ability to detect and quantify the lowest concentrations of analytes with acceptable accuracy and precision. These can be performed by measuring the signal (S) generated by the analyte at low concentrations and comparing it to the background noise (N) level. Signal-to-noise ratios (S/N) of 3 and 10 were set as criteria for LOD and LOQ, respectively. Precision was measured as the repeatability of the method by one operator using the same instrument on the same day for intra-day precision (6 replicates × 1 day) and on 3 separate days for inter-day precision (3 replicates × 3 days). The repeatability of the method was defined by the relative standard deviation (RSD) for each compound. To determine the accuracy (recovery), sesame oil samples (CPO-4) were spiked using a known concentration of standards. The recovery was quantified as a percentage of the spiked amount. The acceptance criteria for recoveries were 85–115%. The range represents a reasonable balance ensuring effective sample retrieval while accommodating possible losses or variation throughout the analytical procedure [19].

2.6. Statistical Analysis

Principal component analysis (PCA) is a statistical technique used to summarize and visualize large datasets. PCA modeling was achieved based on the algorithm where the collection of new variables created by PCA from original datasets was used to identify the primary and significant variation in the data [20]. According to a study by Brereton, R. G., the mathematical transformation of an original data matrix (X) using PCA can be described by the following equation.
X = TP + E
According to the equation, T is the score matrix, representing the relationship among the studied samples. P is the loading matrix, visualizing the behavior among the parameters. E is the residual matrix, containing the variation excluded from the analysis. On the PCA score plot, samples with similar score values appeared close to one another, demonstrating that they have a similarity or share a relationship within the dataset. Standardization scaling was applied to preprocess the data during analysis to ensure that the measured intensity of the variables was adjusted to the same scale [21]. All quantitative data were obtained in triplicates (n = 3) and expressed as the mean ± standard deviation. Statistical analysis used a one-way ANOVA with Minitab (version 21.4.1, trial version, Minitab LLC, State College, PA, USA). Significant differences were assessed by post-hoc Tukey’s test with the level of significance at 95% (p < 0.05).

3. Results

According to the literature, both reverse-phase (RP) and normal-phase (NP) HPLC columns have the potency to separate targeted compounds in sesame oils. A previous study using the RP-HPLC C18 column and gradient elution of methanol and water as the mobile phase separated sesamol, sesamin, sesamolin, α-tocopherol, γ-tocopherol, and δ-tocopherol, but not asarinin or β-tocopherol in sesame oil [22]. Another study by Yan et al. utilized the RP-HPLC C18 column, a mixture of methanol/water (90:10, v/v) as the mobile phase, and 290 nm ultraviolet/visible detection for the separation of functional compounds in sesame oil. The RP-HPLC method required a complicated pretreatment of oil samples such as saponification and extraction and could not completely separate β- and γ-tocopherols [23]. While the RP-HPLC-based method developed by Pokkanta et al. demonstrated the ability to separate various groups of functional compounds such as tocopherols, phytosterols, squalene, cholecalciferol, and phylloquinone [18], it was found to be unsuitable for separating lignan. In many cases, RP-HPLC analysis of lignan or tocopherol compounds needed approximately 30 min for a single run [22,23]. Achieving simultaneous determination of tocopherol and lignan in sesame oil is laborious and cost intensive [24]. On the other hand, NP-HPLC [25,26] requires simple pretreatment and has the capability to completely separate the four tocopherol isoforms (α-, β-, γ-, and δ-tocopherols) and lignans (sesamin, sesamolin, sesamol, and asarinin) in sesame oil. The method largely shortens the detection time and cost. Therefore, on the basis of these findings, this study aims to develop an NP-HPLC method for the separation of a wider spectrum of the bioactive compounds in sesame oils, including tocopherols and lignans with the addition of phytosterol and squalene. The method incorporated a simple pretreatment of the sample and a comparatively short analytical time.

3.1. Development of Simultaneous Determination of Lignans, Tocopherols, Phytosterols, and Squalene

In the present study, NP-HPLC was used for the simultaneous analysis of tocopherols, lignans, phytosterols, and squalene in sesame oil samples, employing a conventional silica column with a dimension of 4.6 × 250 mm (5 µm particle size). The mobile phases tested were various compositions of n-hexane/tetrahydrofuran/acetonitrile/2-propanol mixture with isocratic elution of 0.5 to 1.2 mL min−1. Some mobile phase ratios that showed effectiveness in the separation of the targeted compounds were as follows: condition A, a mixture of n-hexane/tetrahydrofuran/acetonitrile/2-propanol (93:6:0.5:0.5, v/v/v/v) using a flow rate of 0.8 mL min−1; condition B, a mixture of n-hexane/tetrahydrofuran/acetonitrile/2-propanol (92:6:1:1, v/v/v/v) using a flow rate of 0.5 mL min−1; condition C, a mixture of n-hexane/tetrahydrofuran/acetonitrile (93:6:1, v/v/v) using a flow rate of 1.2 of mL min−1, and condition D, a mixture of n-hexane/tetrahydrofuran/2-propanol (93:6:1, v/v/v) using a flow rate of 0.8 of mL min−1. Chromatograms derived from the four conditions are shown in Supplementary Figure S1. Considering condition A, four tocopherols were separated but peaks of sesamin and asarinin were co-eluted (Supplementary Figure S1A). In condition B, the separation time was extended to 25 min, with the peaks of sesamolin and δ-tocopherol overlapped, and the peaks of sesamin and asarinin inseparable (Supplementary Figure S1B). Separation with condition C could separate all compounds except for sesamin and asarinin (Supplementary Figure S1C). Consequently, separation with a mobile phase of n-hexane/tetrahydrofuran/2-propanol (condition D) could successfully separate all four tocopherols and four lignans within 15 min (FLD), and squalene as well as phytosterols (DAD) within 20 min (Supplementary Figure S1D). Therefore, condition D (n-hexane/tetrahydrofuran/2-propanol (93:6:1, v/v/v) using a flow rate of 0.8 of mL min−1 was chosen as the optimized separation condition for the simultaneous analysis of bioactive compounds in sesame oils. The elution order was α–tocopherol (6.31 min) > β–tocopherol (6.97 min) > squalene (7.38 min) > γ–tocopherol (7.52 min) > δ–tocopherol (8.44 min) > sesamolin (8.94 min) > asarinin (9.08 min) > sesamin (10.34 min) > sesamol (11.73 min) > phytosterol (18.17 min) (Figure 1). The developed method was used for the simultaneous determination and quantification of lignans, tocopherols, phytosterols, and squalene in twenty-eight sesame oil samples (Section 3.3).

3.2. Method Validation

The calibration equations, linearity assessment, intra-day and inter-day precisions, LOD, LOQ, and recovery are listed in Table 1 and Table 2.

3.2.1. Linearity, LOD, and LOQ

Linearity refers to the ability of an analytical method to produce results that are directly proportional to the concentration of the analyte within a specified range. The LOD and LOQ are the limits at which the lowest concentration can be reliably detected by the analytical method. In analytical procedures, the LOD and LOQ are based on the signal-to-noise ratio (S/N) of 3 and 10, respectively, in relation to the baseline noise. The LODs in FLD were 0.02–0.41 µg mL−1 for lignans and tocopherols, and 10.04–307.07 µg mL−1 for phytosterol and squalene in DAD. The LOQs were 0.04–0.43 µg mL−1 for lignans and tocopherols and 10.34–326.23 µg mL−1 for phytosterol and squalene with a correlation (R2) of more than 0.9901 (Table 1).

3.2.2. Precision and Accuracy

The precision and accuracy of the method were the relative standard deviations (RSDs) of the intra-day and inter-day variation of three different concentrations (Table 3). The RSDs of the intra-day and inter-day precision were less than 1.09% and 3.32% for lignans, 0.33% and 0.45% for tocopherols, 0.04% and 0.25% for phytosterol, and 0.22% and 0.46% for squalene, respectively. The results indicated that the precision and accuracy of the whole method were good.

3.2.3. Recovery

The recoveries of lignans, tocopherols, squalene, and phytosterol were measured using sesame oil samples spiked with three standard concentrations of analytes (Table 2). The spiked recoveries were 88.4–107.2% for lignans, 88.9–113.5% for tocopherols, 91.0–94.6% for phytosterol, and 99.7–104.7% for squalene, respectively. The RSDs of the intra-day and inter-day precisions were less than 2.50 and 3.74% for tocopherols, and 2.83 and 3.77% for lignans, respectively [25]. The recoveries of the analytes were 96.0–102.9% considering linearity assessment [18]. This range indicates the accuracy of the measurement method used to determine the presence and concentration of lignans, tocopherols, squalene, and phytosterols in sesame oil spiked with standard concentrations of these bioactive compounds. Achieving recoveries within this range is crucial for ensuring the reliability and precision of the analytical process when quantifying these essential components in sesame oil. The precision of the whole method was good since the RSDs of the intra-day and inter-day precisions obtained were less than 5%. This indicated that the method is suitable for the precise analysis of phytochemicals in sesame oil.

3.3. Analysis of Lignans, Tocopherols, Squalene, and Phytosterol in Sesame Oil Samples

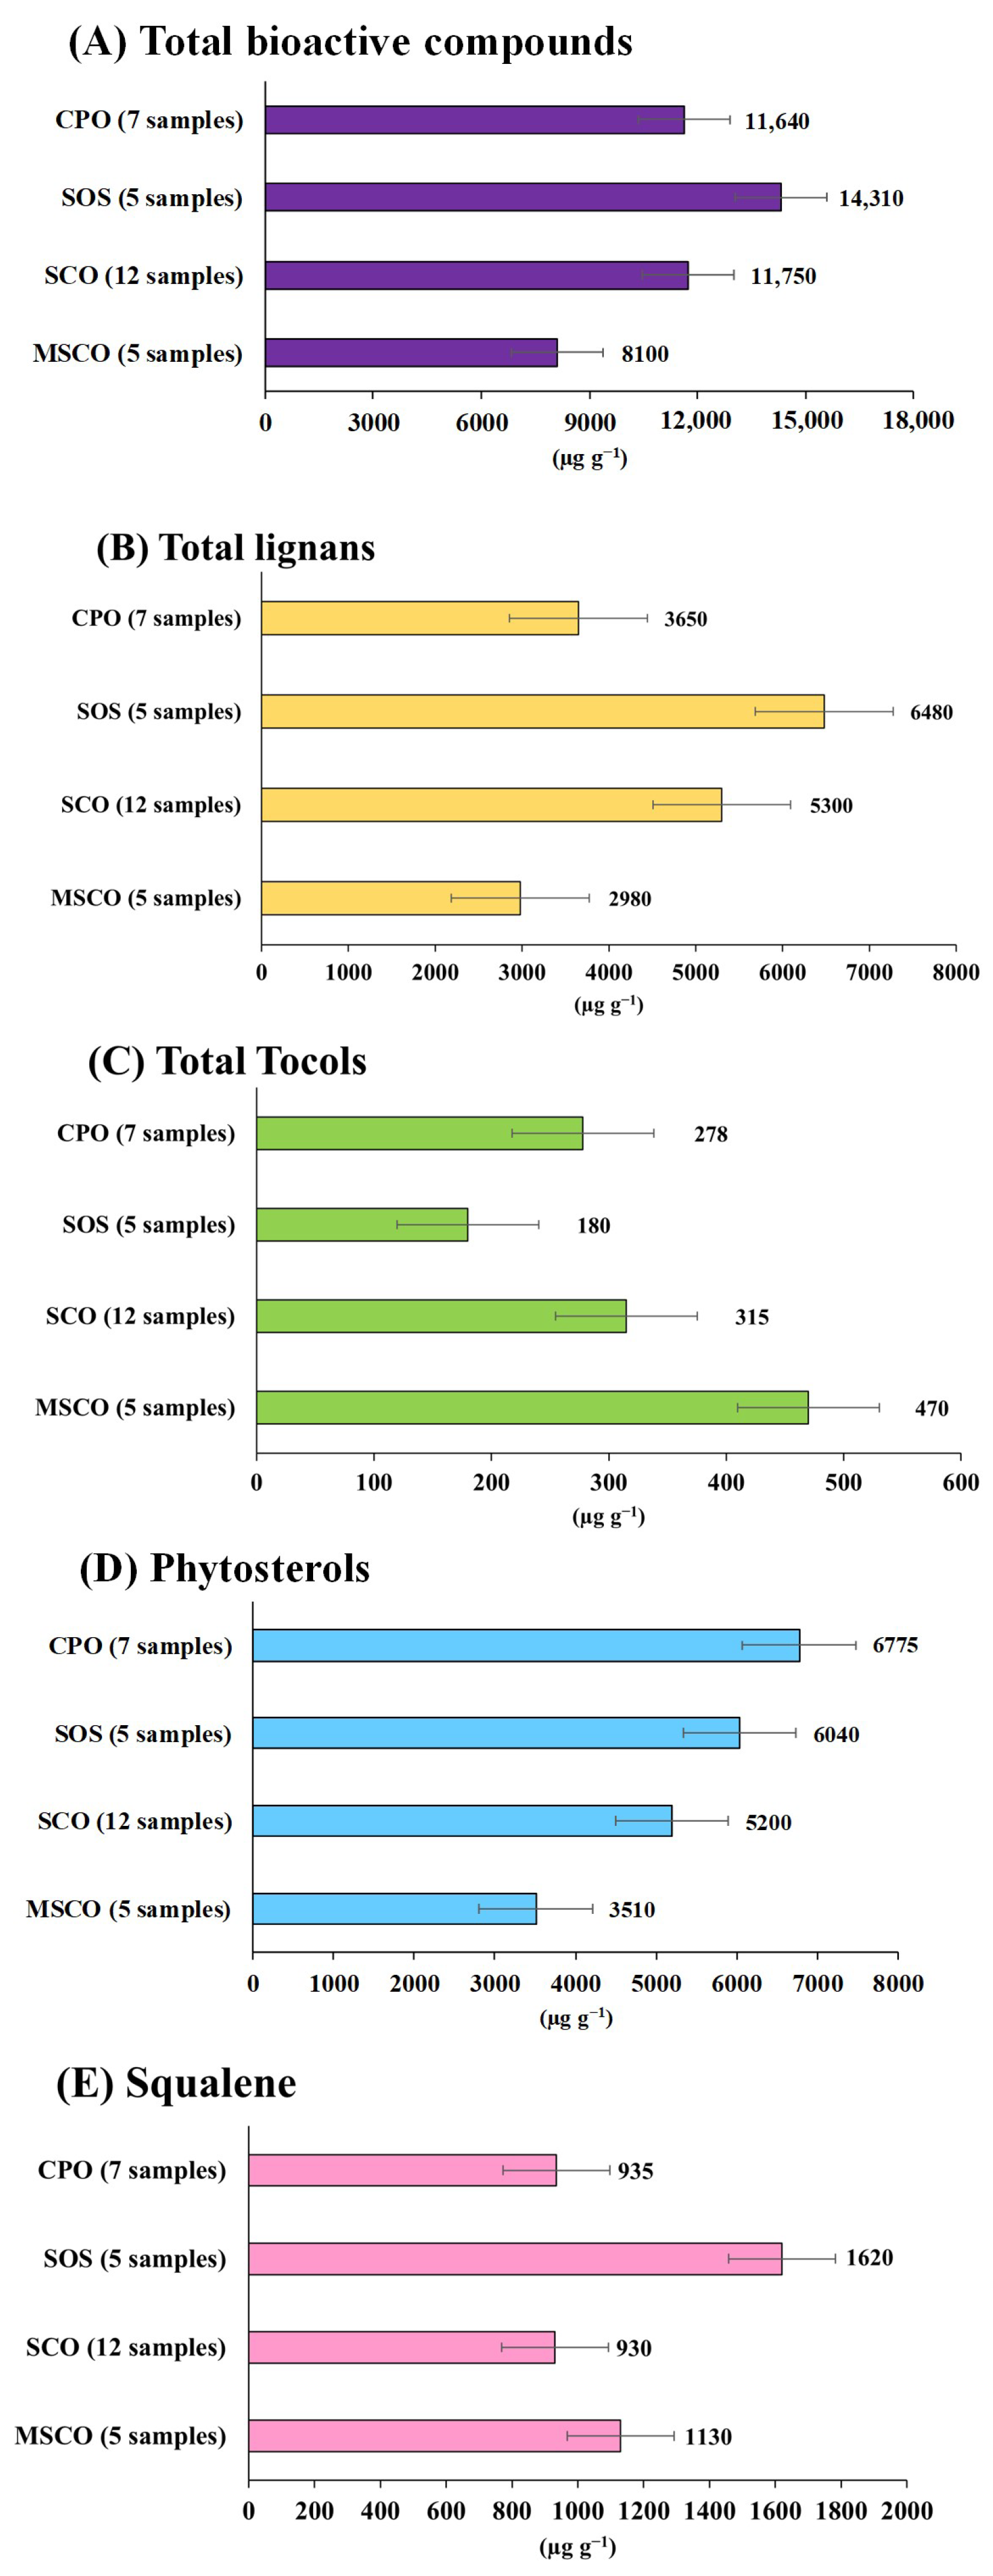
The quantification of functional compounds in twenty-eight sesame oil samples was performed and reported in Table 3 and Figure 2. It was found that the contents of the analytes in sesame oil samples were diversified depending on the type and variety of sesame oil, which have been categorized into 4 groups: cold-pressed sesame oil (CPO), sesame oil supplement (SOS), sesame cooking oil (SCO), and sesame cooking oil mixed with other oil (MSCO). Lignans were found in the range of 1775–8965 µg g−1, in which the average lignan content was 4644 µg g−1. The predominant lignans in sesame oil were sesamin (1210–4725 µg g−1) and sesamolin (420–4240 µg g−1), while sesamol and asarinin were found in relatively low amounts (non-detectable–121.5 µg g−1 for sesamol, and non-detectable–323.8 µg g−1 for asarinin). Regarding the category of sesame oil, SOS had the highest lignan content with an average of 6480 µg g−1. This would be partly due to its packaging, in which the oil was filled in a yellowish soft gel and packed in an opaque container for protection against photooxidation. Meanwhile, CPO samples had a lower content of lignans (average of 3650 µg g−1), which might be due to the clear glass bottle bearing lower protection against environmental light. On the other hand, asarinin and sesamol were observed only in groups of cooking oil (both SCO and MSCO). This was because the refining process of cooking oil involved the addition of acid with thermal processing leading to acidolysis, a process that can partially convert sesamin to asarinin and sesamolin to sesamol [27]. Our results were in accordance with other studies demonstrating that sesamin is the predominant lignan present in sesame oils. Liu et al. reported 633.38 µg g−1 of sesamin, with the total lignan content being 908.41 µg g−1 [28]. It has been demonstrated that the amount of sesamin is greatly diversified by the variety and cultivation conditions of sesame trees. For instance, a study by Kim et al. and Wang et al. reported a wide range of sesamin (1630–8450 µg g−1) [29,30], and sesamolin (200–4300 µg g−1) content in sesame seeds [31]. In our study, asarinin was observed only in cooking oil ranging from 18 to 323.8 µg g−1, while a study by Huang et al. found asarinin in sesame oil ranging from 12.5 to 664.8 µg g−1 [25].
Tocopherol contents in sesame oil samples were 29.7–687.9 µg g−1 (average of 314.0 µg g−1). γ-Tocopherol was the most abundant form, while β- and δ-tocopherol were almost absent. The MSCO samples appeared to have a greater amount of tocopherols (average of 470 µg g−1), while the content in CPO, SOS, and SCO were 278, 180, and 315 µg g−1, respectively. Greater tocopherol content in MSCO, including the presence of α, β, and δ-tocopherol, can be attributed in part to the addition of other oils like soybean oil. This is because soybean oil typically contains all four isoforms of tocopherol (α-, β-, γ-, and δ-tocopherols). This implied that sesame oil is not a favorable source of natural vitamin E compared with other vegetable oils. The observed tocopherol content (Table 3) was comparable with other studies. For instance, a study by Huang et al. found the total tocopherol content of sesame oil ranges from 330 to 1010 µg g−1 [25]. Williamson et al. reported a range of α-tocopherol around 0.034–0.175 µg g−1, δ-tocopherol at 0.44–3.05 µg g−1, and γ-Tocopherols at 56.9–99.3 µg g−1, respectively [32].
Phytosterol and squalene content was determined in a range of 2640–9500 µg g−1 and 245–4030 µg g−1, for phytosterol and squalene, respectively. Phytosterol tended to be more abundant in CPO and SOS than SCO and MSCO samples, implying that the preparation process of cooking oil may not be a good extraction process for sesame phytosterol. In contrast, squalene was found to be rather high in the MSCO group, suggesting that the addition of other oils could have increased the squalene content more than that of pure sesame oil. A report by Mohamed et al. showed the highest content (4000–4130 µg g−1) of phytosterol in sesame oil, in which β-sitosterol was the most abundant sterol (2317–3052 µg g−1) followed by campesterol and stigmasterol [33]. Squalene observed in black sesame oils was 572–1171 µg g−1, while white sesame oil was found at 607–2611 µg g−1 [18,34]. Furthermore, a comparison of the amounts of functional compounds in sesame oils derived from black sesame seeds and white sesame seeds was observed. Based on our result, there were no obvious differences in the amount of lignans, tocopherols, squalene, and phytosterol between the oils of sesame seeds. The higher popularity of black sesame products than white sesame products could be related to the higher content of minerals such as calcium, potassium, copper, iron, and manganese [35]. For example, the content of calcium and potassium in black sesame seeds was found at 2017.89 and 741.49 mg 100 g−1 and 985.54 and 630.66 mg100 g−1 in white sesame oil, respectively [36].
Furthermore, the bioactive compounds of roasted and non-roasted sesame seeds in sesame cooking oil (SCO group) were compared. Tocopherol contents in sesame oil from both roasted and non-roasted sesame seeds were quite indifferent (316 and 313 µg g−1, respectively). Roasting sesame seeds improved the extraction of lignans, as the lignan content in the oils was higher (5619 µg g−1) than that of the oil from non-roasted seeds (4791 µg g−1). In addition, by roasting sesame seeds before oil extraction, squalene contents were decreased (887 and 1000 µg g−1 for roasted and non-roasted, respectively), and phytosterol contents were increased (5370 and 4835 µg g−1 for roasted and non-roasted, respectively).

3.4. Statistical Analysis of Principal Component Analysis (PCA)

The PCA score plot (Figure 3) showed the sample labels based on the categories of the oil samples. Sesame oil samples from the same categories were found to be similar to each other. For instance, almost all of the MSCO samples tended to be located on the left side of the score plot as the samples in this category had the highest amount of total tocols (470 µg g−1), with the sample coded 26 having the highest γ-tocopherol of 529.7 µg g−1. On the right side of the score plot, there are clusters of oil that had high contents of lignan and phytosterol, especially in the category of SOS. The sample coded 10 at the far-right side of the sample distribution had a very high content of phytosterol and lignan. However, the CPO coded 6 was scattered outside the main cluster, located in the middle of the score plot. This demonstrated that the sample had the highest phytosterol content among all the samples. Meanwhile, the sample (coded 8) in the SOS category located in the upper part of the score plot exhibited the highest content of squalene. A dense cluster in the middle area of the PCA space were plots of samples of CPO and SCO. Samples in these two categories had a low dispersion because they contained similar amounts of bioactive compounds. The oils from these two groups contained a high composition of sesamin and sesamolin. Among these two groups, coded 18 (belonging to SCO), located at the mid-low area of the PCA space, contained the highest amount of sesamin. The PCA plot suggested a similarity for the analyzed samples as well as highlighting the dissimilarity of the sesame oil profiles. PCA was able to clearly distinguish the different categories of sesame oils in relation to the amount of lignans, tocopherols, phytosterols, and squalene.

4. Conclusions

In summary, the simultaneous determination of lignans, tocols, phytosterols, and squalene was established using an HPLC-DAD-FLD system with good linearity, good resolutions, low LOD/ LOQ, and satisfactory recoveries. The method allowed for the analysis of 10 compounds within 22 min. The method validation suggested that the developed method was highly reliable. The method was successfully applied to analyze lignans, tocols, phytosterols, and squalene in twenty-eight commercial sesame oils. The developed HPLC-DAD-FLD method is a powerful tool for the analysis of important bioactive compounds in different types of sesame oil samples (including CPO, SOS, SCO, and MSCO). In addition, the analytical method developed can be applied to other products containing sesame oil for the determination of those phytochemicals.

Supplementary Materials

The following supporting information can be downloaded at https://www.mdpi.com/article/10.3390/foods13091368/s1. The supplementary information available includes a table and chromatograms derived from the four HPLC conditions. Table S1: Detail of sesame oil samples used in this study. Figure S1: Chromatograms of some mobile phase ratios showed effective in the separation of the targeted compounds from the four conditions.

Author Contributions

Conceptualization, data curation, J.Y. and P.S.; formal analysis, investigation, methodology, J.Y.; project administration, supervision, P.S.; software, J.Y. and C.B.; writing—original draft, J.Y.; writing—review and editing, C.B., S.J., S.M. and P.S. All authors have read and agreed to the published version of the manuscript.

Institutional Review Board Statement

Not applicable.

Informed Consent Statement

Not applicable.

Data Availability Statement

The original contributions presented in the study are included in the article, further inquiries can be directed to the corresponding author.

Acknowledgments

This work was supported by the Bruno Werdelmann Foundation, the Functional Food Research Center for Well-being (Multidisciplinary Research Institute, Chiang Mai University), Material Science Research Center (Faculty of Science, Chiang Mai University), the Higher Education Research Promotion and National Research University Project of Thailand, the Center of Excellence for Innovation in Chemistry (PERCH-CIC), Office of the Higher Education Commission, Ministry of Education, Thailand, and Science Achievement Scholarship of Thailand (SAST).

Conflicts of Interest

The authors declare no conflict of interest.

Abbreviations

CPOCold-pressed sesame oil
DADDiode array detector
FLDFluorescence detector
HPLCHigh-performance liquid chromatography
LODLimit of detection
LOQLimit of quantification
MSCOSesame cooking oil mixed with other oil
NPNormal-phase
PCAPrincipal component analysis
RPReverse-phase
RSDsRelative standard deviations
SCOSesame cooking oil
SOSSesame oil supplement

References

  1. Pathak, N.; Rai, A.K.; Kumari, R.; Thapa, A.; Bhat, K.V.; Srinivasan, R. Variation in biochemical components in black (Sesamum indicum L.) and white (Sesamum indicum L.) sesame seeds collected from different regions of India. Food Chem. 2014, 163, 270–277. [Google Scholar]
  2. Jeon, H.; Lee, S.C.; Cho, Y.J.; Oh, J.H.; Kwon, K.; Kim, B.H. A triple isotope approach for discriminating the geographic origin of Asian sesame oils. Food Chem. 2015, 167, 363–369. [Google Scholar] [CrossRef]
  3. Che Man, Y.B.; Liu, J. Quality characteristics of cold-pressed sesame oil obtained from different methods. J. Food Sci. 2015, 80, C739–C746. [Google Scholar]
  4. Pathak, N.; Rai, A.K.; Kumari, R. Quality characteristics of sesame oil extracted from some Indian varieties. J. Pharmacogn. Phytochem. 2017, 6, 7–10. [Google Scholar]
  5. Langyan, S.; Yadava, P.; Sharma, S.; Gupta, N.C.; Bansal, R.; Yadav, R.; Kalia, S.; Kumar, A. Food and nutraceutical functions of Sesame oil: An underutilized crop for nutritional and health benefits. Food Chem. 2022, 389, 132990. [Google Scholar] [CrossRef]
  6. Hwang, L.S. Sesame oil. In Bailey’s Industrial Oil and Fat Products, 6th ed.; Wiley & Sons: Chichester, UK, 2005; pp. 547–552. [Google Scholar]
  7. Priya, K.; Krishnakumari, S. Phytochemical analysis of Achyranthes aspera and its activity on sesame oil induced lipid peroxi-dation. Anc. Sci. Life. 2007, 27, 6. [Google Scholar]
  8. Elleuch, M.; Bedigian, D.; Zitoun, A. Sesame (Sesamum indicum L.) seeds in food, nutrition, and health. In Nuts and Seeds in Health and Disease Prevention; Academic Press: Cambridge, MA, USA, 2011; pp. 1029–1036. [Google Scholar]
  9. Moazzami, A.A.; Haese, S.L.; Kamal-Eldin, A. Lignan contents in sesame seeds and products. Eur. J. Lipid Sci. Technol. 2007, 109, 1022–1027. [Google Scholar] [CrossRef]
  10. Pathak, N.; Bhaduri, A.; Rai, A.K. Sesame: Bioactive Compounds and Health Benefits; Bioactive Molecules in Food; Springer International Publishing: New York, NY, USA, 2019; pp. 181–200. [Google Scholar]
  11. Fort Wayne, M.; Ro, J. Squalene: A potential chemopreventive agent. Expert Rev. Anticancer Ther. 2010, 10, 41–50. [Google Scholar]
  12. Rao, C.V.; Newmark, H.L.; Reddy, B.S. Chemopreventive effect of squalene on colon cancer. Carcinogenesis 1998, 19, 287–290. [Google Scholar] [CrossRef]
  13. Ryan, E.; Galvin, K.; O’Connor, T.P.; Maguire, A.R.; O’Brien, N.M. Phytosterol, squalene, tocopherol content and fatty acid profile of selected seeds, grains, and legumes. Plant Foods Hum. Nutr. 2007, 62, 85–91. [Google Scholar] [CrossRef]
  14. Waksmundzka-Hajnos, M.; Sherma, J. (Eds.) High Performance Liquid Chromatography in Phytochemical Analysis; Taylor & Francis: Boca Raton, FL, USA, 2010; pp. 23–33. [Google Scholar]
  15. Lee, J.; Finn, C.E. Determination of lignans in flaxseed by HPLC. J. Agric. Food Chem. 2007, 55, 8126–8131. [Google Scholar]
  16. Moreau, R.A.; Hicks, K.B. The in vitro hydrolysis and fermentation of squalene and phytosterols by human fecal inoculum. Lipids 2004, 39, 597–605. [Google Scholar]
  17. Lu, J.; Zhao, H. Determination of tocopherols and tocotrienols in cereals by HPLC. J. Agric. Food Chem. 2007, 55, 4689–4694. [Google Scholar]
  18. Pokkanta, P.; Sookwong, P.; Tanang, M.; Setchaiyan, S.; Boontakham, P.; Mahatheeranont, S. Simultaneous determination of tocols, γ-oryzanols, phytosterols, squalene, cholecalciferol and phylloquinone in rice bran and vegetable oil samples. Food Chem. 2019, 271, 630–638. [Google Scholar] [CrossRef]
  19. Thompson, M.; Ellison, S.L.; Fajgelj, A.; Willetts, P.; Wood, R. Harmonized guidelines for the use of recovery information in analytical measurement. Pure Appl. Chem. 1999, 71, 337–348. [Google Scholar] [CrossRef]
  20. Brereton, R.G. Chemometrics: Data Analysis for the Laboratory and Chemical Plant; Wiley & Sons: Chichester, UK, 2003; p. 489. [Google Scholar]
  21. Brereton, R.G. Chemometrics for Pattern Recognition; Wiley & Sons: Chichester, UK, 2009; pp. 49–56. [Google Scholar]
  22. Kim, A.Y.; Yun, C.I.; Lee, J.G.; Kim, Y.J. Determination and daily intake estimation of lignans in sesame seeds and sesame oil products in Korea. Foods 2020, 9, 394. [Google Scholar] [CrossRef]
  23. Pang, M.; Cao, L.; Zheng, D.; Lei, Z.; Ge, Y.; Cheng, J.; Cao, L. Simultaneous detection of lignans and tocopherols in sesame oil by reversed-phase high-performance liquid chromatography. Authorea 2020, 1–9. [Google Scholar] [CrossRef]
  24. Shi, L.K.; Zheng, L.; Xiang, Y.F.; Liu, R.J.; Chang, M.; Jin, Q.Z.; Wang, X.G. A rapid method for simultaneous analysis of lignan and γ-tocopherol in sesame oil by using normal-phase liquid chromatography. J. Am. Oil Chem. Soc. 2018, 95, 13–19. [Google Scholar] [CrossRef]
  25. Huang, L.; Li, J.; Bi, Y.; Xu, Y.; Wang, Y.; Wang, J.; Peng, D. Simultaneous determination of α-tocopherol, β-tocopherol, γ-tocopherol, δ-tocopherol, sesamin, sesamolin, sesamol, and asarinin in sesame oil by normal-phase high performance liquid chromatography. J. Food Compost. Anal. 2021, 104, 104132. [Google Scholar] [CrossRef]
  26. Moazzami, A.A.; Kamal-Eldin, A. Sesame seed is a rich source of dietary lignans. J. Am. Oil Chem. Soc. 2006, 83, 719–723. [Google Scholar] [CrossRef]
  27. Wang, C.C.; Chen, S.; Wu, T.S. The facile reversed-phase HPLC resolution of tetrahydrofurofuran nucleus lignans in traditional Chinese medicine: Quantitative analysis of asarinin and sesamin in Asari radix. J. Chin. Chem. Soc. 2003, 50, 261–266. [Google Scholar] [CrossRef]
  28. Liu, Z.; Saarinen, N.M.; Thompson, L.U. Sesamin is one of the major precursors of mammalian lignans in sesame seed (Sesamum indicum) as observed in vitro and in rats. J. Nutr. 2006, 136, 906–912. [Google Scholar] [CrossRef]
  29. Kim, K.S.; Lee, J.R.; Lee, J.S. Determination of sesamin and sesamolin in sesame (Sesamum indicum L.) seeds using UV spectrophotometer and HPLC. Korean J. Crop Sci. 2006, 51, 95–100. [Google Scholar]
  30. Wang, L.; Zhang, Y.; Li, P.; Wang, X.; Zhang, W.; Wei, W.; Zhang, X. HPLC analysis of seed sesamin and sesamolin variation in a sesame germplasm collection in China. J. Am. Oil Chem. Soc. 2012, 89, 1011–1020. [Google Scholar] [CrossRef]
  31. Rangkadilok, N.; Pholphana, N.; Mahidol, C.; Wongyai, W.; Saengsooksree, K.; Nookabkaew, S.; Satayavivad, J. Variation of sesamin, sesamolin and tocopherols in sesame (Sesamum indicum L.) seeds and oil products in Thailand. Food Chem. 2010, 122, 724–730. [Google Scholar] [CrossRef]
  32. Williamson, K.S.; Morris, J.B.; Pye, Q.N.; Kamat, C.D.; Hensley, K. A survey of sesamin and composition of tocopherol variability from seeds of eleven diverse sesame (Sesamum indicum L.) genotypes using HPLC-PAD-ECD. Phytochem. Anal. 2008, 19, 311–322. [Google Scholar] [CrossRef]
  33. Mohamed, H.M.A.; Awatif, I.I. The use of sesame oil unsaponifiable matter as a natural antioxidant. Food Chem. 1998, 62, 269–276. [Google Scholar] [CrossRef]
  34. Yuenyong, J.; Pokkanta, P.; Phuangsaijai, N.; Kittiwachana, S.; Mahatheeranont, S.; Sookwong, P. GC-MS and HPLC-DAD analysis of fatty acid profile and functional phytochemicals in fifty cold-pressed plant oils in Thailand. Heliyon 2021, 7, e06304. [Google Scholar] [CrossRef]
  35. Saeed, F.; Qamar, A.; Nadeem, M.T.; Ahmed, R.S.; Arshad, M.S.; Afzaal, M. Nutritional composition and fatty acid profile of some promising sesame cultivars. Pak. J. Food Sci. 2015, 25, 98–103. [Google Scholar]
  36. Tenyang, N.; Ponka, R.; Tiencheu, B.; Djikeng, F.T.; Azmeera, T.; Karuna, M.S.; Prasad, R.B.; Womeni, H.M. Effects of boiling and roasting on proximate composition, lipid oxidation, fatty acid profile and mineral content of two sesame varieties commercialized and consumed in Far-North Region of Cameroon. Food Chem. 2017, 221, 1308–1316. [Google Scholar] [CrossRef]
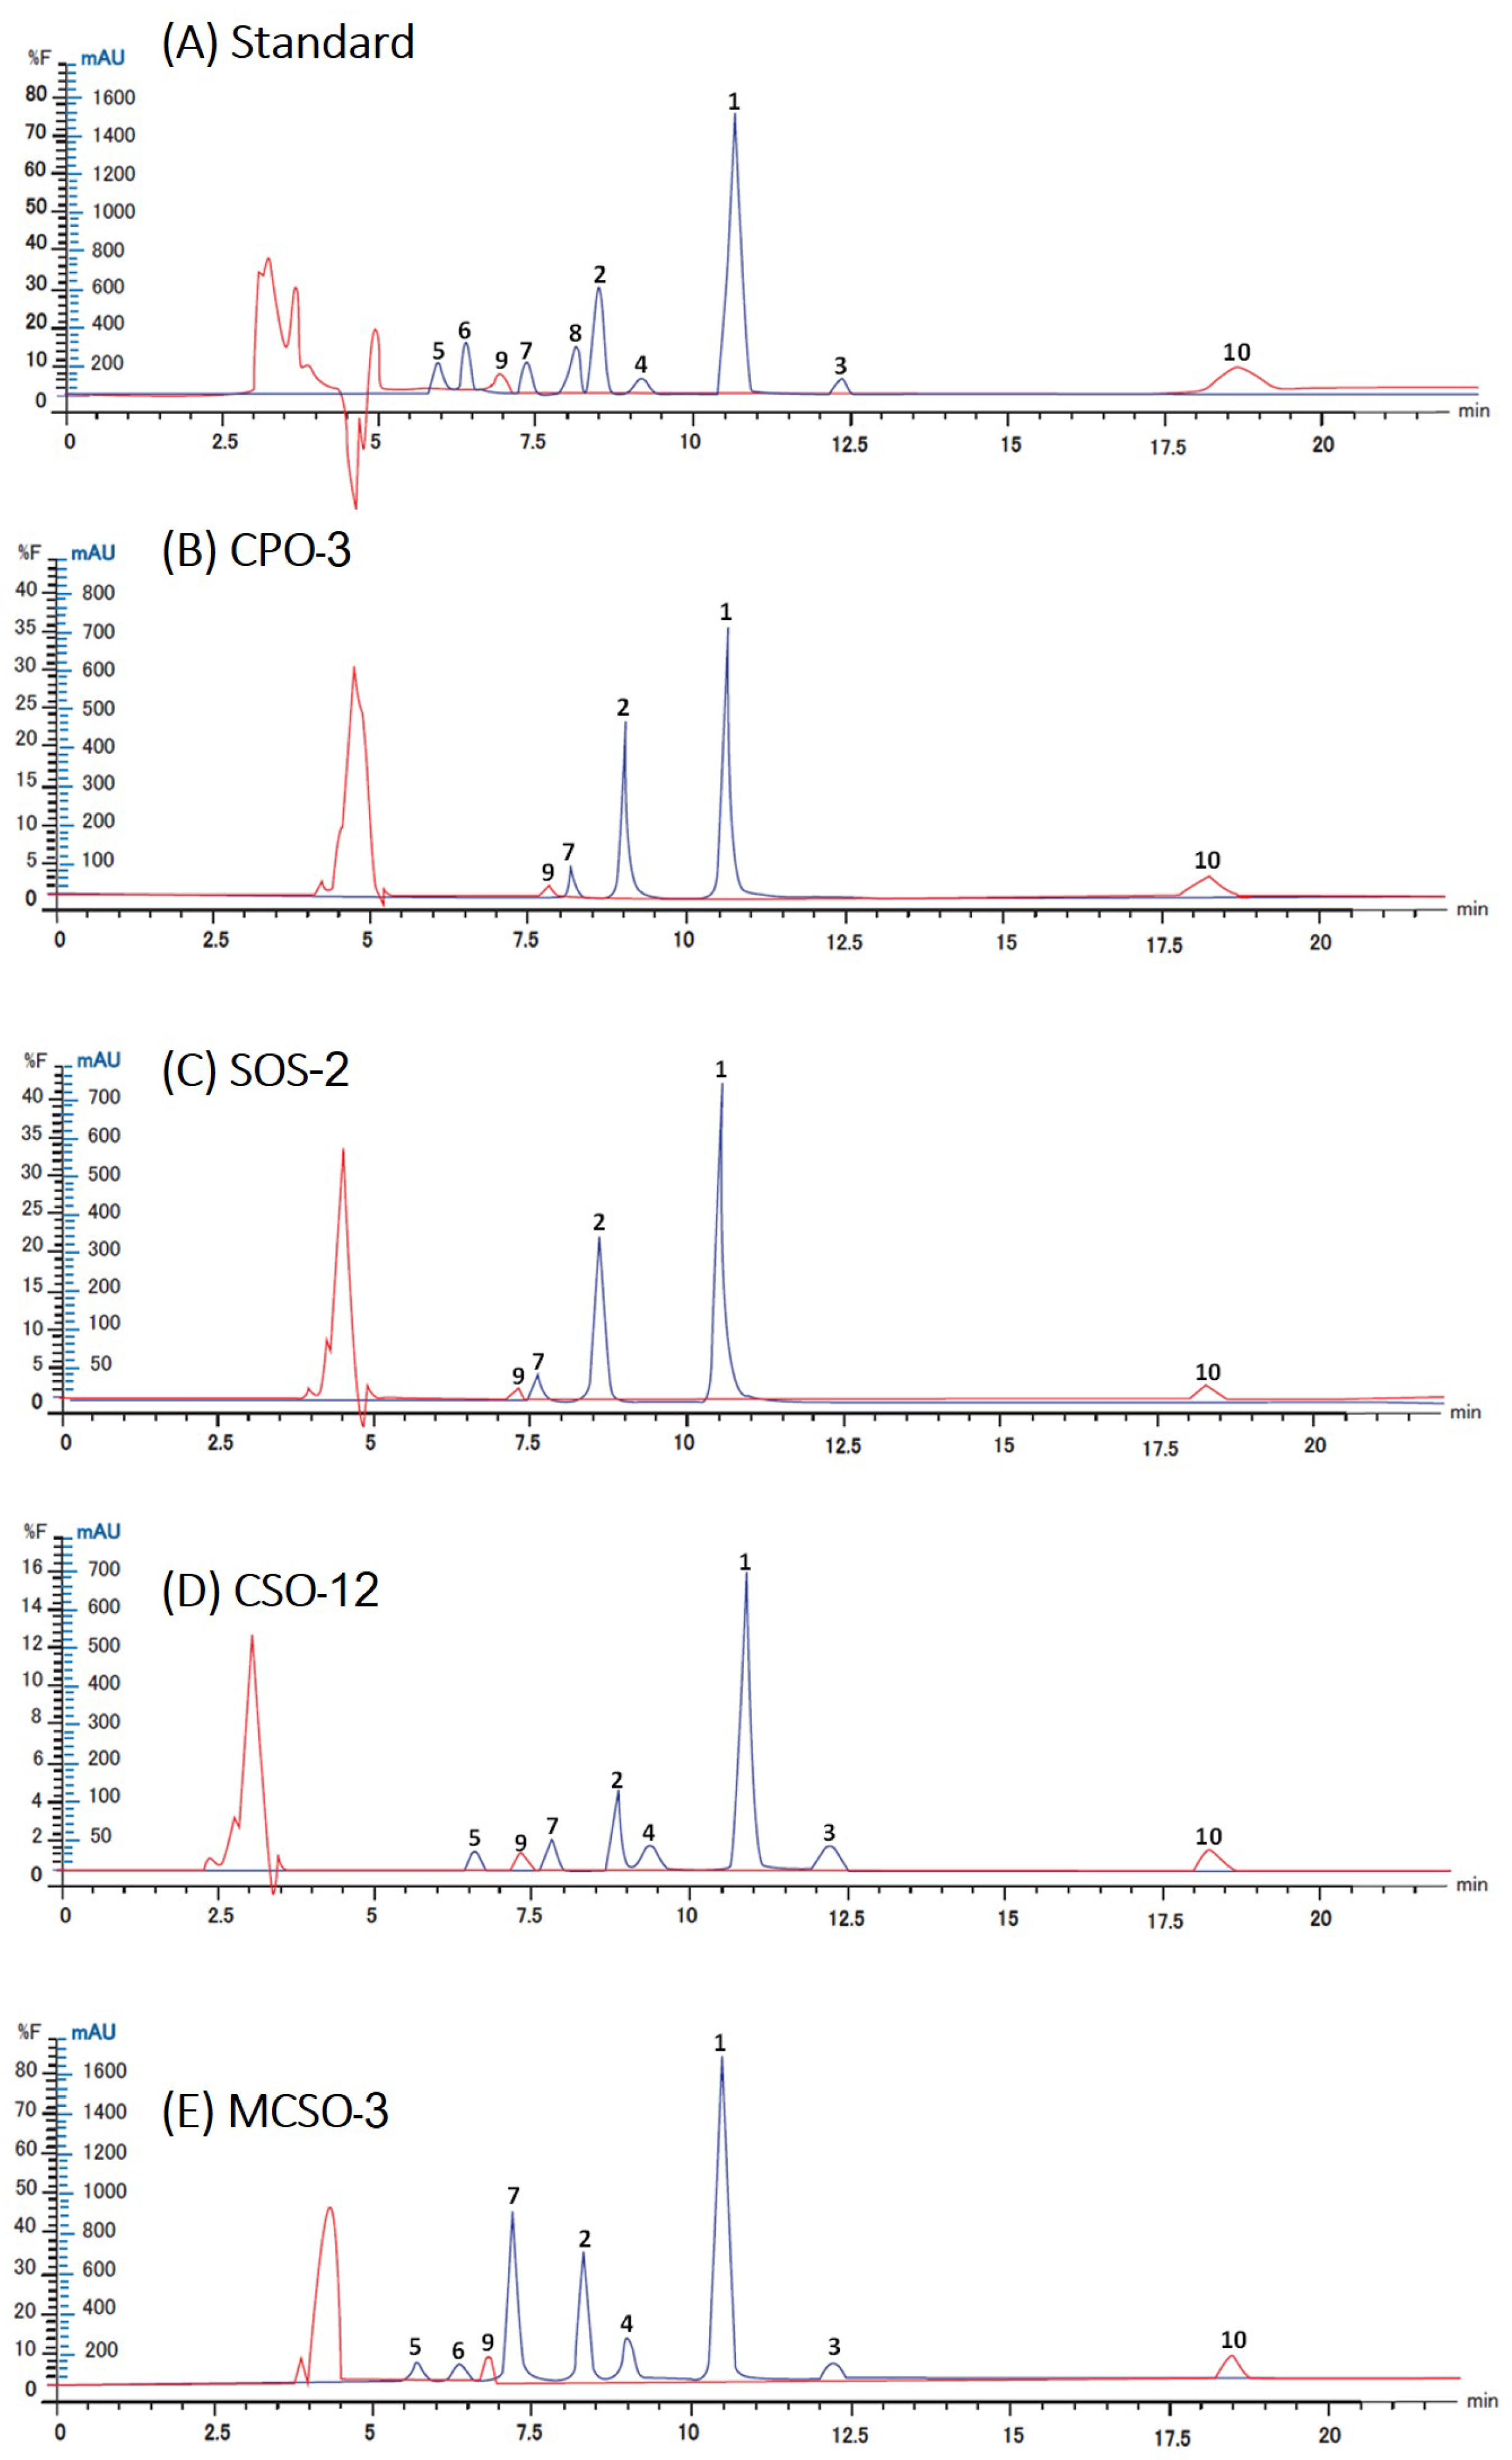
Figure 1. Chromatograms of analyzed samples. (A) Standard solution, (B) cold-pressed sesame oil (CPO), (C) sesame oil supplements (SOS), (D) sesame cooking oil (SCO), and (E) sesame cooking oil mixed with other oils (MSCO). Peak identification: 1 = sesamin, 2 = sesamolin, 3 = sesamol, 4 = asarinin, 5 = α-tocopherol, 6 = β-tocopherol, 7 = γ-tocopherol, 8 = δ-tocopherol, 9 = squalene, and 10 = phytosterol.
Foods 13 01368 g001
Figure 2. Content of bioactive compounds in sesame oils (μg g−1).
Foods 13 01368 g002
Figure 3. Principal component analysis of the sesame oils for the content of bioactive compounds in the function of PC1 and PC2, score plot (n = 28) for oil samples in 4 groups of cold-pressed sesame oil (CPO), sesame oil supplements (SOS), sesame cooking oil (SCO), and sesame cooking oil mixed with other oils (MSCO). The code for the oils is a number that is counted from the order of the oils written in Supplementary Table S1.
Foods 13 01368 g003
Table 1. Method validation results for determination of lignans, tocopherols, phytosterol, and squalene.
CompoundsRetention Time (min)Regression EquationCorrelation (R2)LOD a
(µg mL−1)
LOQ b
(µg mL−1)
Sesamin10.34y = 36.705x − 2.9180.99820.020.05
Sesamolin8.94y =26.738x + 19.5730.99010.100.12
Sesamol11.73y = 46.016x + 13.6910.99750.020.04
Asarinin9.08y = 30.685x + 5.48330.99470.100.12
α-Tocopherol6.31y = 21.621x − 6.65430.99960.410.43
β-Tocopherol6.97y = 41.061x + 3.18720.99980.350.42
γ-Tocopherol7.52y = 44.828x + 3.25470.99990.400.42
δ-Tocopherol8.44y = 43.128x + 15.9080.99950.210.40
Phytosterols18.17y = 6.2278x + 60.160.999210.0410.34
Squalene7.38y = 0.0453x − 5.25870.9986307.07326.23
LOD a and LOQ b are limit of detection (signal-to-noise ratio of 3) and quantification (signal-to-noise ratio of 10), respectively.
Table 2. Values of the intra-day, inter-day, and recoveries of the analytes.
CompoundsConcentration
(µg mL−1)
Intra-Day
%RSD (n = 6)
Inter-Day
%RSD (n = 3)
Recovery (%)
SesaminCon 10.180.61107.2
Con 21.093.07100.4
Con 30.783.02104.8
SesamolinCon 10.140.6699.3
Con 20.351.39100.2
Con 30.273.3297.8
SesamolCon 10.040.2291.6
Con 20.140.39102.8
Con 30.270.1488.4
AsarininCon 10.120.40101.1
Con 20.421.4699.7
Con 30.462.6593.5
α-TocopherolCon 10.270.0392.5
Con 20.160.4588.9
Con 30.330.2696.7
β-TocopherolCon 10.280.10102.0
Con 20.220.25109.4
Con 30.300.36113.5
γ-TocopherolCon 10.080.35100.0
Con 20.120.3498.5
Con 30.190.33107.6
δ-TocopherolCon 10.070.11102.6
Con 20.070.1390.6
Con 30.160.3491.4
SqualeneCon 10.040.3099.7
Con 20.100.28100.9
Con 30.220.46104.7
PhytosterolCon 10.010.1091.0
Con 20.040.1392.5
Con 30.030.2594.6
Table 3. Content of lignans, tocopherols, phytosterol, and squalene in various commercialized sesame oil samples (μg g−1).
Sample TocopherolLignanSqualenePhytosterols
α-T aβ-Tγ-Tδ-TSesamolinAsarininSesaminSesamol
CPO-1ND bND293.8ND2240ND2315ND8756640
CPO-2NDND286.6ND1275ND1260ND9356385
CPO-3NDND377.5ND1540ND1480ND10056690
CPO-4NDND298.9ND1300ND1280ND9606530
CPO-5NDND324.8ND1645ND1620ND10306610
CPO-6NDND194.2ND2800ND2990ND8459500
CPO-7NDND169.4ND1820ND1940ND9105065
SOS-1NDND162.01.31630ND1630ND40304885
SOS-2NDND249.4ND3330ND3840ND9955490
SOS-3NDND29.7ND3000ND3540ND2457055
SOS-4NDND266.9ND4240ND4725ND11956725
SCO-138.35.4298.8ND213092.824957.68754120
SCO-2NDND391.6ND2615122.8321525.19657020
SCO-3NDND329.2ND2365115.226909.59906900
SCO-4NDND250.9ND2175168.927407.98154560
SCO-5NDND254.1ND250041.829005.59055850
SCO-6NDND275.3ND2850132.93360121.510405210
SCO-7147.8ND226.4ND1730323.8436030.56203930
SCO-8NDND400.7ND2300157.8274030.09905495
SCO-9NDND307.5ND150018.0298042.812604610
SCO-10NDND270.0ND2140126.1244020.49904835
SCO-11NDND283.0ND286060.33180105.310505895
SCO-1280.018.9206.7ND149012.72115ND7054000
MSCO-1100.312.6343.9ND420145.21210ND11602640
MSCO-253.214.1311.9ND1390104.5176532.011154195
MSCO-3139.418.8529.7ND685213.115551.711753640
MSCO-457.221.8308.7ND1800150.425257.810703995
MSCO-567.814.7357.9ND1215183.5151530.611303090
T a = tocopherol and ND b = non-detectable.
Disclaimer/Publisher’s Note: The statements, opinions and data contained in all publications are solely those of the individual author(s) and contributor(s) and not of MDPI and/or the editor(s). MDPI and/or the editor(s) disclaim responsibility for any injury to people or property resulting from any ideas, methods, instructions or products referred to in the content.