
Revealing Consequences of the Husking Process on Nutritional Profiles of Two Sorghum Races on the Male Sterility Line


Abstract
1. Introduction
2. Material and Methods
2.1. Instruments and Reagents
2.1.1. Crude Protein Measurements
2.1.2. Mineral Content Measurements
2.1.3. The Husker
2.1.4. Colorimeter Camera
2.2. Material and Sample Preparations
2.3. Application of Husking Procedure
2.4. Determination of the Crude Protein
2.5. Determination of Dry Matter
2.6. Determination of Mineral Elemental Contents
2.7. Evaluation of Husked Grain Color
2.8. Statistical Analysis
3. Results
3.1. Influence of the HFTU Process on the Dry Matter and Crude Protein
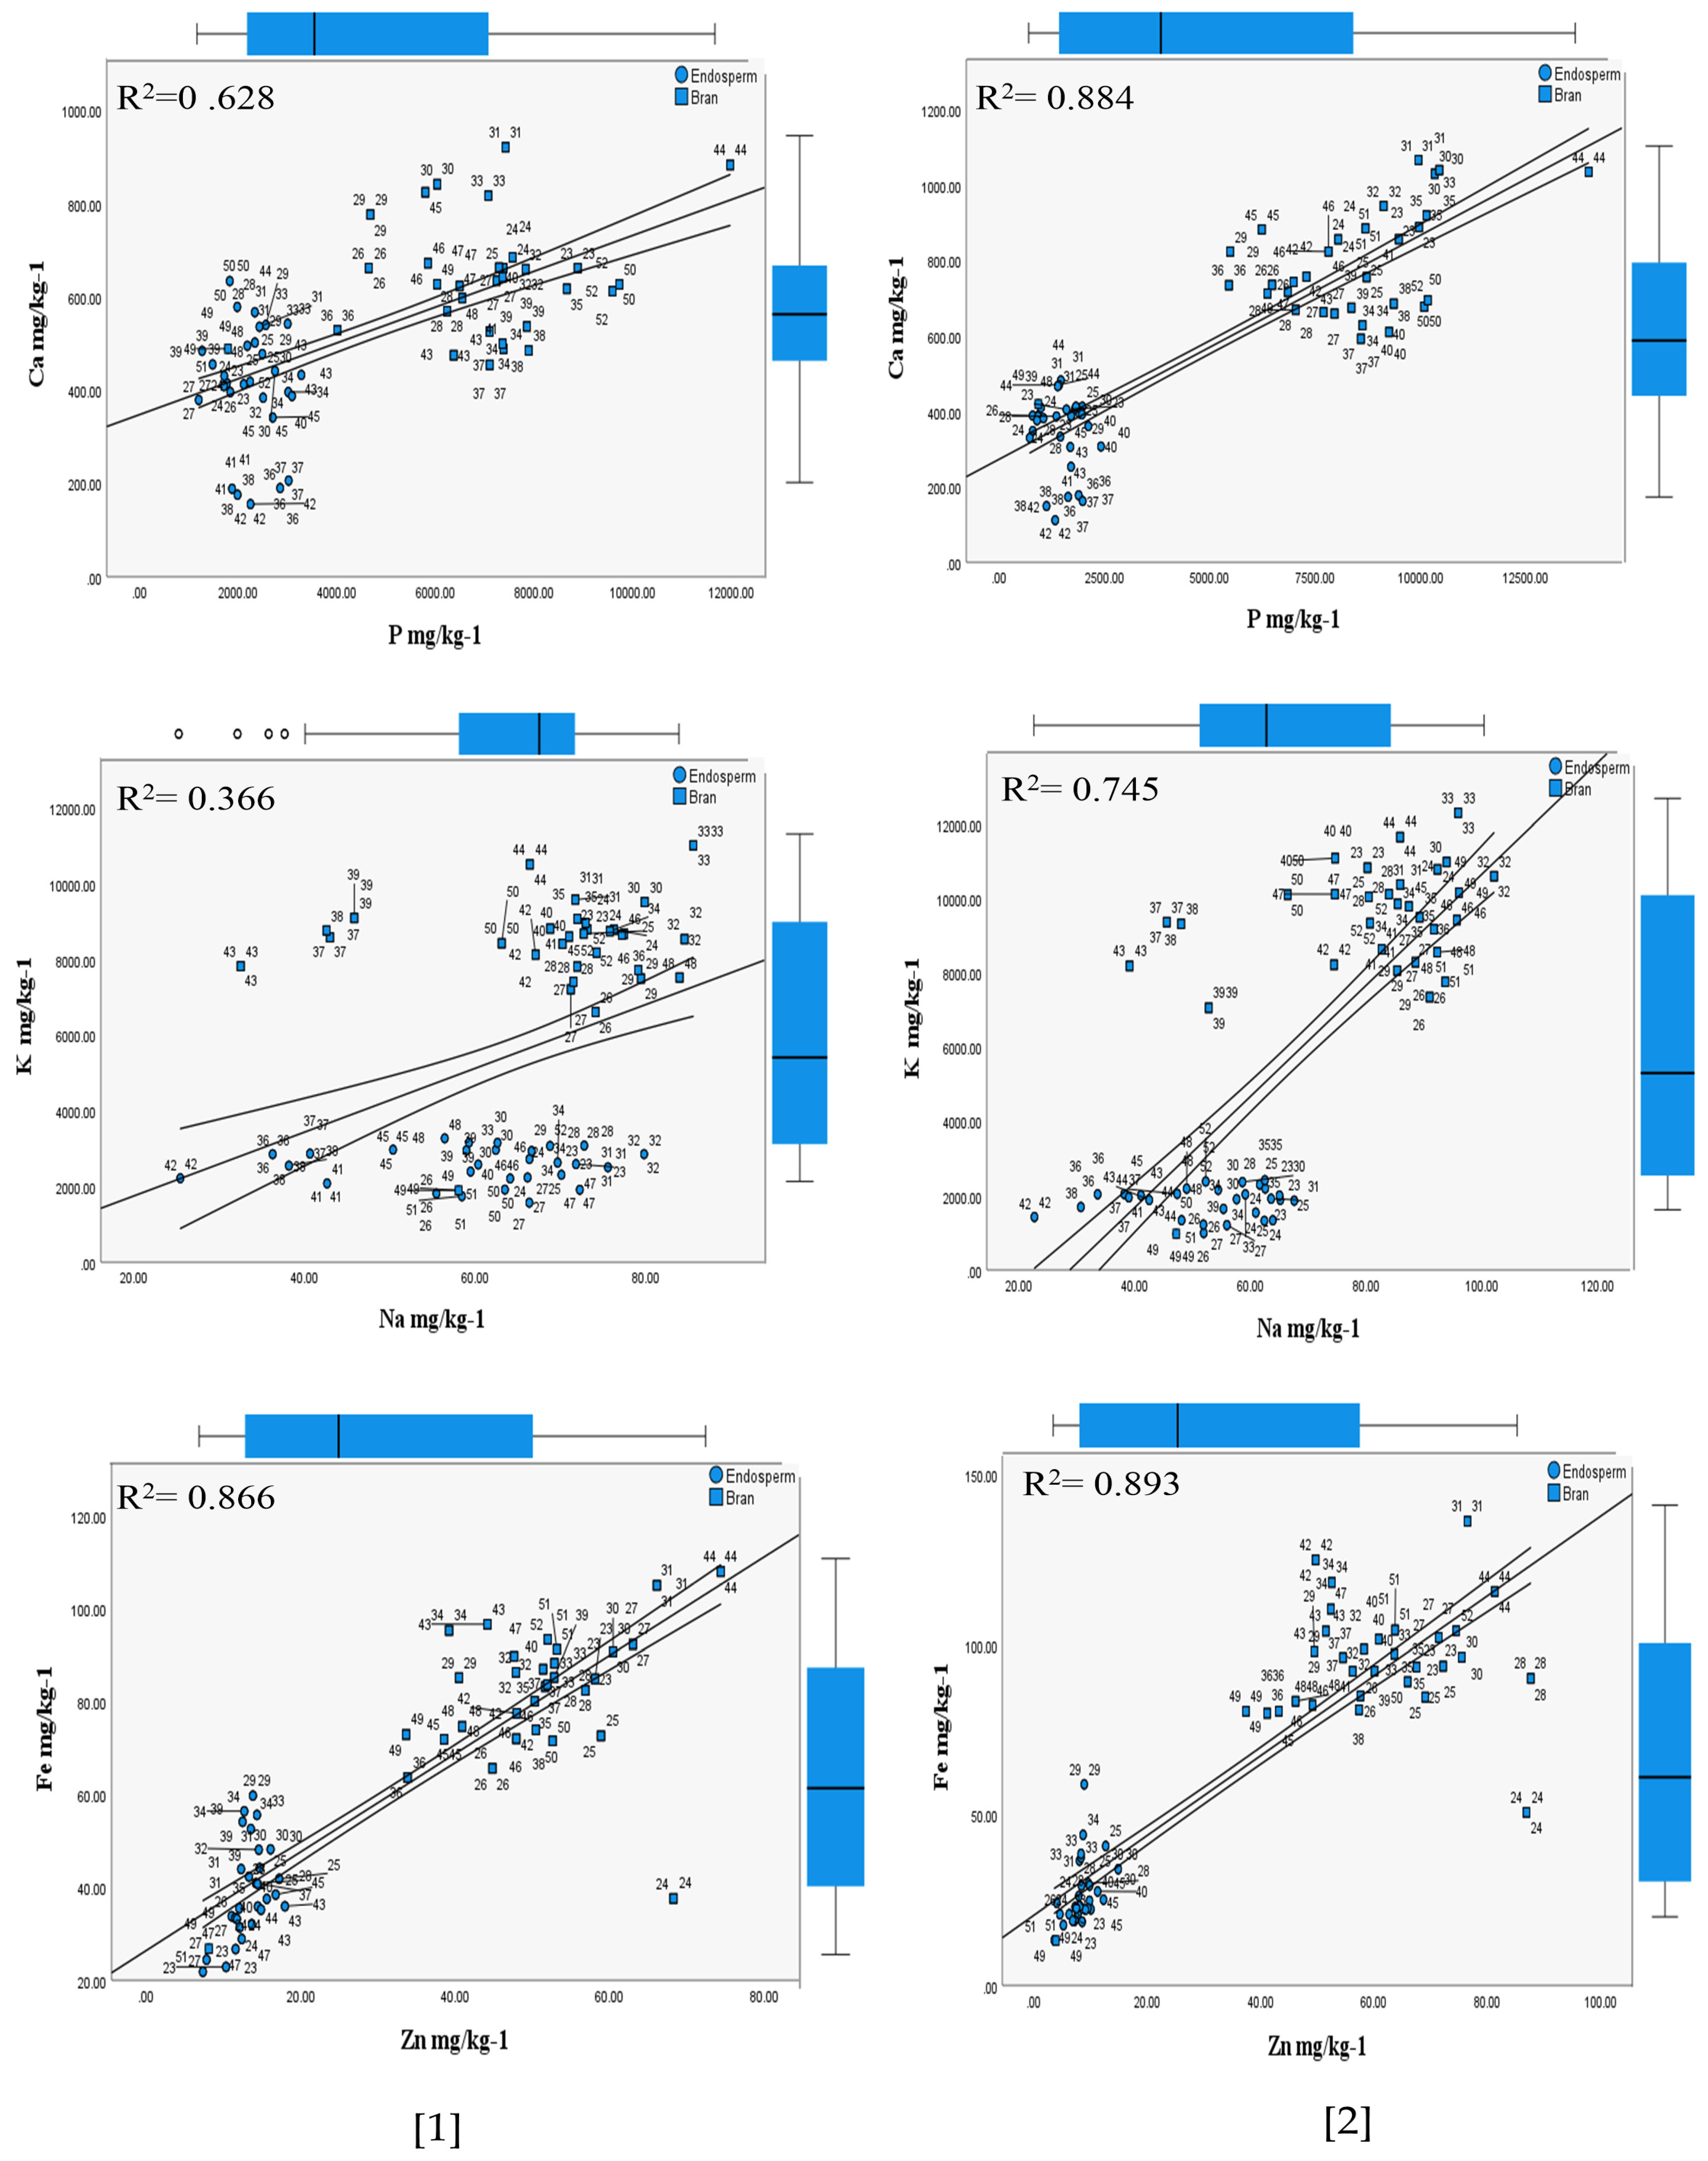
3.2. Influence of the HFTU Process on the Mineral Contents
3.2.1. Phosphorus
3.2.2. Potassium
3.2.3. Sulfur
3.2.4. Calcium
3.2.5. Magnesium
3.2.6. Sodium
3.2.7. Copper
3.2.8. Iron
3.2.9. Zinc
3.2.10. Manganese
3.3. Evaluation of Color Profiles
Color Characteristics Attributed to 30 (S) and 80 (S) Time Units
4. Discussion
5. Conclusions
Author Contributions
Funding
Institutional Review Board Statement
Informed Consent Statement
Data Availability Statement
Acknowledgments
Conflicts of Interest
References
- Hossain, M.S.; Islam, M.N.; Rahman, M.M.; Mostofa, M.G.; Khan, M.A.R. Sorghum: A prospective crop for climatic vulnerability, food and nutritional security. J. Agric. Food Res. 2022, 8, 100300. [Google Scholar] [CrossRef]
- Aguiar, E.V.; Santos, F.G.; Queiroz, V.A.V.; Capriles, V.D. A Decade of Evidence of Sorghum Potential in the Development of Novel Food Products: Insights from a Bibliometric Analysis. Foods. 2023, 12, 3790. [Google Scholar] [CrossRef] [PubMed]
- George, T.T.; Oyenihi, A.B.; Obilana, A.B.; Akamo, D.O.; Awika, J.M. Trends and progress in sorghum research over two decades, and implications to global food security. S. Afr. J. Bot. 2022, 151, 960–969. [Google Scholar] [CrossRef]
- Tonapi, V.A.; Talwar, H.S.; Are, A.K.; Bhat, B.V.; Reddy, C.R.; Dalton, T.J. Sorghum in the 21st Century: Food–Fodder–Feed–Fuel for a Rapidly Changing World; Springer: Berlin/Heidelberg, Germany, 2021. [Google Scholar] [CrossRef]
- Thilakarathna, R.C.N.; Madhusankha, G.D.M.P.; Navaratne, S.B. Potential food applications of sorghum (Sorghum bicolor) and rapid screening methods of nutritional traits by spectroscopic platforms. J. Food Sci. 2022, 87, 36–51. [Google Scholar] [CrossRef] [PubMed]
- Jóvér, J.; Kovács, G.; Blaskó, L.; Juhász, C.; Kovács, E. Evaluation of Sweet Sorghum (Sorghum bicolor) Hybrids as Bioenergy Feedstocks in Relation to Climatic Aspects. Nat. Resour. Sustain. Dev. 2020, 10, 161–174. [Google Scholar] [CrossRef]
- Jóvér, J.; Kovács, E.; Riczu, P.; Tamás, J.; Blaskó, L. Spatial decision support for crop structure adjustment—A case study for selection of potential areas for sorghum (Sorghum bicolor (L.) Moench) production. Agrokchemistry 2018, 67, 49–59. [Google Scholar] [CrossRef]
- Höhn, J.G.; Rötter, R.P. Impact of global warming on European cereal production. CAB Rev. Perspect. Agric. Vet. Sci. Nutr. Nat. Resour. 2014, 9, 1–15. [Google Scholar] [CrossRef]
- Berenji, J.; Dahlberg, J.; Sikora, V.; Latkovič, D. Origin, History, Morphology, Production, Improvement, and Utilization of Broomcorn [Sorghum bicolor (L.) Moench ] in Serbia. Econ. Bot. 2011, 65, 190–208. [Google Scholar] [CrossRef]
- Maurya, R.; Boini, T.; Misro, L.; Radhakrishnan, T.; Sreedharan, A.P.; Gaidhani, D. Comprehensive review on millets: Nutritional values, effect of food processing and dietary aspects. J. Drug Res. Ayurvedic Sci. 2023, 8, S82–S98. [Google Scholar] [CrossRef]
- Baholet, D.; Mrvova, K.; Horky, P.; Pavlata, L. Comparison of nutrient composition of sorghum varieties depending on different soil types. In Proceedings of the 25th International PhD Students Conference, Brno, Czech Republic, 7–8 November 2018; Volume 25, pp. 100–103. [Google Scholar]
- Annual Conference the Geneticss Society of Nigeria Book of Proceedings, 10–14 October 2021. Available online: https://www.researchgate.net/publication/365234635_44th_ANNUAL_CONFERENCE_OF_THE_GENETICS_SOCIETY_OF_NIGERIA_ZARIA_2021 (accessed on 28 March 2024).
- Khalid, W.; Arshad, M.S.; Aslam, N.; Mukhtar, S.; Rahim, M.A.; Ranjha, M.M.A.N.; Noreen, S.; Afzal, M.F.; Aziz, A.; Awuchi, C.G. Food applications of sorghum derived kafirins potentially valuable in celiac disease. Int. J. Food Prop. 2022, 25, 2348–2363. [Google Scholar] [CrossRef]
- Girard, A.L.; Awika, J.M. Sorghum polyphenols and other bioactive components as functional and health promoting food ingredients. J. Cereal Sci. 2018, 84, 112–124. [Google Scholar] [CrossRef]
- Widowati, S.; Luna, P. Nutritional and Functional Properties of Sorghum (Sorghum bicolor (L.) Moench)-based Products and Potential Valorisation of Sorghum Bran. IOP Conf. Ser. Earth Environ. Sci. 2022, 1024, 012031. [Google Scholar] [CrossRef]
- Narkhede, G.W.; Mehtre, S.; Thakur, N.; Ingle, K.P. Genetics of fertility restoration in A1 Cytoplasmic Genetic Male Sterility (CGMS) systems in Sorghum (Sorghum bicolor, L. Moench). Emergent Life Sci. Res. 2022, 8, 59–63. [Google Scholar] [CrossRef]
- Htet, M.N.S.; Feng, B.; Wang, H.; Tian, L.; Yadav, V. Comparative assessment of nutritional and functional properties of different sorghum genotypes for ensuring nutritional security in dryland agro-ecosystem. Front. Nutr. 2022, 9, 1048789. [Google Scholar] [CrossRef] [PubMed]
- Chen, J.; Jiao, Y.; Laza, H.; Payton, P.; Ware, D.; Xin, Z. Identification of the First Nuclear Male Sterility Gene (Male-sterile 9) in Sorghum. Plant Genome 2019, 12, 1–12. [Google Scholar] [CrossRef] [PubMed]
- Xin, Z.; Huang, J.; Smith, A.R.; Chen, J.; Burke, J.; Sattler, S.E.; Zhao, D. Morphological characterization of a new and easily recognizable nuclear male sterile mutant of sorghum (Sorghum bicolor). PLoS ONE 2017, 12, e0165195. [Google Scholar] [CrossRef]
- Black, C.K.; Panozzo, J.F. Accurate technique for measuring color values of grain and grain products using a visible-NIR instrument. Cereal Chem. 2004, 81, 469–474. [Google Scholar] [CrossRef]
- Muthamilarasan, M.; Prasad, M. Small Millets for Enduring Food Security Amidst Pandemics. Trends Plant Sci. 2021, 26, 33–40. [Google Scholar] [CrossRef]
- Karumba, C.P. Improvement of Somatic Embryogenesis and Androgenesis Systems for Sorghum [Sorghum bicolor (L.) Moench]. Ph.D. Thesis, Hungarian University of Agriculture and Life Sciences, Gödöllő, Hungary, 2021. [Google Scholar]
- Kumar, A.A.; Reddy, B.V.S.; Sharma, H.C.; Hash, C.T.; Rao, P.S.; Ramaiah, B.; Reddy, P.S. Recent Advances in Sorghum Genetic Enhancement Research at ICRISAT. Am. J. Plant Sci. 2011, 2, 589–600. [Google Scholar] [CrossRef]
- Nayik, G.A.; Tufail, T.; Muhammad Anjum, F.; Javed Ansari, M. Cereal Grains: Composition, Nutritional Attributes, and Potential Applications. Cereal Grains: Composition, Nutritional Attributes, and Potential Applications; CRC Press: Boca Raton, FL, USA, 2023. [Google Scholar] [CrossRef]
- Sruthi, N.U.; Rao, P.S.; Rao, B.D. Decortication induced changes in the physico-chemical, anti-nutrient, and functional properties of sorghum. J. Food Compos. Anal. 2021, 102, 104031. [Google Scholar] [CrossRef]
- Kudapa, H.; Barmukh, R.; Vemuri, H.; Gorthy, S.; Pinnamaneni, R.; Vetriventhan, M.; Srivastava, R.K.; Joshi, P.; Habyarimana, E.; Gupta, S.K.; et al. Genetic and genomic interventions in crop biofortification: Examples in millets. Front. Plant Sci. 2023, 14, 1123655. [Google Scholar] [CrossRef] [PubMed]
- Souza, T.L.; Souza, L.A.; Barbosa, I.S.; Santos, D.C.M.B.; Araujo, R.G.O.; Korn, M.G.A. Mineral and Trace Elements in Nutritious Flours: Total Contents, In Vitro Bioaccessibility and Contribution to Dietary Intake. Biol. Trace Elem. Res. 2023, 201, 4600–4611. [Google Scholar] [CrossRef] [PubMed]
- Ertl, K.; Goessler, W. Grains, whole flour, white flour, and some final goods: An elemental comparison. Eur. Food Res. Technol. 2018, 244, 2065–2075. [Google Scholar] [CrossRef]
- Steinberg, T.S.; Meleshkina, E.P.; Shvedova, O.G.; Morozova, O.V.; Zhiltsova, N.S. Changes of the Optical Properties of Top-Grade Flour (Semolina) from Durum Wheat during Its Ripening. Pis. Sist. Syst. 2020, 3, 24–28. [Google Scholar] [CrossRef]
- Konica Minolta. Chroma Meter Cr-400/410; Instruction Manual; Konica Minolta: Tokyo, Japan, 2002; Volume 160. [Google Scholar]
- John, R.N.; Taylor, J.T. ICC Handbook of 21st Century Cereal Science and Technology; Elsevier: Amsterdam, The Netherlands, 2023; pp. 161–171. [Google Scholar] [CrossRef]
- Wang, N. Optimization of a laboratory dehulling process for lentil (Lens culinaris). Cereal Chem. 2005, 82, 671–676. [Google Scholar] [CrossRef]
- ISO 20483:2013; Cereals and Pulses—Determination of the Nitrogen Content and Calculation of the Crude Protein Content—Kjeldahl Method. iTeh Standard: Etobicoke, Canada, 2013.
- International, A. Official Methods of Analysis of AOAC International, 20th ed.; AOAC: Rockville, Maryland, 2016. [Google Scholar]
- Pongrac, P.; Vogel-Mikuš, K.; Potisek, M.; Kovačec, E.; Budič, B.; Kump, P.; Regvar, M.; Kreft, I. Mineral and Trace Element Composition and Importance for Nutritional Value of Buckwheat Grain, Groats, and Sprouts. In Molecular Breeding and Nutritional Aspects of Buckwheat; Academic Press: Cambridge, MA, USA, 2016; pp. 261–271. [Google Scholar] [CrossRef]
- Langó, B.; Fehér, A.G.; Bicskei, B.Z.; Jaksics, E.; Németh, R.; Bender, D.; D’Amico, S.; Schoenlechner, R.; Tömösközi, S. The effect of different laboratory-scale sample preparation methods on the composition of sorghum (Sorghum bicolor L.) and millet (Panicum miliaceum L.) milling fractions. Period. Polytech. Chem. Eng 2018, 62, 426–431. [Google Scholar] [CrossRef]
- Kołodziejczyk, P.; Makowska, A.; Pospieszna, B.; Michniewicz, J.; Paschke, H. Chemical and nutritional characteristics of high-fibre rye milling fractions. Acta Sci. Pol. Technol. Aliment. 2018, 17, 149–157. [Google Scholar]
- Dasa, F.; Abera, T. Factors Affecting Iron Absorption and Mitigation Mechanisms: A review. Int. J. Agric. Sci. Food Technol. 2018, 4, 24–30. [Google Scholar]
- Sharma, R.; Hurburgh, C.; Mosher, G.A. Vulnerability analysis using evidence-based traceability in the grain supply chain. Cereal Chem. 2022, 99, 860–872. [Google Scholar] [CrossRef]
- Khan, A.; Khan, N.A.; Bean, S.R.; Chen, J.; Xin, Z.; Jiao, Y. Variations in Total Protein and Amino Acids in the Sequenced Sorghum Mutant Library. Plants 2023, 12, 1662. [Google Scholar] [CrossRef]
- Mohammed, Z.; Mabudi, A.; Murtala, Y.; Jibrin, S.; Sulaiman, S.; Salihu, J. Nutritional Analysis of Three Commonly Consumed Varieties of Sorghum (Sorghum bicolor L.) in Bauchi State, Nigeria. J. Appl. Sci. Environ. Manag. 2019, 23, 1329. [Google Scholar] [CrossRef]
- Ashok Kumar, A.; Anuradha, K.; Ramaiah, B. Increasing grain Fe and Zn concentration in sorghum: Progress and way forward. J. SAT Agric. Res. 2013, 11, 1–5. [Google Scholar]
- Ayuba, S.A.; Bello, Z.H.; Shehu, Z.; Ibrahim, T. Effect of Processing on White Sorghum Variety Consumed in Sokoto. IOSR J. Agric. Vet. Sci. 2020, 13, 45–50. [Google Scholar]


| Codes | Processed Grains | Pericarp Color | D.M g/kg−1 | Protein g/kg−1 | P mg/kg−1 | K mg/kg−1 | S mg/kg−1 | Ca mg/kg−1 | Mg mg/kg−1 | Cu mg/kg−1 | Fe mg/kg−1 | Zn mg/kg−1 | Na mg/kg−1 | Mn mg/kg−1 |
|---|---|---|---|---|---|---|---|---|---|---|---|---|---|---|
| 1 | 1 | 986 ± 0.03 | 22 ± 0.13 | 4201 ± 36.1 | 3932 ± 2926.3 | 1727 ± 12.4 | 174 ± 6.1 | 2643 ± 0.2 | 4 ± 0.2 | 83 ± 0.1 | 29 ± 0.03 | 23 ± 0.3 | 16 ± 1.1 | |
| 2 | Brown | 987 ± 0.47 | 8 ± 0.64 | 2630 ± 201.7 | 2965 ± 166.9 | 1372 ± 54.3 | 114 ± 14.3 | 1721 ± 447.5 | 5 ± 0.7 | 25 ± 0.7 | 24 ± 6.8 | 18 ± 2.1 | 11 ± 2.8 | |
| 3 | 987 ± 0.47 | 14 ± 0.21 | 9993 ± 347.8 | 9404 ± 771.8 | 1889 ± 130.2 | 505 ± 37.7 | 4722 ± 166.3 | 8 ± 2.8 | 145 ± 42.6 | 55 ± 14.7 | 34 ± 2.4 | 37 ± 13.6 | ||
| 2 | 1 | 890 ± 0.13 | 23 ± 0.03 | 3877 ± 81.2 | 3650 ± 0.41 | 1517 ± 202.1 | 176 ± 8.0 | 2313 ± 0.1 | 6 ± 0.30 | 39 ± 0.3 | 31 ± 0.1 | 21 ± 0.3 | 15 ± 2.2 | |
| 2 | White | 990 ± 0.05 | 16 ± 0.26 | 3005 ± 496.7 | 2929 ± 87.4 | 1591 ± 32.6 | 93 ± 43.7 | 1645 ± 541.6 | 3 ± 0.70 | 39 ± 10.5 | 15 ± 5.1 | 18 ± 3.6 | 8 ± 3.0 | |
| 3 | 990 ± 0.05 | 13 ± 0.10 | 9525 ± 492.9 | 9830 ± 1260.4 | 1705 ± 95.3 | 607 ± 36.3 | 4951 ± 458.3 | 13 ± 4.4 | 23 ± 10.6 | 101 ± 21.9 | 36 ± 3.6 | 57 ± 20.7 | ||
| 3 | 1 | 991 ± 0.04 | 12 ± 0.60 | 3712 ± 14.2 | 2983 ± 0.4 | 1760 ± 67.2 | 261.3 ± 12.1 | 2344 ± 0.3 | 4 ± 0.2 | 35 ± 0.1 | 28 ± 0.1 | 21 ± 1.0 | 15 ± 2.2 | |
| 2 | Brown | 991 ± 0.04 | 9 ± 0.58 | 2396 ± 119.2 | 3729 ± 469.0 | 1579 ± 142.6 | 122 ± 31.2 | 1645 ± 468.8 | 3 ± 0.8 | 26 ± 0.6 | 18 ± 6.7 | 20 ± 2.9 | 9 ± 3.1 | |
| 3 | 991 ± 0.04 | 18 ± 0.55 | 9525 ± 492.9 | 9830 ± 1260.4 | 1705 ± 95.3 | 607 ± 36.3 | 4951 ± 458.3 | 13 ± 4.4 | 23 ± 10.6 | 101 ± 21.9 | 36 ± 3.9 | 57 ± 20.7 | ||
| 4 | 1 | 990 ± 0.05 | 20 ± 0.11 | 4185 ± 128.0 | 4047 ± 11.0 | 1555 ± 20.3 | 243 ± 11.2 | 2350 ± 0.3 | 3 ± 0.5 | 30 ± 0.8 | 30 ± 0.1 | 27 ± 0.5 | 14 ± 0.2 | |
| 2 | Brown | 990 ± 0.05 | 15 ± 0.02 | 8452 ± 1527.8 | 9565 ± 208.01 | 1412 ± 67.5 | 90 ± 7.3 | 2906 ± 507.6 | 10 ± 0.2 | 94 ± 1.1 | 22 ± 11.3 | 17 ± 0.6 | 33 ± 2.4 | |
| 3 | 990 ± 0.05 | 12 ± 0.09 | 8953 ± 579.6 | 9345 ± 319.1 | 1703 ± 214.2 | 484 ± 100.8 | 4312 ± 233.3 | 9 ± 1.5 | 13 ± 2.5 | 72 ± 2.4 | 44 ± 1.2 | 36 ± 0.1 | ||
| 5 | 1 | 98.4 ± 0.28 | 17 ± 0.41 | 2155 ± 125.1 | 2289 ± 192.2 | 1437 ± 234.0 | 192 ± 118.5 | 1399 ± 248.8 | 3 ± 0.2 | 39 ± 15.2 | 24 ± 7.0 | 23 ± 0.3 | 16 ± 1.1 | |
| 2 | Brown | 991 ± 0.06 | 8 ± 0.02 | 1712 ± 539.8 | 2213 ± 170.5 | 1293 ± 49.4 | 87 ± 35.7 | 1525 ± 97.7 | 3 ± 0.5 | 30 ± 3.0 | 12 ± 4.2 | 17 ± 3.1 | 8 ± 0.9 | |
| 3 | 991 ± 0.05 | 12 ± 0.09 | 2128 ± 407.8 | 3160 ± 663.0 | 1716 ± 85.5 | 453 ± 75.3 | 2342 ± 277.2 | 5 ± 1.7 | 26 ± 0.1 | 61 ± 0.9 | 32 ± 1.6 | 19 ± 1.0 | ||
| 6 | 1 | 980 ± 0.04 | 20 ± 0.02 | 3505 ± 97.1 | 5326 ± 0.2 | 1612 ± 164.0 | 264 ± 21.8 | 2384 ± 0.2 | 4 ± 0.1 | 46 ± 0.1 | 26 ± 0.2 | 22 ± 9.7 | 25 ± 6.5 | |
| 2 | White | 991 ± 0.07 | 6 ± 0.02 | 2081 ± 756.2 | 2450 ± 9.3 | 1482 ± 99.3 | 107 ± 30.3 | 143 ± 521.4 | 3 ± 0.5 | 24 ± 0.8 | 16 ± 2.5 | 21 ± 2.8 | 9 ± 3.2 | |
| 3 | 991 ± 0.06 | 12 ± 0.10 | 9199 ± 383.6 | 8442 ± 198.0 | 1688 ± 16.9 | 419 ± 29.1 | 4142 ± 94.2 | 10 ± 1.1 | 28 ± 0.6 | 81 ± 4.2 | 33 ± 1.0 | 32 ± 1.4 | ||
| 7 | 1 | Brown | 894 ± 0.02 | 13 ± 0.01 | 2521 ± 357.1 | 2514 ± 180.8 | 1522 ± 246.2 | 323 ± 153.1 | 1298 ± 336.2 | 5 ± 1.1 | 26 ± 2.2 | 25 ± 4.6 | 27 ± 0.1 | 16 ± 0.1 |
| 2 | 991 ± 0.05 | 12 ± 0.02 | 1861 ± 481.1 | 1397 ± 129.4 | 1251 ± 23.2 | 114 ± 13.6 | 1351 ± 342.2 | 2 ± 0.2 | 18 ± 0.8 | 13 ± 3.5 | 20 ± 4.3 | 11 ± 3.4 | ||
| 3 | 991 ± 0.05 | 19 ± 0.03 | 8130 ± 2209.8 | 8606 ± 947.0 | 1815 ± 237.4 | 494 ± 29.1 | 4542 ± 617.7 | 10 ± 0.5 | 15 ± 2.4 | 67 ± 9.0 | 34 ± 2.7 | 40 ± 6.3 | ||
| 8 | 1 | 984 ± 0.07 | 20 ± 0.02 | 3733 ± 112.3 | 4041 ± 0.24 | 1312 ± 75.0 | 296 ± 1.5 | 2516 ± 0.8 | 6 ± 0.4 | 28 ± 0.3 | 25 ± 0.23 | 29 ± 12.5 | 21 ± 7.4 | |
| 2 | White | 991 ± 0.06 | 9 ± 0.32 | 2958 ± 638.7 | 2945 ± 542.9 | 1141 ± 62.8 | 155 ± 10.9 | 1735 ± 338.5 | 3 ± 0.5 | 26 ± 0.6 | 15 ± 2.8 | 18 ± 1.9 | 15 ± 3.5 | |
| 3 | 991 ± 0.06 | 11 ± 0.11 | 9199 ± 383.6 | 8442 ± 198.0 | 1688 ± 16.9 | 419 ± 29.1 | 4142 ± 94.2 | 10 ± 1.1 | 28 ± 0.6 | 81 ± 4.2 | 33 ± 1.0 | 32 ± 1.4 | ||
| 9 | 1 | 985 ± 0.08 | 12 ± 0.001 | 2742 ± 93.4 | 2547 ± 447.0 | 1347 ± 254.0 | 274 ± 3.8 | 1714 ± 222.4 | 2 ± 0.39 | 31 ± 12.9 | 19 ± 7.9 | 27 ± 0.1 | 24 ± 1.1 | |
| 2 | White | 991 ± 0.06 | 19 ± 0.33 | 2215 ± 644.5 | 2782 ± 55.9 | 1192 ± 48.1 | 173 ± 46.3 | 1316 ± 429.0 | 3 ± 0.3 | 26 ± 0.4 | 16 ± 4.0 | 24 ± 2.0 | 10 ± 2.6 | |
| 3 | 990 ± 0.02 | 10 ± 0.01 | 7564 ± 2281.3 | 4105 ± 1054.7 | 1689 ± 213.7 | 427 ± 31.1 | 4065 ± 590.8 | 13 ± 2.3 | 20 ± 4.0 | 66 ± 17.2 | 40 ± 6.8 | 55 ± 11.4 | ||
| 10 | 1 | White | 983 ± 0.23 | 18 ± 0.003 | 2644 ± 179.1 | 4617 ± 311.0 | 1586 ± 415.4 | 319 ± 298.5 | 1578 ± 254.7 | 4 ± 1.0 | 35 ± 12.0 | 23 ± 7.8 | 28 ± 57.1 | 19 ± 7.9 |
| 2 | 990 ± 0.02 | 14 ± 0.35 | 2165 ± 644.5 | 1659 ± 138.1 | 1402 ± 166.2 | 169 ± 23.6 | 782 ± 2.2 | 1 ± 0.4 | 17 ± 1.1 | 13 ± 4.6 | 22 ± 6.1 | 9 ± 3.6 | ||
| 3 | 990 ± 0.02 | 15 ± 0.39 | 10013 ± 464.3 | 10455 ± 646.6 | 1652 ± 47.4 | 494 ± 111.6 | 4744 ± 363.6 | 14 ± 2.2 | 28 ± 5.5 | 81 ± 5.5 | 41 ± 5.2 | 53 ± 6.6 | ||
| 11 | 1 | 983 ± 0.23 | 8 ± 0.001 | 2390 ± 372.1 | 5261 ± 197.0 | 1562 ± 280 | 335 ± 173.0 | 1712 ± 155.6 | 4 ± 0.5 | 36 ± 8.4 | 23 ± 3.6 | 30 ± 14.7 | 13 ± 2.9 | |
| 2 | Brown | 990 ± 0.02 | 15.5 ± 0.38 | 1981 ± 771.7 | 2820 ± 544.0 | 1331 ± 103.0 | 142 ± 2.4 | 1176 ± 496.2 | 2 ± 0.5 | 48 ± 11.0 | 11 ± 3.8 | 25 ± 2.9 | 8 ± 1.9 | |
| 3 | 990 ± 0.02 | 10 ± 0.26 | 10,019 ± 622.0 | 10,868 ± 94.9 | 1931 ± 95.9 | 488 ± 24.2 | 4045 ± 191.8 | 11 ± 0.2 | 27 ± 3.3 | 78 ± 19.1 | 42 ± 2.7 | 61 ± 4.6 | ||
| 12 | 1 | 986 ± 0.01 | 19 ± 0.50 | 2790 ± 1824.1 | 5524 ± 456.8 | 1044 ± 237.0 | 534 ± 119.5 | 1942 ± 942.3 | 5 ± 2.5 | 37 ± 6.9 | 22 ± 7.0 | 34 ± 10.8 | 20 ± 4.4 | |
| 2 | Brown | 991 ± 0.06 | 12 ± 0.34 | 1315 ± 255.3 | 2753 ± 266.4 | 901 ± 35.5 | 461 ± 24.8 | 929 ± 163.5 | 4 ± 0.2 | 33 ± 2.4 | 13 ± 2.6 | 58 ± 2.5 | 8 ± 1.9 | |
| 3 | 991 ± 0.06 | 18 ± 0.08 | 10259 ± 690.5 | 9067 ± 205.5 | 1688 ± 82.1 | 536 ± 126.9 | 4620 ± 168.1 | 8 ± 0.5 | 147 ± 7.5 | 65 ± 4.5 | 39 ± 3.9 | 37 ± 4.4 | ||
| 13 | 1 | Brown | 985 ± 0.04 | 12 ± 0.01 | 3589 ± 114 | 2936 ± 0.38 | 1244 ± 0.2 | 509 ± 2.2 | 2226 ± 0.2 | 6 ± 0.3 | 44 ± 0.4 | 24 ± 0.2 | 66 ± 12.8 | 15 ± 0.7 |
| 2 | 990 ± 0.05 | 9 ± 0.53 | 2307 ± 611.3 | 1328 ± 136.6 | 1086 ± 47.6 | 415 ± 91.8 | 1424 ± 401.3 | 3 ± 0.1 | 44 ± 14.1 | 14 ± 5.2 | 62 ± 4.7 | 9 ± 2.4 | ||
| 3 | 990 ± 0.02 | 14 ± 0.59 | 4860 ± 240.1 | 6163 ± 368.7 | 1335 ± 44.8 | 425 ± 42.4 | 2994 ± 99.6 | 10 ± 1.9 | 79 ± 17.0 | 52 ± 3.3 | 82 ± 2.6 | 29 ± 5.5 | ||
| 14 | 1 | 985 ± 0.13 | 8 ± 0.001 | 3740 ± 520.9 | 4252 ± 2.7 | 1150 ± 77.2 | 274 ± 4.6 | 1536 ± 0.2 | 4 ± 0.4 | 41 ± 0.20 | 17 ± 0.4 | 73 ± 1.1 | 14 ± 0.1 | |
| 2 | White | 991 ± 0.02 | 0.93 ± 0.16 | 2546 ± 662.8 | 3787 ± 514.5 | 1057 ± 66.3 | 411 ± 11.7 | 1068 ± 290.3 | 2 ± 0.1 | 31 ± 5.5 | 13 ± 3.4 | 43 ± 2.9 | 9 ± 2.9 | |
| 3 | 990 ± 0.02 | 14 ± 0.12 | 9607 ± 1194.0 | 11949 ± 30.2 | 1622 ± 117.4 | 684 ± 29.3 | 4398 ± 520.0 | 14 ± 0.9 | 122 ± 5.9 | 66 ± 3.8 | 91 ± 3.2 | 40 ± 0.2 | ||
| 15 | 1 | 981 ± 0.11 | 15 ± 0.02 | 3667 ± 86.1 | 3443 ± 126.8 | 1095 ± 18.6 | 419 ± 20.0 | 1883 ± 1.0 | 3 ± 0.4 | 50 ± 0.1 | 22 ± 0.1 | 60 ± 8.3 | 15 ± 1.8 | |
| 2 | Brown | 990 ± 0.01 | 8 ± 0.42 | 2279 ± 804.6 | 3056 ± 451.6 | 885 ± 56.9 | 379 ± 31.5 | 1139 ± 395.0 | 2 ± 0.2 | 31 ± 8.3 | 12 ± 4.0 | 57 ± 3.3 | 9 ± 3.0 | |
| 3 | 990 ± 0.02 | 19 ± 0.12 | 7319 ± 841.9 | 6363 ± 636.1 | 1344 ± 149.5 | 574 ± 32.0 | 3079 ± 261.6 | 8 ± 1.7 | 68 ± 17.7 | 42 ± 1.2 | 74 ± 6.9 | 24 ± 3.4 | ||
| 16 | 1 | 985 ± 0.36 | 7.8 ± 0.003 | 3529 ± 1038.1 | 3308 ± 637.2 | 975 ± 94.3 | 611 ± 94.5 | 1747 ± 547.3 | 3 ± 0.9 | 34 ± 5.3 | 18 ± 4.1 | 63 ± 0.8 | 18 ± 1.2 | |
| 2 | Brown | 990 ± 0.06 | 13 ± 0.15 | 1664 ± 937.6 | 2365 ± 221.9 | 1154 ± 3.8 | 500 ± 17.2 | 788 ± 461.6 | 3 ± 0.7 | 21 ± 7.5 | 9 ± 4.9 | 61 ± 2.3 | 5 ± 1.3 | |
| 3 | 991 ± 0.02 | 15 ± 0.09 | 7378 ± 752.8 | 7421 ± 89.3 | 1325 ± 118.2 | 506 ± 21.7 | 3404 ± 81.7 | 4 ± 0.9 | 77 ± 26.1 | 40 ± 7.3 | 73 ± 3.6 | 26 ± 5.7 | ||
| 17 | 1 | 983 ± 0.15 | 13 ± 0.1 | 4285 ± 383.3 | 3308 ± 637.2 | 1154 ± 293.6 | 544 ± 174.2 | 1747 ± 547.3 | 4 ± 0.6 | 49 ± 2.7 | 25 ± 2.8 | 59 ± 9.8 | 16 ± 2.0 | |
| 2 | Brown | 991 ± 0.01 | 15 ± 0.39 | 1777 ± 459.9 | 2354 ± 123.3 | 1118 ± 136.8 | 423 ± 11.7 | 980 ± 249.5 | 2 ± 0.5 | 34 ± 5.7 | 10 ± 2.4 | 53 ± 3.0 | 12 ± 2.0 | |
| 3 | 990 ± 0.07 | 15 ± 0.25 | 6023 ± 558.9 | 6628 ± 1017.2 | 1131 ± 81.5 | 499 ± 24.9 | 2713 ± 483.6 | 10 ± 1.8 | 60 ± 16.0 | 60 ± 9.4 | 75 ± 3.7 | 18 ± 1.4 | ||
| 18 | 1 | 986 ± 0.01 | 12 ± 0.11 | 3723 ± 249.1 | 3526 ± 500.0 | 1236 ± 64.5 | 478 ± 3.1 | 1828 ± 42.6 | 4 ± 0.2 | 51 ± 0.6 | 22 ± 2.3 | 61 ± 6.9 | 15 ± 2.4 | |
| 2 | White | 990 ± 0.01 | 12 ± 0.10 | 2323 ± 433.9 | 1995 ± 349.4 | 935 ± 53.6 | 411 ± 37.6 | 1149 ± 196.8 | 3 ± 0.2 | 35 ± 6.2 | 14 ± 2.3 | 50 ± 0.7 | 10 ± 1.8 | |
| 3 | 990 ± 0.05 | 14 ± 0.41 | 6652 ± 161.1 | 7449 ± 185.4 | 1430 ± 34.8 | 718 ± 21.2 | 3249 ± 215.9 | 6 ± 0.3 | 115 ± 10.8 | 45 ± 3.6 | 77 ± 18.6 | 36 ± 11.8 | ||
| 19 | 1 | 990 ± 0.60 | 10 ± 0.10 | 3001 ± 752.4 | 3521 ± 1008.2 | 1308 ± 177.1 | 265 ± 29.4 | 1684 ± 334.9 | 3 ± 0.6 | 40 ± 0.1 | 17 ± 5.0 | 66 ± 5.0 | 15 ± 3.4 | |
| 2 | Brown | 990 ± 0.07 | 15 ± 0.30 | 2629 ± 907.6 | 2234 ± 744.3 | 757 ± 84.5 | 433 ± 64.4 | 1198 ± 362.6 | 2 ± 0.4 | 28 ± 6.0 | 10 ± 2.4 | 69 ± 4.9 | 7 ± 1.3 | |
| 3 | 99.12 ± 0.01 | 17 ± 0.40 | 8826 ± 492.5 | 7765 ± 542.1 | 1331 ± 85.8 | 767 ± 40.5 | 3434 ± 146.2 | 8 ± 0.7 | 132 ± 12.2 | 53 ± 2.0 | 71 ± 1.8 | 35 ± 4.9 | ||
| 20 | 1 | 984 ± 0.01 | 12 ± 0.17 | 3546 ± 92.1 | 3760 ± 1416.0 | 1022 ± 49.6 | 534 ± 22.2 | 2182 ± 1103.3 | 3 ± 2.2 | 34 ± 0.2 | 16 ± 6.1 | 79 ± 7.1 | 17 ± 10.1 | |
| 2 | Brown | 990 ± 0.05 | 15 ± 0.47 | 2706 ± 650.5 | 3061 ± 795.8 | 757 ± 84.5 | 433 ± 64.4 | 1198 ± 362.6 | 2 ± 0.4 | 28 ± 6.0 | 10 ± 2.4 | 69 ± 4.9 | 7 ± 1.3 | |
| 3 | 990 ± 0.02 | 12 ± 0.53 | 5909 ± 133.4 | 8330 ± 786.5 | 1308 ± 32.4 | 783 ± 52.6 | 3406 ± 293.9 | 10 ± 2.3 | 71 ± 11.5 | 56 ± 4.5 | 81 ± 3.3 | 30 ± 5.6 | ||
| 21 | 1 | 984 ± 0.06 | 10 ± 0.01 | 3792 ± 123.2 | 4014 ± 11.3 | 1179 ± 19.0 | 426 ± 4.0 | 1523 ± 0.0 | 4 ± 0.1 | 48 ± 0.2 | 15 ± 0.1 | 7 ± 0.2 | 16 ± 0.1 | |
| 2 | White | 990 ± 0.05 | 15 ± 0.39 | 2471 ± 530.7 | 2412 ± 373.3 | 1119 ± 136.8 | 398 ± 14.5 | 1044 ± 211.1 | 3 ± 0.1 | 35 ± 3.6 | 10 ± 0.6 | 68 ± 4.6 | 5 ± 1.7 | |
| 3 | 990 ± 0.02 | 12 ± 0.53 | 83,322 ± 878.9 | 10,177 ± 1035.2 | 1206 ± 160.0 | 721 ± 130.8 | 3856 ± 504.6 | 6 ± 0.5 | 121 ± 10.6 | 45 ± 2.8 | 93 ± 8.2 | 40 ± 2.1 | ||
| Ground grains | - | - | 0.23 | <0.001 | <0.001 | <0.001 | <0.001 | <0.001 | 0.28 | <0.001 | <0.001 | 0.001 | 0.02 | <0.001 |
| Endosperm | - | - | <0.001 | <0.001 | 0.79 | 0.81 | <0.001 | <0.001 | 0.05 | <0.001 | 0.43 | 0.88 | 0.28 | 0.54 |
| Bran | - | - | <0.001 | 0.52 | 0.36 | <0.001 | 0.03 | 0.55 | <0.001 | 0.54 | 0.53 | 0.32 | 0.04 | 0.05 |
| Codes | Processed Grains | Pericarp Color | D.M g/kg−1 | Protein g/kg−1 | P mg/kg−1 | K mg/kg−1 | S mg/kg−1 | Ca mg/kg−1 | Mg mg/kg−1 | Cu mg/kg | Fe mg/kg−1 | Zn mg/kg−1 | Na mg/kg−1 | Mn mg/kg−1 |
|---|---|---|---|---|---|---|---|---|---|---|---|---|---|---|
| 22 | 1 | Brown | 981 ± 0.06 | 13 ± 0.01 | 2263 ± 306.2 | 4642 ± 375.2 | 1241 ± 370.0 | 661 ± 248.6 | 1159 ± 890.0 | 7 ± 0.1 | 26 ± 3.5 | 21 ± 9.7 | 74 ± 7.9 | 19 ± 6.0 |
| 2 | 991 ± 0.05 | 9 ± 0.07 | 1654 ± 280.7 | 2239 ± 386.0 | 757 ± 84.5 | 409 ± 4.5 | 885 ± 154.2 | 2 ± 0.4 | 23 ± 0.3 | 10 ± 0.1 | 68 ± 4.6 | 10 ± 0.9 | ||
| 3 | 990 ± 0.02 | 13 ± 0.53 | 10486 ± 737.6 | 9869 ± 673.8 | 1462 ± 144.0 | 741 ± 208.1 | 3585 ± 245.2 | 8 ± 0.1 | 136 ± 3.4 | 42 ± 1.5 | 78 ± 4.3 | 43 ± 3.0 | ||
| 23 | 1 | White | 986 ± 0.03 | 11 ± 0.10 | 2762 ± 184.2 | 3012 ± 797.5 | 815 ± 192.0 | 475 ± 132.0 | 1450 ± 416.4 | 4 ± 1.0 | 28 ± 5.3 | 24 ± 7.9 | 64 ± 8.9 | 23 ± 6.2 |
| 2 | 991 ± 0.49 | 14 ± 0.22 | 1343 ± 467.4 | 1891 ± 381.2 | 715 ± 53.9 | 412 ± 34.4 | 711 ± 248.8 | 3 ± 0.5 | 41 ± 0.4 | 9 ± 3.3 | 64 ± 2.8 | 6 ± 1.1 | ||
| 3 | 993 ± 0.32 | 10 ± 0.39 | 7802 ± 266.5 | 9784 ± 1094.4 | 1728 ± 166.5 | 775 ± 124.3 | 3718 ± 549.5 | 16 ± 1.6 | 44 ± 7.2 | 78 ± 10.2 | 84 ± 8.7 | 21 ± 3.9 | ||
| 24 | 1 | White | 987 ± 0.98 | 19 ± 0.12 | 3741 ± 1127.1 | 4660 ± 2206.3 | 1000 ± 32.2 | 523 ± 133.3 | 1395 ± 176.4 | 5 ± 0.1 | 30 ± 9.9 | 22 ± 4.1 | 70 ± 5.6 | 17 ± 9.9 |
| 2 | 990 ± 3.45 | 9.3 ± 0.12 | 2232 ± 280.1 | 2113 ± 215.9 | 989 ± 34.5 | 431 ± 36.1 | 1318 ± 146.4 | 3 ± 0.2 | 27 ± 7.0 | 8 ± 3.5 | 67 ± 3.5 | 13 ± 2.6 | ||
| 3 | 991 ± 0.44 | 8 ± 0.02 | 8046 ± 737.1 | 9362 ± 744.1 | 1226 ± 135.3 | 770 ± 93.8 | 3491 ± 125.0 | 11 ± 1.0 | 79 ± 6.6 | 64 ± 5.5 | 77 ± 4.2 | 37 ± 3.6 | ||
| 25 | 1 | White | 984 ± 0.24 | 14 ± 0.02 | 3105 ± 66.0 | 3234 ± 170.8 | 1046 ± 16.0 | 554 ± 0.5 | 1611 ± 0.7 | 3 ± 0.9 | 51 ± 0.1 | 23 ± 0.1 | 64 ± 0.0 | 12 ± 0.1 |
| 2 | 991 ± 0.01 | 14 ± 0.01 | 1317 ± 570.9 | 1406 ± 449.9 | 804 ± 54.1 | 389 ± 6.1 | 703 ± 315.5 | 3 ± 0.5 | 24 ± 0.1 | 6 ± 2.0 | 54 ± 1.9 | 8 ± 0.9 | ||
| 3 | 991 ± 0.07 | 16 ± 1.3 | 5561 ± 1002.1 | 6977 ± 401.5 | 1091 ± 111.8 | 708 ± 51.6 | 2842 ± 389.7 | 10 ± 0.7 | 75 ± 10.6 | 51 ± 7.0 | 85 ± 9.2 | 26 ± 3.9 | ||
| 26 | 1 | White | 985 ± 0.08 | 13 ± 0.04 | 2453 ± 313.1 | 3253 ± 1483.5 | 996 ± 202.0 | 4438 ± 123.3 | 2718 ± 949.4 | 4 ± 0.1 | 54 ± 0.4 | 27 ± 2.1 | 66 ± 8.4 | 22 ± 8.2 |
| 2 | 990 ± 0.12 | 11 ± 0.05 | 999 ± 218.6 | 1390 ± 201.2 | 877 ± 75.2 | 370 ± 90.1 | 517 ± 122.6 | 3 ± 0.8 | 35 ± 6.0 | 6 ± 2.0 | 61 ± 5.7 | 13 ± 0.2 | ||
| 3 | 993 ± 0.02 | 20 ± 0.77 | 7467 ± 249.9 | 7749 ± 584.7 | 1182 ± 190.3 | 698 ± 40.3 | 3253 ± 250.8 | 11 ± 1.2 | 97 ± 4.2 | 67 ± 4.6 | 80 ± 9.4 | 35 ± 1.4 | ||
| 27 | 1 | White | 985 ± 0.08 | 132 ± 0.10 | 2069 ± 11.0 | 3253 ± 1483.5 | 1160 ± 13.0 | 609 ± 0.9 | 1264 ± 0.1 | 4 ± 1.3 | 29 ± 0.0 | 16 ± 0.1 | 79 ± 1.0 | 17 ± 0.1 |
| 2 | 990 ± 0.03 | 118 ± 0.18 | 1670 ± 338.6 | 2690 ± 429.4 | 1048 ± 56.9 | 476 ± 98.7 | 1007 ± 198.5 | 4 ± 0.5 | 59 ± 0.3 | 12 ± 2.5 | 67 ± 6.1 | 9 ± 0.34 | ||
| 3 | 991 ± 0.05 | 10.0 ± 0.50 | 6635 ± 441.6 | 8964 ± 1260.2 | 1289 ± 103.2 | 648 ± 15.7 | 3383 ± 360.7 | 10 ± 1.5 | 92 ± 16.8 | 72 ± 16.8 | 82 ± 3.2 | 35 ± 4.0 | ||
| 28 | 1 | White | 983 ± 0.01 | 13 ± 0.10 | 2546 ± 392.2 | 2589 ± 291.0 | 1106 ± 349.1 | 599 ± 233.7 | 1434 ± 389.2 | 2 ± 0.3 | 40 ± 10.2 | 35 ± 24.2 | 70 ± 9.5 | 28 ± 0.8 |
| 2 | 990 ± 0.30 | 12 ± 0.31 | 2230 ± 358.5 | 2459 ± 292.4 | 896 ± 21.0 | 450 ± 71.1 | 1070 ± 210.0 | 3 ± 0.4 | 41 ± 7.7 | 11 ± 2.7 | 64 ± 2.0 | 7 ± 0.9 | ||
| 3 | 991 ± 0.08 | 21 ± 0.78 | 5079 ± 440.9 | 7773 ± 306.8 | 1724 ± 70.4 | 619 ± 54.7 | 2736 ± 106.0 | 10 ± 0.3 | 93 ± 17.2 | 45 ± 4.9 | 86 ± 7.9 | 42 ± 3.8 | ||
| 29 | 1 | White | 981 ± 0.01 | 11 ± 0.10 | 2766 ± 219.3 | 3043 ± 681.0 | 1262 ± 327 | 592 ± 220.1 | 1218 ± 217.3 | 4 ± 0.8 | 40 ± 7.6 | 37 ± 29.7 | 65 ± 7.1 | 24 ± 4.7 |
| 2 | 990 ± 0.04 | 14 ± 0.14 | 2356 ± 425.2 | 2668 ± 330.5 | 1066 ± 42.6 | 432 ± 55.9 | 1306 ± 142.3 | 3 ± 0.5 | 40 ± 3.9 | 16 ± 0.6 | 61 ± 2.0 | 7 ± 1.7 | ||
| 3 | 990 ± 0.02 | 17 ± 1.12 | 8184 ± 2356.8 | 10,249 ± 799.8 | 1594 ± 121.3 | 7100 ± 26.2 | 3411 ± 354.9 | 12 ± 1.3 | 121 ± 17.2 | 68 ± 8.2 | 79 ± 7.7 | 30 ± 2.4 | ||
| 30 | 1 | White | 981 ± 1.01 | 7.0 ± 0.05 | 4299 ± 317.9 | 2704 ± 175.9 | 892 ± 212.1 | 566 ± 94.2 | 1464 ± 311.8 | 3 ± 0.7 | 56 ± 27.5 | 16 ± 12.0 | 77 ± 8.9 | 23 ± 7.4 |
| 2 | 990 ± 0.20 | 14 ± 0.15 | 1946 ± 528.2 | 2188 ± 352.5 | 765 ± 48.5 | 483 ± 55.5 | 1045 ± 250.1 | 3 ± 0.5 | 40 ± 36.5 | 10 ± 2.3 | 64 ± 8.1 | 8 ± 2.2 | ||
| 3 | 991 ± 0.05 | 15 ± 0.003 | 8682 ± 1384.8 | 9980 ± 435.5 | 1745 ± 148.0 | 935 ± 103.4 | 3995 ± 49.0 | 14 ± 2.0 | 92 ± 6.8 | 71 ± 5.6 | 93 ± 9.5 | 30 ± 1.9 | ||
| 31 | 1 | White | 980 ± 0.46 | 10 ± 0.01 | 2060 ± 540.1 | 6371 ± 452.4 | 1140 ± 316.2 | 518 ± 217.0 | 1674 ± 335.0 | 4 ± 0.8 | 59 ± 27.4 | 22 ± 6.9 | 78 ± 10.9 | 17 ± 8.1 |
| 2 | 991 ± 0.03 | 13 ± 0.30 | 1980 ± 574.6 | 2430 ± 467.7 | 954 ± 78.5 | 385 ± 80.9 | 1038 ± 268.0 | 3 ± 0.62 | 43 ± 5.7 | 11 ± 3.4 | 64 ± 8.1 | 8 ± 2.2 | ||
| 3 | 991 ± 0.07 | 19 ± 0.36 | 9473 ± 711.0 | 9589 ± 1128.2 | 1281 ± 184.2 | 993 ± 80.1 | 3412 ± 204.3 | 10 ± 0.8 | 93 ± 5.0 | 53 ± 5.6 | 91 ± 5.6 | 28 ± 4.1 | ||
| 32 | 1 | White | 987 ± 0.16 | 16 ± 0.03 | 2780 ± 864.0 | 3709 ± 1972.9 | 1016 ± 153.0 | 485 ± 6.8 | 1483 ± 395.9 | 4 ± 1.5 | 45 ± 6.1 | 28 ± 12.6 | 67 ± 9.1 | 23 ± 7.0 |
| 2 | 991 ± 0.03 | 12 ± 0.08 | 2402 ± 655.9 | 2596 ± 614.7 | 933 ± 89.0 | 450 ± 71.1 | 1165 ± 309.9 | 3 ± 0.5 | 50 ± 6.6 | 11 ± 3.3 | 61 ± 1.9 | 7 ± 1.4 | ||
| 3 | 991 ± 0.01 | 13 ± 0.23 | 8755 ± 1848.8 | 11658 ± 696.1 | 1597 ± 137.5 | 802 ± 156.3 | 4074 ± 233.3 | 12 ± 1.7 | 107 ± 12.6 | 58 ± 5.8 | 81 ± 5.2 | 38 ± 4.6 | ||
| 33 | 1 | White | 980 ± 0.21 | 12 ± 1.06 | 2995 ± 83.8 | 5270 ± 349.1 | 1188 ± 292.0 | 463 ± 143.3 | 1477 ± 333.5 | 4 ± 1.5 | 46 ± 4.7 | 26 ± 2.9 | 67 ± 8.0 | 17 ± 1.8 |
| 2 | 990 ± 0.11 | 12 ± 0.19 | 2566 ± 491.3 | 2269 ± 399.1 | 1013 ± 507.0 | 382 ± 24.5 | 1311 ± 215.5 | 3 ± 0.2 | 33 ± 9.5 | 11 ± 2.2 | 64 ± 6.6 | 9 ± 1.4 | ||
| 3 | 980 ± 0.10 | 16 ± 0.35 | 7998 ± 682.2 | 9301 ± 604.5 | 1263 ± 127.6 | 928 ± 122.3 | 3132 ± 90.6 | 7 ± 1.1 | 87 ± 7.3 | 46 ± 4.3 | 81 ± 9.4 | 26 ± 1.9 | ||
| 34 | 1 | White | 982 ± 0.19 | 10 ± 0.01 | 3020 ± 943.2 | 2894 ± 840.2 | 998 ± 159.0 | 450 ± 76.4 | 1905 ± 646.2 | 4 ± 1.6 | 41 ± 14.9 | 26 ± 3.4 | 70 ± 9.0 | 15 ± 2.1 |
| 2 | 990 ± 0.05 | 19 ± 0.03 | 1974 ± 291.2 | 2677 ± 287.9 | 900 ± 45.8 | 365 ± 87.0 | 1084 ± 154.7 | 2 ± 0.4 | 50 ± 6.6 | 12 ± 1.9 | 65 ± 2.2 | 8 ± 2.0 | ||
| 3 | 990 ± 0.03 | 18 ± 0.15 | 9399 ± 810.6 | 9283 ± 226.2 | 1499 ± 4.1 | 558 ± 76.5 | 3837 ± 126.3 | 13 ± 1.0 | 72 ± 8.9 | 59 ± 9.4 | 85 ± 6.8 | 27 ± 2.7 | ||
| 35 | 1 | White | 987 ± 0.02 | 16 ± 0.30 | 3337 ± 523.2 | 2894 ± 840.2 | 1051 ± 237.1 | 278 ± 159.4 | 1544 ± 326.3 | 5 ± 2.1 | 38 ± 13.6 | 22 ± 7.6 | 38 ± 5.0 | 14 ± 4.0 |
| 2 | 989 ± 0.01 | 12 ± 0.34 | 2368 ± 526.1 | 2447 ± 448.5 | 907 ± 50.4 | 186 ± 11.2 | 1144 ± 257.1 | 2 ± 0.4 | 39 ± 14.4 | 11 ± 0.3 | 35 ± 1.4 | 8 ± 2.0 | ||
| 3 | 989 ± 0.50 | 17 ± 0.09 | 4729 ± 790.3 | 8445 ± 792.6 | 1279 ± 135.4 | 768 ± 165.6 | 2656 ± 187.7 | 8 ± 0.9 | 90 ± 7.1 | 37 ± 3.9 | 44 ± 1.3 | 26 ± 2.9 | ||
| 36 | 1 | White | 980 ± 0.01 | 14 ± 0.12 | 2692 ± 598.4 | 3295 ± 1472.3 | 1123 ± 236.6 | 288 ± 178 | 2135 ± 869.4 | 3 ± 0.5 | 36 ± 11.6 | 22 ± 7.6 | 41 ± 2.4 | 17 ± 1.5 |
| 2 | 990 ± 0.06 | 8.5 ± 0.70 | 2501 ± 568.3 | 2457 ± 450.9 | 987 ± 63.1 | 179 ± 21.4 | 1153 ± 218.3 | 2 ± 0.2 | 32 ± 9.9 | 12 ± 2.6 | 39 ± 1.3 | 7 ± 1.6 | ||
| 3 | 99.0 ± 0.23 | 16 ± 0.01 | 7839 ± 812.7 | 8976 ± 429.2 | 1385 ± 97.1 | 631 ± 113.1 | 3377 ± 124.9 | 12 ± 1.4 | 77 ± 3.9 | 53 ± 1.6 | 45 ± 2.9 | 28 ± 0.9 | ||
| 37 | 1 | White | 983 ± 0.01 | 11 ± 0.00 | 2375 ± 1462.0 | 4846 ± 381.7 | 1062 ± 180.1 | 291 ± 22.0 | 1800 ± 902.3 | 5 ± 4.2 | 31 ± 12.3 | 22.6.6 | 38 ± 7.8 | 19 ± 6.0 |
| 2 | 991 ± 0.03 | 13 ± 0.07 | 1554 ± 471.1 | 2122 ± 470.0 | 958 ± 80.6 | 214 ± 33.0 | 730 ± 264.5 | 2 ± 1.0 | 32 ± 12.7 | 11 ± 3.8 | 34 ± 4.0 | 7 ± 2.1 | ||
| 3 | 990 ± 0.54 | 12 ± 0.25 | 8624 ± 809.5 | 9042 ± 296.9 | 1437 ± 93.3 | 523 ± 75.7 | 3198 ± 190.0 | 10 ± 0.6 | 89 ± 3.9 | 54 ± 1.6 | 49 ± 3.8 | 27 ± 0.5 | ||
| 38 | 1 | White | 987 ± 0.01 | 73 ± 0.02 | 3254 ± 361.1 | 2681 ± 271.3 | 960 ± 165.2 | 518 ± 122.0 | 1705 ± 237.8 | 5 ± 1.3 | 28 ± 1.8 | 21 ± 7.4 | 62 ± 7.2 | 18 ± 8.7 |
| 2 | 990 ± 0.06 | 12 ± 0.88 | 1130 ± 148.5 | 202 ± 411.0 | 856 ± 21.4 | 431 ± 40.0 | 721 ± 25.3 | 3 ± 0.5 | 36 ± 19.2 | 10 ± 2.8 | 57 ± 2.2 | 6 ± 4.0 | ||
| 3 | 990 ± 0.76 | 18 ± 0.25 | 8105 ± 277.5 | 8076 ± 1118.7 | 1391 ± 176.4 | 585 ± 110.0 | 3107 ± 387.9 | 10 ± 0.8 | 94 ± 7.3 | 56 ± 3.9 | 72 ± 3.6 | 34 ± 1.0 | ||
| 39 | 1 | White | 982 ± 0.21 | 13 ± 0.05 | 4348 ± 274.0 | 4448 ± 3570.5 | 1113 ± 169.0 | 403 ± 9.9 | 1362 ± 173.9 | 4 ± 0.4 | 36 ± 8.6 | 20 ± 4.3 | 62 ± 8.3 | 13 ± 4.5 |
| 2 | 991 ± 0.03 | 10 ± 0.15 | 2753 ± 367.9 | 2369 ± 233.3 | 1007 ± 23.3 | 312 ± 78.8 | 1329 ± 184.8 | 3 ± 0.6 | 32 ± 4.5 | 13 ± 1.7 | 57 ± 3.2 | 9 ± 1.0 | ||
| 3 | 993 ± 0.42 | 17 ± 0.11 | 8304 ± 1036.8 | 9951 ± 1241.5 | 1242 ± 120.6 | 605 ± 76.0 | 3772 ± 189.2 | 12 ± 0.5 | 88 ± 4.7 | 56 ± 5.1 | 76 ± 6.7 | 32 ± 1.7 | ||
| 40 | 1 | White | 985 ± 0.03 | 11 ± 0.10 | 3097 ± 607.2 | 3797 ± 1549.2 | 1039 ± 159.9 | 339 ± 181.0 | 1478 ± 331.8 | 3 ± 1.3 | 45 ± 29.0 | 27 ± 4.6 | 54 ± 14.6 | 23 ± 4.7 |
| 2 | 991 ± 0.44 | 16 ± 0.50 | 1623 ± 10.0 | 1935 ± 0.7 | 897 ± 0.1 | 169 ± 6.5 | 836 ± 0.3 | 2 ± 0.0 | 29 ± 0.1 | 8 ± 0.3 | 39 ± 0.1 | 8 ± 1.1 | ||
| 3 | 991 ± 0.22 | 17 ± 0.08 | 8420 ± 1164.2 | 8523 ± 118.2 | 1352 ± 74.4 | 626 ± 17.3 | 3534 ± 205.8 | 13 ± 1.2 | 101 ± 26.0 | 54 ± 2.3 | 71 ± 4.0 | 31 ± 1.8 | ||
| 41 | 1 | White | 985 ± 0.03 | 18 ± 0.01 | 2826 ± 573.1 | 3494 ± 1644.0 | 1095 ± 175.4 | 372 ± 34.6 | 1419 ± 199.1 | 3 ± 1.0 | 36 ± 8.8 | 16 ± 4.1 | 44 ± 27.3 | 14 ± 3.3 |
| 2 | 990 ± 0.05 | 10 ± 0.12 | 1780 ± 501.6 | 1822 ± 434.0 | 1046 ± 84.1 | 180 ± 125.6 | 922 ± 282.4 | 3 ± 0.4 | 29 ± 6.8 | 10 ± 2.6 | 24 ± 1.5 | 8 ± 2.5 | ||
| 3 | 991 ± 0.28 | 13 ± 0.23 | 7162 ± 106.8 | 8171 ± 47.7 | 1233 ± 40.7 | 678 ± 195.6 | 3432 ± 73.5 | 8 ± 0.1 | 100 ± 0.1 | 49 ± 9.5 | 36 ± 3.6 | 35 ± 1.6 | ||
| 42 | 1 | White | 986 ± 0.02 | 15 ± 0.04 | 3324 ± 1692.0 | 5285 ± 2440.3 | 1269 ± 256.2 | 605 ± 254.2 | 1188 ± 125.8 | 4 ± 2.2 | 45 ± 7.4 | 40 ± 31.4 | 53 ± 18.0 | 13 ± 1.8 |
| 2 | 99.1 ± 0.02 | 16 ± 0.32 | 2492 ± 861.3 | 2522 ± 704.7 | 1037 ± 73.4 | 365 ± 132.1 | 968 ± 308.0 | 2 ± 0.7 | 29 ± 6.8 | 14 ± 48.2 | 51 ± 9.1 | 8 ± 2.7 | ||
| 3 | 990 ± 0.82 | 20 ± 0.68 | 7162 ± 870.8 | 8003 ± 195.9 | 1224 ± 146.2 | 641 ± 127.0 | 3379 ± 191.8 | 6 ± 0.3 | 112 ± 4.2 | 48 ± 4.0 | 76 ± 10.3 | 35 ± 2.9 | ||
| 43 | 1 | White | 985 ± 0.01 | 10 ± 0.01 | 3657 ± 1946.0 | 5879 ± 2889.8 | 1188 ± 256.3 | 555 ± 291.0 | 1948 ± 808.9 | 6 ± 2.6 | 34 ± 10.5 | 24 ± 8.1 | 58 ± 14.7 | 23 ± 8.5 |
| 2 | 991 ± 0.01 | 10 ± 0.44 | 1878 ± 501.2 | 2501 ± 496.8 | 1037 ± 73.4 | 480 ± 83.2 | 1035 ± 275.4 | 3 ± 0.6 | 29 ± 6.5 | 12 ± 3.7 | 53 ± 6.3 | 7 ± 1.9 | ||
| 3 | 990 ± 0.06 | 15 ± 0.23 | 10979 ± 1088.0 | 11084 ± 622.9 | 1643 ± 115.1 | 567 ± 101.0 | 4099 ± 138.9 | 13 ± 2.1 | 76 ± 4.7 | 78 ± 3.8 | 79 ± 8.9 | 44 ± 0.3 | ||
| 44 | 1 | White | 985 ± 0.01 | 10 ± 0.08 | 3699 ± 1957.2 | 2632 ± 497.4 | 1209 ± 222.1 | 500 ± 170.5 | 1987 ± 779.3 | 4 ± 1.8 | 39 ± 15.1 | 25 ± 6.6 | 59 ± 17.0 | 16 ± 4.6 |
| 2 | 990 ± 0.00 | 8.8 ± 0.48 | 2194 ± 550.9 | 2491 ± 529.5 | 1161 ± 59.9 | 338 ± 48.3 | 1062 ± 273.4 | 3 ± 0.6 | 32 ± 7.2 | 15 ± 2.4 | 46 ± 5.0 | 9 ± 1.5 | ||
| 3 | 990 ± 0.01 | 24 ± 0.85 | 6012 ± 241.1 | 9196 ± 645.7 | 1506 ± 122.4 | 958 ± 83.7 | 2936 ± 144.9 | 9 ± 0.5 | 77 ± 5.6 | 41 ± 2.5 | 87 ± 9.9 | 25 ± 2.3 | ||
| 45 | 1 | White | 984 ± 0.07 | 10 ± 0.06 | 2384 ± 280.0 | 2968 ± 815.4 | 1086 ± 23.6 | 449 ± 121.8 | 1458 ± 313.6 | 3 ± 0.7 | 34 ± 7.8 | 17 ± 3.6 | 58 ± 14.1 | 19 ± 1.0 |
| 2 | 991 ± 0.03 | 9.2 ± 0.36 | 1320 ± 432.4 | 1767 ± 487.3 | 933 ± 99.2 | 405 ± 21.6 | 729 ± 289.0 | 2 ± 0.5 | 25 ± 7.3 | 11 ± 2.8 | 63 ± 0.9 | 6 ± 2.0 | ||
| 3 | 991 ± 0.26 | 18 ± 0.64 | 6829 ± 1079.8 | 9047 ± 403.7 | 1449 ± 56.2 | 853 ± 32.0 | 2904 ± 116.6 | 9 ± 0.4 | 100 ± 11.4 | 49 ± 0.6 | 74 ± 0.8 | 28 ± 1.0 | ||
| 46 | 1 | White | 985 ± 0.10 | 18 ± 0.03 | 2532 ± 271 | 4341 ± 1161.4 | 1121 ± 260.9 | 513 ± 97.2 | 2117 ± 918.6 | 4 ± 2.2 | 40 ± 14.5 | 20 ± 1.7 | 75 ± 9.7 | 17 ± 2.6 |
| 2 | 990 ± 0.04 | 7 ± 0.35 | 1380 ± 359.8 | 1620 ± 317.6 | 849 ± 33.7 | 410 ± 43.7 | 772 ± 214.0 | 3 ± 0.3 | 23 ± 4.2 | 9 ± 2.5 | 68 ± 4.6 | 5 ± 1.4 | ||
| 3 | 990 ± 0.88 | 14 ± 0.09 | 6737 ± 272.6 | 9543 ± 628.0 | 1567 ± 31.6 | 747 ± 83.2 | 3102 ± 128.5 | 7 ± 0.6 | 79 ± 4.8 | 50 ± 2.6 | 88 ± 4.5 | 26 ± 0.9 | ||
| 47 | 1 | White | 986 ± 0.63 | 17 ± 0.04 | 1801 ± 641.1 | 3155 ± 297.8 | 1056 ± 325.2 | 508 ± 126.7 | 1852 ± 853.4 | 4 ± 1.7 | 39 ± 5.3 | 21 ± 8.0 | 67 ± 10.9 | 16 ± 3.4 |
| 2 | 981 ± 0.11 | 13 ± 0.12 | 1787 ± 433.6 | 2731 ± 595.1 | 849 ± 62.1 | 480 ± 14.3 | 940 ± 235.8 | 3 ± 0.1 | 28 ± 5.7 | 10 ± 2.3 | 53 ± 4.0 | 11 ± 2.6 | ||
| 3 | 991 ± 0.02 | 15 ± 0.30 | 6695 ± 170.0 | 8038 ± 561.7 | 1401 ± 23.9 | 683 ± 65.7 | 3147 ± 109.1 | 9 ± 0.4 | 77 ± 4.2 | 44 ± 2.8 | 87 ± 10.3 | 26 ± 2.3 | ||
| 48 | 1 | White | 985 ± 0.30 | 18 ± 0.52 | 3090 ± 593.8 | 3001 ± 686.4 | 934 ± 115.0 | 492 ± 17.2 | 1553 ± 154.5 | 4 ± 1.0 | 49 ± 1.4 | 21 ± 5.8 | 58 ± 7.0 | 14 ± 4.0 |
| 2 | 991 ± 0.05 | 12 ± 0.28 | 1360 ± 471.4 | 1434 ± 508.1 | 858 ± 22.4 | 478 ± 83.3 | 523 ± 303.4 | 2 ± 0.5 | 20 ± 7.4 | 6 ± 2.3 | 53 ± 5.9 | 4 ± 2.0 | ||
| 3 | 990 ± 0.78 | 15 ± 0.05 | 6198 ± 183.4 | 9407 ± 821.4 | 1417 ± 14.1 | 657 ± 65.7 | 2923 ± 730.0 | 7 ± 1.3 | 80 ± 9.7 | 36 ± 2.1 | 87 ± 12.1 | 38 ± 0.8 | ||
| 49 | 1 | White | 987 ± 0.04 | 10 ± 0.36 | 2898 ± 420.0 | 2978 ± 343.2 | 1043 ± 327.0 | 549 ± 134.3 | 2047 ± 115.2 | 3 ± 0.70 | 40 ± 7.1 | 20 ± 6.0 | 62 ± 10.0 | 19 ± 6.2 |
| 2 | 991 ± 0.01 | 13 ± 0.01 | 1364 ± 507.3 | 1628 ± 318.8 | 820 ± 43.3 | 475 ± 126.4 | 719 ± 300.4 | 2 ± 0.5 | 24 ± 7.5 | 9 ± 3.7 | 56 ± 8.4 | 4 ± 1.5 | ||
| 3 | 991 ± 0.10 | 13 ± 0.10 | 9904 ± 197.1 | 9266 ± 915.8 | 1311 ± 19.3 | 670 ± 46.9 | 3395 ± 194.4 | 10 ± 2.0 | 98 ± 7.2 | 59 ± 7.3 | 77 ± 3.5 | 29 ± 1.5 | ||
| 50 | 1 | White | 988 ± 0.34 | 16 ± 0.05 | 2887 ± 0.15 | 3867 ± 1131.4 | 954 ± 66.1 | 635 ± 13.0 | 1326 ± 16.0 | 4 ± 0.6 | 34 ± 0.4 | 15 ± 1.0 | 64 ± 5.0 | 10 ± 0.2 |
| 2 | 990 ± 0.02 | 12 ± 0.28 | 1103 ± 412.2 | 1482 ± 287.8 | 734 ± 26.7 | 400 ± 78.9 | 531 ± 230.4 | 2 ± 0.5 | 17 ± 4.7 | 5 ± 2.0 | 55 ± 3.6 | 5 ± 0.3 | ||
| 3 | 991 ± 0.24 | 15 ± 0.16 | 7989 ± 770.3 | 7582 ± 187.9 | 1506 ± 15.5 | 652 ± 28.2 | 3733 ± 220.5 | 11 ± 3.1 | 99 ± 5.9 | 6 ± 0.2 | 58 ± 5.7 | 59 ± 2.5 | ||
| 51 | 1 | White | 982 ± 0.01 | 20 ± 0.04 | 3307 ± 1252.0 | 3058 ± 638.0 | 1029 ± 258.0 | 520 ± 111.0 | 1907 ± 654.4 | 3 ± 0.8 | 40 ± 11.1 | 24 ± 7.0 | 68 ± 14.5 | 15 ± 3.8 |
| 2 | 991 ± 0.02 | 9 ± 0.14 | 1580 ± 265.9 | 2726 ± 379.1 | 875 ± 48.7 | 448 ± 23.1 | 929 ± 5.5 | 3 ± 0.1 | 33 ± 4.5 | 12 ± 3.9 | 61 ± 9.0 | 8 ± 0.8 | ||
| 3 | 990 ± 0.30 | 14 ± 0.63 | 12,380 ± 227.3 | 8760 ± 631.8 | 1519 ± 86.4 | 773 ± 121.9 | 653 ± 45.2 | 8 ± 0.5 | 58 ± 7.1 | 29 ± 2.5 | 63 ± 12.3 | 34 ± 8.2 | ||
| Ground grains | - | - | <0.001 | <0.001 | 0.58 | 0.81 | 0.32 | 0.55 | 0.02 | 0.04 | 0.05 | 0.53 | <0.001 | 0.28 |
| Endosperm | - | - | <0.001 | <0.001 | 0.76 | 0.08 | <0.001 | <0.001 | 0.93 | 0.54 | <0.001 | 0.88 | <0.001 | 0.04 |
| Bran | - | - | <0.001 | 0.20 | 0.69 | 0.73 | 0.30 | 0.55 | <0.001 | 0.05 | 0.53 | 0.006 | 0.04 | 0.02 |
Disclaimer/Publisher’s Note: The statements, opinions and data contained in all publications are solely those of the individual author(s) and contributor(s) and not of MDPI and/or the editor(s). MDPI and/or the editor(s) disclaim responsibility for any injury to people or property resulting from any ideas, methods, instructions or products referred to in the content. |
© 2024 by the authors. Licensee MDPI, Basel, Switzerland. This article is an open access article distributed under the terms and conditions of the Creative Commons Attribution (CC BY) license (https://creativecommons.org/licenses/by/4.0/).
Share and Cite
Khalfalla, M.; Zsombik, L.; Győri, Z. Revealing Consequences of the Husking Process on Nutritional Profiles of Two Sorghum Races on the Male Sterility Line. Foods 2024, 13, 1100. https://doi.org/10.3390/foods13071100
Khalfalla M, Zsombik L, Győri Z. Revealing Consequences of the Husking Process on Nutritional Profiles of Two Sorghum Races on the Male Sterility Line. Foods. 2024; 13(7):1100. https://doi.org/10.3390/foods13071100
Chicago/Turabian StyleKhalfalla, Maha, László Zsombik, and Zoltán Győri. 2024. "Revealing Consequences of the Husking Process on Nutritional Profiles of Two Sorghum Races on the Male Sterility Line" Foods 13, no. 7: 1100. https://doi.org/10.3390/foods13071100
APA StyleKhalfalla, M., Zsombik, L., & Győri, Z. (2024). Revealing Consequences of the Husking Process on Nutritional Profiles of Two Sorghum Races on the Male Sterility Line. Foods, 13(7), 1100. https://doi.org/10.3390/foods13071100