

Green Fruit Detection with a Small Dataset under a Similar Color Background Based on the Improved YOLOv5-AT
 and
and
Abstract
1. Introduction
2. Materials and Methods
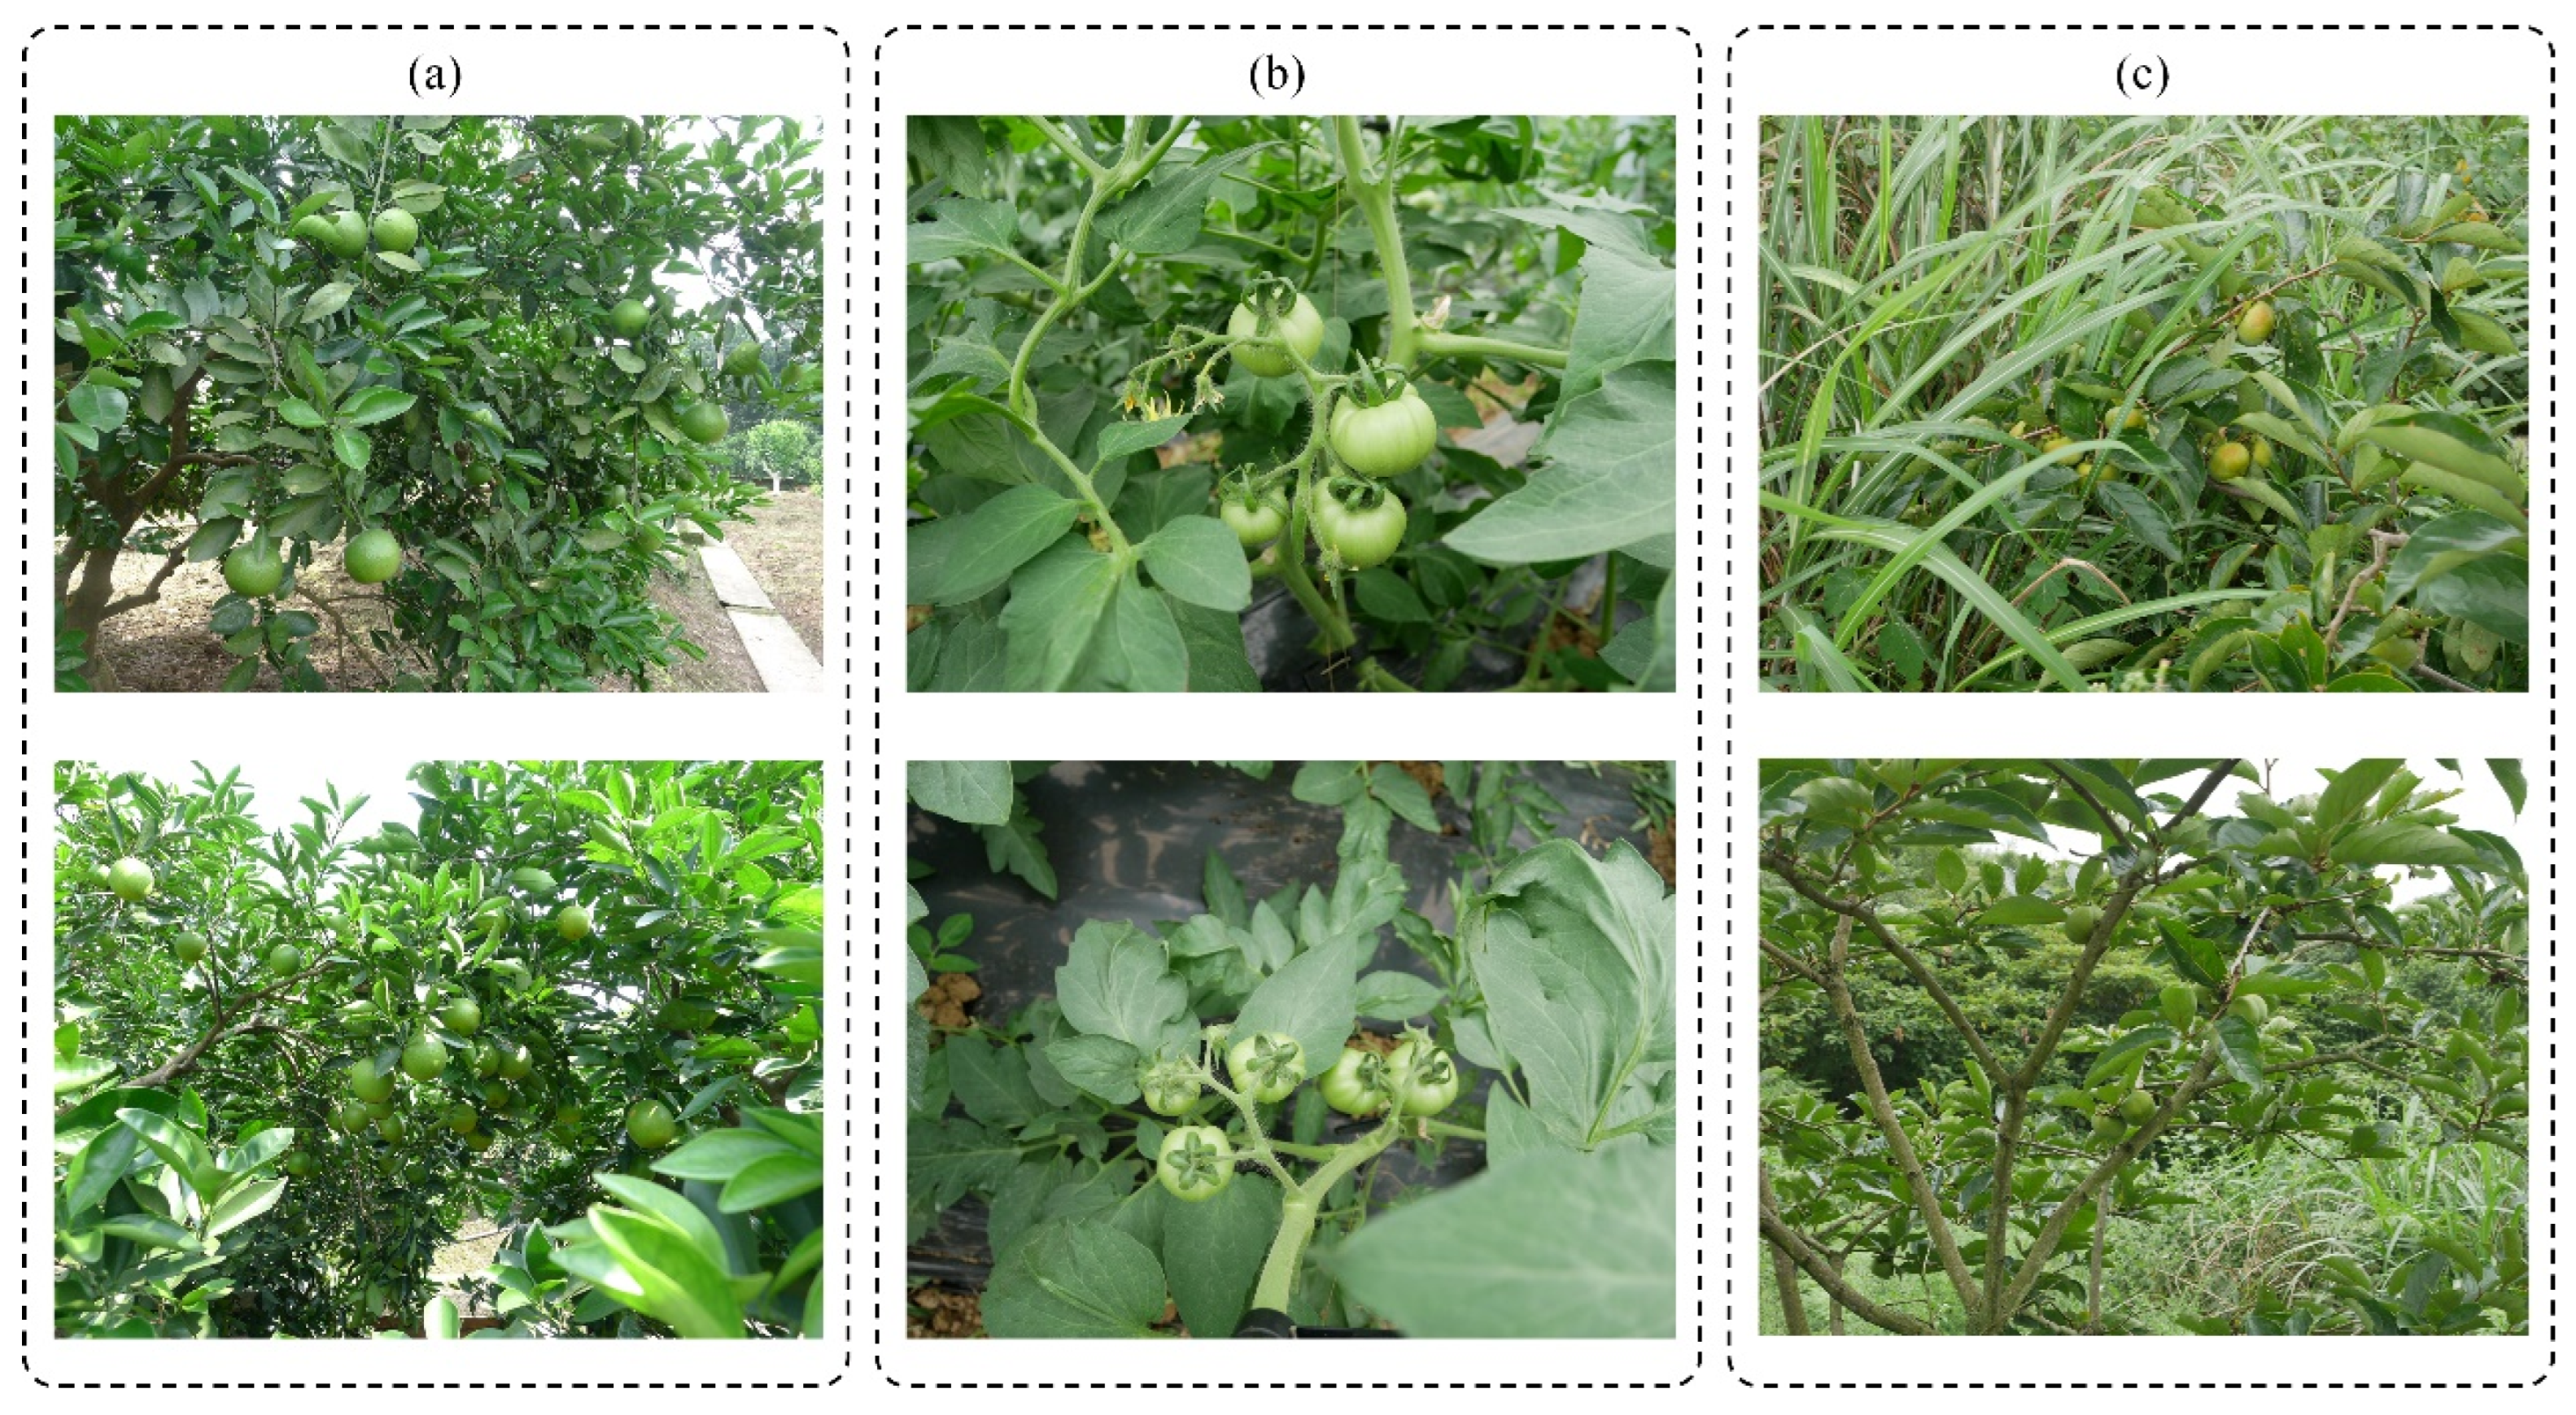
2.1. Acquisition of Images
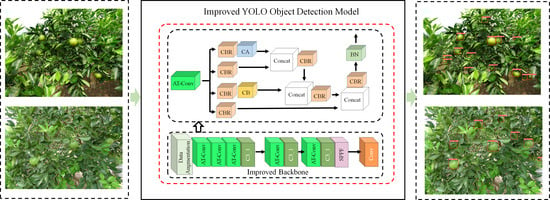
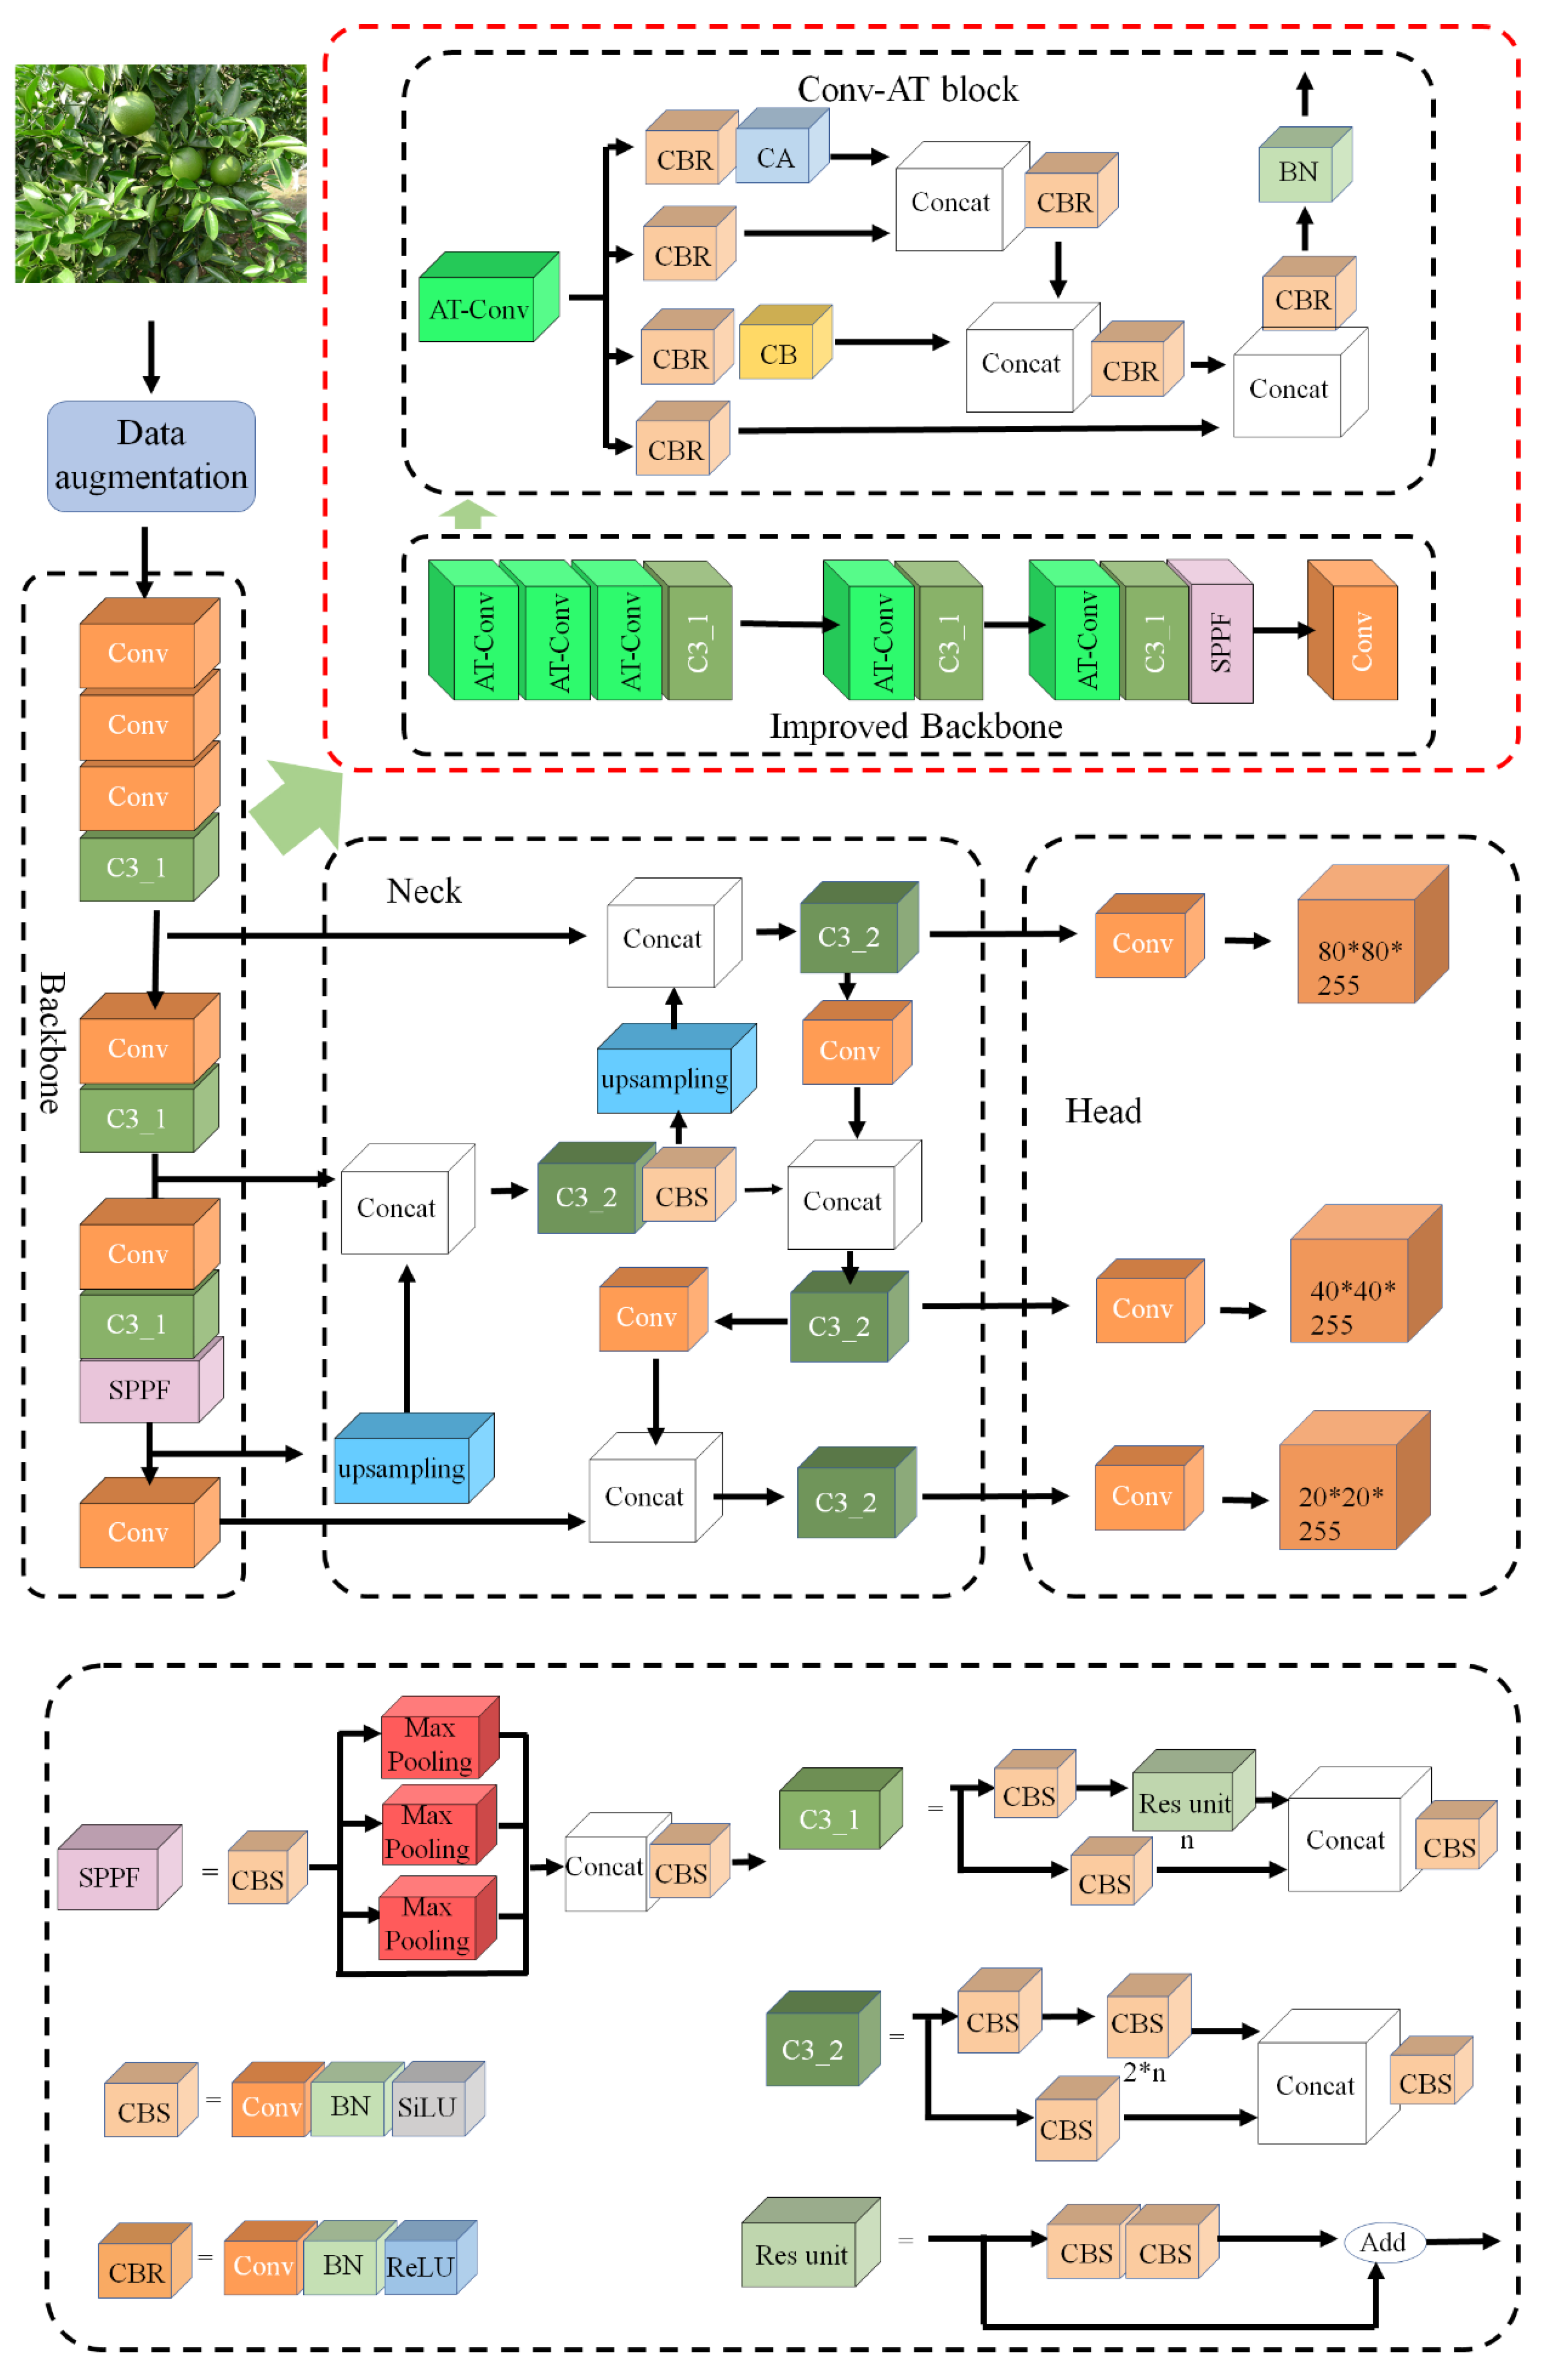
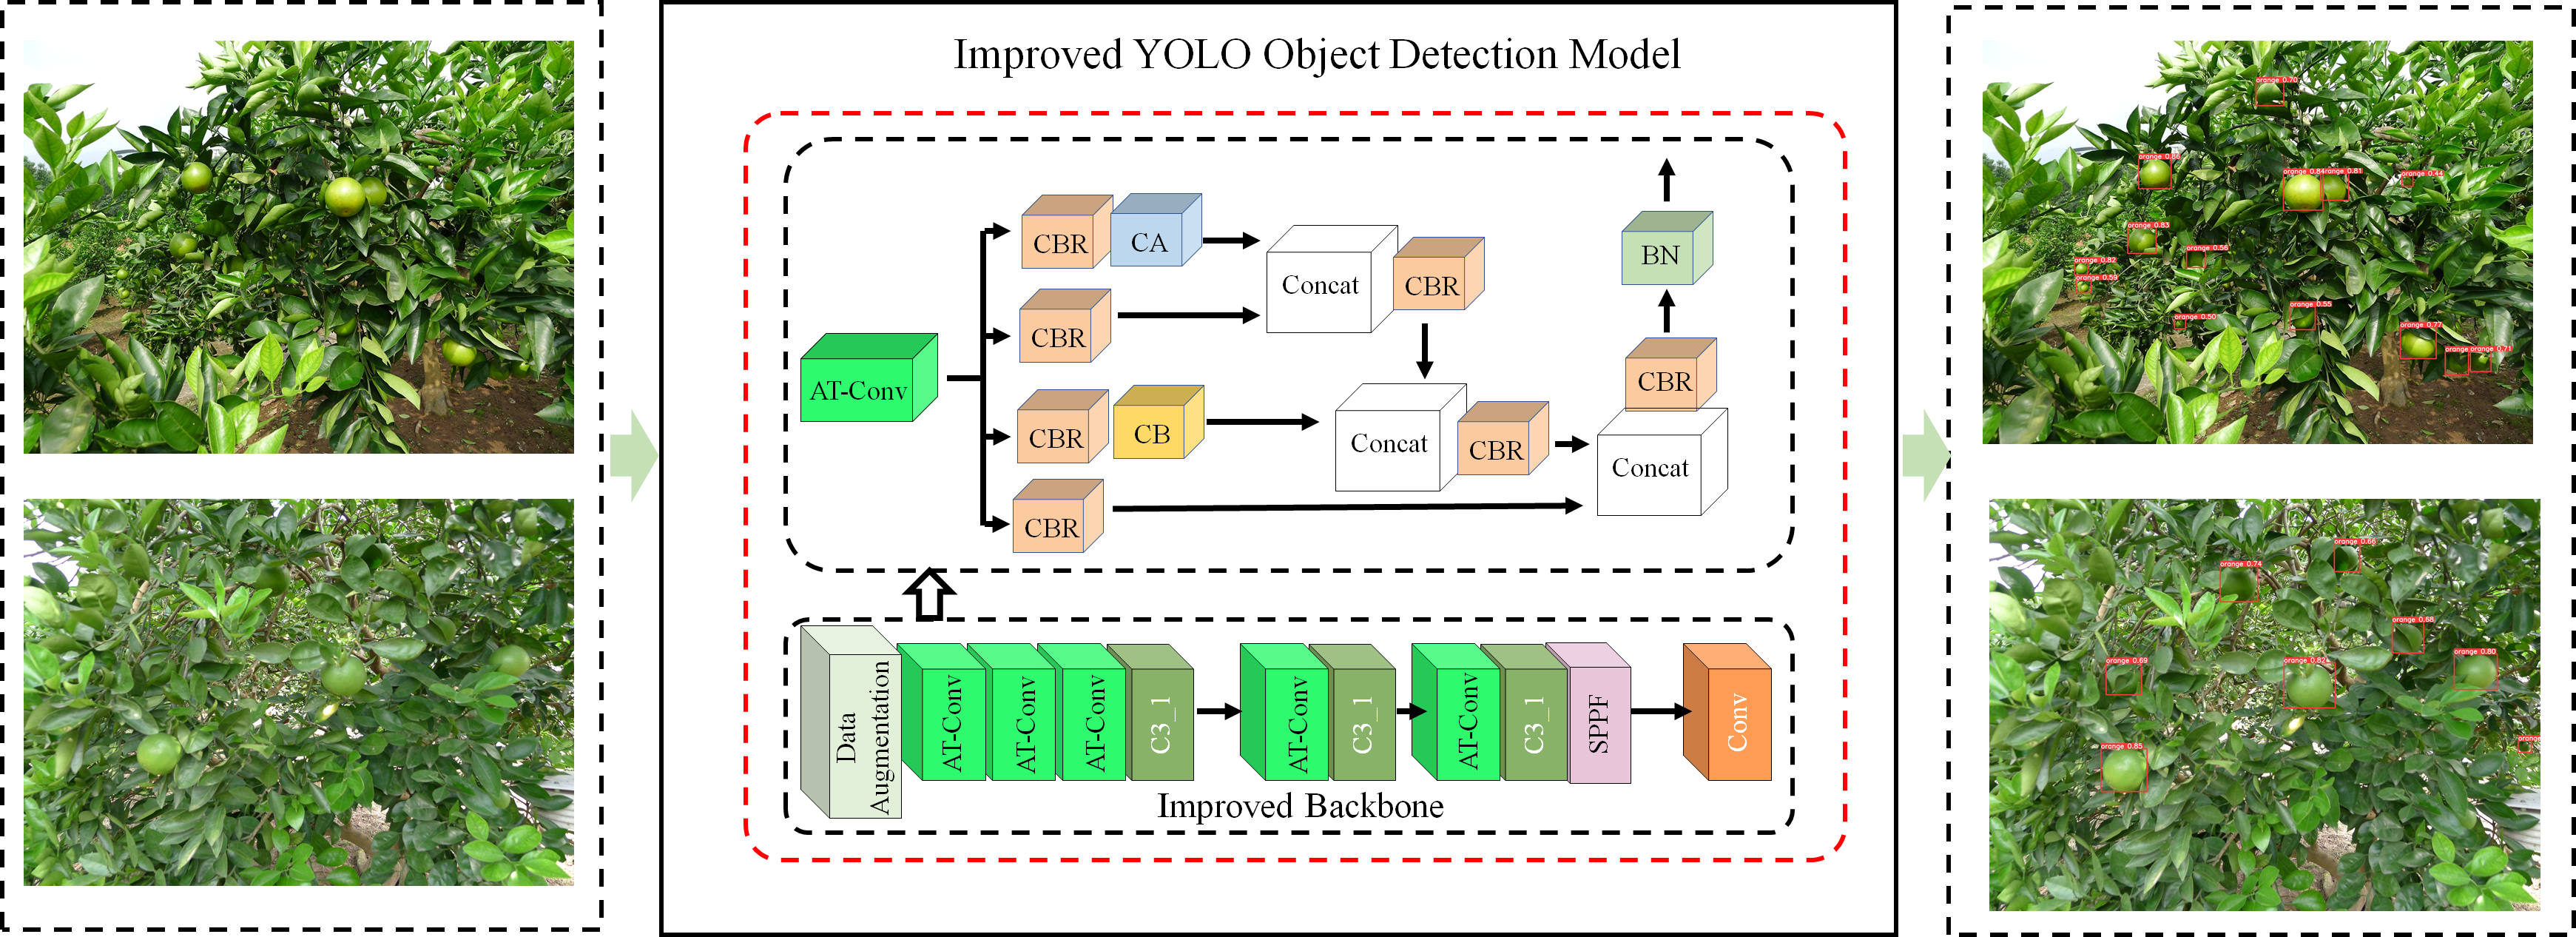
2.2. The Algorithm Principle of YOLOv5-AT
2.2.1. Conv-AT Block
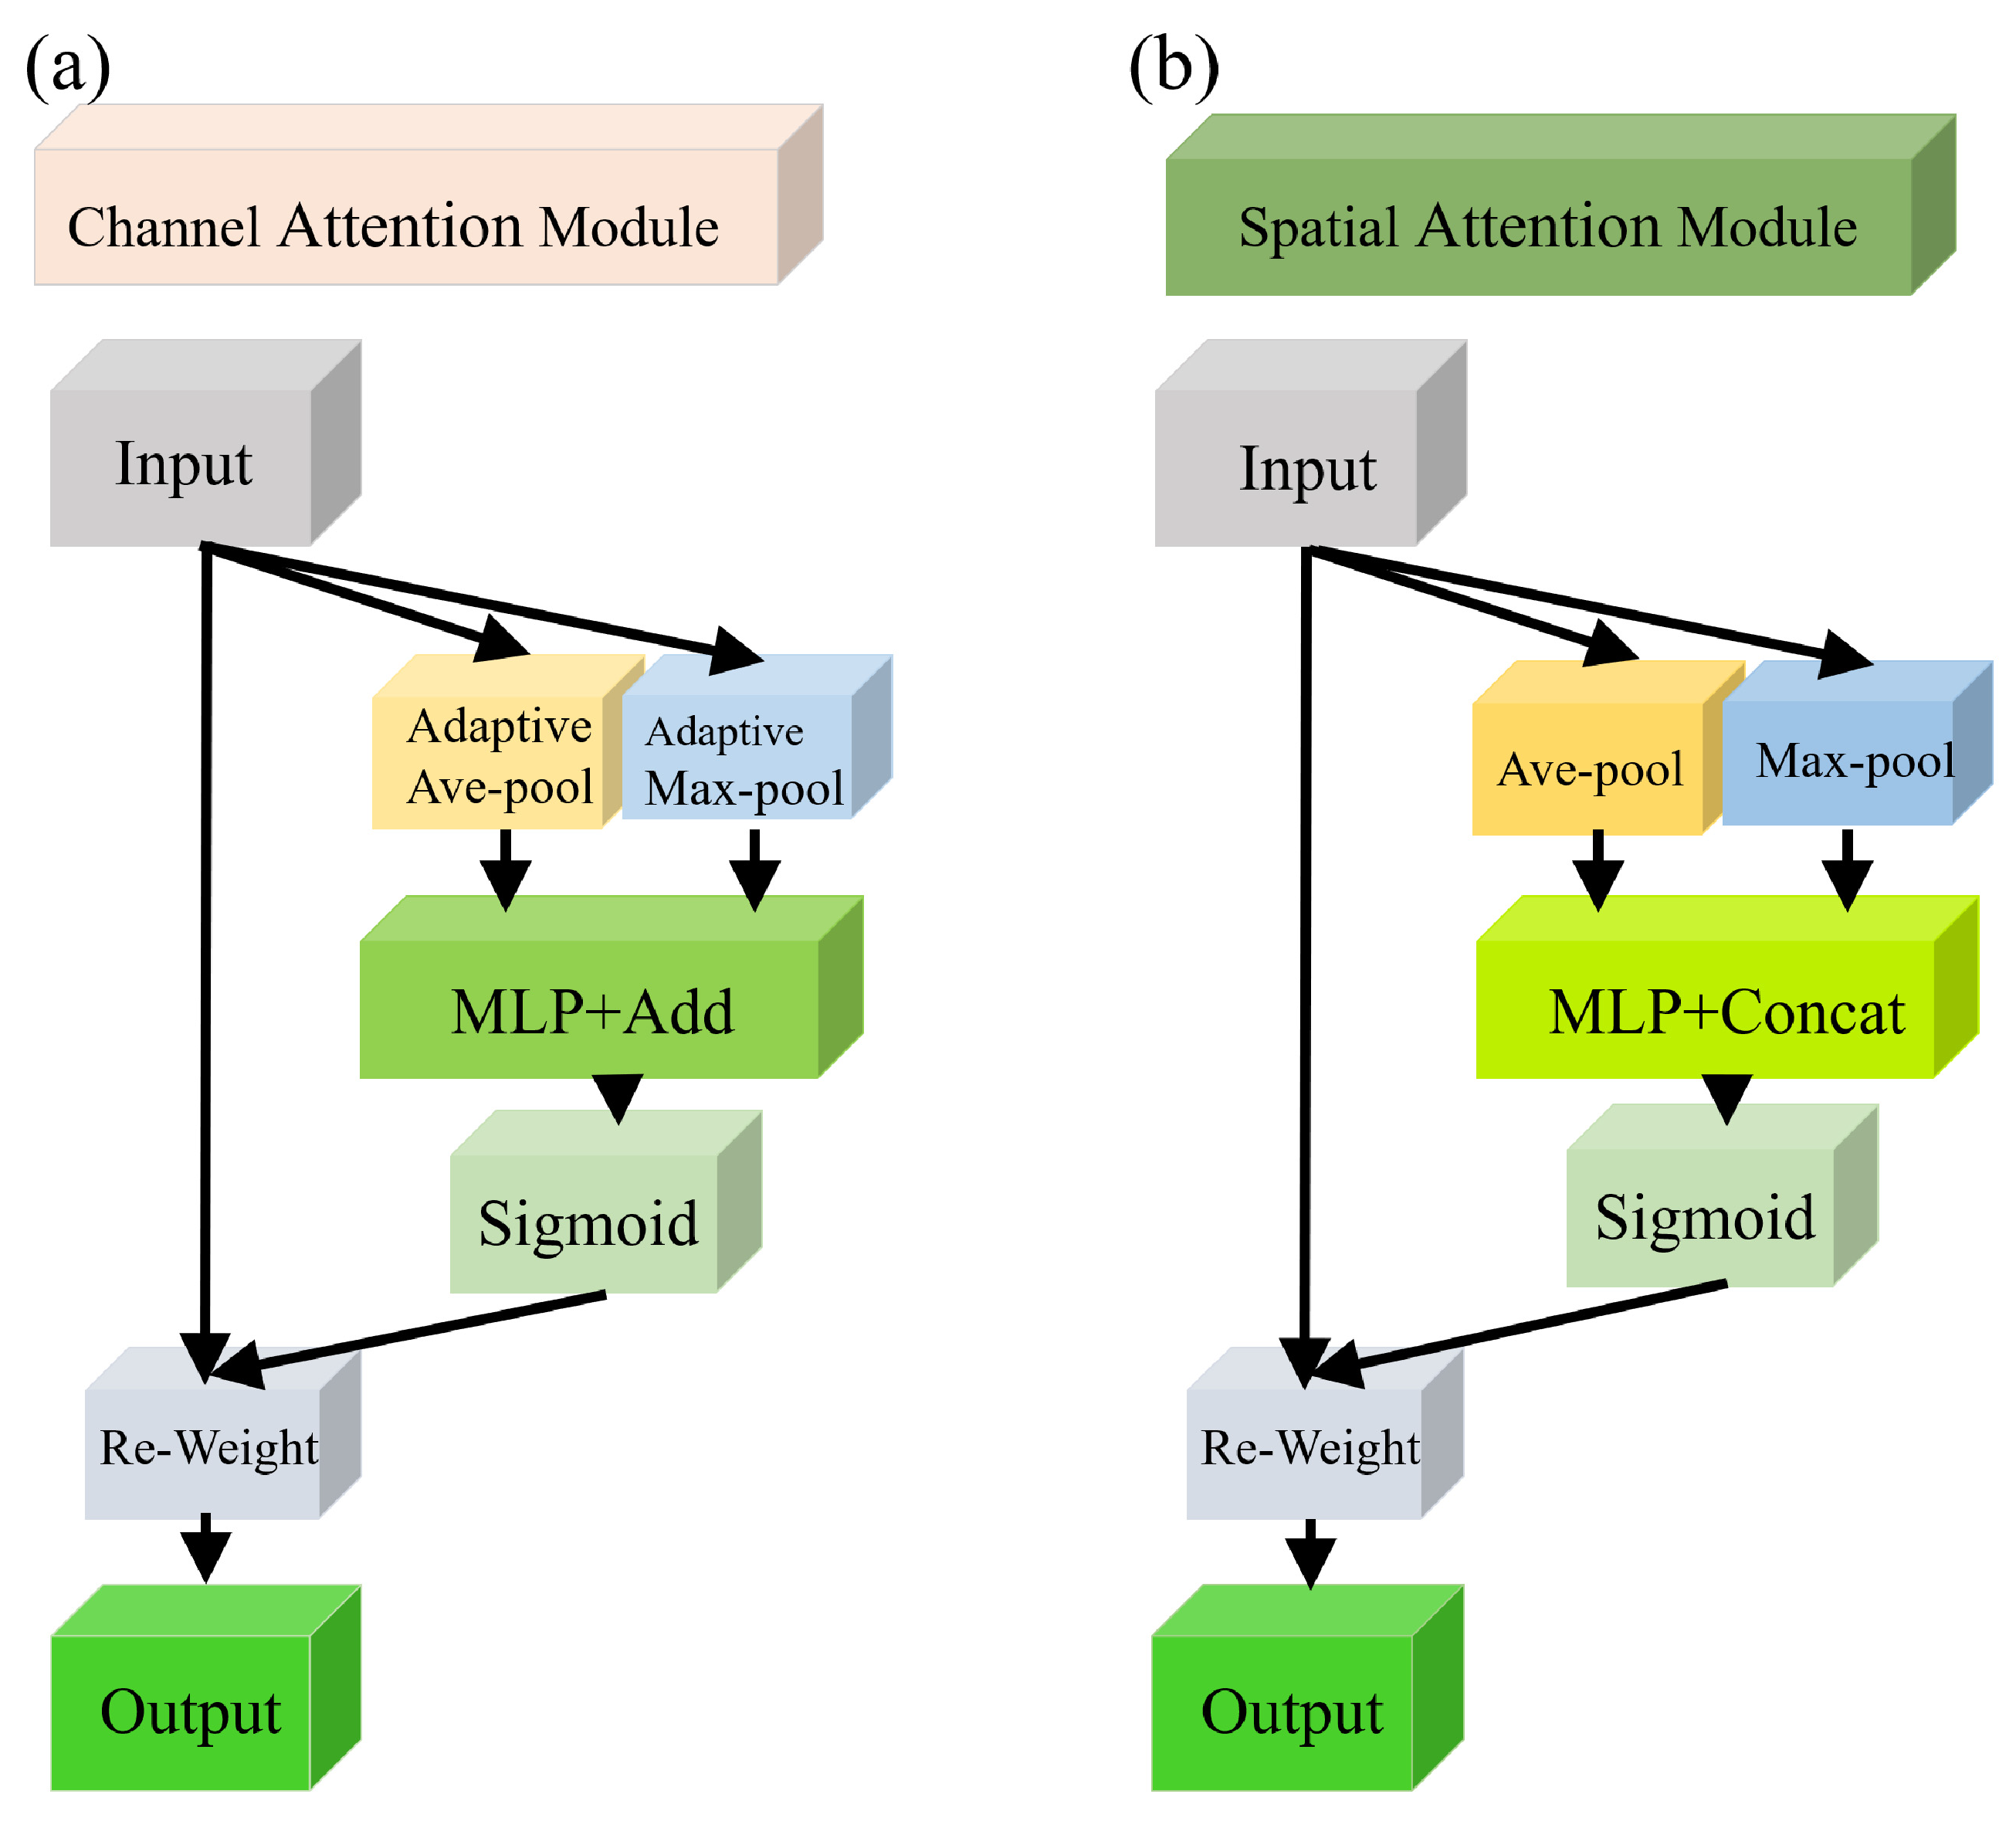
2.2.2. CA and SA Mechanisms of the Conv-AT Block
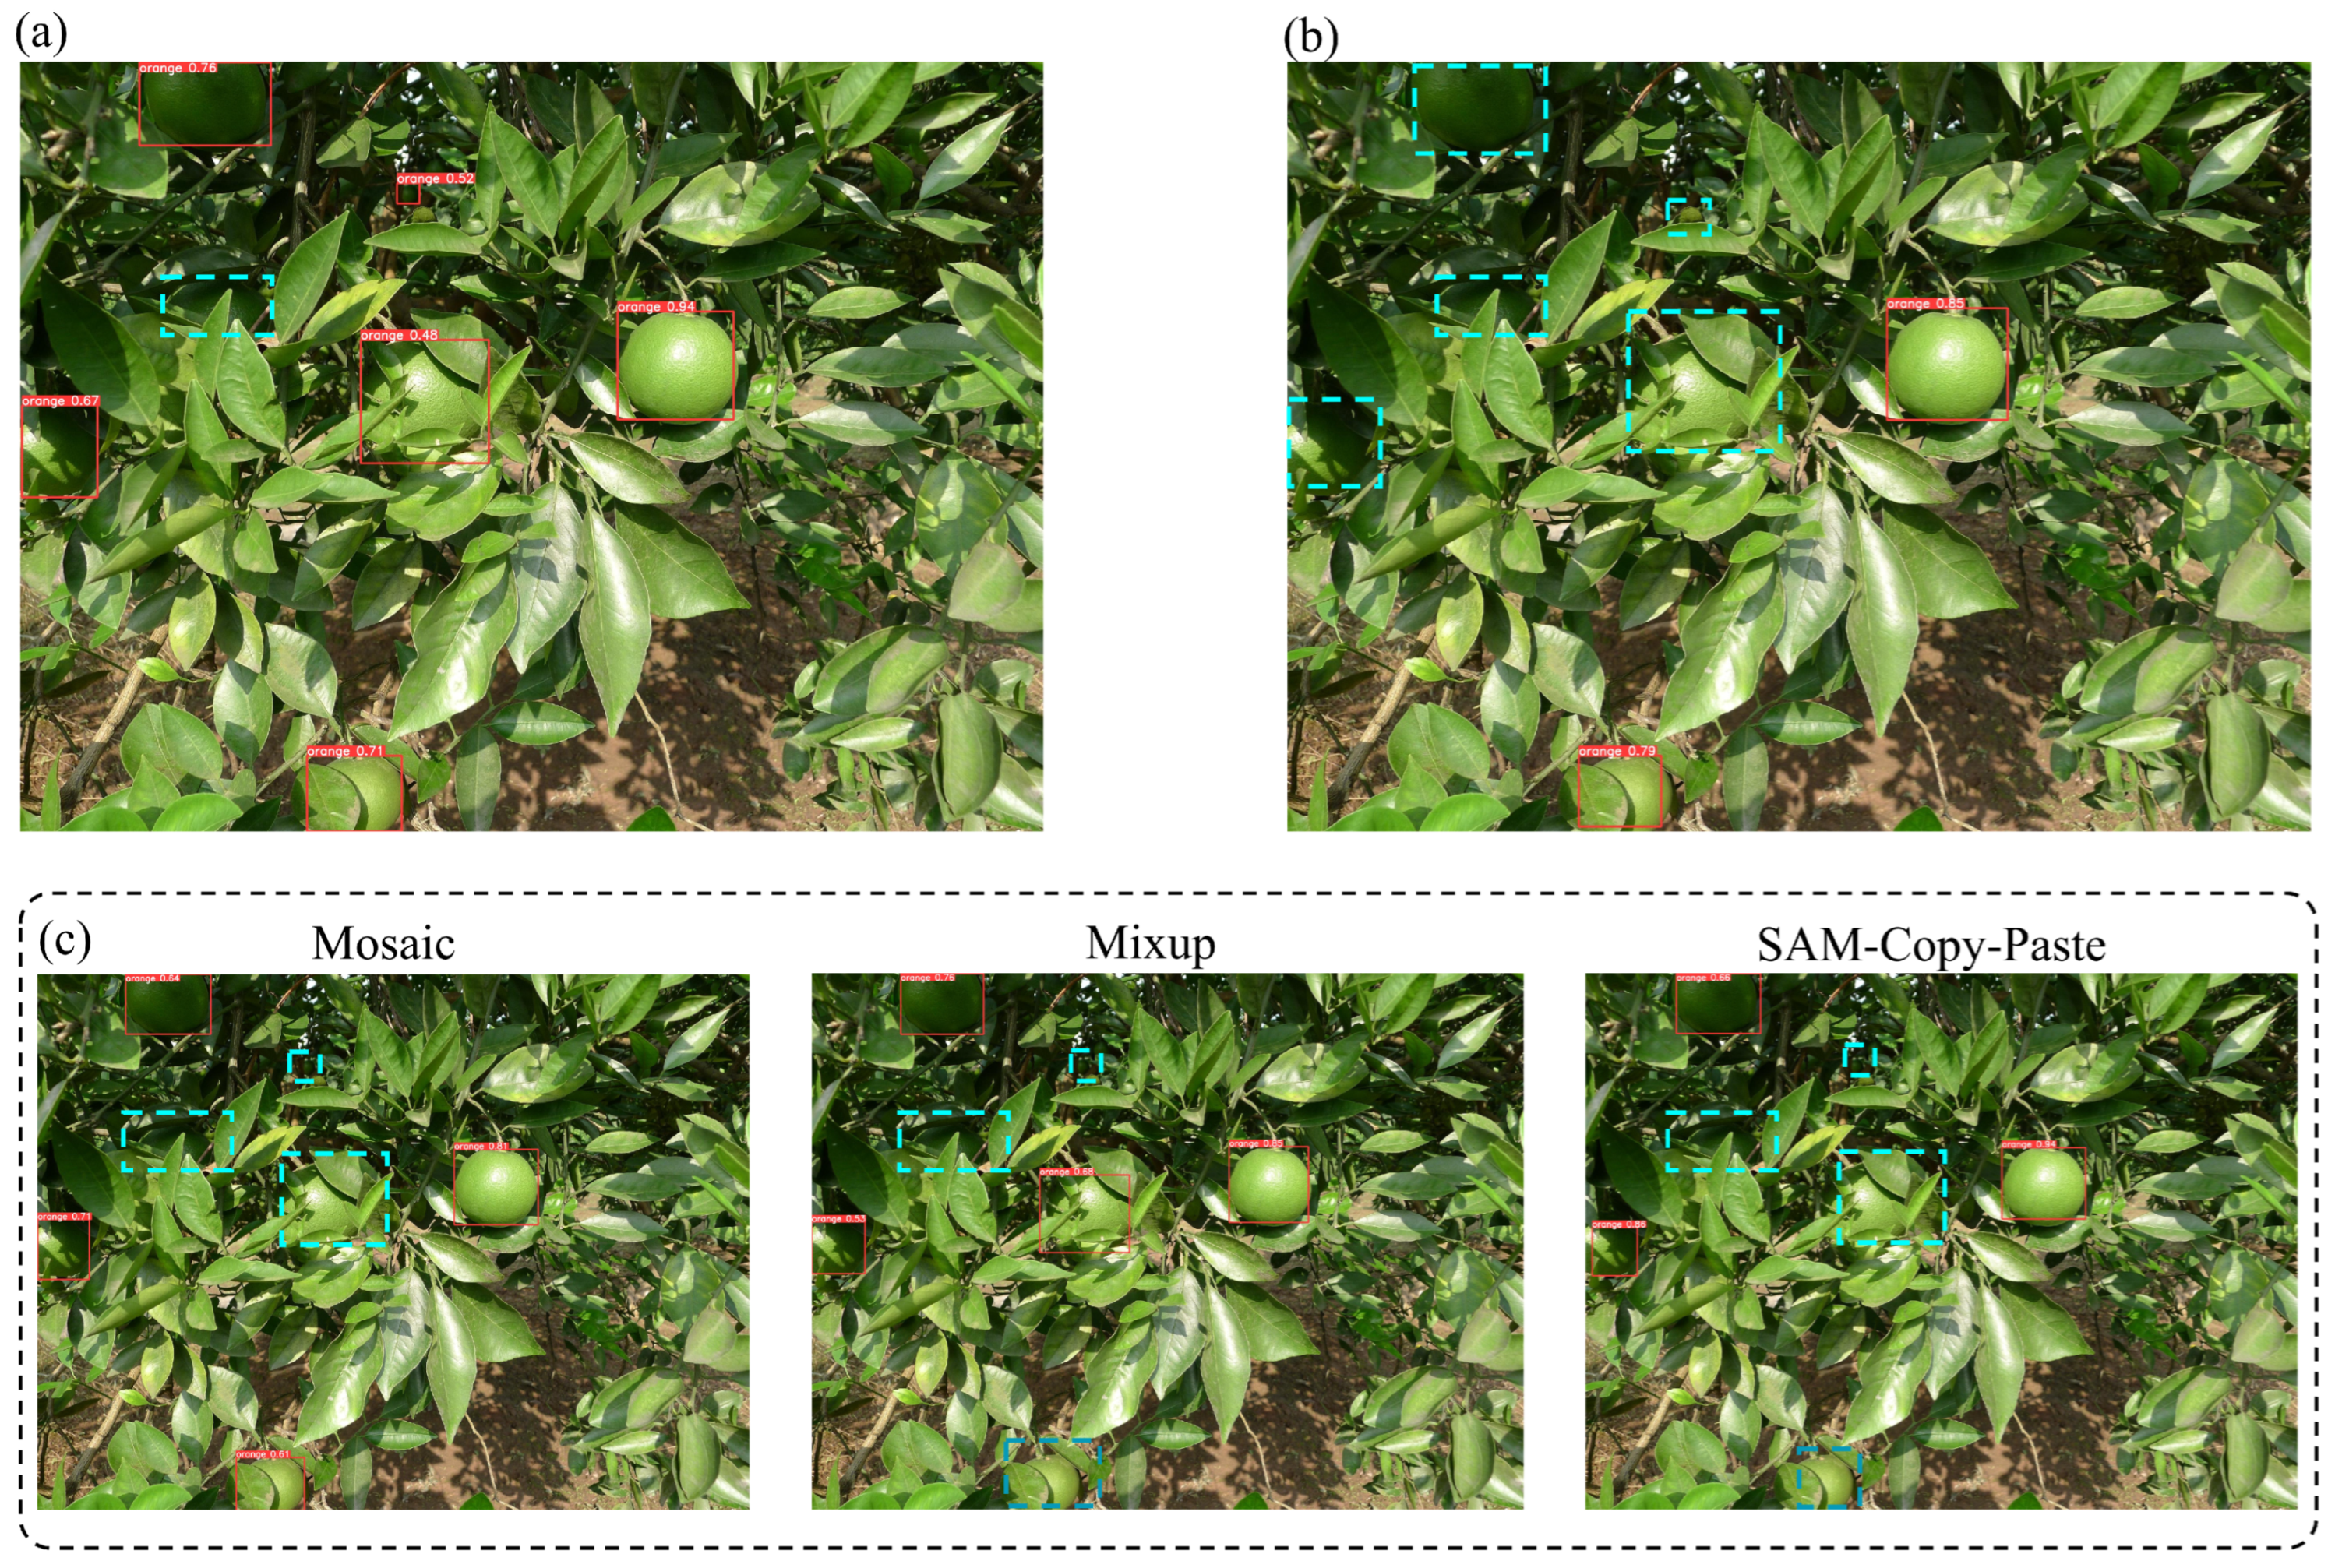
2.2.3. Data Augmentation Methods
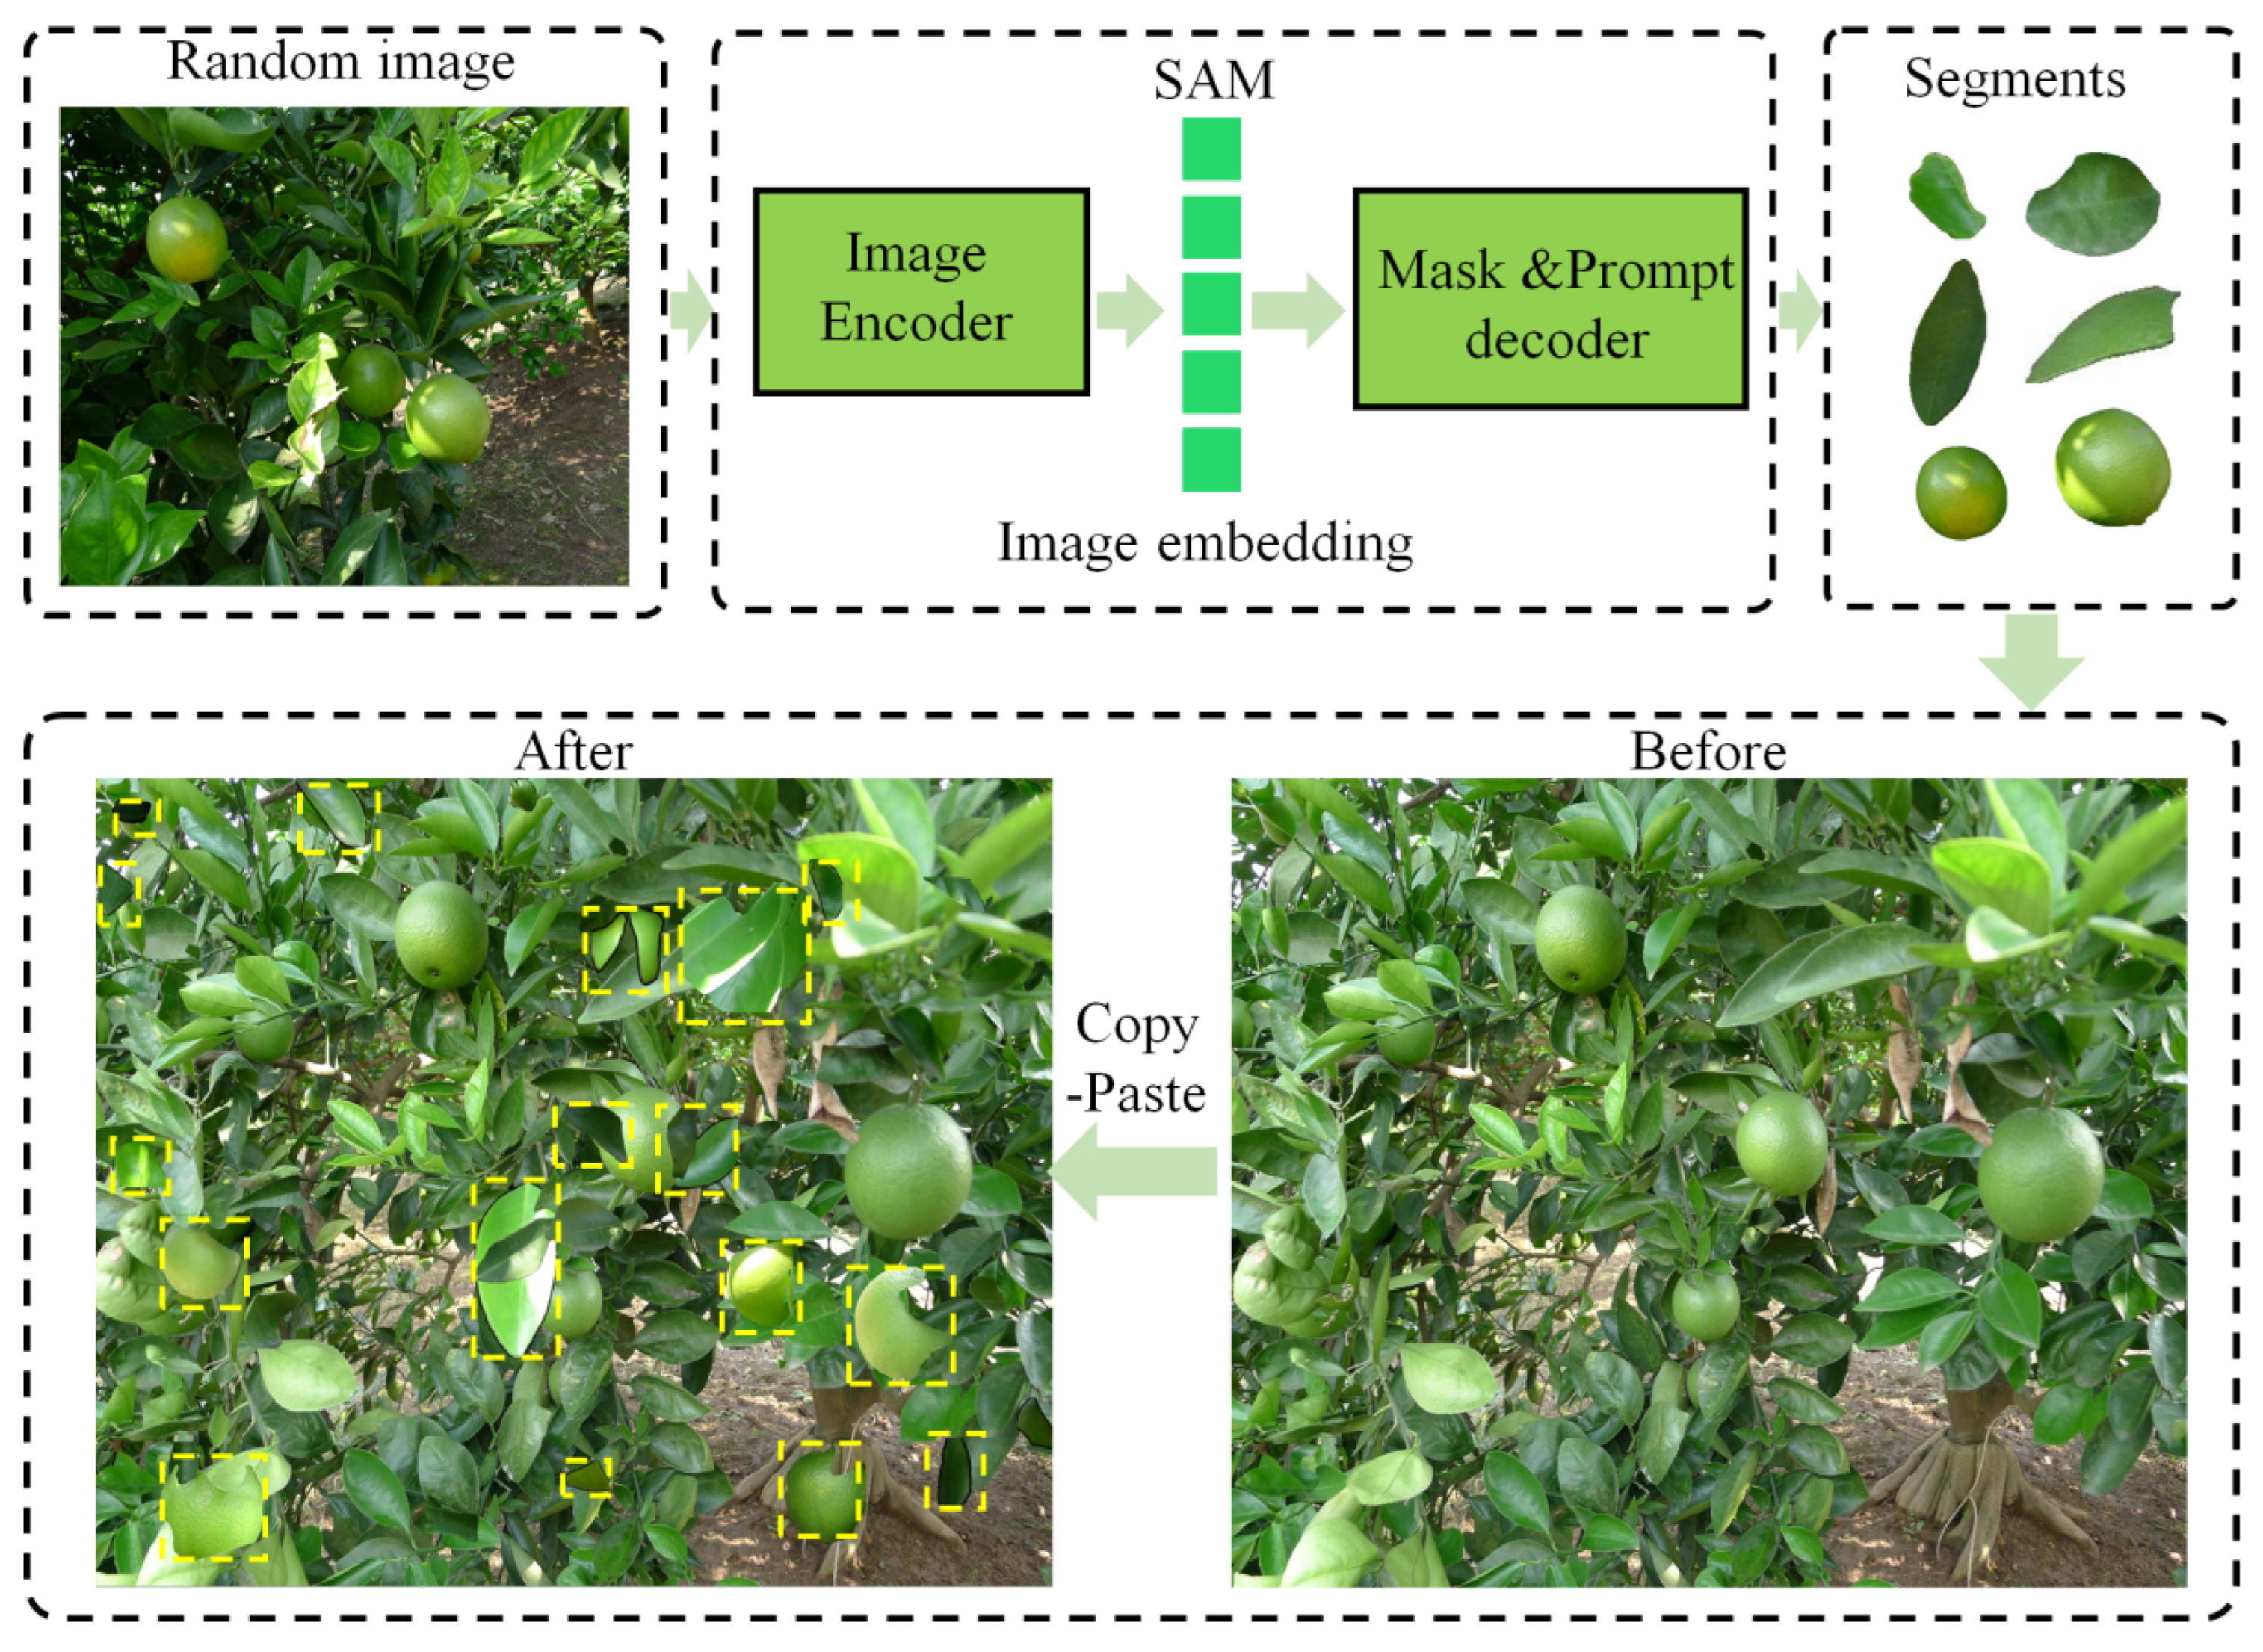
- (1)
- SAM Copy-Paste
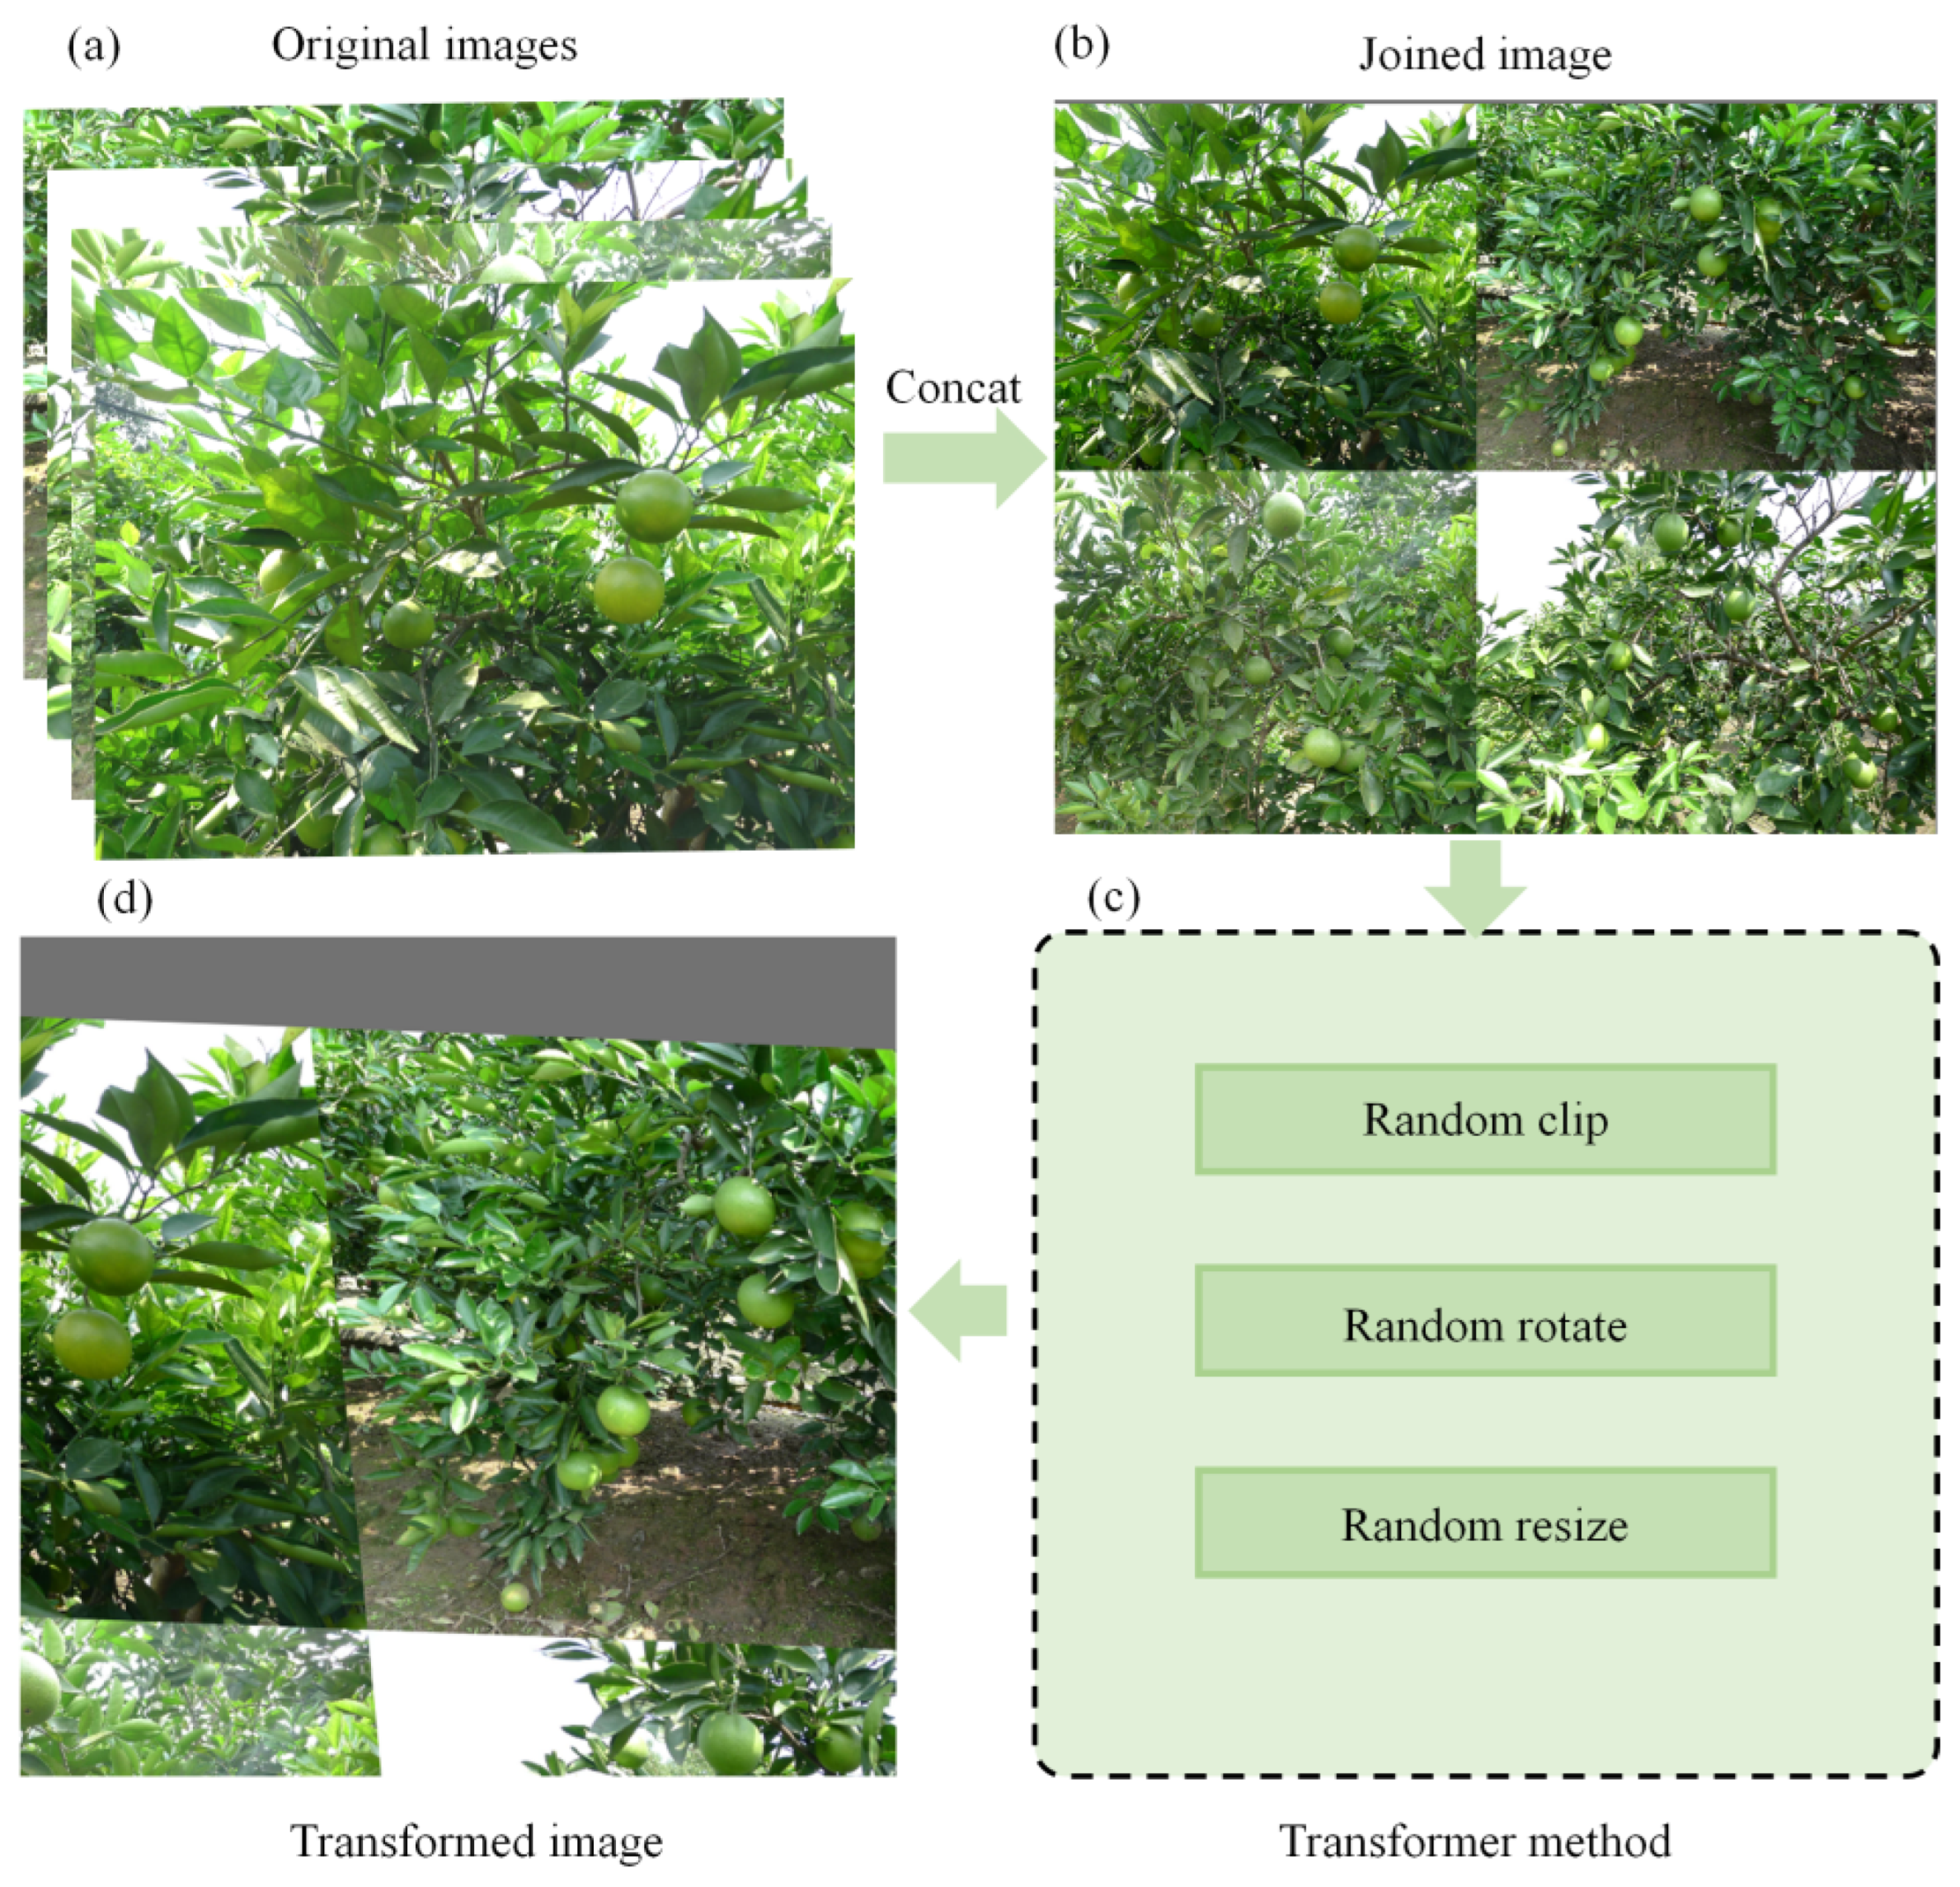
- (2)
- Mosaic
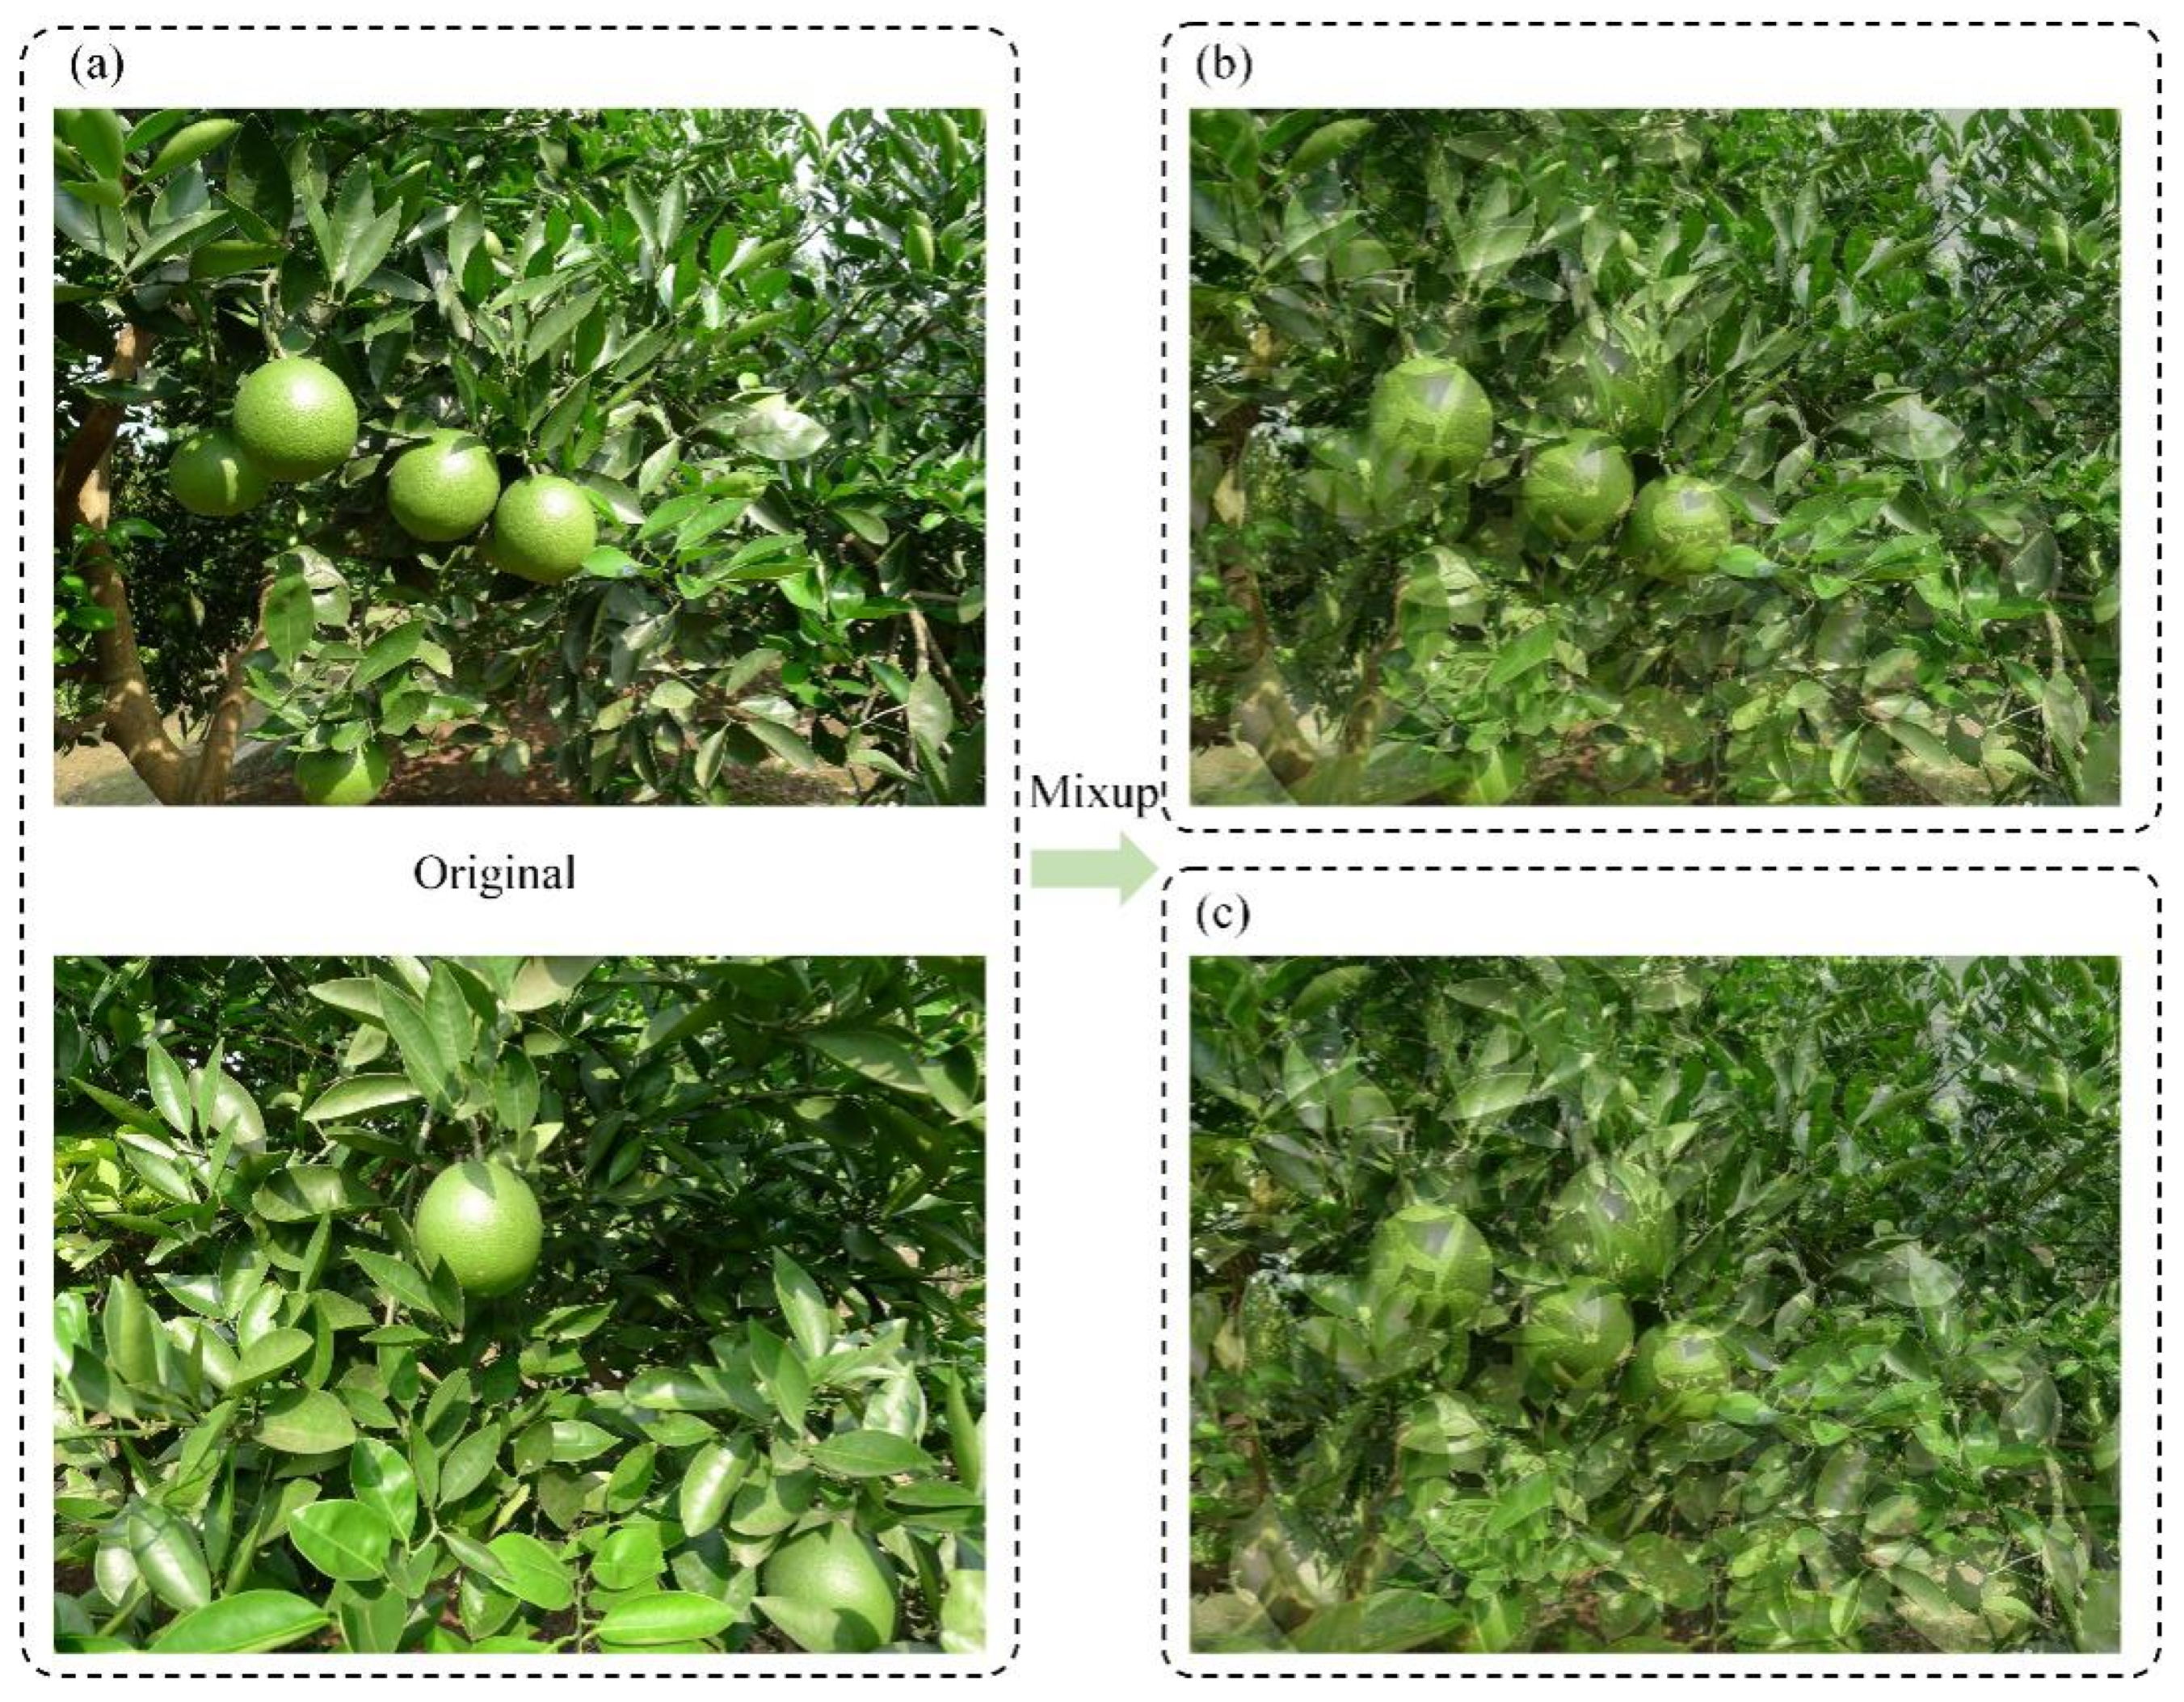
- (3)
- Mixup
2.3. Evaluation Criteria
3. Results and Discussion
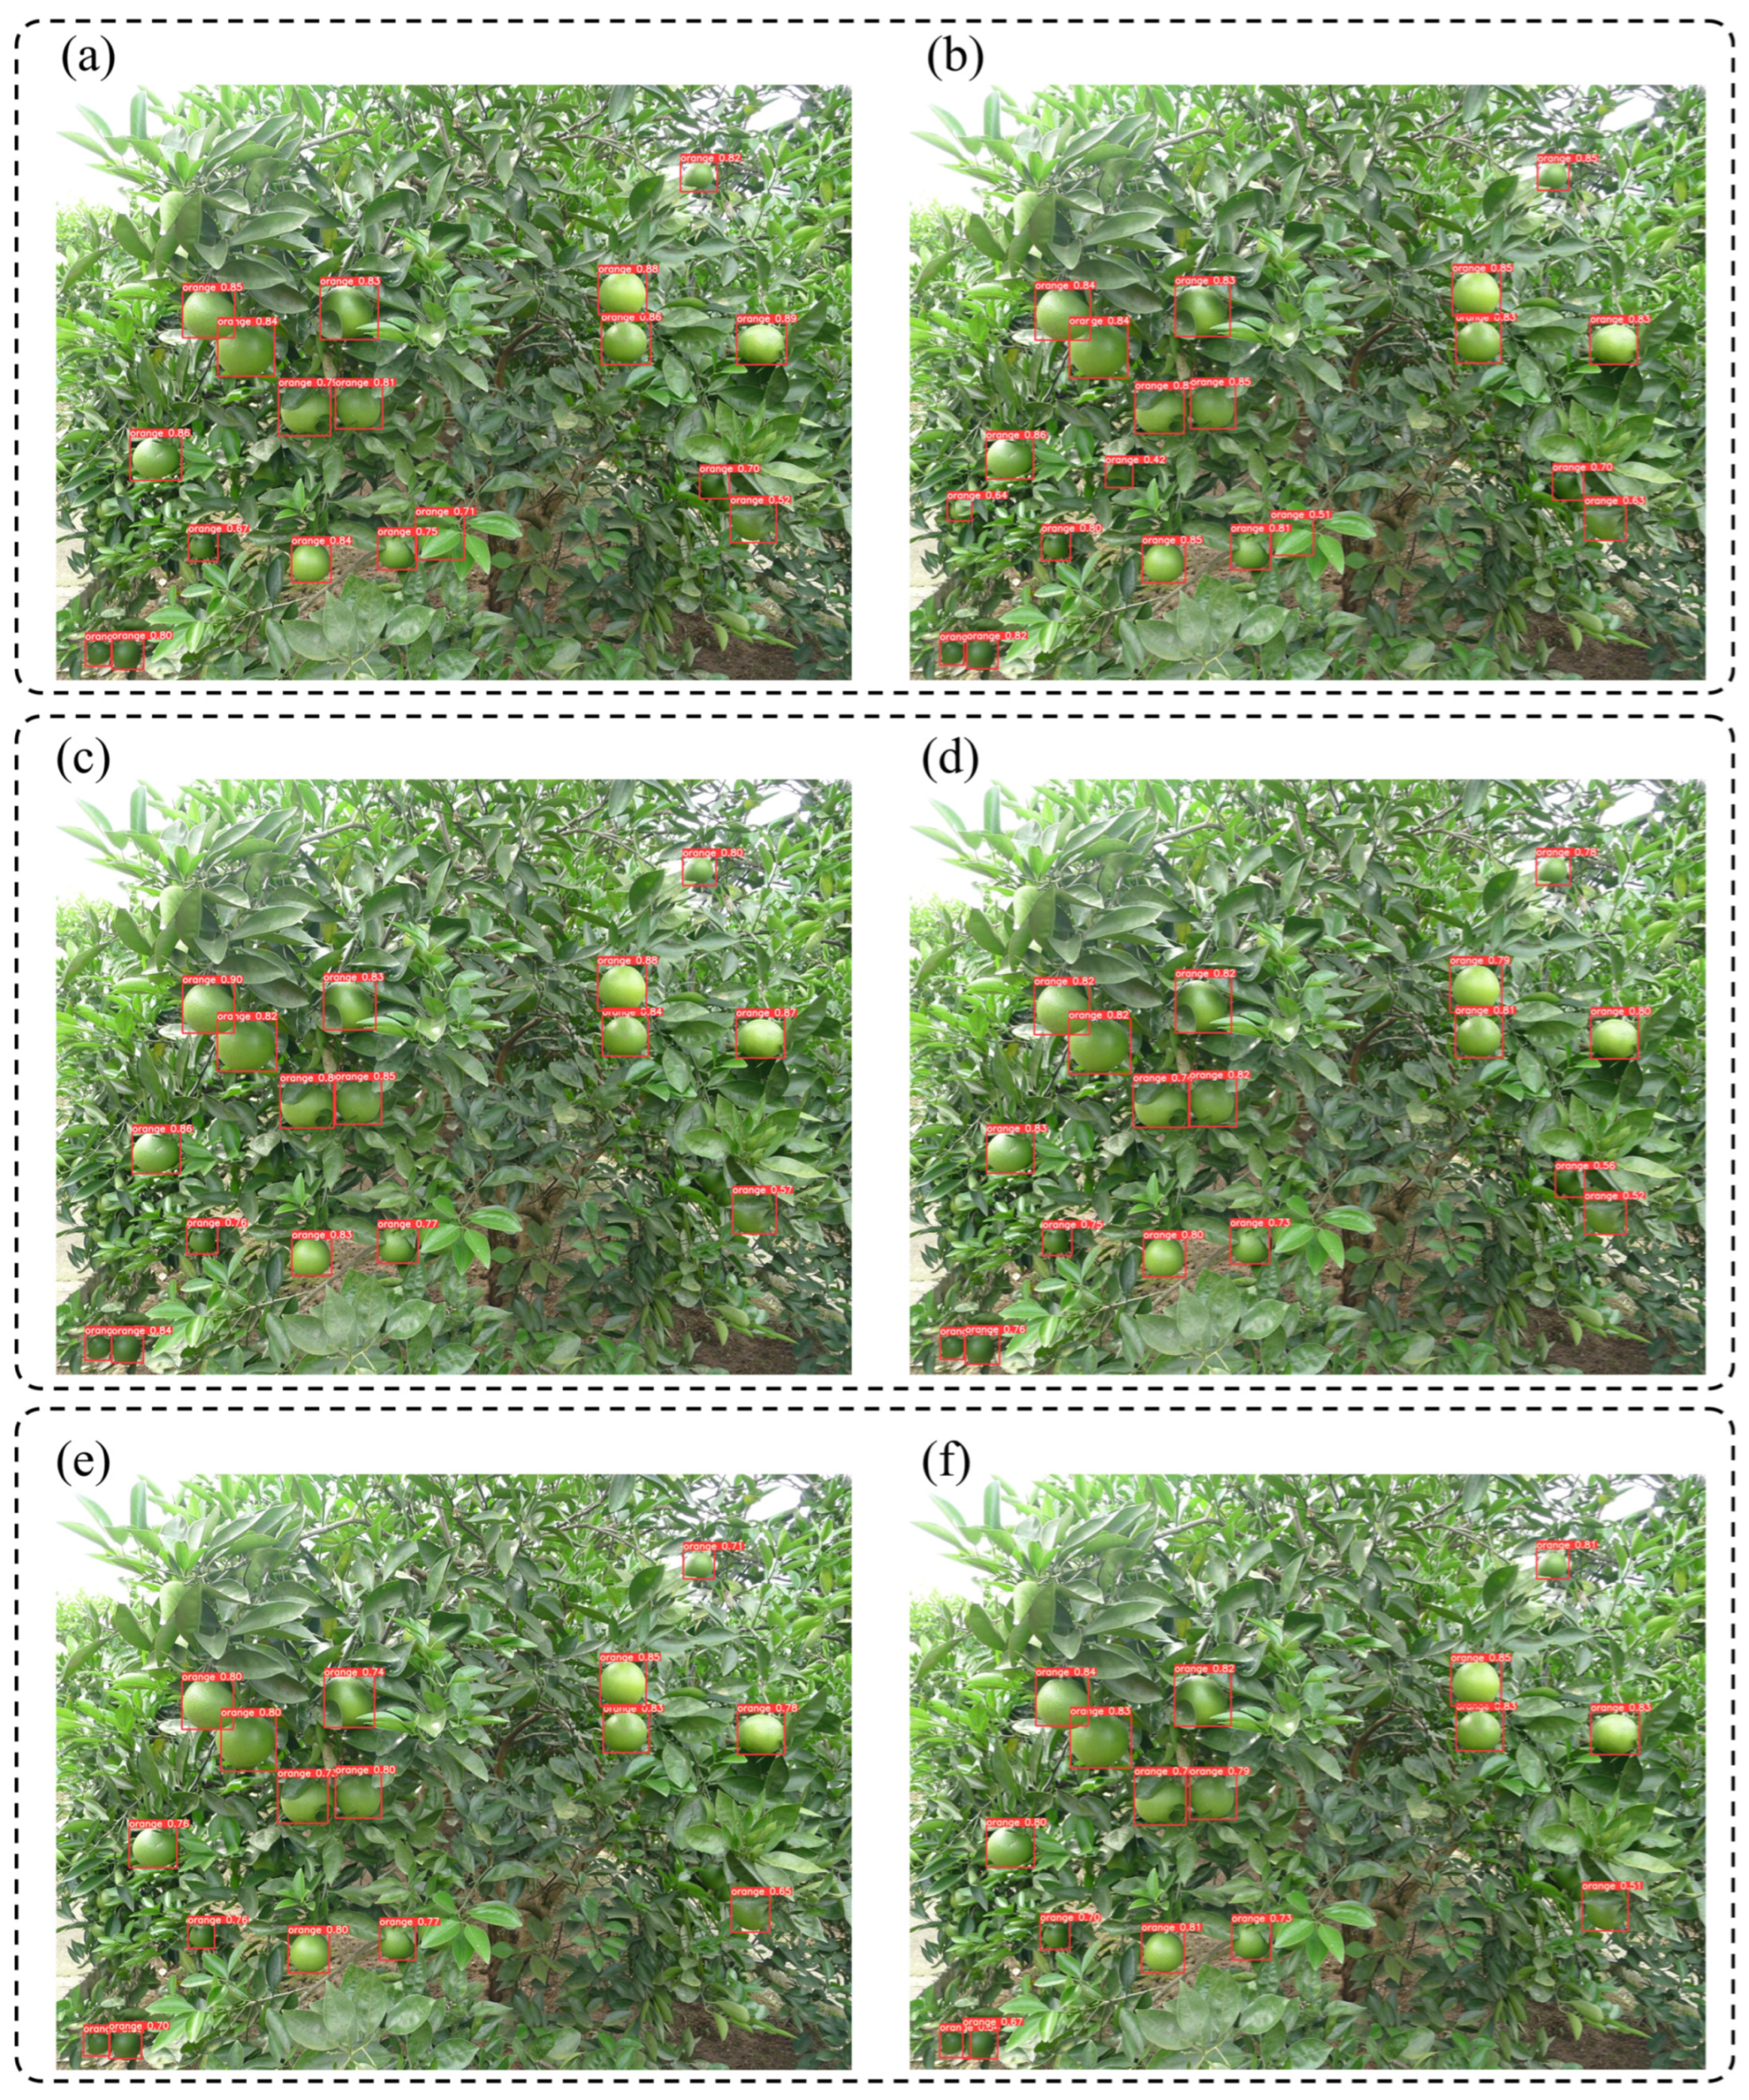
3.1. Comparison of Different YOLO Models
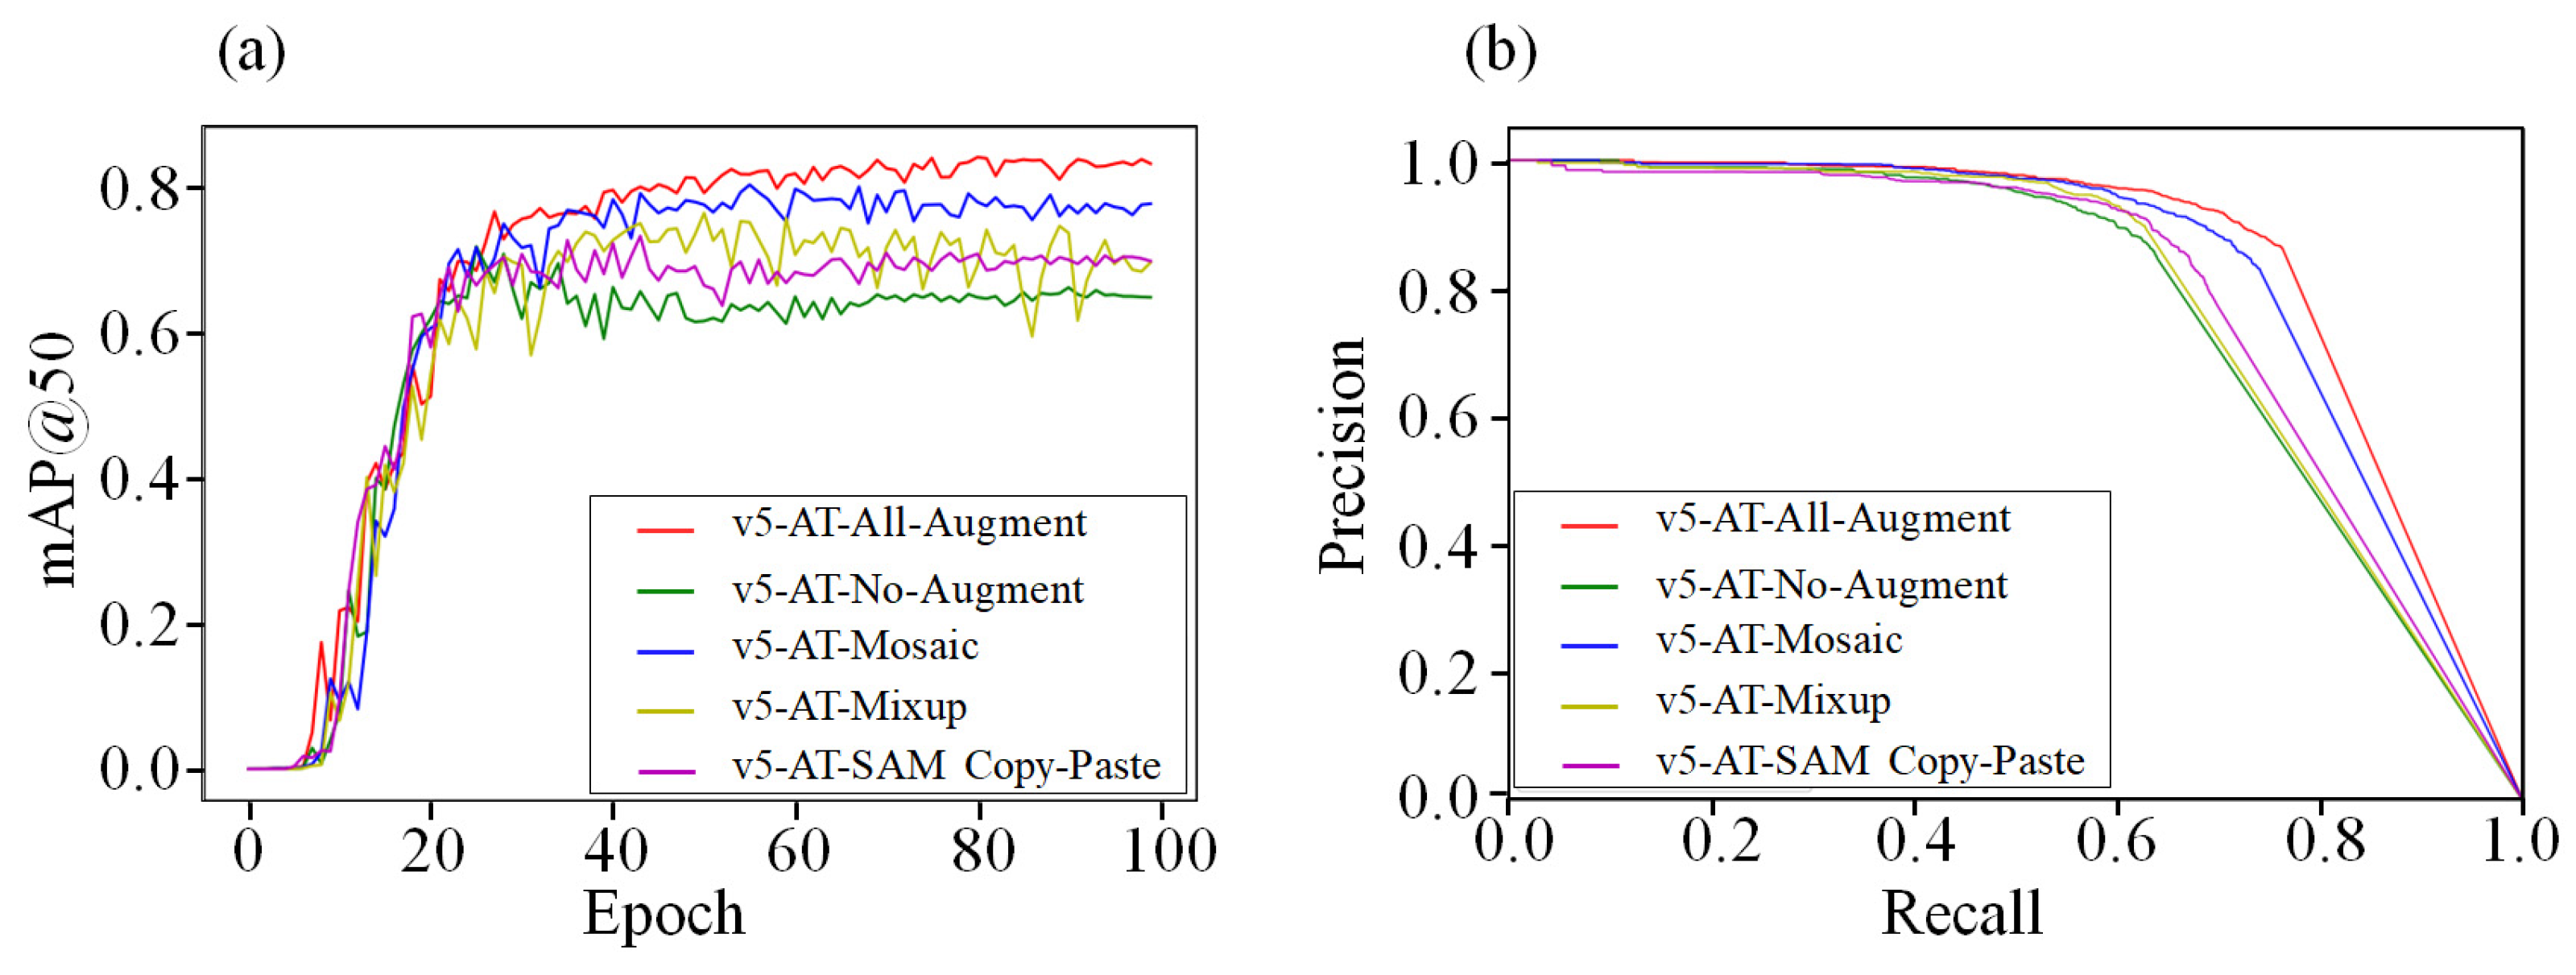
3.2. Comparison of Different Data Augmentation Methods
3.3. Comparison Analysis of Different Dataset Sizes
3.4. Ablation Experiment
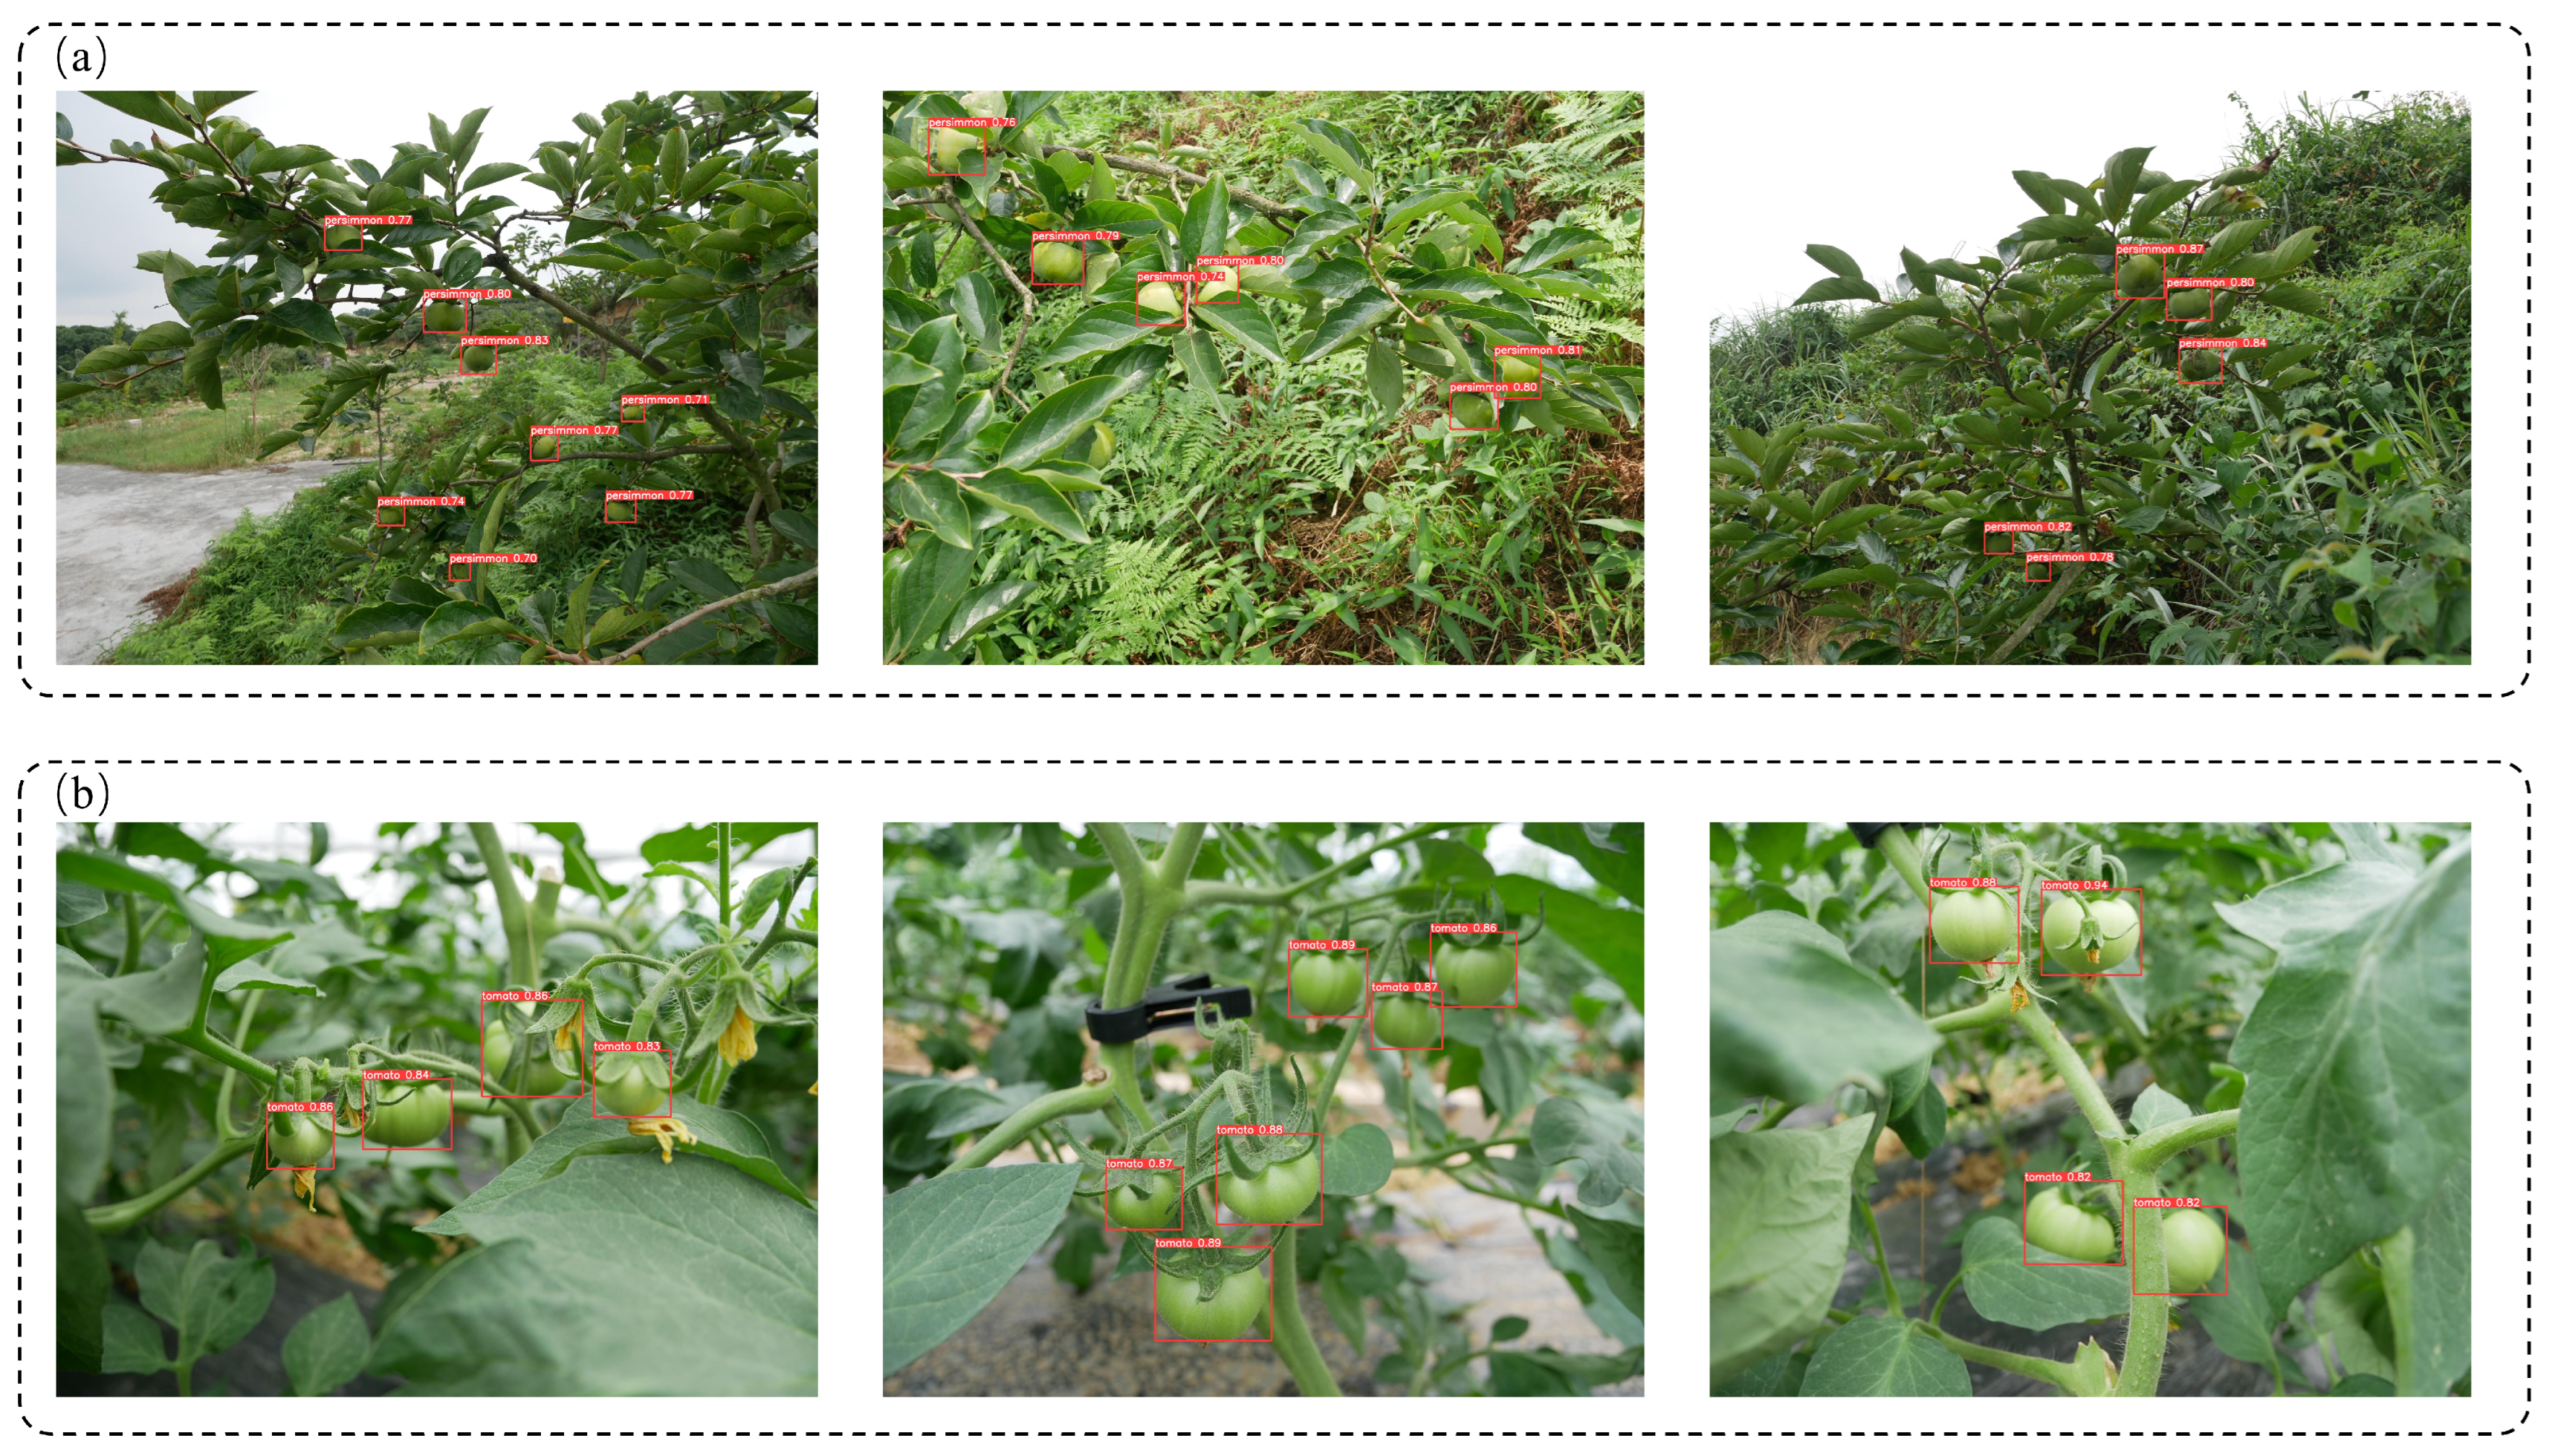
3.5. Application of the YOLOv5-AT Model to Other Green Fruits
4. Discussion
5. Conclusions
Supplementary Materials
Author Contributions
Funding
Data Availability Statement
Acknowledgments
Conflicts of Interest
References
- Gan, H.; Lee, W.S.; Alchanatis, V.; Ehsani, R.; Schueller, J.K. Immature Green Citrus Fruit Detection Using Color and Thermal Images. Comput. Electron. Agric. 2018, 152, 117–125. [Google Scholar] [CrossRef]
- Liu, J.; Yuan, Y.; Zhou, Y.; Zhu, X.; Syed, T.N. Experiments and Analysis of Close-Shot Identification of on-Branch Citrus Fruit with Realsense. Sensors 2018, 18, 1510. [Google Scholar] [CrossRef] [PubMed]
- Tang, Y.; Qiu, J.; Zhang, Y.; Wu, D.; Cao, Y.; Zhao, K.; Zhu, L. Optimization Strategies of Fruit Detection to Overcome the Challenge of Unstructured Background in Field Orchard Environment: A Review. Precis. Agric. 2023, 24, 1183–1219. [Google Scholar] [CrossRef]
- Feng, S.; Sun, H.; Yan, X.; Zhu, H.; Zou, Z.; Shen, S.; Liu, H.X. Dense Reinforcement Learning for Safety Validation of Autonomous Vehicles. Nature 2023, 615, 620–627. [Google Scholar] [CrossRef] [PubMed]
- Gupta, A.; Katarya, R. Social Media Based Surveillance Systems for Healthcare Using Machine Learning: A Systematic Review. J. Biomed. Inform. 2020, 108, 103500. [Google Scholar] [CrossRef] [PubMed]
- Varoquaux, G.; Cheplygina, V. Machine Learning for Medical Imaging: Methodological Failures and Recommendations for the Future. NPJ Digit. Med. 2022, 5, 48. [Google Scholar] [CrossRef]
- Kamilaris, A.; Prenafeta-Boldú, F.X. Deep Learning in Agriculture: A Survey. Comput. Electron. Agric. 2018, 147, 70–90. [Google Scholar] [CrossRef]
- Bourilkov, D. Machine and Deep Learning Applications in Particle Physics. Int. J. Mod. Phys. A 2019, 34, 1930019. [Google Scholar] [CrossRef]
- Koirala, A.; Walsh, K.B.; Wang, Z.; McCarthy, C. Deep Learning–Method Overview and Review of Use for Fruit Detection and Yield Estimation. Comput. Electron. Agric. 2019, 162, 219–234. [Google Scholar] [CrossRef]
- Gongal, A.; Amatya, S.; Karkee, M.; Zhang, Q.; Lewis, K. Sensors and Systems for Fruit Detection and Localization: A Review. Comput. Electron. Agric. 2015, 116, 8–19. [Google Scholar] [CrossRef]
- Parvathi, S.; Selvi, S.T. Detection of Maturity Stages of Coconuts in Complex Background Using Faster R-CNN Model. Biosyst. Eng. 2021, 202, 119–132. [Google Scholar] [CrossRef]
- Villacrés, J.F.; Cheein, F.A. Detection and Characterization of Cherries: A Deep Learning Usability Case Study in Chile. Agronomy 2020, 10, 835. [Google Scholar] [CrossRef]
- Yu, Y.; Zhang, K.; Yang, L.; Zhang, D. Fruit Detection for Strawberry Harvesting Robot in Non-Structural Environment Based on Mask-RCNN. Comput. Electron. Agric. 2019, 163, 104846. [Google Scholar] [CrossRef]
- Liang, Q.; Zhu, W.; Long, J.; Wang, Y.; Sun, W.; Wu, W. A Real-Time Detection Framework for on-Tree Mango Based on Ssd Network. In Proceedings of the Intelligent Robotics and Applications: 11th International Conference, ICIRA 2018, Newcastle, NSW, Australia, 9–11 August 2018. Proceedings, Part II. [Google Scholar]
- Shaikhina, T.; Khovanova, N.A. Handling Limited Datasets with Neural Networks in Medical Applications: A Small-Data Approach. Artif. Intell. Med. 2017, 75, 51–63. [Google Scholar] [CrossRef] [PubMed]
- Terven, J.; Cordova-Esparza, D. A Comprehensive Review of Yolo: From Yolov1 and Beyond. arXiv 2023, arXiv:2304.00501. [Google Scholar]
- Jiang, P.; Ergu, D.; Liu, F.; Cai, Y.; Ma, B. A Review of Yolo Algorithm Developments. Procedia Comput. Sci. 2022, 199, 1066–1073. [Google Scholar] [CrossRef]
- Redmon, J.; Farhadi, A. Yolov3: An Incremental Improvement. arXiv 2018, arXiv:1804.02767. [Google Scholar]
- Wang, C.-Y.; Bochkovskiy, A.; Liao, H.-Y.M. Yolov7: Trainable Bag-of-Freebies Sets New State-of-the-Art for Real-Time Object Detectors. In Proceedings of the IEEE/CVF Conference on Computer Vision and Pattern Recognition 2023, Vancouver, BC, Canada, 18–22 June 2023. [Google Scholar]
- Salman, M.E.; Çakar, G.Ç.; Azimjonov, J.; Kösem, M.; Cedi, İ.H. Automated Prostate Cancer Grading and Diagnosis System Using Deep Learning-Based Yolo Object Detection Algorithm. Expert Syst. Appl. 2022, 201, 117148. [Google Scholar] [CrossRef]
- Jiang, J.; Fu, X.; Qin, R.; Wang, X.; Ma, Z. High-Speed Lightweight Ship Detection Algorithm Based on Yolo-V4 for Three-Channels Rgb Sar Image. Remote Sens. 2021, 13, 1909. [Google Scholar] [CrossRef]
- Wu, T.; Zhang, Q.; Wu, J.; Liu, Q.; Su, J.; Li, H. An Improved Yolov5s Model for Effectively Predict Sugarcane Seed Replenishment Positions Verified by a Field Re-Seeding Robot. Comput. Electron. Agric. 2023, 214, 108280. [Google Scholar] [CrossRef]
- Zheng, Z.; Qin, L. Prunedyolo-Tracker: An Efficient Multi-Cows Basic Behavior Recognition and Tracking Technique. Comput. Electron. Agric. 2023, 213, 108172. [Google Scholar] [CrossRef]
- Liu, Y.; Xiao, D.; Zhou, J.; Zhao, S. Aff-Yolox: An Improved Lightweight Yolox Network to Detect Early Hatching Information of Duck Eggs. Comput. Electron. Agric. 2023, 210, 107893. [Google Scholar] [CrossRef]
- Zhang, X.; Zhu, D.; Wen, R. Swint-Yolo: Detection of Densely Distributed Maize Tassels in Remote Sensing Images. Comput. Electron. Agric. 2023, 210, 107905. [Google Scholar] [CrossRef]
- Shorten, C.; Khoshgoftaar, T.M. A Survey on Image Data Augmentation for Deep Learning. J. Big Data 2019, 6, 60. [Google Scholar] [CrossRef]
- Park, H.; Yoo, Y.; Seo, G.; Han, D.; Yun, S.; Kwak, N. C3: Concentrated-Comprehensive Convolution and Its Application to Semantic Segmentation. arXiv 2018, arXiv:1812.04920. [Google Scholar]
- Li, S.; Zhang, S.; Xue, J.; Sun, H. Lightweight Target Detection for the Field Flat Jujube Based on Improved Yolov5. Comput. Electron. Agric. 2022, 202, 107391. [Google Scholar] [CrossRef]
- Lin, T.-Y.; Dollár, P.; Girshick, R.; He, K.; Hariharan, B.; Belongie, S. Feature Pyramid Networks for Object Detection. In Proceedings of the IEEE Conference on Computer Vision and Pattern Recognition 2017, Honolulu, HI, USA, 21–26 July 2017. [Google Scholar]
- Ma, J.; Lu, A.; Chen, C.; Ma, X.; Ma, Q. Yolov5-Lotus an Efficient Object Detection Method for Lotus Seedpod in a Natural Environment. Comput. Electron. Agric. 2023, 206, 107635. [Google Scholar] [CrossRef]
- Schmidt-Hieber, J. Nonparametric Regression Using Deep Neural Networks with Relu Activation Functionhe. Ann. Stat. 2020, 48, 1875–1897. [Google Scholar]
- Woo, S.; Park, J.; Lee, J.-Y.; Kweon, I.S. Cbam: Convolutional Block Attention Module. In Proceedings of the European Conference on Computer Vision (ECCV) 2018, Munich, Germany, 8–14 September 2018. [Google Scholar]
- Ghiasi, G.; Cui, Y.; Srinivas, A.; Qian, R.; Lin, T.-Y.; Cubuk, E.D.; Le, Q.V.; Zoph, B. Simple Copy-Paste Is a Strong Data Augmentation Method for Instance Segmentation. In Proceedings of the IEEE/CVF Conference on Computer Vision and Pattern Recognition 2021, Nashville, TN, USA, 20–25 June 2021. [Google Scholar]
- Kirillov, A.; Mintun, E.; Ravi, N.; Mao, H.; Rolland, C.; Gustafson, L.; Xiao, T.; Whitehead, S.; Berg, A.C.; Lo, W.-Y. Segment Anything. arXiv 2023, arXiv:2304.02643. [Google Scholar]
- Zhang, J.; Zhang, Y.; Xu, X. Objectaug: Object-Level Data Augmentation for Semantic Image Segmentation. In Proceedings of the 2021 International Joint Conference on Neural Networks (IJCNN), Shenzhen, China, 18–22 July 2021. [Google Scholar]
- Bochkovskiy, A.; Wang, C.-Y.; Liao, H.-Y.M. Yolov4: Optimal Speed and Accuracy of Object Detection. arXiv 2020, arXiv:2004.10934. [Google Scholar]
- Zhang, H.; Cisse, M.; Dauphin, Y.N.; Lopez-Paz, D. Mixup: Beyond Empirical Risk Minimization. arXiv 2017, arXiv:1710.09412. [Google Scholar]
- Hsu, W.-Y.; Lin, W.-Y. Adaptive Fusion of Multi-Scale Yolo for Pedestrian Detection. IEEE Access 2021, 9, 110063–110073. [Google Scholar] [CrossRef]
- Lawal, O.M.; Huamin, Z.; Fan, Z. Ablation Studies on Yolofruit Detection Algorithm for Fruit Harvesting Robot Using Deep Learning. IOP Conf. Ser. Earth Environ. Sci. 2021, 922, 012001. [Google Scholar] [CrossRef]
- Chaudhari, S.; Mithal, V.; Polatkan, G.; Ramanath, R. An Attentive Survey of Attention Models. ACM Trans. Intell. Syst. Technol. (TIST) 2021, 12, 1–32. [Google Scholar] [CrossRef]


| Dataset | Resolution | Training Set | Test Set | Target Box |
|---|---|---|---|---|
| Green oranges | 2560 × 1920 | 326 | 142 | 4417 |
| Green persimmons | 198 | 83 | 1212 | |
| Green tomatoes | 219 | 94 | 751 |
| Model | P | R | F1 | mAP |
|---|---|---|---|---|
| YOLOv5-AT | 86.3 | 76.3 | 81.0 | 84.6 |
| YOLOv5 | 86 | 72.9 | 78.9 | 82.9 |
| YOLOv3-AT | 85.1 | 76.1 | 80.3 | 84.3 |
| YOLOv3 | 83.8 | 75.2 | 79.3 | 83.6 |
| YOLOv7-AT | 81 | 74.5 | 77.6 | 79.1 |
| YOLOv7 | 80.7 | 71.3 | 75.7 | 76.7 |
| P | R | F1 | mAP | |
|---|---|---|---|---|
| All-Augment | 86.3 | 76.3 | 81.0 | 84.6 |
| Mosaic | 85.2 | 72.5 | 78.3 | 82.7 |
| Mixup | 89.0 | 63.0 | 73.8 | 78.0 |
| SAM Copy-Paste | 85.5 | 66.7 | 74.9 | 78.6 |
| No-Augment | 84.9 | 63.9 | 72.9 | 77.3 |
| Proportion | Data Augmentation | P | R | F1 | mAP |
|---|---|---|---|---|---|
| 20% | √ | 81.0 | 63.5 | 71.2 | 72.8 |
| × | 72.7 | 50.8 | 59.8 | 56.3 | |
| 30% | √ | 84.2 | 68.8 | 75.7 | 78.0 |
| × | 78.3 | 54.2 | 64.1 | 60.5 | |
| 50% | √ | 86.6 | 72.7 | 79.0 | 82.2 |
| × | 85.1 | 56.5 | 67.9 | 65.5 | |
| 70% | √ | 86.3 | 74.8 | 80.1 | 82.9 |
| × | 79.6 | 59.3 | 68.0 | 68.2 | |
| 100% | √ | 86.3 | 76.3 | 81.0 | 84.6 |
| × | 84.9 | 63.9 | 72.9 | 77.3 |
| CA | SA | P | R | F1 | mAP |
|---|---|---|---|---|---|
| × | × | 85.4 | 74.8 | 79.8 | 83.4 |
| √ | × | 86 | 74.9 | 80.1 | 84.0 |
| × | √ | 85.6 | 75.4 | 80.1 | 84.2 |
| √ | √ | 86.3 | 76.3 | 81.0 | 84.6 |
| Fruit Species | P | R | F1 | mAP |
|---|---|---|---|---|
| Green tomatoes | 95.1 | 93.4 | 94.2 | 98.0 |
| Green persimmons | 85.1 | 76.0 | 80.3 | 85.1 |
Disclaimer/Publisher’s Note: The statements, opinions and data contained in all publications are solely those of the individual author(s) and contributor(s) and not of MDPI and/or the editor(s). MDPI and/or the editor(s) disclaim responsibility for any injury to people or property resulting from any ideas, methods, instructions or products referred to in the content. |
© 2024 by the authors. Licensee MDPI, Basel, Switzerland. This article is an open access article distributed under the terms and conditions of the Creative Commons Attribution (CC BY) license (https://creativecommons.org/licenses/by/4.0/).
Share and Cite
Fu, X.; Zhao, S.; Wang, C.; Tang, X.; Tao, D.; Li, G.; Jiao, L.; Dong, D. Green Fruit Detection with a Small Dataset under a Similar Color Background Based on the Improved YOLOv5-AT. Foods 2024, 13, 1060. https://doi.org/10.3390/foods13071060
Fu X, Zhao S, Wang C, Tang X, Tao D, Li G, Jiao L, Dong D. Green Fruit Detection with a Small Dataset under a Similar Color Background Based on the Improved YOLOv5-AT. Foods. 2024; 13(7):1060. https://doi.org/10.3390/foods13071060
Chicago/Turabian StyleFu, Xinglan, Shilin Zhao, Chenghao Wang, Xuhong Tang, Dan Tao, Guanglin Li, Leizi Jiao, and Daming Dong. 2024. "Green Fruit Detection with a Small Dataset under a Similar Color Background Based on the Improved YOLOv5-AT" Foods 13, no. 7: 1060. https://doi.org/10.3390/foods13071060
APA StyleFu, X., Zhao, S., Wang, C., Tang, X., Tao, D., Li, G., Jiao, L., & Dong, D. (2024). Green Fruit Detection with a Small Dataset under a Similar Color Background Based on the Improved YOLOv5-AT. Foods, 13(7), 1060. https://doi.org/10.3390/foods13071060