Abstract
Mediterranean countries are known for their high-quality olives and the production and consumption of olive oil. Olive pomace (OP), the major by-product of olive oil extraction, is receiving attention for its potential as a functional compound in food products, reflecting its physiology- and health-promoting attributes. This study assessed the physico-chemical characteristics of OP obtained from two Sardinian olive cultivars, Bosana and Semidana, and the effect of OP incorporation on the baking performance of wheat dough. We assessed the rheological parameters, pasting profile, and fermentation of doughs obtained through the partial substitution of wheat flour with OP at 0 (control), 1, 2, 3, and 5%. OP inclusion resulted in significant differences in the studied parameters compared with control samples. Positive effects included a decrease in development time, improved dough stability and storage, and superior loss modulus and gas retention capacity. Negative effects comprised an increase in dough resistance and a decrease in dough development height, gas production, gas retention, pasting profile, stickiness, and elasticity. These differences in the OP dough were due to the interactions between polyphenols and fibre with water and the starch–gluten matrix. This study found improvements in dough characteristics following the substitution of wheat flour with low percentages of OP, especially Semidana at 1%. Although higher percentages of OP would be associated with greater nutritional and health benefits, they resulted in a degradation of the dough’s attributes, producing a gluten-free-like matrix in the final product.
1. Introduction
Agro-food industry wastes are a matter of great concern due to the environmental and economic impacts their disposal has on society. Finding alternative uses for these by-products can ameliorate these effects. For instance, many products could be directed back into the food chain because of their capacity to confer health benefits when consumed, for example, by contributing towards the prevention of cancer, inflammatory disorders, and cardiovascular diseases [1]. Considering the fact that waste products arising from the agro-food industry are generally cheap and offer sources of an important number of nutraceuticals and functional compounds, such as polyphenols and fibre, the incorporation of these by-products into foods can create new products that are both more sustainable and nutritious [2,3]. However, the incorporation of functional compounds into foods can be challenging for manufacturers because it may negatively affect the product’s quality, and, thus, consumer acceptance, for example, by decreasing bread loaf volume or resulting in undesirable textural and sensory characteristics. This raises the need to find a balance between including functional compounds in recipes whilst causing minimal side effects on the product quality [4].
Considering the high consumption of cereal products worldwide, many trials have already been carried out [5] focusing on the incorporation of agro-food by-products into dough preparations [5]. Potential by-products include apple pomace [6], orange peel powder [2], tomato pomace powder [7], rosehip seed flour [8], carrot pomace [9], grape seed flour [4,10], maize bran [11], and grape pomace [12]. For example, the high fibre content of orange peel powder was associated with an improved water-binding capacity, water retention capacity, and the viscous properties of bread dough [2].
In Mediterranean countries, an important source of by-products derives from the olive oil extraction industry. Being a cheap raw material and a source of antioxidant and fibre compounds, olive oil by-products have the potential to be used in various applications such as food, nutraceuticals, animal feed, and cosmetics. Indeed, the rich source of compounds found in olives offers an excellent opportunity to transform an agricultural waste product into useful, functional ingredients. However, incorporating olive oil by-products into food products may affect their sensory and technological characteristics. As a result, determining the appropriate amounts to add requires careful evaluation. In fact, the challenge of keeping sensory and technological characteristics within acceptable ranges may significantly limit the use of olive oil by-products for food fortification [5,13].
Olive pomace (OP) is a major by-product of the olive oil industry. It constitutes around 65% of the initial weight of pressed olives, considering a three-phased pressing system, or 80% of the initial weight, considering a two-phased decanter [14,15]. It is made up of approximately 20% (w/w) olive husks and pulp and 15% (w/w) crushed olive stones, plus the residual oil and water from the olive oil extraction process [16].
Phenolic compounds are the main antioxidant elements found in OP. The principal phenolic compounds are hydroxytyrosol, oleuropein, tyrosol, caffeic acid, p-coumaric acid, vanillic acid, verbascoside, elenolic acid, catechol, and rutin [17]. Upon consumption, most are hydrolysed into hydroxytyrosol, the absorption of which takes place in the small intestine. Hydroxytyrosol and its derivatives are responsible for the “healing effect” of the polyphenols present in olive oil and OP on the human body [18,19,20]. Several studies provide evidence showing antioxidants to slow biological processes such as aging, and to protect against several diseases such as cancer, cardiovascular diseases, and diabetes [1,5,18,21,22]. Antioxidants defend cellular processes from free radicals, the molecules responsible for oxidative stress. Recent studies have also demonstrated dietary polyphenols from olive products to protect against other detrimental mechanisms and processes, for example, by participating in the activation of signalling pathways involved in the prevention of inflammation, oxidative stress, and insulin resistance [18,23]. When used as natural food additives, and, due to their antioxidant activity, polyphenols extend the shelf-life of food and help to reduce nutritional loss and the formation of harmful substances [18,24]. This effect is particularly important since their use is targeted to replace synthetic, harmful antioxidants such butylated hydroxyanisole (BHA) and butylated hydroxytoluene (BHT). OP was also identified as an important source of fatty acids—mainly oleic, palmitic, and linoleic acids [18].
Considering the health benefits of OP, the possibility of incorporating it into food is both logical and sustainable [18]. In this context, we studied the OPs derived from two Sardinian olive cultivars, Bosana and Semidana, following extra virgin olive oil production, and assessed their effects on the rheological characteristics and nutritional value of dough destined for breadmaking.
2. Materials and Methods
2.1. Sampling
Raw olive pomace (ROP) from the Sardinian olive cultivars Bosana and Semidana were collected using a LEOPARD multiphase decanter (DMF) (Pieralisi, Jesi, Italy), at Accademia Olearia (Alghero, Italy), during the 2021–2022 harvesting season. The DMF is an evolution of the two-phase decanter. It is an automated system able to operate in both continuous and batch modes. Similar to the two-phased system, the DMF does not require additional water in the malaxation step. This decanter has three outlets for collecting the oil phase, the dry solid kernel-enriched phase, and the wet semi-solid phase, thus permitting the separation of the pulp from the seed, and the collection a seedless wet pulp known as patè [25,26,27,28,29]. The dry solid phase is similar to the one obtained from three-phase decanters, with an average moisture content of 45–55%, while the pitted wet OP obtained has an average moisture content of 75–90% [30]. ROP samples were immediately frozen and stored at −20 °C until analysis.
An aliquot of each sample was freeze-dried for 48 h using a Labconco 8L −50 °C series freeze dryer (Kansas City, MO, USA) at a collecting temperature of −54.0 °C and a pressure of 0.1 mbar. The samples were then ground to a particle size < 500 µm using a domestic grinder (Moulinex A320R1, 700 W, Paris, France) to produce the final freeze-dried OP (FD-OP), and stored under vacuum conditions in the dark at room temperature until analysis.
2.2. Characterization of Olive Pomace
The moisture content of ROP samples was assessed by exposing the samples to a temperature of 105 °C in an oven until a constant weight was achieved [31]. Ash content was evaluated using a muffle furnace set to 550 °C [32]. Lipid content was assessed following the AOAC 2003.06–2006 official method [33], using a solvent extractor (SER 158, Velp Scientific, Deer Park, NY, USA) and petroleum ether (Carlo Erba Reagents, Milan, Italy) as solvent. Lipid content was quantified gravimetrically.
The protein content of ROP was determined as total nitrogen content, using the Kjeldahl method and a nitrogen conversion factor of 6.25 [34].
Water activity (aw) was determined on homogenised ROP samples using an electronic hygrometer (Aw-Win, Rotronic, equipped with a Karl-Fast probe, Bassersdorf, Switzerland) calibrated with known aw solutions of LiCl in the range of 0.1–0.95 [35].
Carbon (C), hydrogen (H), and nitrogen (N) quantification was conducted on FD-OP using a CHN628 carbon/nitrogen/hydrogen elemental analyser (Leco Corporation, St. Joseph, MI, USA). First, 100 mg of freeze-dried, ground OP was placed in a tin capsule and sealed tightly. The capsule was then loaded into the elemental analyser and heated to high temperatures in the presence of oxygen, where the conversion of C, H, and N into gaseous CO2, H2O, and N2 occurs. C and H were carried by He and detected using an IR detector, while N was carried by He through a copper column and determined using a conductivity detector. The amounts of C, H, and N in the sample were calculated based on the areas of the gases produced during combustion. Instrument calibration was performed using LCRM (Leco Certified Reference Materials) [36].
Total dietary fibre (TDF) was determined gravimetrically following enzymatic digestion using the K-TDFR analytical kit (Megazyme Ltd., Bray, Ireland) [37,38]. Enzymatic digestion began by adding 50 mL of a 0.08 M phosphate-buffered solution, pH 6, to 1 g of freeze-dried OP (FD-OP). The mixture was adjusted to pH 6, then 50 µL of heat-stable α-amylase solution were added and the mixture incubated at 100 °C for 30 min. Once cool, the mixture’s pH was adjusted to 7.5 with the addition of 10 mL 0.275 N NaOH (Sigma-Aldrich, Milan, Italy). Then, 100 µL of protease solution was added, followed by a second incubation at 60 °C for 30 min. After being left to cool, the mixture was acidified to pH 4.5 with 10 mL 0.325 N HCl (Sigma-Aldrich, Milan, Italy); then, 200 µL amyloglucosidase added. The mixture was incubated, once again, at 60 °C for 30 min. Finally, 280 mL of 95% EtOH (EtOH/H2O 95:5 (v/v), Sigma-Aldrich, Milan, Italy), pre-heated to 60 °C, were added and the mixture left to precipitate at room temperature. The filtration took place by applying suction under vacuum conditions to crucibles containing 1 g of celite and transferring the residues intermittently. The crucibles were then subjected to washes with three parts of 20 mL of 78% EtOH (EtOH/H2O 78:22 (v/v)), two parts of 10 mL of 95% EtOH, and two parts of 10 mL of pure acetone (Sigma-Aldrich, Milan, Italy). The crucibles were dried in an oven at 105 °C overnight, then incinerated.
Extraction of the phenolic portion from OP was performed as reported by Simonato et al. [39] by adding 25 mL 80% MeOH (MeOH/H2O 80:20 (v/v), Carlo Erba Reagents, Milan, Italy) to 1 g of FD-OP. The mixture was left under magnetic stirring in the dark for 1 h at 70 °C. Afterwards, the mixture was centrifuged at 3500× g for 10 min at 4 °C, and the supernatant collected was used to quantify the total phenolic content (TPC) according to the methods reported by Taghouti et al. (2018) [40], with some modifications. Briefly, 7.5 mL of reverse-osmosis water (RO) were added to 1 mL of extract, plus 0.5 mL of Folin–Ciocalteu’s reagent (Carlo Erba Reagents, Milan, Italy). The mixture was vortexed, left in the dark for 5 min, and then 1 mL 5% Na2CO3 (w/v) (Carlo Erba Reagents, Milan, Italy) was added, after which the mixture was vortexed again and left in the dark at room temperature for 1 h. Absorbance was then read at 725 nm using a spectrophotometer (Cary 3500, Agilent, Cernusco, Milan, Italy). A standard curve was created using different concentrations of gallic acid (Carlo Erba Reagents, Milan, Italy) (0.01–1 mg mL−1). The results are expressed as gallic acid equivalents (g GAE kg−1 DM of FD-OP).
The antioxidant activity of OP was assessed by adding 950 µL of 0.8 mM 2,2-diphenyl-1-picrylhydrazyl solution (DPPH, Sigma-Aldrich, Milan, Italy) to 50 µL of extract in spectrophotometry cuvettes. After incubation in the dark for 30 min, absorbance was read at 517 nm [41,42,43]. Quantification was conducted using a Trolox (Sigma-Aldrich, Milan, Italy) standard curve, and the results are expressed as a µmol Trolox equivalent (TE) g−1 of dry matter (DM) of FD-OP.
The colour attributes of each FD-OP sample were determined using a colorimeter equipped with a CR300 measuring head (Minolta CR-300, Konica Minolta Sensing, Ramsey, NJ, USA) and applying the CIELAB (L*, a*, b*) colour system.
2.3. Elemental Analysis of FD-OP and Bread Samples
2.3.1. Elemental Analysis of FD-OP and Bread Samples
In all the analytical phases, type I water (resistivity > 18 MΩ cm−1), produced using a MilliQ plus System (Millipore, Vimodrone, Italy), was used. Nitric acid (67–69% (w/v), NORMATON® for ultra-trace analysis) and hydrogen peroxide (30% (w/v), NORMATON® for ultra-trace metal analysis) were from VWR (Milan, Italy). The multi-element standard periodic table mix 1 (10 mg L−1 of Al, As, Ba, Be, Bi, B, Ca, Cd, Cs, Cr, Co, Cu, Ga, In, Fe, Pb, Li, Mg, Mn, Ni, P, K, Rb, Se, Si, Ag, Na, Sr, S, Te, Tl, V, and Zn) and mix 3 (50 mg L−1 of Sc, Y, La, Ce, Pr, Nd, Sm, Eu, Gd, Tb, Dy, Ho, Er, Tm, Yb, and Lu) for ICP were from Sigma-Aldrich (St. Louis, MI, USA). The single elemental standards for Na (1000 mg dm−3), K (1000 mg dm−3), Ca (1000 mg dm−3), Mg (1000 mg dm−3), P (100 mg dm−3), Hg (10 mg dm−3), Mo (10 mg dm−3), Sb (1000 mg dm−3), and Sn (100 mg dm−3) were from Carlo Erba (Milan, Italy). NexION KED Setup Solution (1% HCl (v/v) aqueous solution containing Co 10 μg dm−3 and Ce 1 μg dm−3) and NexION Setup Solution (1% HNO3 (v/v) aqueous solution containing 1 μg dm−3 each of Be, Ce, Fe, In, Li, Mg, Pb, and U) were from Perkin Elmer (Milano, Italy). Nylon filters (pore diameter: 0.22 μm), polypropylene (PP) metal-free tubes, and polyethene (PE) flasks were from VWR (Milan, Italy).
2.3.2. Instrumentation
Trace and toxic elemental analyses were performed on a NexION 300X ICP-MS (inductively coupled plasma mass spectrometry) spectrometer equipped with an S10 autosampler, a glass concentric nebuliser, a glass cyclonic spray chamber, and a kinetic energy discrimination (KED) collision cell, all produced by Perkin Elmer (Milan, Italy). Macro elemental (Na, Mg, K and Ca) analysis was performed on an AAS (Atomic Absorption Spectrometry) analyst 200 spectrometer, produced by Perkin Elmer (Milan, Italy). The analysis of total phosphorus was carried out using the colorimetric method, by reacting an aliquot of the mineralised sample extract with phosphomolybdic reagent reduced with ascorbic acid. The colouration, developed from the reduced phosphomolybdic reagent reaction, was then measured using an Agilent Cary 60 fibre optic spectrophotometer, referring to a previously prepared calibration curve. Samples were digested using a microwave single reaction chamber (SCR) system (ultraWAVE™, Milestone, Sorisole, Italy) equipped with fifteen polytetrafluoroethylenes (PTFE) vessels (volume: 15 cm3 each).
2.3.3. Sample Preparation
Samples were prepared by microwave acid digestion. The procedure allows the almost complete oxidation of the organic matrix and the extraction of metals and elements from the sample. Hence, optimal digestion was crucial for the ICP-MS analysis because it ensures recovery of all the analytes and bias-free preparation. The digestion procedure was performed using a mixture of 0.200 g of sample, directly weighed in the vessels, plus 1 mL HNO3 (67–69% (w/v)), 2 mL H2O2 (30% (w/v)), and 4 mL H2O. The digestion temperature of 240 °C was attained in 20 min and held for 10 min. After cooling at 40 °C, samples were collected, diluted to 15 mL, and filtered before analysis. Three blanks were prepared for each digestion batch, which underwent the same treatment as samples.
2.3.4. Sample Analysis
The elemental analysis involved three different analytical techniques: ICP-MS, AAS, and UV–visible spectroscopy. ICP-MS is the ideal technique for trace and ultra-trace element analysis. On the other hand, AAS ensures excellent performances for the determination of elements in high concentrations, such as Na, Mg, K, and Ca. Finally, UV–visible spectroscopy is a valid alternative for phosphorus analysis, utilising the colorimetric method.
Concerning ICP-MS analysis, the elemental settings and parameters are reported in Table 1. This method was partially validated in terms of its limit of detection (LOD) and quantification (LOQ), repeatability (RDS%, analysis in triplicate), and linearity (calibration range). The validation parameters are reported in Table 2. Calibration standards were prepared from multi-elemental and single standard solutions in 2% HNO3 aqueous solution.

Table 1.
Instrumental parameters and elemental settings of NexION 300X ICP-MS.
Table 2.
Validation parameters of the ICP-MS method.
The elements found at very low or negligible concentrations in OP (e.g., rare earth elements) were not analysed in the fortified dough samples.
2.4. Dough Preparation
A type 00 commercial wheat flour (wheat variety: Triticum aestivum), provided by SIMEC Spa (Santa Giusta, Italy), was used for dough preparation. Its chemical composition was as follows: 14% moisture, 11.6% protein, 1.5% lipids, 3.8% fibre, and 0.1% ash. Dough samples were developed according to a basic bread formula: type 00 wheat flour, plus 1.8% salt, 2% yeast, and water. The amount of water to add was determined using a Farinograph-TS rheometer (model 827507, Brabender, Duisburg, Germany) equipped with a mixer S 300 N, and depended on the weight of wheat used and the substitution percentage of the ground FD-OP used (1%, 2%, 3%, and 5%), as shown in Table 3.
Table 3.
Bread dough formulations: percentage of FD-OP, yeast, and salt for different water percentages as determined by farinography.
The dough for farinograph analysis was prepared using wheat flour, OP, and water only, to eliminate the effects that the salt or yeast may have on the results. Trials were repeated until an average consistency of 500 Brabender units was reached. A consistency between 480 and 520 was considered acceptable [44]. The pH of the dough was also measured before and after the first bulk leavening.
2.5. Dough Measurements
2.5.1. Dough Extensibility and Stickiness
Uniaxial extensional characteristics of the experimental doughs were measured using a TA-XT plus texture analyser (Stable Micro Systems, Surrey, UK) with Texture Expert software 6.1.10.0 version for Windows with the Kieffer dough extensibility rig and a 30 kg load cell. A freshly prepared piece of dough weighing 30 g was placed in a Teflon mould with a grooved base that was lubricated with paraffin oil to prevent sample adhesion. The dough was prepared without the addition of yeast. The top plate of the mould was then attached to the dough to obtain uniform dough strips, which were then kept in a climate chamber set to 30 °C and 85% RH for 40 min before testing. The following settings were used to assess extensibility on at least ten dough strips: pre-test speed, 2.0 mm s−1; test speed, 3.3 mm s−1; post-test speed, 10.0 mm s−1; trigger force, 5 g; and an extensibility distance of 100 mm. Using the force–distance curves generated, we recorded the maximum peak force (in N), known as resistance to extension (REXT), and the distance (in mm) required to break the dough strips, noted as extensibility.
The stickiness of the dough was evaluated using a TA-XT plus texture analyser (Stable Micro Systems Ltd., Godalming, UK). To measure dough stickiness, a small amount of dough was placed in a chamber and closed firmly with a lid. The dough was then pushed out through small holes in the lid by turning an internal screw and left to rest for 30 s. To prevent loss of moisture, a perspex cap was placed over the dough surface. Afterwards, the cover was removed and a SMS/Chen-Hoseney dough stickiness rig (A/DSC) with a 25 mm cylindrical probe (probe SMS P/25) was connected to the load cell of the texture analyser. Measurements of dough viscosity (in N) were conducted ten times on each dough sample at room temperature, and each dough formulation was prepared and tested twice.
2.5.2. Rheofermentometer Analysis
The fermentation characteristic of the doughs containing different percentages of FD-OP were assessed by measuring dough development and carbon dioxide production and retention using a Rheofermentometer F3 (Chopin, Villeneuve-La-Garenne, France). To perform the test, 315 g of dough was prepared in the same way as described above, then incubated for 180 min at a temperature of 28.5 °C in a fermentation chamber and covered with a stainless-steel cylinder without any additional weight. From the rheofermentometer curves, we obtained the following: the maximum dough development height (Hm, in mm); the time taken to achieve maximum dough rise (T1, in min); the final dough height at the end of the test (h, in mm); the percentage decrease in dough volume at the end of the test ((Hm-h)/Hm, in %); the maximum height of gaseous release (H’m, in mm); the total amount of gas produced (VTOT, in mL); the amount of gas retained (VRET, in mL); the amount of gas released (VREL, in mL); and the gas retention coefficient (RC), calculated as VRET/VTOT (%). The test was performed twice for each dough formulation.
2.5.3. Small Deformation Characteristics
To determine the rheological properties of the dough, we performed an oscillation test using a dynamic shear rheometer (Anton Paar MCR 92, GmbH Inc., Graz, Austria) equipped with a 50 mm plate (P50/P2). The dough samples were prepared without yeast and left to rest at room temperature for 20 min before analysis. Around 2 g of dough core was taken using a spatula and placed between the plates for 2 min to relax, with the upper plate lowered against the sample to achieve a dough thickness of 2 mm. A thin layer of paraffin oil was applied to the sample edge to prevent moisture loss. To identify the region of linear viscoelasticity of the dough, we conducted a single amplitude oscillatory strain experiment (0.01–10%) on each sample applying an oscillation frequency of 1 Hz. The tests were performed at 20 °C. To measure storage modulus (G′) and loss modulus (G″), we made frequency sweep measurements (0.1–10 Hz) at a constant tension of γ 0.1% within the linear viscoelastic range. Each dough formulation was prepared twice, and each sample measured at least three time.
2.5.4. Rapid Visco Analyser (RVA)
We used a rapid visco analyser (RVA-4, Newport Scientific, Warriewood, Australia) to analyse the pasting characteristics of the different dough samples (prepared using three different percentages of OP for each olive cultivar), and placed 3 g flour and 25 mL distilled water in the canister of the analyser to prevent the formation of lumps. The RVA test was conducted following the AACC method 76-21 [45]. The software program Thermocline 2.6 version for Windows was used to calculate the following parameters from the pasting curve: pasting temperature; peak time (when peak viscosity occurred); peak viscosity (maximum hot paste viscosity); holding viscosity (minimum hot paste viscosity); breakdown (peak viscosity minus holding viscosity); and total setback (final viscosity minus holding viscosity). Each dough formulation was prepared twice, and three measurements were recorded for each dough.
2.6. Statistical Analysis
Statistical analysis was performed using Minitab® 17.1.0 software (Minitab, LLC, State College, PA, USA). All analyses were performed in at least triplicate. For OP analyses, t-tests were carried out to compare differences between cultivars. For dough analyses, means were compared by one-way analysis of variance (ANOVA), followed by Tukey HSD for the separation of significant means. Statistical significance was considered for a p-value < 0.05 (confidence level of 95%).
3. Results and Discussion
3.1. Characterization of Olive Pomace
The results of proximate analysis for raw and freeze-dried OP obtained from the two cultivars Bosana and Semidana are reported in Table 4 and Table 5, respectively; the colour analysis results are shown in Table 6, and the mineral compositions of FD-OP for the two cultivars are reported in Table 7.
Table 4.
Macro composition of raw olive pomace (ROP) from olive cultivars Bosana and Semidana.
Table 5.
Macro composition of freeze-dried olive pomace (FD-OP) from olive cultivars Bosana and Semidana.
Table 6.
Colour analysis of FD-OP from cultivars Bosana and Semidana.
Table 7.
Mineral composition of freeze-dried olive pomace (mg kg−1 FD-OP) from cultivars Bosana and Semidana.
OP is what remains after olive oil extraction. Its composition, which comprises water, oil, and an important quantity of bioactive compounds, depends on the olive variety, maturation stage, relative yield, climatic conditions, agricultural practices, the season, and storage conditions [46,47].
The macro composition of raw olive pomace (ROP) showed significant differences between the cultivars for all parameters analysed, except water activity. Bosana had a significantly higher dry matter (25.36%) content, as well as higher fat (17.57%), protein (6.14%), and ash (5.29%) content reported on dry matter. The OP from Bosana had a significantly greater protein content compared with that from Semidana, which also coincided with the nitrogen content that was used to calculate the protein content. As the moisture content of OP can vary greatly, reaching up to 70% [46], depending on the season, the variety, and the extraction system, it was necessary to obtain the dry matter content, which was below 30% for both varieties.
The results, in particular, the protein and nitrogen (N) content, agreed with those obtained in the study conducted by Nunes et al. [46]. Elemental analysis of FD-OP did not result in significant differences between cultivars in carbon (C) or hydrogen (H) content. Moreover, the results obtained for N, C, and H corroborated the findings from previous studies [48,49,50].
The freeze-drying process allowed us to obtain FD-OP for both cultivars with a moisture content lower than 5%. Caponio et al. [41] reported a similar dry matter and protein content for FD-OP, whereas significant differences were seen in the total dietary fibre (TDF)/DM, for which they reported 20.10% compared with the 61.1% (Bosana) to 66.7% (Semidana) observed in the present study. Other studies report TDF levels closer to those found here, such as 43.75% [51], 54.5% [52], and 57.96% [53].
The fat content corresponded to that reported by de Gennaro et al. [43], at around 22%.
Water activity (aw) did not exhibit any significant differences between cultivars and was considered relatively high, ranging from 0.97 to 0.98. These results were in accordance with those published by Alhamad et al. [54]. A high aw is attributed to the free movement of water molecules induced by the fat content [54]. Furthermore, such a high aw promotes bacterial growth in the matrix [54]; therefore, decreasing the water content by drying the pomace is recommended and promotes their antimicrobial activity related to the presence of antioxidants [55].
OP is known to be a good source of functional compounds, including polyphenols [41]. TPC significantly varied between the OP from Semidana, at 28.36 g GAE kg−1 FD-OP, and OP from Bosana, at 42.67 g GAE kg−1 FD-OP. Caponio et al. [41] reported a much higher TPC, higher with respect to our results at 75.76 g GAE kg−1 FD-OP. On the other hand, a lower TPC was reported by Simsek and Süfer [53], at 14.04 g GAE kg−1 FD-OP, and by Simonato et al. [39], at 25.23 g GAE kg−1 FD-OP. Simsek and Süfer [53] claimed that, during olive oil extraction, approximately 45% of the TPC is lost in the OP. The amount of polyphenols present in OP contributes to its distinguished antioxidant activity [43,56], but the DPPH assay in our study did not show any significant difference between the OPs obtained from the two cultivars studied. The literature reports similar results for the antioxidant activity of OP, as assessed by DPPH assay [41,43], but our results were distinctly higher than those reported by Simonato et al. [39] and Simsek and Süfer [53].
Regarding the colour attributes, the L* and a* parameters did not show any significant differences between the two cultivars, while the b* parameter was significantly different between the Bosana and Semidana OP, as shown in Table 6.
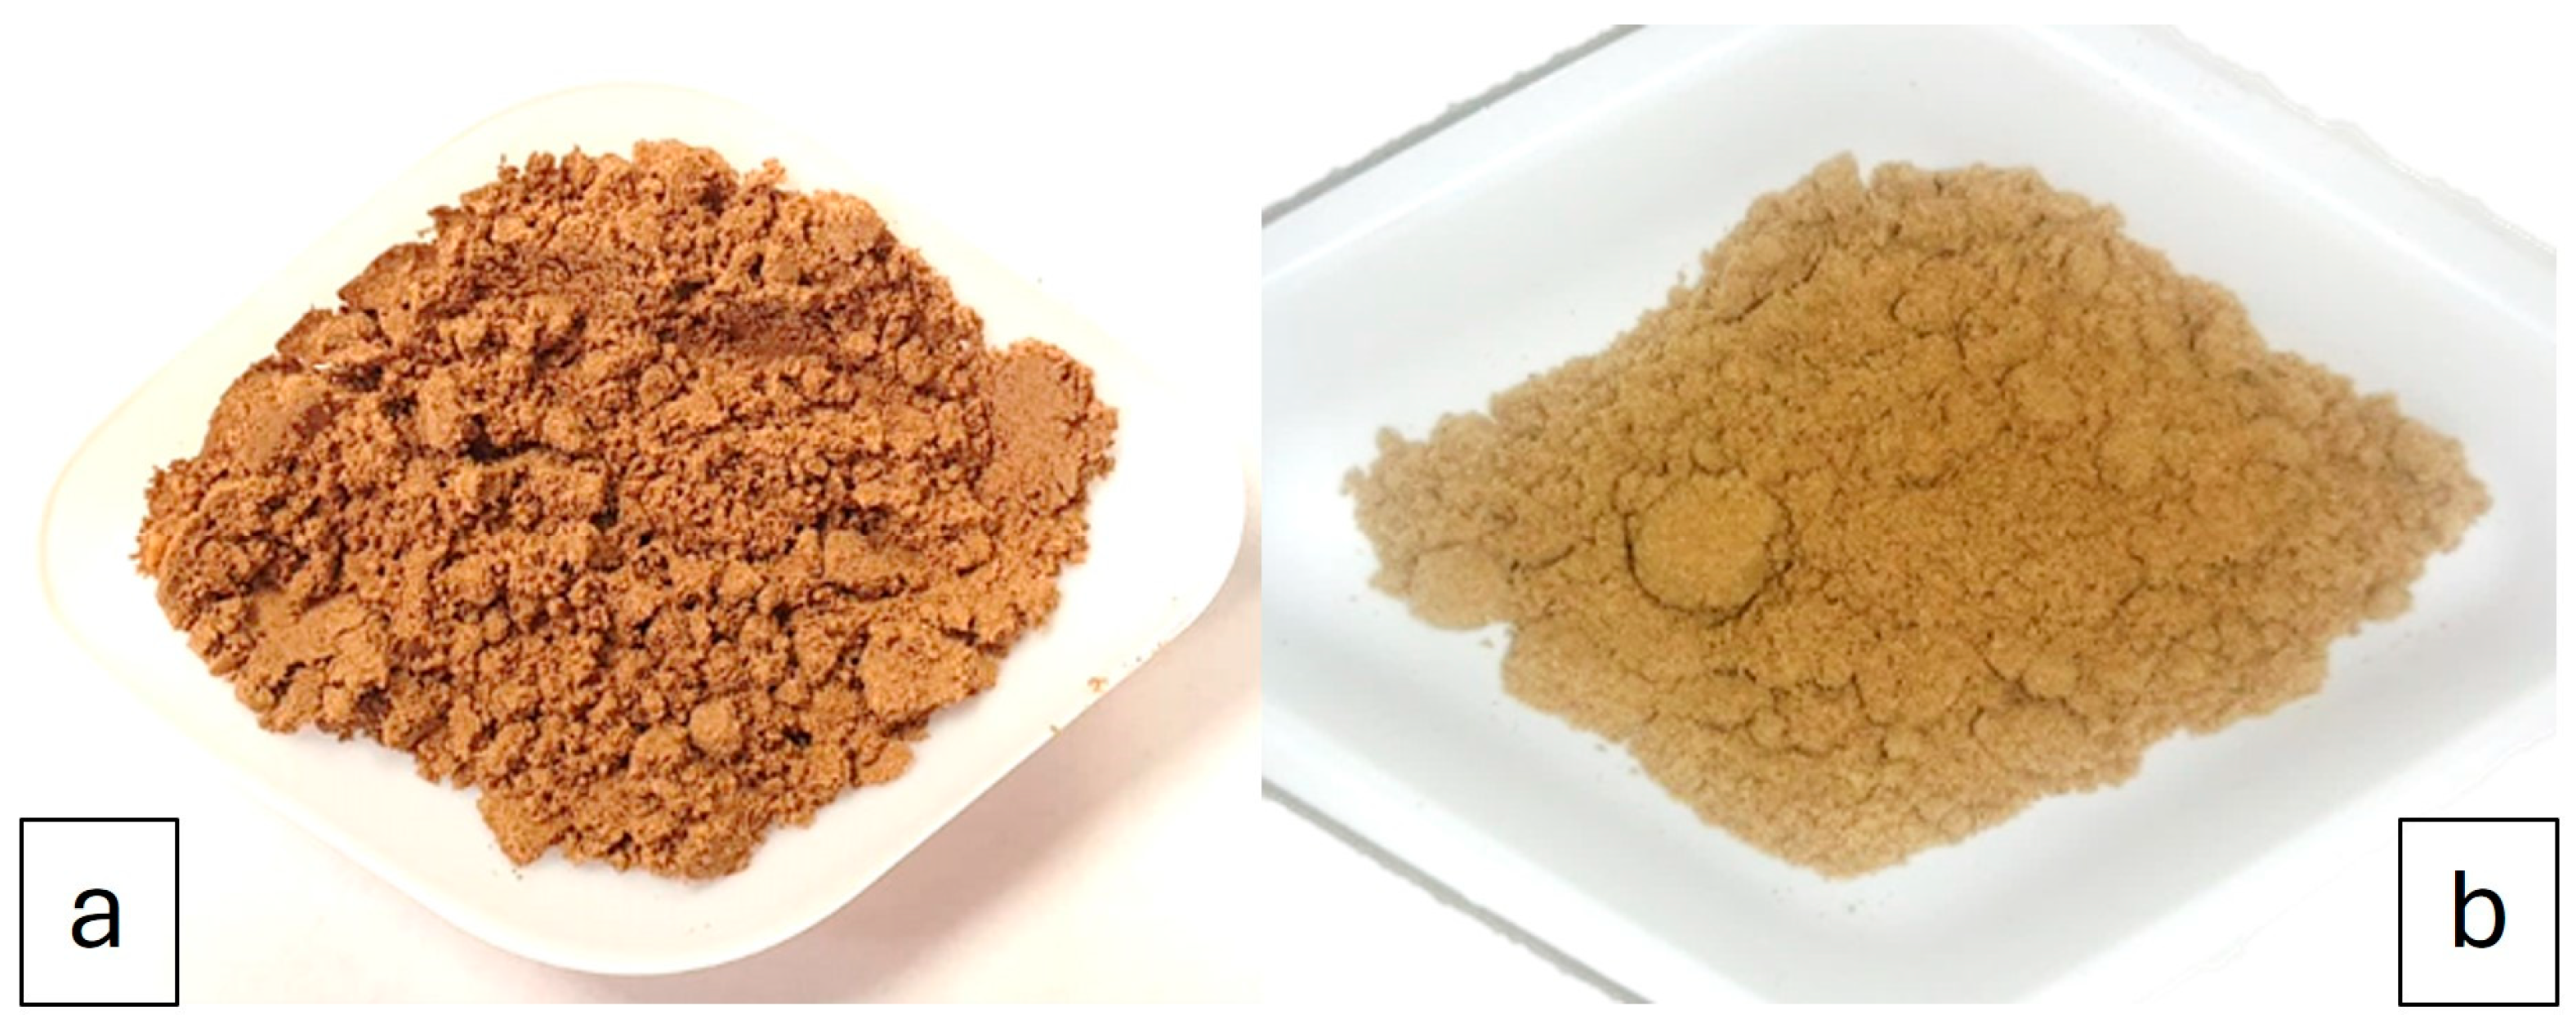
Figure 1 shows the photographs of freeze-dried OP from cultivars Bosana and Semidana. Cedola et al. [5] stated that the high content of polyphenols is responsible for the purplish colour of the OP, and this is explained by the negative b* value of the Bosana OP, which appears to be more purple. A lot of factors affect OP colour, but the proximate composition of the variety has the biggest influence [57].
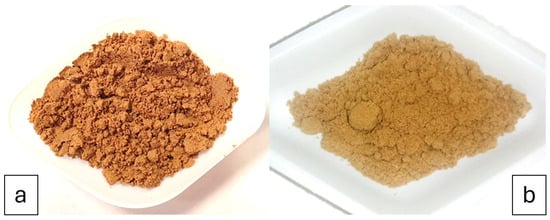
Figure 1.
Digital photograph of FD-OP from Bosana (a) and Semidana (b) cultivars.
To our knowledge, only a few studies have explored the mineral composition of OP from Olea europaea L., and none have conducted studies on Bosana or Semidana. OP is rich in minerals [58], and especially in macro elements important for the diet such as calcium, magnesium, sodium, potassium, and phosphorus (Table 7).
Only magnesium and potassium exhibited significant differences, and both were higher in FD-OP from the Bosana cultivar.
In a study conducted by Pošćić et al. [59], the elemental composition of OP was examined in order to improve the quality of EVOO, as residues of OP affect its overall composition and quality. The study examined OP from the cultivar Oblica, harvested along the Croatian coast, and all the detected elements fell within the same range as observed in the present study, with the exception of Na and P, which were higher in the OP of Bosana and Semidana.
The differences in the elemental composition of olives, their oils, and OP is greatly affected by the temperature, latitude, and distance from the sea of the provenance sites, as well as by the year of harvest, even at the same site [60].
3.2. Dough Preparation and Breadmaking %
The Pasting Profile of Dough
Table 8 reports the data on dough development time (DDT), consistency, water added (WA), and stability (S) for the control dough and the doughs obtained through the partial substitution of flour with different percentages of Bosana and Semidana OP.
Table 8.
Dough mixing properties according to the farinograph.
Water absorption is affected by the dough’s starch, damaged starch, and protein and pentosan content, and by its gluten network. Freeze-dried ground OP has a softer texture than wheat flour, and this allows the OP particles to hydrate and swell faster than those of the wheat flour, necessitating a smaller percentage of added water in the fortified doughs [44,61]. As reported in Table 3, the added water percentage became lower as the OP inclusion rates rose, starting at 54% for 1% Bosana, and 54.5% for 1% Semidana. This may be due to the fact that, although the substituting pomace percentage was low, its presence increased the protein content in the dough, but it was not high enough to decrease the starch content to a point that the presence of both protein and starch required these water absorption percentages [61].
The time required to form the control dough was around 17 min. However, the addition of OP significantly quickened dough formation, which took a maximum of 1 min 30 sec to make (Table 8). The DDT is the length of time between the addition of water and the beginning of the formation of a homogenous and smooth dough. The doughs fortified with FD-OP had a better water absorption capacity, associated with the prominent fibre content, which led to better consistency and faster dough formation, thus decreasing the DDT [44,62].
The variable ‘stability’ showed the same trend as the added water percentage, and it was significantly ameliorated with the addition of Semidana FD-OP at 1%, while it remained the same as for the control dough upon the incorporation of Bosana FD-OP at 1% and Semidana FD-OP at 2% and 3%, which showed non-significant differences between them. As reported in Table 8, the stability time of dough at these FD-OP incorporation levels varied between 2 min 1 s and 2 min 39 s; the stability time of the control dough was 2 min. The stability time is the duration of mixing at which the dough has an ideal consistency. The higher stability of the dough with lower pomace substitution percentages is associated with the interactions between the dietary fibre, water, and flour protein, which disrupt the gluten–starch interface, leading to better stability [44,62]. By contrast, the lower stability of the dough with higher OP percentages was related to their lower gluten content and, thus, weaker gluten network, as a consequence of the lower starch percentage; the weaker gluten network was also favoured by the ability of OP to soften the dough [44,62].
3.3. Dough Measurements
3.3.1. Extensibility and Stickiness of the Dough
Dough stickiness, also known as dough adhesiveness, refers to the dough’s ability to adhere to surfaces. Higher stickiness values are not favourable because increased adhesiveness may result in production interruption, waste, and contamination. Likewise, low stickiness is also not desirable as it would produce a dough that is unable to maintain its shape [63,64]. The stickiness of the control dough versus the doughs with different OP substitution levels are summarised in Table 9.
Table 9.
Effect of OP on dough stickiness and resistance to extension.
The incorporation of FD-OP at 1% for both cultivars and at 2% for the Semidana cultivar had no significant effect on dough stickiness. However, all the other percentages significantly decreased the stickiness of their respective doughs. Higher stickiness levels are attributed to higher amounts of water which are distributed in the dough either in bulk or within the starch–gluten matrix. Free water molecules are responsible for the stickiness. Therefore, increasing fibre content in the dough, by increasing the OP substitution level, traps water molecules within the formed fibre connections, disrupting the gluten network. As a result, water molecule availability decreases and the dough’s stickiness also decreases [63,64]. Similar results were obtained by Struck et al. after fortifying bread dough with blackcurrant pomace, which is also rich in fibre. [64].
Measurements of the dough’s resistance to extension are reported in Table 9. Increasing the FD-OP substitution level led to a significant increase in the dough’s resistance to extension at all the inclusion percentages compared with the control, as well as between inclusion levels. The effects of FD-OP on the dough’s extensibility properties, which became less flexible and more rigid with respect to the control dough, were consistent with the literature and other research using different sources of dietary fibre such as rosehip seed flour [8], Malva aegyptiaca L. leaf powder [65], brewer’s spent grain, and apple pomace [66]. In accordance with Gül and Şen [8] and Struck et al. [64], these results can be attributed to poorer gluten networks due to fibre incorporation, resulting in stiffer and firmer dough. Glutenin is the building block of the gluten network and it is responsible for the dough’s elasticity. It achieves this through creating intermolecular disulphide bonds with other glutenin molecules [67,68]. These cross-links create a stable and elastic network, which gives the dough its resistance [67,68]. This explains the decrease in elasticity upon dilution of the gluten content with fibre-rich FD-OP.
3.3.2. Rheofermentometer Analysis
The dough fermentation properties, as measured by rheofermentometry, are shown in Table 10.
Table 10.
Effect of Bosana and Semidana FD-OP on the leavening properties of dough as assessed through rheofermentometry.
Upon fermentation, yeast produces gas that spreads into the dough and increases the number of air bubbles. The withheld gas in the dough is the ratio between gas production and gas retention. On the other hand, a lower (Hm-h)/Hm indicates greater dough stability and, therefore, a greater gas retention ability [63].
Increasing the OP percentages quickened dough formation. The sample height (Hm) of all samples fortified with OP, from both olive cultivars and at all percentages (1%, 2%, 3%, and 5%), were significant lower compared with the control. The Hm decreased as the percentage of OP substitution increased. This is because ground FD-OP is both gluten-free and fibre-rich, which, subsequently, dilutes and, thus, disrupts the dough’s gluten network, leading to a less-risen dough. A lower Hm denotes that the gas produced during fermentation was not sufficient or properly distributed within the air bubbles to support the overall structure of the dough as it should have during proofing. This can result in a dough that does not rise properly, leading to a denser bread that is not as light and airy as desired [4]. Consequently, increasing the FD-OP levels decreased gas production (Vt) due to the reduced particle size of the FD-OP and the reduced interactions of bioactive compounds found in the FD-OP with the activity of the yeast responsible for gas production. This decrease in gas production is inversely proportionate to the gas retention capacity expressed by Vr/Vt [4]. This explains the significant increase in gas retention with the addition of the OP, regardless of the cultivar and the percentage of use, and it highlights the greater ability of the OP-fortified dough samples to retain gas during the leavening process, as reflected in the significantly higher gas retention capacities for both cultivars compared with the control (p-value < 0.05).
The dough’s stretching capacity is also associated with the retention coefficient, as well as with the quality of the gluten protein network and particle size [4,63]. This means that increasing the FD-OP percentage progressively weakens the gluten network, and produces a dough with a poorer capacity to increase in volume, but FD-OP dough also has less gas production and a smaller particle size, equating to better gas retention. However, apart from the control, the best dough consistency, viscosity, and stability values were found in the dough with 1% Semidana FD-OP. This dough showed a greater water absorption capacity. Higher percentages of FD-OP resulted in reduced dough consistency.
3.3.3. Small Deformation Characteristics (Rheometer Analysis)
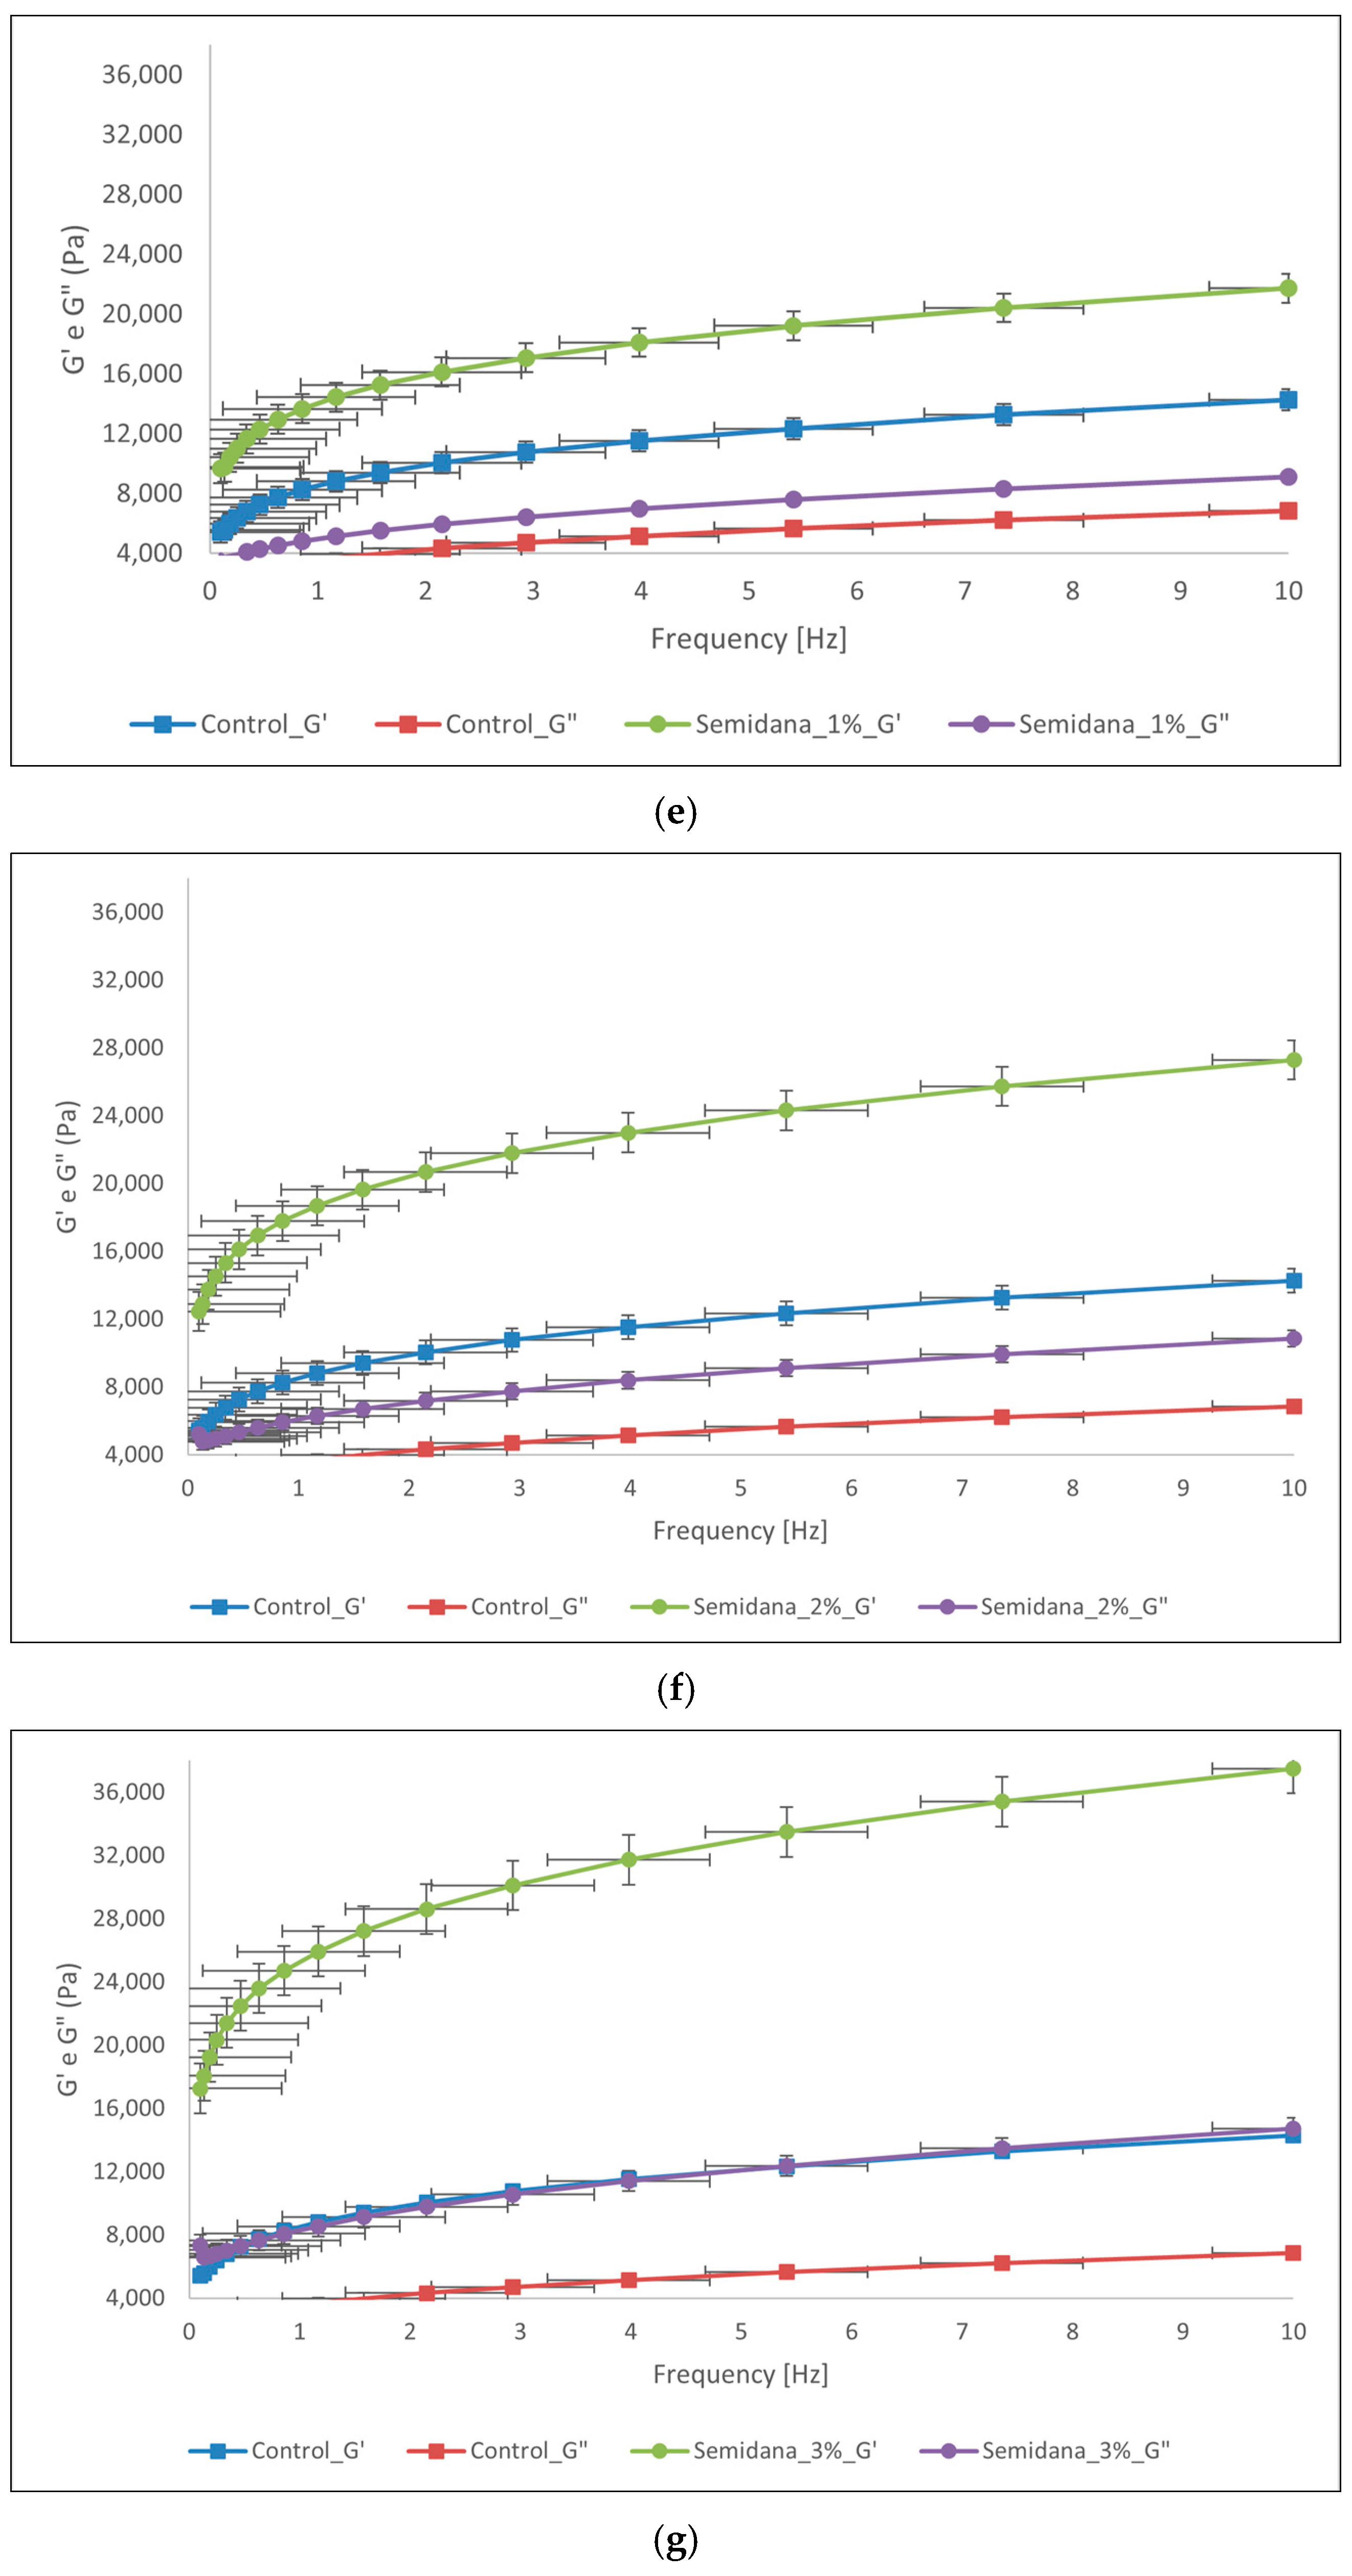
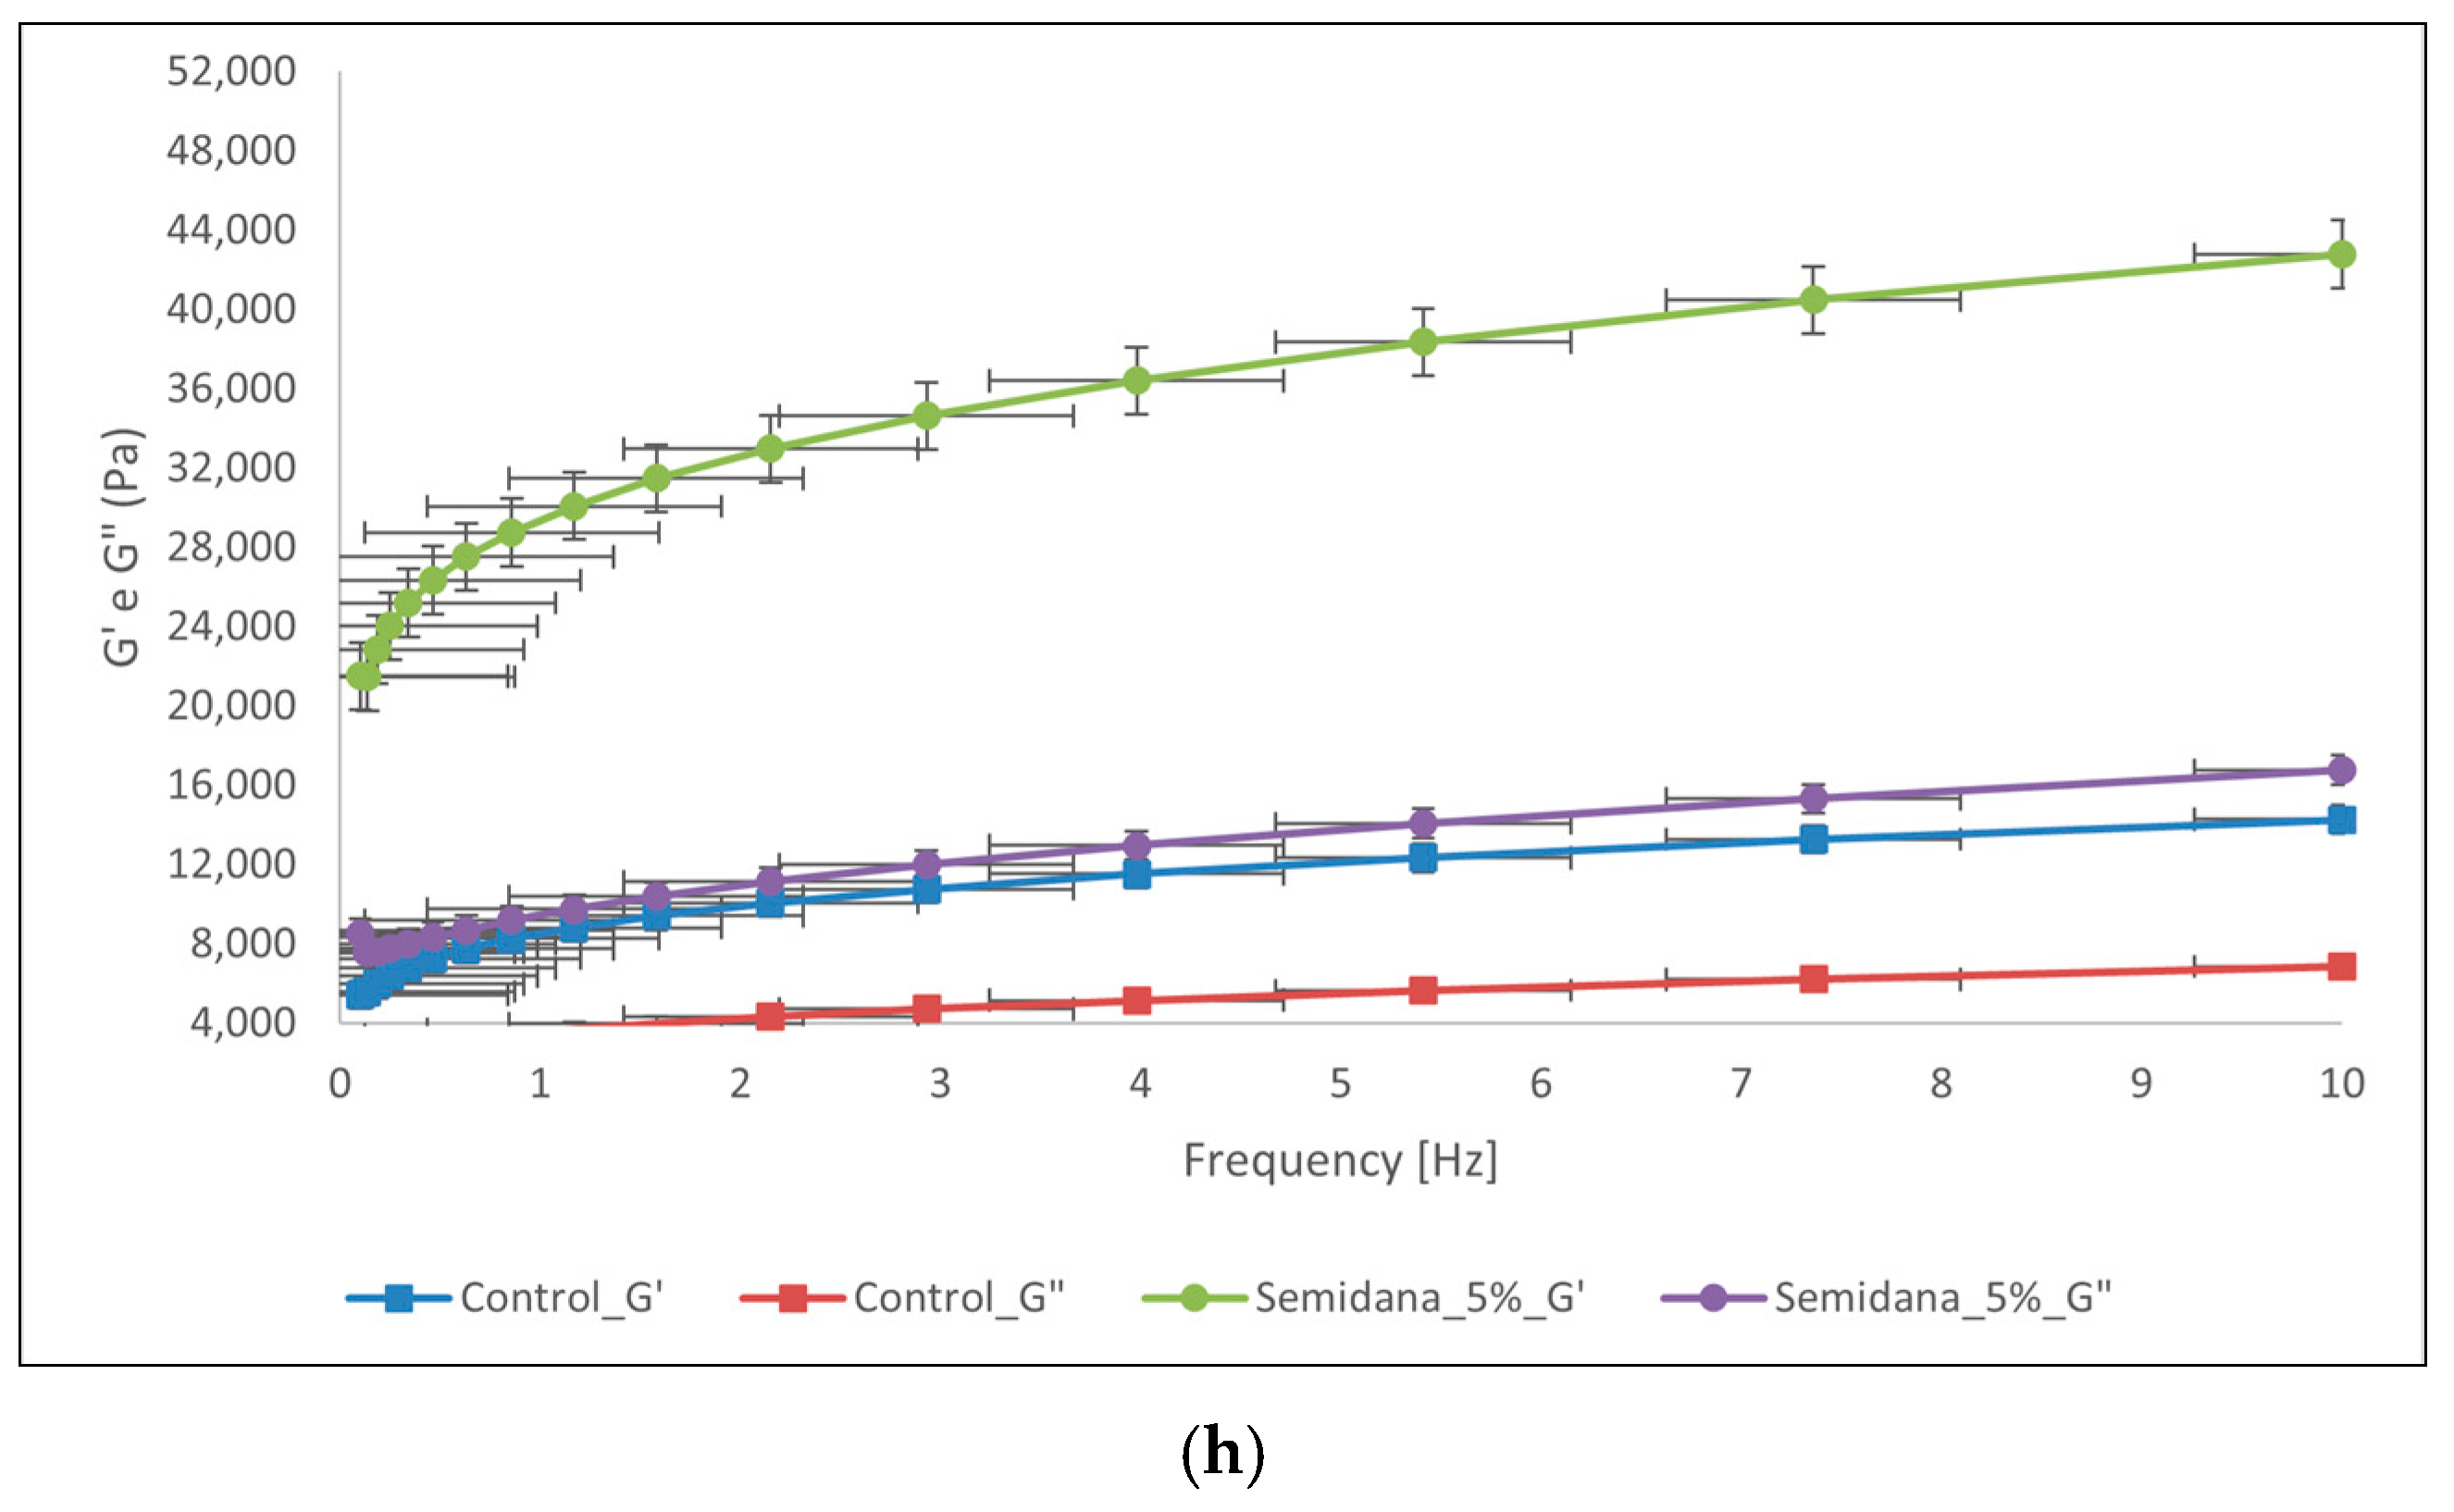
The storage modulus (G’) and loss modulus (G”) of the dough samples are reported in Figure 2.
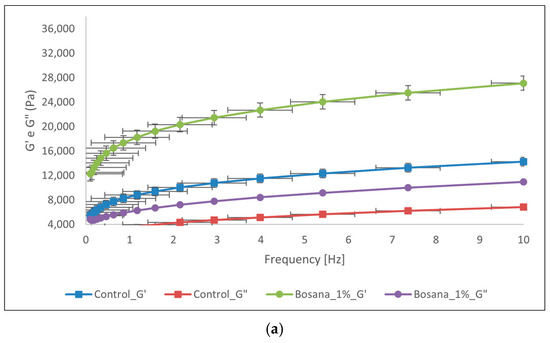
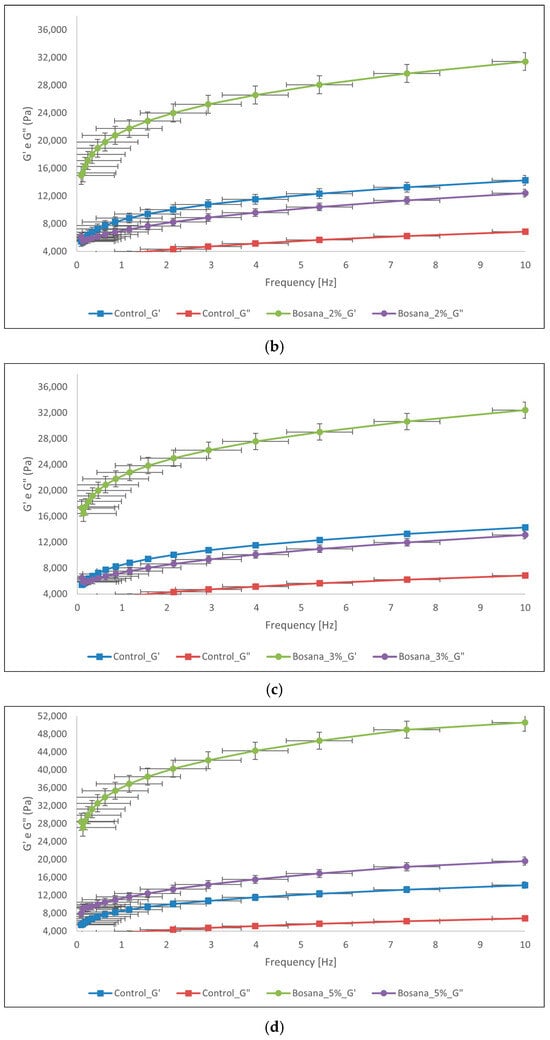
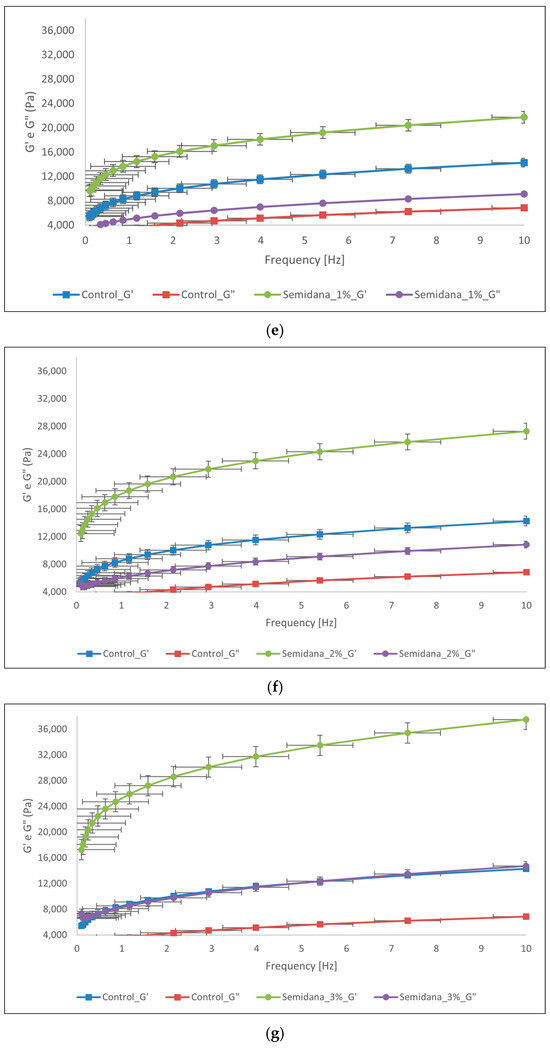

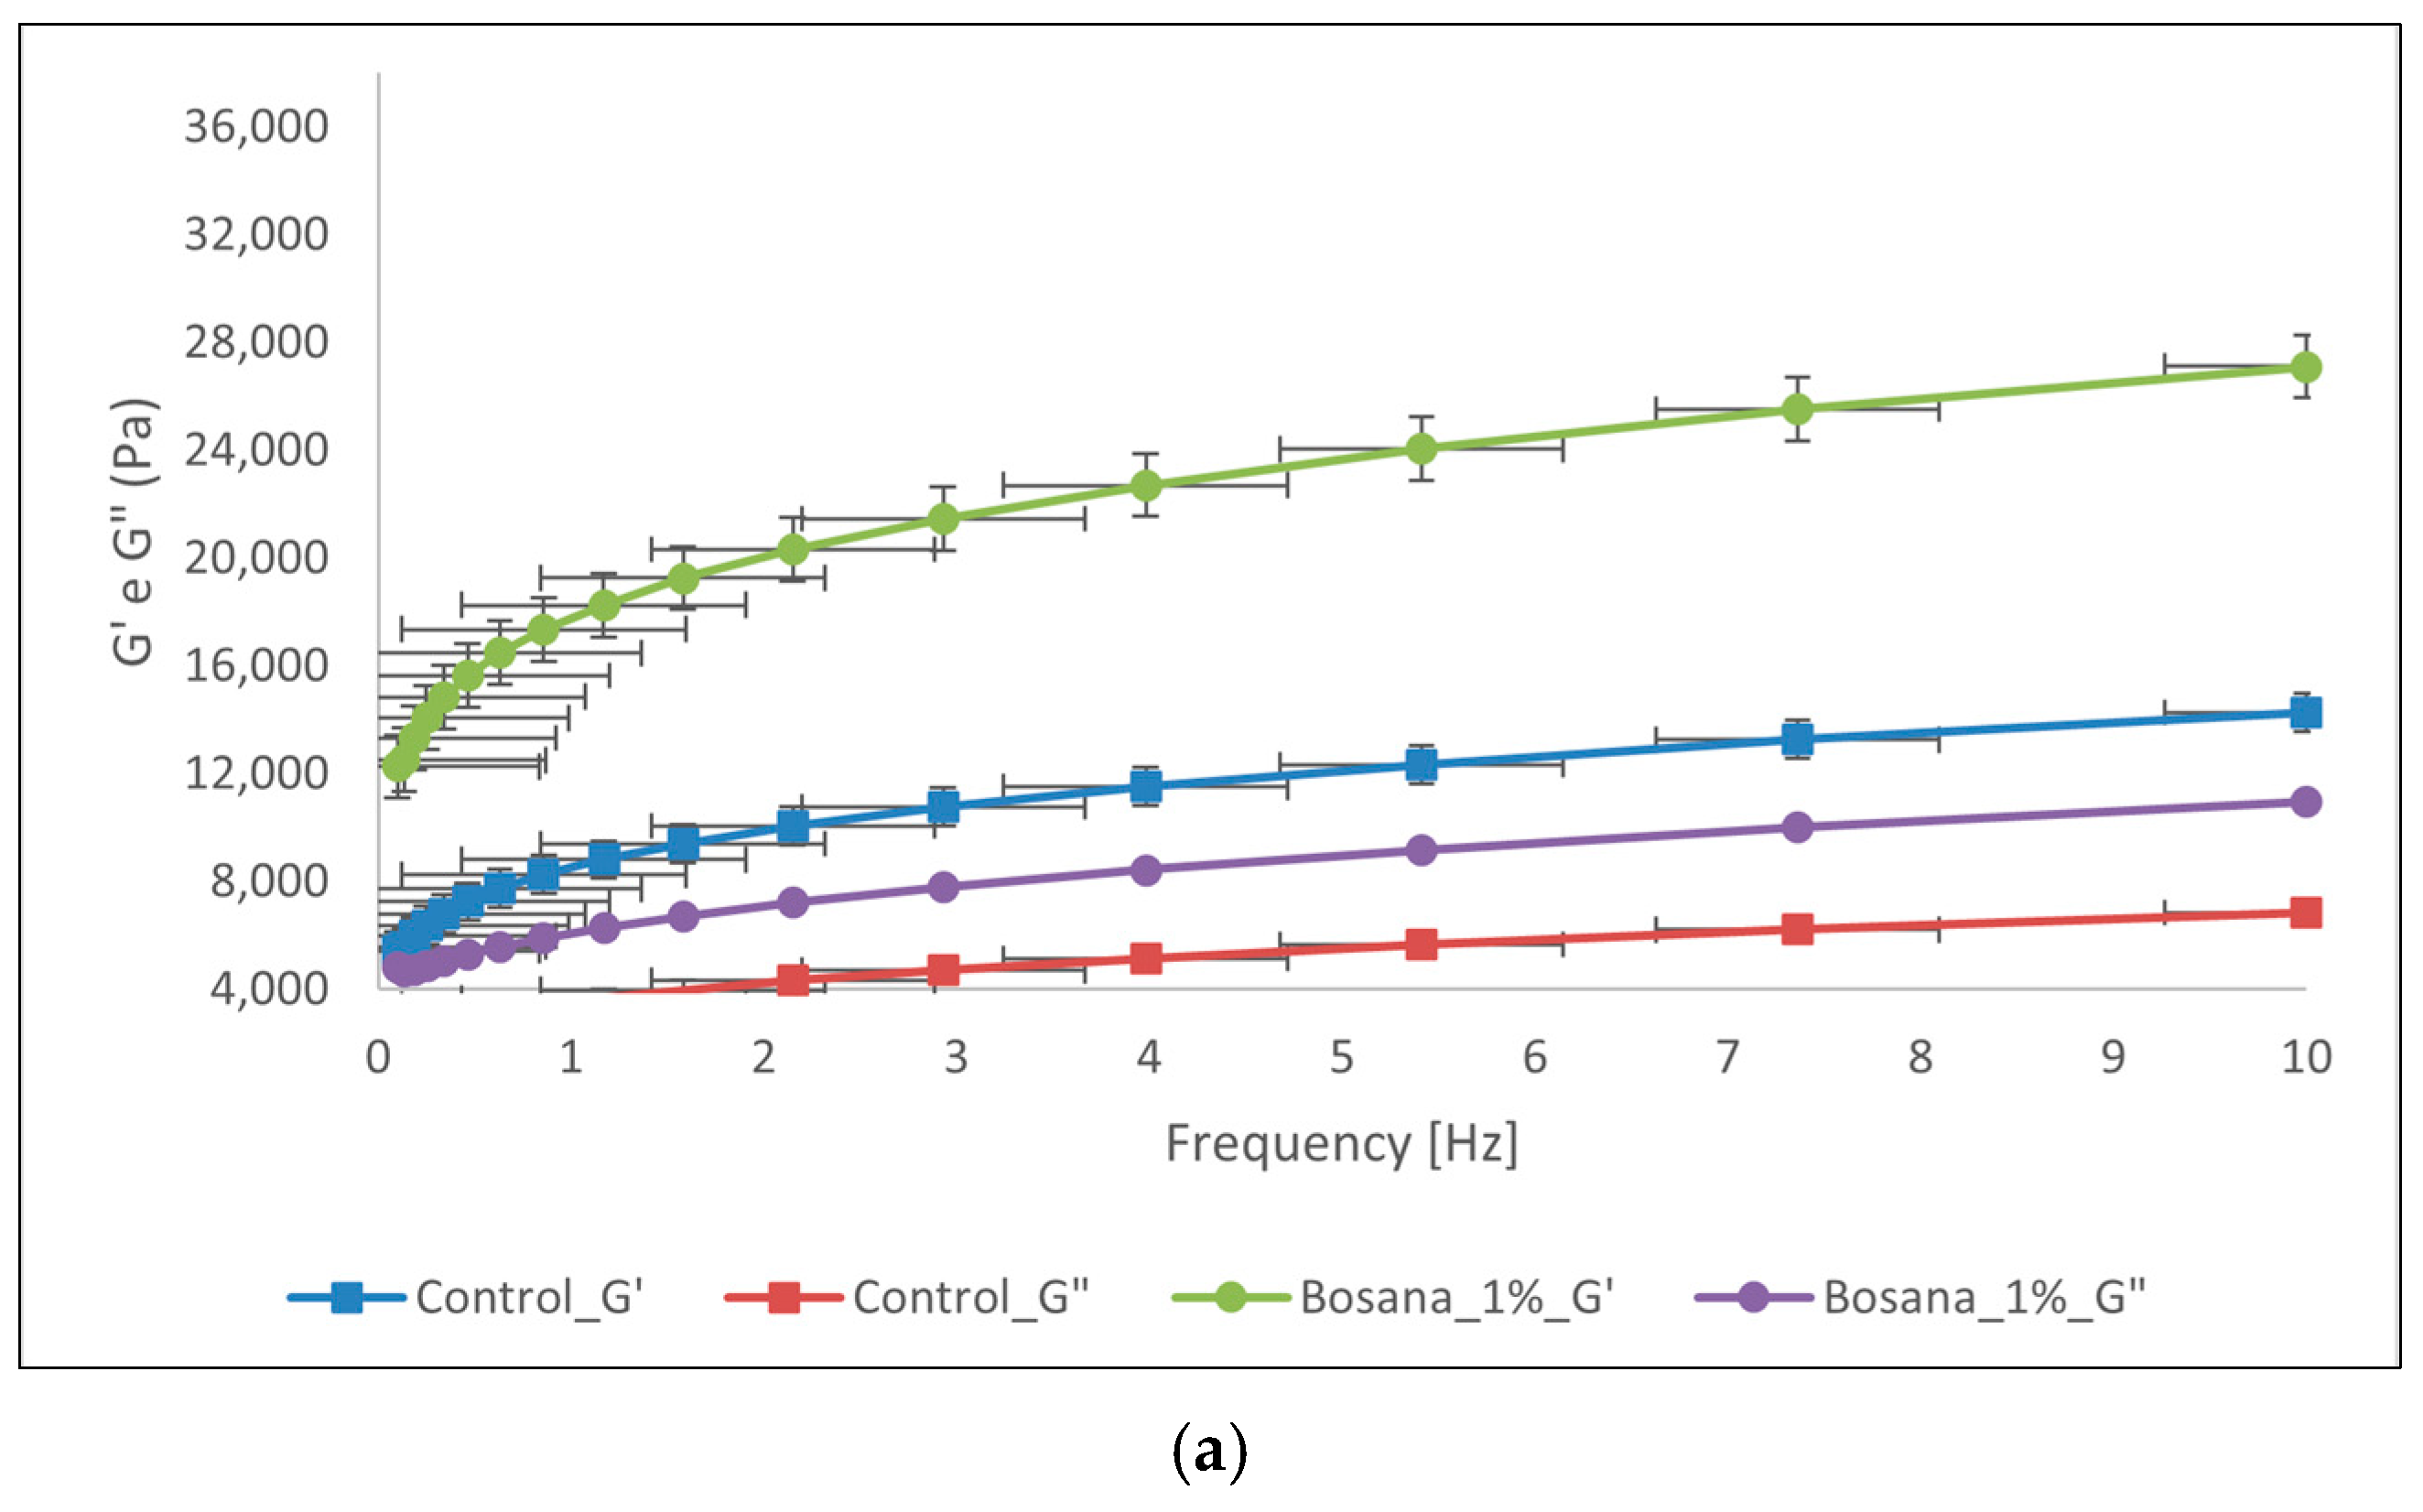
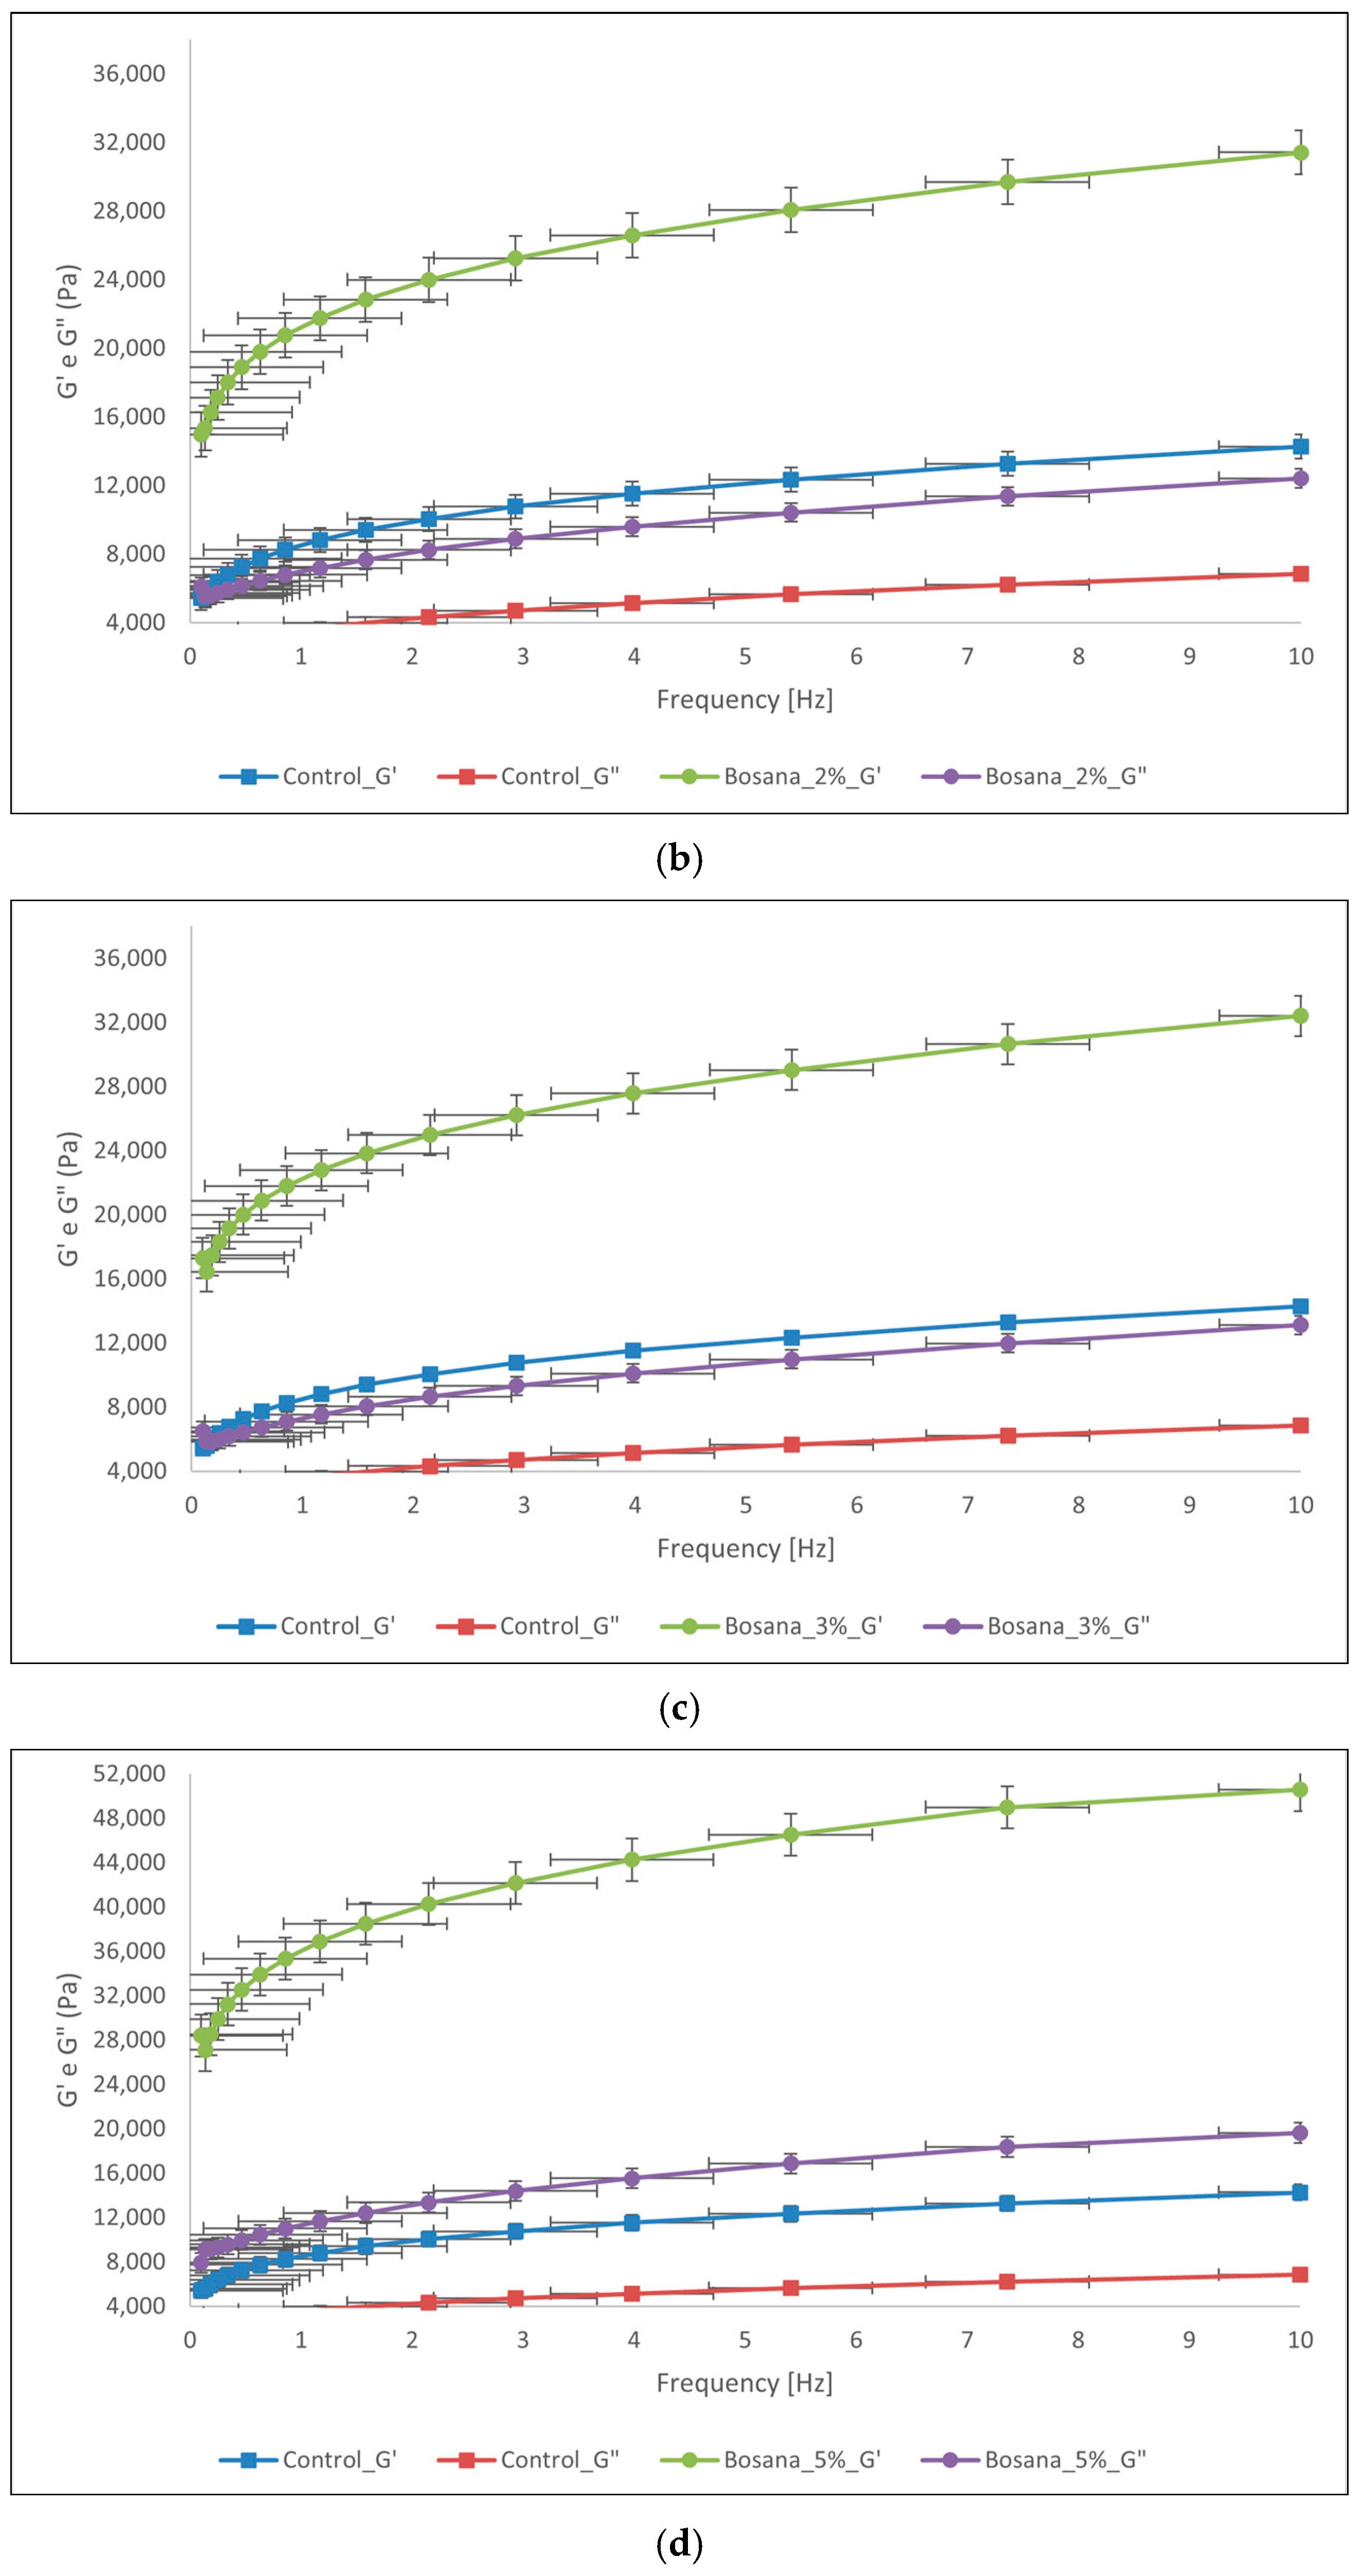
Figure 2.
Dynamic rheological parameters: storage modulus (G′) and loss modulus (G″) of the control dough compared with the dough fortified with different percentages of OP as a function of frequency. (a) Bosana 1% dough vs. control; (b) Bosana 2% dough vs. control; (c) Bosana 3% dough vs. control; (d) Bosana 5% dough vs. control; (e) Semidana 1% dough vs. control; (f) Semidana 2% dough vs. control; (g) Semidana 3% dough vs. control; and (h) Semidana 5% dough vs. control.
G′ represents the “solid-like” behaviour of the matrix. It measures the stored elastic energy following the application of a shear stress and is calculated as the ratio of stress to in-phase strain [69,70].
G″ represents the “liquid-like” behaviour of the matrix. It measures the dissipation of energy as heat viscously and is calculated as the ratio of the viscous out-of-phase component to shear stress [69,70].
In all samples, G′ was greater than G″, as shown in all parts of Figure 2, and both moduli increased as the frequency increased. Having a G′ that is greater than G″ means that the dough’s consistency is semi-solid and elastic—the necessary consistency for bread dough [2,63,71].
Moreover, at all frequencies, both the storage modulus and the loss modulus increased with increasing levels of OP inclusion, meaning that the dough viscoelasticity also increased. This occurred due to the presence of fibre and polyphenols in the OP. In brief, proteins in the dough form complexes through hydrogen bonds between their carbonyl group and a hydroxyl group on the polyphenols, and this enhances the gluten network, increasing their G’ and, thus, their elasticity, and hence explaining the increase in G’ with increasing levels of OP inclusion. Additionally, fibre and fibre-like structures can make temporary connections between each other, thus disrupting the gluten network due to the competition for water absorption as gluten makes water less available. Fibre connections serve as ‘fillers’ in the dough, rendering it thicker, and, therefore, augmenting its viscous properties and explaining the increase in G″ with increasing levels of OP inclusion [2,4]. These results are in accordance with others reported in literature [2,4,63].
3.3.4. Rapid Visco Analyser (RVA)
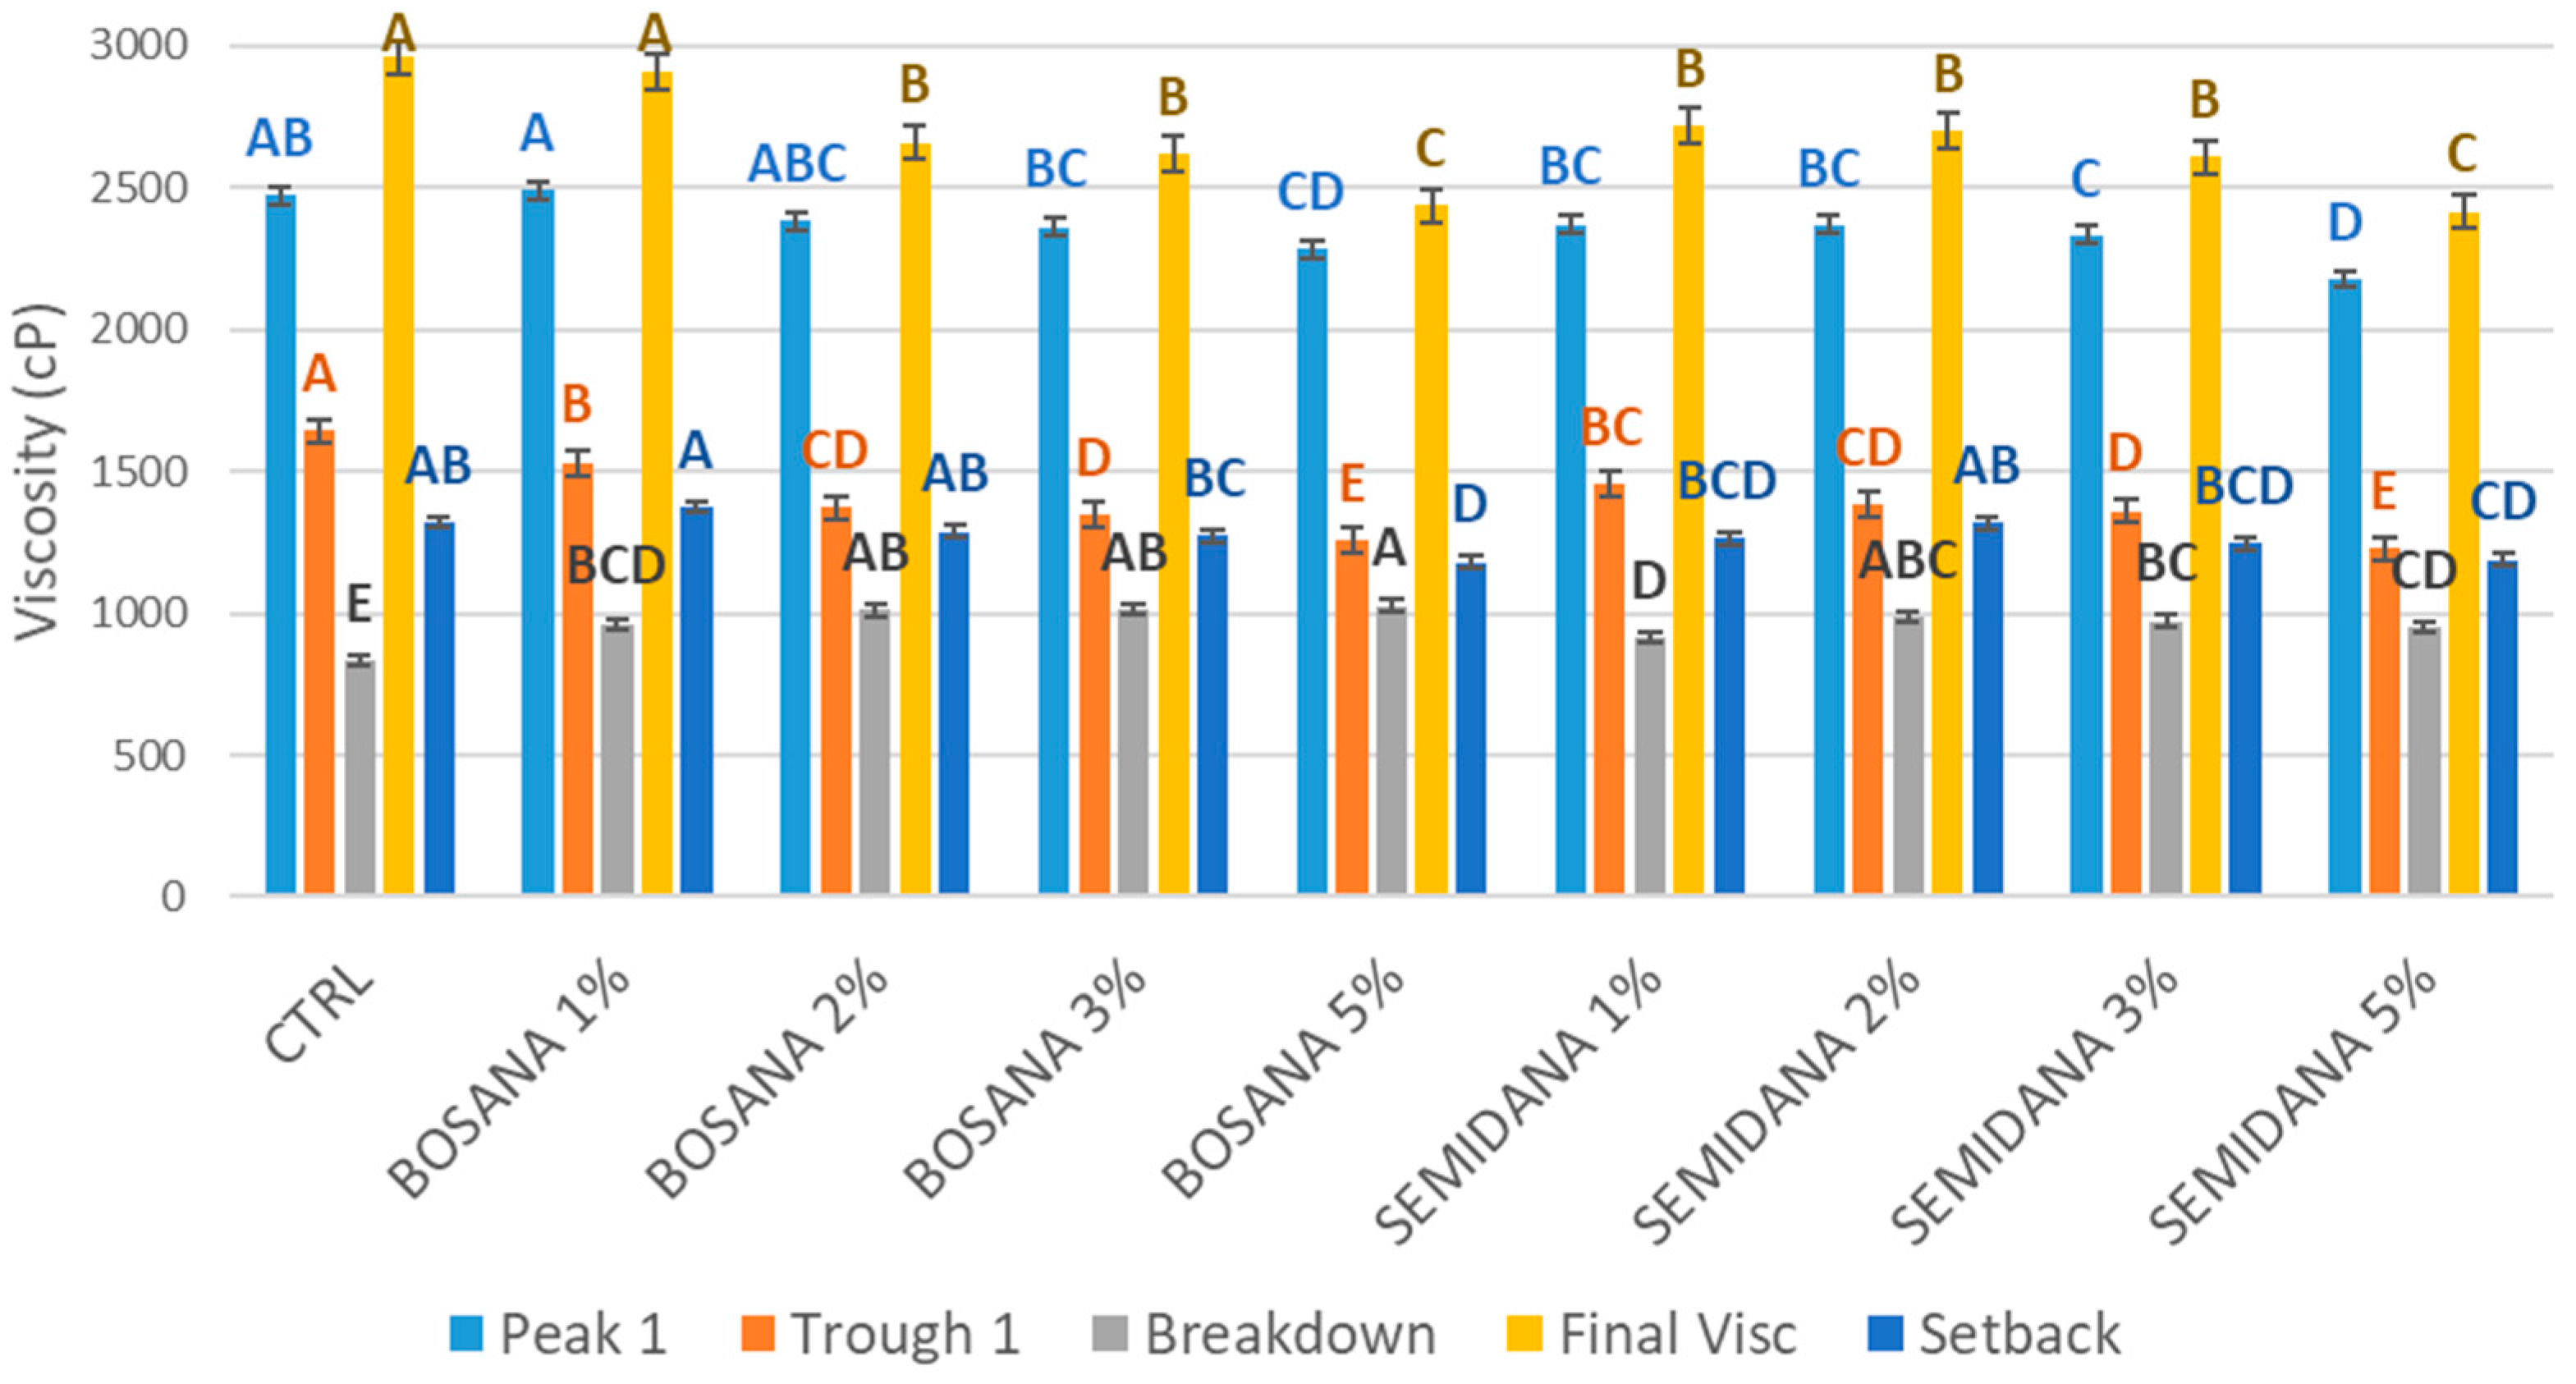
Figure 3 demonstrates the effect of different FD-OP inclusion percentages on the pasting properties of dough.
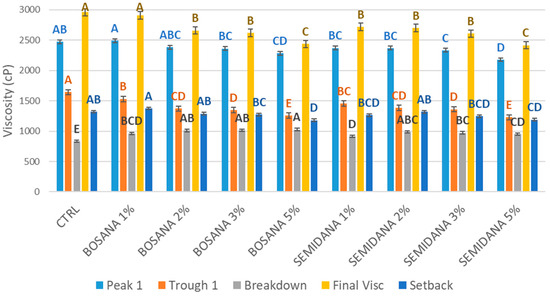
Figure 3.
Effect of different OP inclusion percentages on the pasting properties of dough, peak viscosity (peak), holding strength (trough), the difference between the peak and trough (breakdown), final viscosity, and the difference between final viscosity and trough (setback). Error bars indicate the standard error. Different letters within the same group of graph bars indicate significantly different means as assessed by one-way ANOVA, followed by Tukey HSD (p-value < 0.05).
Peak viscosity is the maximum viscosity achieved during the heating phase. It indicates the ability of starch to absorb and hold water, reducing the presence of free water molecules. It reflects the swelling and gelatinization of starch granules—known as pasting. The ‘holding strength’, also known as the ‘trough’, is the ability of the dough to hold its viscosity after reaching the peak and before it cools down. The ‘breakdown’ is the difference in viscosity between the peak and trough. The ‘final viscosity’ is that achieved at the end of the test, and the ‘setback’, the increase of viscosity during the cooling phase, is calculated by subtracting the trough viscosity from the final viscosity [63].
The values of peak 1, final viscosity, trough 1 (holding strength), and final viscosity were all higher in the control, in agreement with the findings reported by Farbo et al. [63]. The addition of OP of both cultivars reduced these parameters at all inclusion rates with respect to the control dough, although not to a significant degree at the 1% inclusion rate. Fortified doughs had significantly higher values of breakdown, that is, the reduction in viscosity during the holding phase, compared with the control dough. The higher the OP percentage, the higher the breakdown. The control dough, which does not contain any OP, has a greater starch content than the fortified doughs, enabling it to exhibit the best viscosity. Specifically, the incorporation of OP decreases the gluten content of the dough and increases its water absorption capacity, as mentioned previously, which leads to a decrease in the amount of the swollen starch granules contributing to the viscosity, thus decreasing the viscosity value [62].
Another factor which may contribute to these results is the increase in the activity of the alpha-amylase naturally present in wheat flour due to the increase in calcium content with increasing OP substitution levels. Alpha-amylase depends on calcium ions (Ca2+) for enhanced activity [4]. Thus, increasing levels of starch hydrolysis with increasing OP inclusion would also have contributed to decreased viscosity with respect to the control dough.
4. Conclusions
The present work demonstrates that incorporating FD-OP into wheat dough at increasing flour substitution percentages (1, 2, 3, and 5%) significantly modifies the properties of dough. This primarily occurs due to the high fibre content of OP compared with type 00 wheat flour (which contains no fibre) and the high abundance of polyphenols in OP. Low substitution levels of OP improved water absorption and decreased dough development time, resulting in faster dough formation (17:40 min in controls vs. values < 1:30 min in FD-OP fortified dough). In addition, compared with the control dough, the stability was improved in dough fortified with 1% Bosana, 1% Semidana, and 2% Semidana FD-OP, whereas greater levels of substitution retrograded the stability of the dough. Moreover, the storage (G′) and loss (G″) moduli showed increasing trends as FD-OP levels increased, which strengthened the viscoelastic properties of the dough. FD-OP inclusion decreased dough stickiness and elasticity, except at the 1 and 2% substitution levels. During fermentation, gas retention was significantly higher in doughs fortified with FD-OP at all levels: the control dough retained 90.90% of the gas, whereas the lowest level of gas retention in the fortified doughs was 95.90%. Thus, we can safely conclude that the incorporation of FD-OP at 1% Bosana and 1 and 2% Semidana significantly improved all rheological properties of the wheat dough due to the presence of fibre and polyphenols, while higher substitution percentages had an adverse effect because of the significant disruption to the gluten network, resulting in a gluten-free-like dough.
Future work is required to study the effects of OP inclusion on breadmaking, including the resulting nutritional, physicochemical, and rheological profiles of bread. Considering the results of the present study, a substitution level of 5% FD-OP can be discarded from further analyses.
Author Contributions
Conceptualization: R.C., C.F. and A.P.; methodology: P.D., R.C. and M.G.F.; formal analysis: P.D., R.C., M.G.F. and A.M.; investigation: P.D., R.C., M.G.F., C.F. and A.P.; data curation: P.D., R.C., M.G.F. and A.M.; writing—original draft preparation: P.D., R.C., M.G.F., C.F. and A.P.; writing—review and editing: P.D., R.C., M.G.F., C.F., G.H. and A.P.; supervision: C.F. and A.P.; funding acquisition: C.F. and A.P. All authors have read and agreed to the published version of the manuscript.
Funding
This research was funded by the IDOLI—the Innovation in Dairy and OLive Industry project, Sardegna Ricerche, POR FESR Sardegna 2014–2020, Program of research and development, Area of specialization: Agroindustria.
Institutional Review Board Statement
Not applicable.
Informed Consent Statement
Not applicable.
Data Availability Statement
Data is contained within the article.
Acknowledgments
The authors thank Giangiacomo Giuseppe Milella and Mario Antonello Deroma (Università degli Studi di Sassari) for their valuable help during the analyses. The authors also wish to thank Accademia Olearia Srl for their support during sampling.
Conflicts of Interest
The authors declare no conflicts of interest.
References
- De Bruno, A.; Romeo, R.; Piscopo, A.; Poiana, M. Antioxidant quantification in different portions obtained during olive oil extraction process in an olive oil press mill. J. Sci. Food Agric. 2021, 101, 1119–1126. [Google Scholar] [CrossRef] [PubMed]
- Han, L.; Zhang, J.; Cao, X. Effects of orange peel powder on rheological properties of wheat dough and bread aging. Food Sci. Nutr. 2021, 9, 1061–1069. [Google Scholar] [CrossRef] [PubMed]
- Conte, P.; Pulina, S.; Del Caro, A.; Fadda, C.; Urgeghe, P.P.; De Bruno, A.; Difonzo, G.; Caponio, F.; Romeo, R.; Piga, A. Gluten-Free Breadsticks Fortified with Phenolic-Rich Extracts. Foods 2021, 10, 923. [Google Scholar] [CrossRef]
- Iuga, M.; Mironeasa, S. Potential of grape byproducts as functional ingredients in baked goods and pasta. Compr. Rev. Food Sci. Food Saf. 2020, 19, 2473–2505. [Google Scholar] [CrossRef]
- Cedola, A.; Cardinali, A.; Del Nobile, M.A.; Conte, A. Enrichment of Bread with Olive Oil Industrial By-Product. J. Agric. Sci. Technol. B 2019, 9, 119–127. [Google Scholar] [CrossRef]
- Bartkiene, E.; Vizbickiene, D.; Bartkevics, V.; Pugajeva, I.; Krungleviciute, V.; Zadeike, D.; Zavistanaviciute, P.; Juodeikiene, G. Application of Pediococcus acidilactici LUHS29 immobilized in apple pomace matrix for high value wheat-barley sourdough bread. LWT 2017, 83, 157–164. [Google Scholar] [CrossRef]
- Majzoobi, M.; Ghavi, F.S.; Farahnaky, A.; Jamalian, J.; Mesbahi, G. Effect of tomato pomace powder on the physicochemical properties of flat bread (barbari bread). J. Food Process. Preserv. 2011, 35, 247–256. [Google Scholar] [CrossRef]
- Gül, H.; Şen, H. Effects of Rosehip Seed Flour on the Rheological Properties of Bread Dough. Sci. Bull. Ser. F Biotechnol. 2017, XXI, 330–335. [Google Scholar]
- Tańska, M.; Zadernowski, R.; Konopka, I. The quality of wheat bread supplemented with dried carrot pomace. Polish J. Nat. Sci. 2007, 22, 126–136. [Google Scholar] [CrossRef]
- Meral, R.; Doǧan, I.S. Grape seed as a functional food ingredient in bread-making. Int. J. Food Sci. Nutr. 2013, 64, 372–379. [Google Scholar] [CrossRef] [PubMed]
- Hussain, M.; Saeed, F.; Niaz, B.; Afzaal, M.; Ikram, A.; Hussain, S.; Mohamed, A.A.; Alamri, M.S.; Anjum, F.M. Biochemical and nutritional profile of maize bran-enriched flour in relation to its end-use quality. Food Sci. Nutr. 2021, 9, 3336–3345. [Google Scholar] [CrossRef]
- Šporin, M.; Avbelj, M.; Kovač, B.; Možina, S.S. Quality characteristics of wheat flour dough and bread containing grape pomace flour. Food Sci. Technol. Int. 2018, 24, 251–263. [Google Scholar] [CrossRef]
- Neifar, M.; Jaouani, A.; Ayari, A.; Abid, O.; Ben Salem, H.; Boudabous, A.; Najar, T.; Ghorbel, R.E. Improving the nutritive value of Olive Cake by solid state cultivation of the medicinal mushroom Fomes fomentarius. Chemosphere 2013, 91, 110–114. [Google Scholar] [CrossRef]
- López-García, A.B.; Cotes-Oalomino, T.; Uceda-Rodríguez, M.; Moreno-Maroto, J.M.; Cobo-Ceacero, C.J.; Fernanda Andreola, N.M.; Martínez-García, C. Application of life cycle assessment in the environmental study of sustainable ceramic bricks made with ‘alperujo’ (Olive pomace). Appl. Sci. 2021, 11, 2278. [Google Scholar] [CrossRef]
- Torrecilla, J.S.; Aragón, J.M.; Palancar, M.C. Improvement of fluidized-bed dryers for drying solid waste (olive pomace) in olive oil mills. Eur. J. Lipid Sci. Technol. 2006, 108, 913–924. [Google Scholar] [CrossRef]
- Uceda-Rodríguez, M.; López-García, A.B.; Moreno-Maroto, J.M.; Cobo-Ceacero, C.J.; Cotes-Palomino, M.T.; García, C.M. Evaluation of the environmental benefits associated with the addition of olive pomace in the manufacture of lightweight aggregates. Materials 2020, 13, 2351. [Google Scholar] [CrossRef]
- Alu’datt, M.H.; Alli, I.; Ereifej, K.; Alhamad, M.; Al-Tawaha, A.R.; Rababah, T. Optimisation, characterisation and quantification of phenolic compounds in olive cake. Food Chem. 2010, 123, 117–122. [Google Scholar] [CrossRef]
- Čepo, D.V.; Radić, K.; Jurmanović, S.; Jug, M.; Rajković, M.G.; Pedisić, S.; Moslavac, T.; Albahari, P. Valorization of olive pomace-based nutraceuticals as antioxidants in chemical, food, and biological models. Molecules 2018, 23, 2070. [Google Scholar] [CrossRef] [PubMed]
- Echeverría, F.; Ortiz, M.; Valenzuela, R.; Videla, L.A. Hydroxytyrosol and cytoprotection: A projection for clinical interventions. Int. J. Mol. Sci. 2017, 18, 930. [Google Scholar] [CrossRef] [PubMed]
- Catalán, Ú.; López de las Hazas, M.C.; Rubió, L.; Fernández-Castillejo, S.; Pedret, A.; de la Torre, R.; Motilva, M.J.; Solà, R. Protective effect of hydroxytyrosol and its predominant plasmatic human metabolites against endothelial dysfunction in human aortic endothelial cells. Mol. Nutr. Food Res. 2015, 59, 2523–2536. [Google Scholar] [CrossRef] [PubMed]
- Ma, C.; Ma, A.; Gong, G.; Liu, Z.; Wu, Z.; Guo, B.; Chen, Z. Cracking Streptococcus thermophilus to stimulate the growth of the probiotic Lactobacillus casei in co-culture. Int. J. Food Microbiol. 2015, 210, 42–46. [Google Scholar] [CrossRef] [PubMed]
- Lin, S.; Chi, W.; Hu, J.; Pan, Q.; Zheng, B.; Zeng, S. Sensory and nutritional properties of chinese olive pomace based high fibre biscuit. Emirates J. Food Agric. 2017, 29, 495–501. [Google Scholar] [CrossRef]
- Santangelo, C.; Varì, R.; Scazzocchio, B.; De Sancti, P.; Giovannini, C.; D’Archivio, M.; Masella, R. Anti-inflammatory Activity of Extra Virgin Olive Oil Polyphenols: Which Role in the Prevention and Treatment of Immune-Mediated Inflammatory Diseases? Endocr. Metab. Immune Disord. Drug Targets 2017, 18, 36–50. [Google Scholar] [CrossRef] [PubMed]
- Gutiérrez-Del-río, I.; López-Ibáñez, S.; Magadán-Corpas, P.; Fernández-Calleja, L.; Pérez-Valero, Á.; Tuñón-Granda, M.; Miguélez, E.M.; Villar, C.J.; Lombó, F. Terpenoids and polyphenols as natural antioxidant agents in food preservation. Antioxidants 2021, 10, 1264. [Google Scholar] [CrossRef] [PubMed]
- Di Giacomo, G.; Romano, P. Evolution of the Olive Oil Industry along the Entire Production Chain and Related Waste Management. Energies 2022, 15, 465. [Google Scholar] [CrossRef]
- Lanza, B.; Cellini, M.; Di Marco, S.; D’amico, E.; Simone, N.; Giansante, L.; Pompilio, A.; Di Loreto, G.; Bacceli, M.; Del Re, P.; et al. Olive pâté by multi-phase decanter as potential source of bioactive compounds of both nutraceutical and anticancer effects. Molecules 2020, 25, 5967. [Google Scholar] [CrossRef]
- Stempfle, S.; Carlucci, D.; de Gennaro, B.C.; Roselli, L.; Giannoccaro, G. Available pathways for operationalizing circular economy into the olive oil supply chain: Mapping evidence from a scoping literature review. Sustainability 2021, 13, 9789. [Google Scholar] [CrossRef]
- Guerrini, L.; Masella, P.; Angeloni, G.; Migliorini, M.; Parenti, A. Changes in Olive Paste Composition During Decanter Feeding and Effects on Oil Yield. Eur. J. Lipid Sci. Technol. 2017, 119, 1–5. [Google Scholar] [CrossRef]
- Pagano, M.; Tomasone, R.; Cedrola, C.; Fedrizzi, M.; Veneziani, G.; Servili, M. Use of Ultrasound in the Extraction Process of Virgin Olive Oil and Influence on Malaxation Time. In Proceedings of the Innovative Biosystems Engineering for Sustainable Agriculture, Forestry and Food Production, International Mid-Term Conference 2019 of the Italian Association of Agricultural Engineering (AIIA), Matera, Italy, 12–13 September 2019; Coppola, A., Di Renzo, G.C., Altieri, G., D’Antonio, P., Eds.; Springer: Cham, Switzerland, 2020; Volume 67, pp. 703–712. [Google Scholar]
- Foti, P.; Russo, N.; Randazzo, C.L.; Choupina, A.B.; Pino, A.; Caggia, C.; Romeo, F.V. Profiling of phenol content and microbial community dynamics during pâté olive cake fermentation. Food Biosci. 2023, 52, 102358. [Google Scholar] [CrossRef]
- ISO International Organization for Standardization. Animal and Vegetable Fats and Oils—Determination of Moisture and Volatile Matter Content; International Organisation for Standardization: Geneva, Switzerland, 2016. [Google Scholar]
- AOAC (Association of Official Analytical Chemists). Association of Official Analytical Chemists. In Official Methods of Analysis, 18th ed.; AOAC: Gaithersburg, MD, USA, 2006. [Google Scholar]
- AOAC (Association of Official Analytical Chemists). Crude Fat in Feeds, Cereal Grains and Forage (Randall/Soxtec/Hexanes Extraction-Submersion Method). In Official Methods of Analysis, 18th ed.; AOAC: Gaithersburg, MD, USA, 2006. [Google Scholar]
- AOAC (Association of Official Analytical Chemists). Microchemical Determination of Nitrogen. In Official Methods of Analysis, 18th ed.; AOAC: Washington, DC, USA, 2010. [Google Scholar]
- ISO (International Organization for Standardization). Foodstuffs—Determination of Water Activity; International Organisation for Standardization: Geneva, Switzerland, 2017. [Google Scholar]
- AOAC (Association of Official Analytical Chemists). Protein (Crude) in Animal Feed, Combustion Method. In Official Methods of Analysis, 18th ed.; AOAC: Gaithersburg, MD, USA, 2006. [Google Scholar]
- AACC (American Association of Cereal Chemists). Insoluble, Soluble, and Total Dietary Fiber (Codex Definition) by an Enzymatic-Gravimetric Method and Liquid Chromatography. In Approved Methods of Analysis, 11th ed.; American Association of Cereal Chemists, Ed.; AACC International: St. Paul, MN, USA, 2011. [Google Scholar]
- AOAC (Association of Official Analytical Chemists). Total Dietary Fiber in Foods, Enzymatic-Gravimetric Method. In Official Methods of Analysis, 18th ed.; AOAC: Gaithersburg, MD, USA, 2007. [Google Scholar]
- Simonato, B.; Trevisan, S.; Tolve, R.; Favati, F.; Pasini, G. Pasta fortification with olive pomace: Effects on the technological characteristics and nutritional properties. LWT 2019, 114, 108368. [Google Scholar] [CrossRef]
- Taghouti, M.; Martins-Gomes, C.; Schäfer, J.; Félix, L.M.; Santos, J.A.; Bunzel, M.; Nunes, F.M.; Silva, A.M. Thymus pulegioides L. as a rich source of antioxidant, anti-proliferative and neuroprotective phenolic compounds. Food Funct. 2018, 9, 3617–3629. [Google Scholar] [CrossRef]
- Caponio, G.R.; Difonzo, G.; de Gennaro, G.; Calasso, M.; De Angelis, M.; Pasqualone, A. Nutritional Improvement of Gluten-Free Breadsticks by Olive Cake Addition and Sourdough Fermentation: How Texture, Sensory, and Aromatic Profile Were Affected? Front. Nutr. 2022, 9, 830932. [Google Scholar] [CrossRef]
- Difonzo, G.; Russo, A.; Trani, A.; Paradiso, V.M.; Ranieri, M.; Pasqualone, A.; Summo, C.; Tamma, G.; Silletti, R.; Caponio, F. Green extracts from Coratina olive cultivar leaves: Antioxidant characterization and biological activity. J. Funct. Foods 2017, 31, 63–70. [Google Scholar] [CrossRef]
- De Gennaro, G.; Difonzo, G.; Summo, C.; Pasqualone, A.; Caponio, F. Olive Cake Powder as Functional Ingredient to Improve the Quality of Gluten-Free Breadsticks. Foods 2022, 11, 552. [Google Scholar] [CrossRef]
- Vizitiu, D.; Danciou, I. Evaluation of Farinograph and Mixolab for prediction of mixing properties of industrial wheat flour. Acta Univ. Cibiniensis Ser. E Food Technol. 2011, 15, 31–38. [Google Scholar]
- AACC (American Association of Cereal Chemists). General Pasting Method for Wheat or Rye Flour of Starch Using the Rapid Visco Analyser. Approved Methods of Analysis, 10th ed.; AACC International: St. Paul, MN, USA, 2000. [Google Scholar]
- Antónia Nunes, M.; Costa, A.S.G.; Bessada, S.; Santos, J.; Puga, H.; Alves, R.C.; Freitas, V.; Oliveira, M.B.P.P. Olive pomace as a valuable source of bioactive compounds: A study regarding its lipid- and water-soluble components. Sci. Total Environ. 2018, 644, 229–236. [Google Scholar] [CrossRef]
- Portarena, S.; Baldacchini, C.; Brugnoli, E. Geographical discrimination of extra-virgin olive oils from the Italian coasts by combining stable isotope data and carotenoid content within a multivariate analysis. Food Chem. 2017, 215, 1–6. [Google Scholar] [CrossRef]
- Aissaoui, M.H.; Trabelsi, A.B.H.; bensidhom, G.; Ceylan, S.; Leahy, J.J.; Kwapinski, W. Insights into olive pomace pyrolysis conversion to biofuels and biochars: Characterization and techno-economic evaluation. Sustain. Chem. Pharm. 2023, 32, 101022. [Google Scholar] [CrossRef]
- Fernández-González, R.; Martín-Lara, M.A.; Iáñez-Rodríguez, I.; Calero, M. Removal of heavy metals from acid mining effluents by hydrolyzed olive cake. Bioresour. Technol. 2018, 268, 169–175. [Google Scholar] [CrossRef]
- González, J.F.; Román, S.; Engo, G.; Encinar, J.M.; Martínez, G. Reduction of tars by dolomite cracking during two-stage gasification of olive cake. Biomass Bioenergy 2011, 35, 4324–4330. [Google Scholar] [CrossRef]
- Trindade, P.C.O.; de Carvalho Dalfolo, A.; Monteiro, C.S.; Wagner, R.; Dos Santos, B.A.; Nora, F.M.D.; Verruck, S.; da ROSA, C.S. Development and characterization of biscuits with olive pomace. Food Sci. Technol. 2023, 43. [Google Scholar] [CrossRef]
- Júlio, L.R.C. Tratamento, Caracterização Química e Estudo In Vivo Do Bagaço de Azeitona Resultante Da Extração Do Azeite de Oliva; Universidade Federal de Lavras: Lavras, Brazil, 2014; pp. 1–144. [Google Scholar]
- Simsek, M.; Süfer, Ö. Olive pomace from olive oil processing as partial flour substitute in breadsticks: Bioactive, textural, sensorial and nutritional properties. J. Food Process. Preserv. 2022, 46, e15705. [Google Scholar] [CrossRef]
- Alhamad, M.N.; Rababah, T.M.; Al-u’datt, M.; Ereifej, K.; Esoh, R.; Feng, H.; Yang, W. The physicochemical properties, total phenolic, antioxidant activities, and phenolic profile of fermented olive cake. Arab. J. Chem. 2017, 10, 136–140. [Google Scholar] [CrossRef]
- Nunes, M.A.; Palmeira, J.D.; Melo, D.; Machado, S.; Lobo, J.C.; Costa, A.S.G.; Alves, R.C.; Ferreira, H.; Oliveira, M.B.P.P. Chemical composition and antimicrobial activity of a new olive pomace functional ingredient. Pharmaceuticals 2021, 14, 913. [Google Scholar] [CrossRef]
- Chanioti, S.; Katsouli, M.; Tzia, C. Novel processes for the extraction of phenolic compounds from olive pomace and their protection by encapsulation. Molecules 2021, 26, 1781. [Google Scholar] [CrossRef]
- Tsivas, D.; Vlyssides, A.; Vlysidis, A. Monitoring of a III-Phase Olive Pomace Composting Process Using the CIELAB Colorimetric Method. Waste Biomass Valorization 2021, 12, 5029–5039. [Google Scholar] [CrossRef]
- Rodrigues, R.; Alves, R.C.; Oliveira, M.B.P.P. Exploring Olive Pomace for Skincare Applications: A Review. Cosmetics 2023, 10, 35. [Google Scholar] [CrossRef]
- Pošćić, F.; Furdek Turk, M.; Bačić, N.; Mikac, N.; Bertoldi, D.; Camin, F.; Jukić Špika, M.; Žanetić, M.; Rengel, Z.; Perica, S. Removal of pomace residues is critical in quantification of element concentrations in extra virgin olive oil. J. Food Compos. Anal. 2019, 77, 39–46. [Google Scholar] [CrossRef]
- Camin, F.; Larcher, R.; Perini, M.; Bontempo, L.; Bertoldi, D.; Gagliano, G.; Nicolini, G.; Versini, G. Characterisation of authentic Italian extra-virgin olive oils by stable isotope ratios of C, O and H and mineral composition. Food Chem. 2010, 118, 901–909. [Google Scholar] [CrossRef]
- Yazar, G.; Duvarci, O.; Tavman, S.; Kokini, J.L. Non-linear rheological properties of soft wheat flour dough at different stages of farinograph mixing. Appl. Rheol. 2016, 26, 52508. [Google Scholar] [CrossRef]
- Xu, J.; Li, Y.; Zhao, Y.; Wang, D.; Wang, W. Influence of antioxidant dietary fiber on dough properties and bread qualities: A review. J. Funct. Foods 2021, 80, 104434. [Google Scholar] [CrossRef]
- Farbo, M.G.; Fadda, C.; Marceddu, S.; Conte, P.; Del Caro, A.; Piga, A. Improving the quality of dough obtained with old durum wheat using hydrocolloids. Food Hydrocoll. 2020, 101, 105467. [Google Scholar] [CrossRef]
- Struck, S.; Straube, D.; Zahn, S.; Rohm, H. Interaction of wheat macromolecules and berry pomace in model dough: Rheology and microstructure. J. Food Eng. 2018, 223, 109–115. [Google Scholar] [CrossRef]
- Fakhfakh, N.; Jdir, H.; Jridi, M.; Rateb, M.; Belbahri, L.; Ayadi, M.A.; Nasri, M.; Zouari, N. The mallow, Malva aegyptiaca L. (Malvaceae): Phytochemistry analysis and effects on wheat dough performance and bread quality. LWT 2017, 75, 656–662. [Google Scholar] [CrossRef]
- Ktenioudaki, A.; O’Shea, N.; Gallagher, E. Rheological properties of wheat dough supplemented with functional by-products of food processing: Brewer’s spent grain and apple pomace. J. Food Eng. 2013, 116, 362–368. [Google Scholar] [CrossRef]
- Uthayakumaran, S.; Gras, P.W.; Stoddard, F.L.; Bekes, F. Effect of varying protein content and glutenin-to-gliadin ratio on the functional properties of wheat dough. Cereal Chem. 1999, 76, 389–394. [Google Scholar] [CrossRef]
- Shewry, P.R.; Popineau, Y.; Lafiandra, D.; Belton, P. Wheat glutenin subunits and dough elasticity. Trends Food Sci. Technol. 2000, 11, 433–441. [Google Scholar] [CrossRef]
- Zin, M.H.; Abdan, K.; Norizan, M.N. The Effect of Different Fiber Loading on Flexural and Thermal Properties of Banana/Pineapple Leaf (PALF)/Glass Hybrid Composite; Elsevier: Amsterdam, The Netherlands, 2018; ISBN 9780081022917. [Google Scholar]
- Kimbell, G.; Azad, M.A. 3D Printing: Bioinspired Materials for Drug Delivery. In Bioinspired and Biomimetic Materials for Drug Delivery; Nurunnabi, M., Ed.; Woodhead Publishing: Sawston, UK, 2021; pp. 295–318. ISBN 978-0-12-821352-0. [Google Scholar]
- Franck, A.; Germany, T. AN004; TA Instruments: New Castle, DE, USA, 1993. [Google Scholar]
Disclaimer/Publisher’s Note: The statements, opinions and data contained in all publications are solely those of the individual author(s) and contributor(s) and not of MDPI and/or the editor(s). MDPI and/or the editor(s) disclaim responsibility for any injury to people or property resulting from any ideas, methods, instructions or products referred to in the content. |
© 2024 by the authors. Licensee MDPI, Basel, Switzerland. This article is an open access article distributed under the terms and conditions of the Creative Commons Attribution (CC BY) license (https://creativecommons.org/licenses/by/4.0/).