
Muscle Hypertrophy Is Linked to Changes in the Oxidative and Proteolytic Systems during Early Tenderization of the Spanish Breed “Asturiana de los Valles”

 ,
,  ,
,  , , , and
Abstract
1. Introduction
2. Materials and Methods
2.1. Animals and Sampling Procedure
2.2. Tissue Extraction
2.3. Total Antioxidant Activity
2.4. Lipid Peroxidation (LPO)
2.5. Protein Damage
2.6. Proteasome Activity Assay
2.7. Cathepsin Activities
2.8. Immunoblotting
2.9. Sarcomeres
2.10. Statistical Analysis
3. Results
3.1. Antioxidant Status
3.1.1. Total Antioxidant Activity (TAA)
3.1.2. Lipid Peroxidation (LPO)
3.1.3. Protein Damage
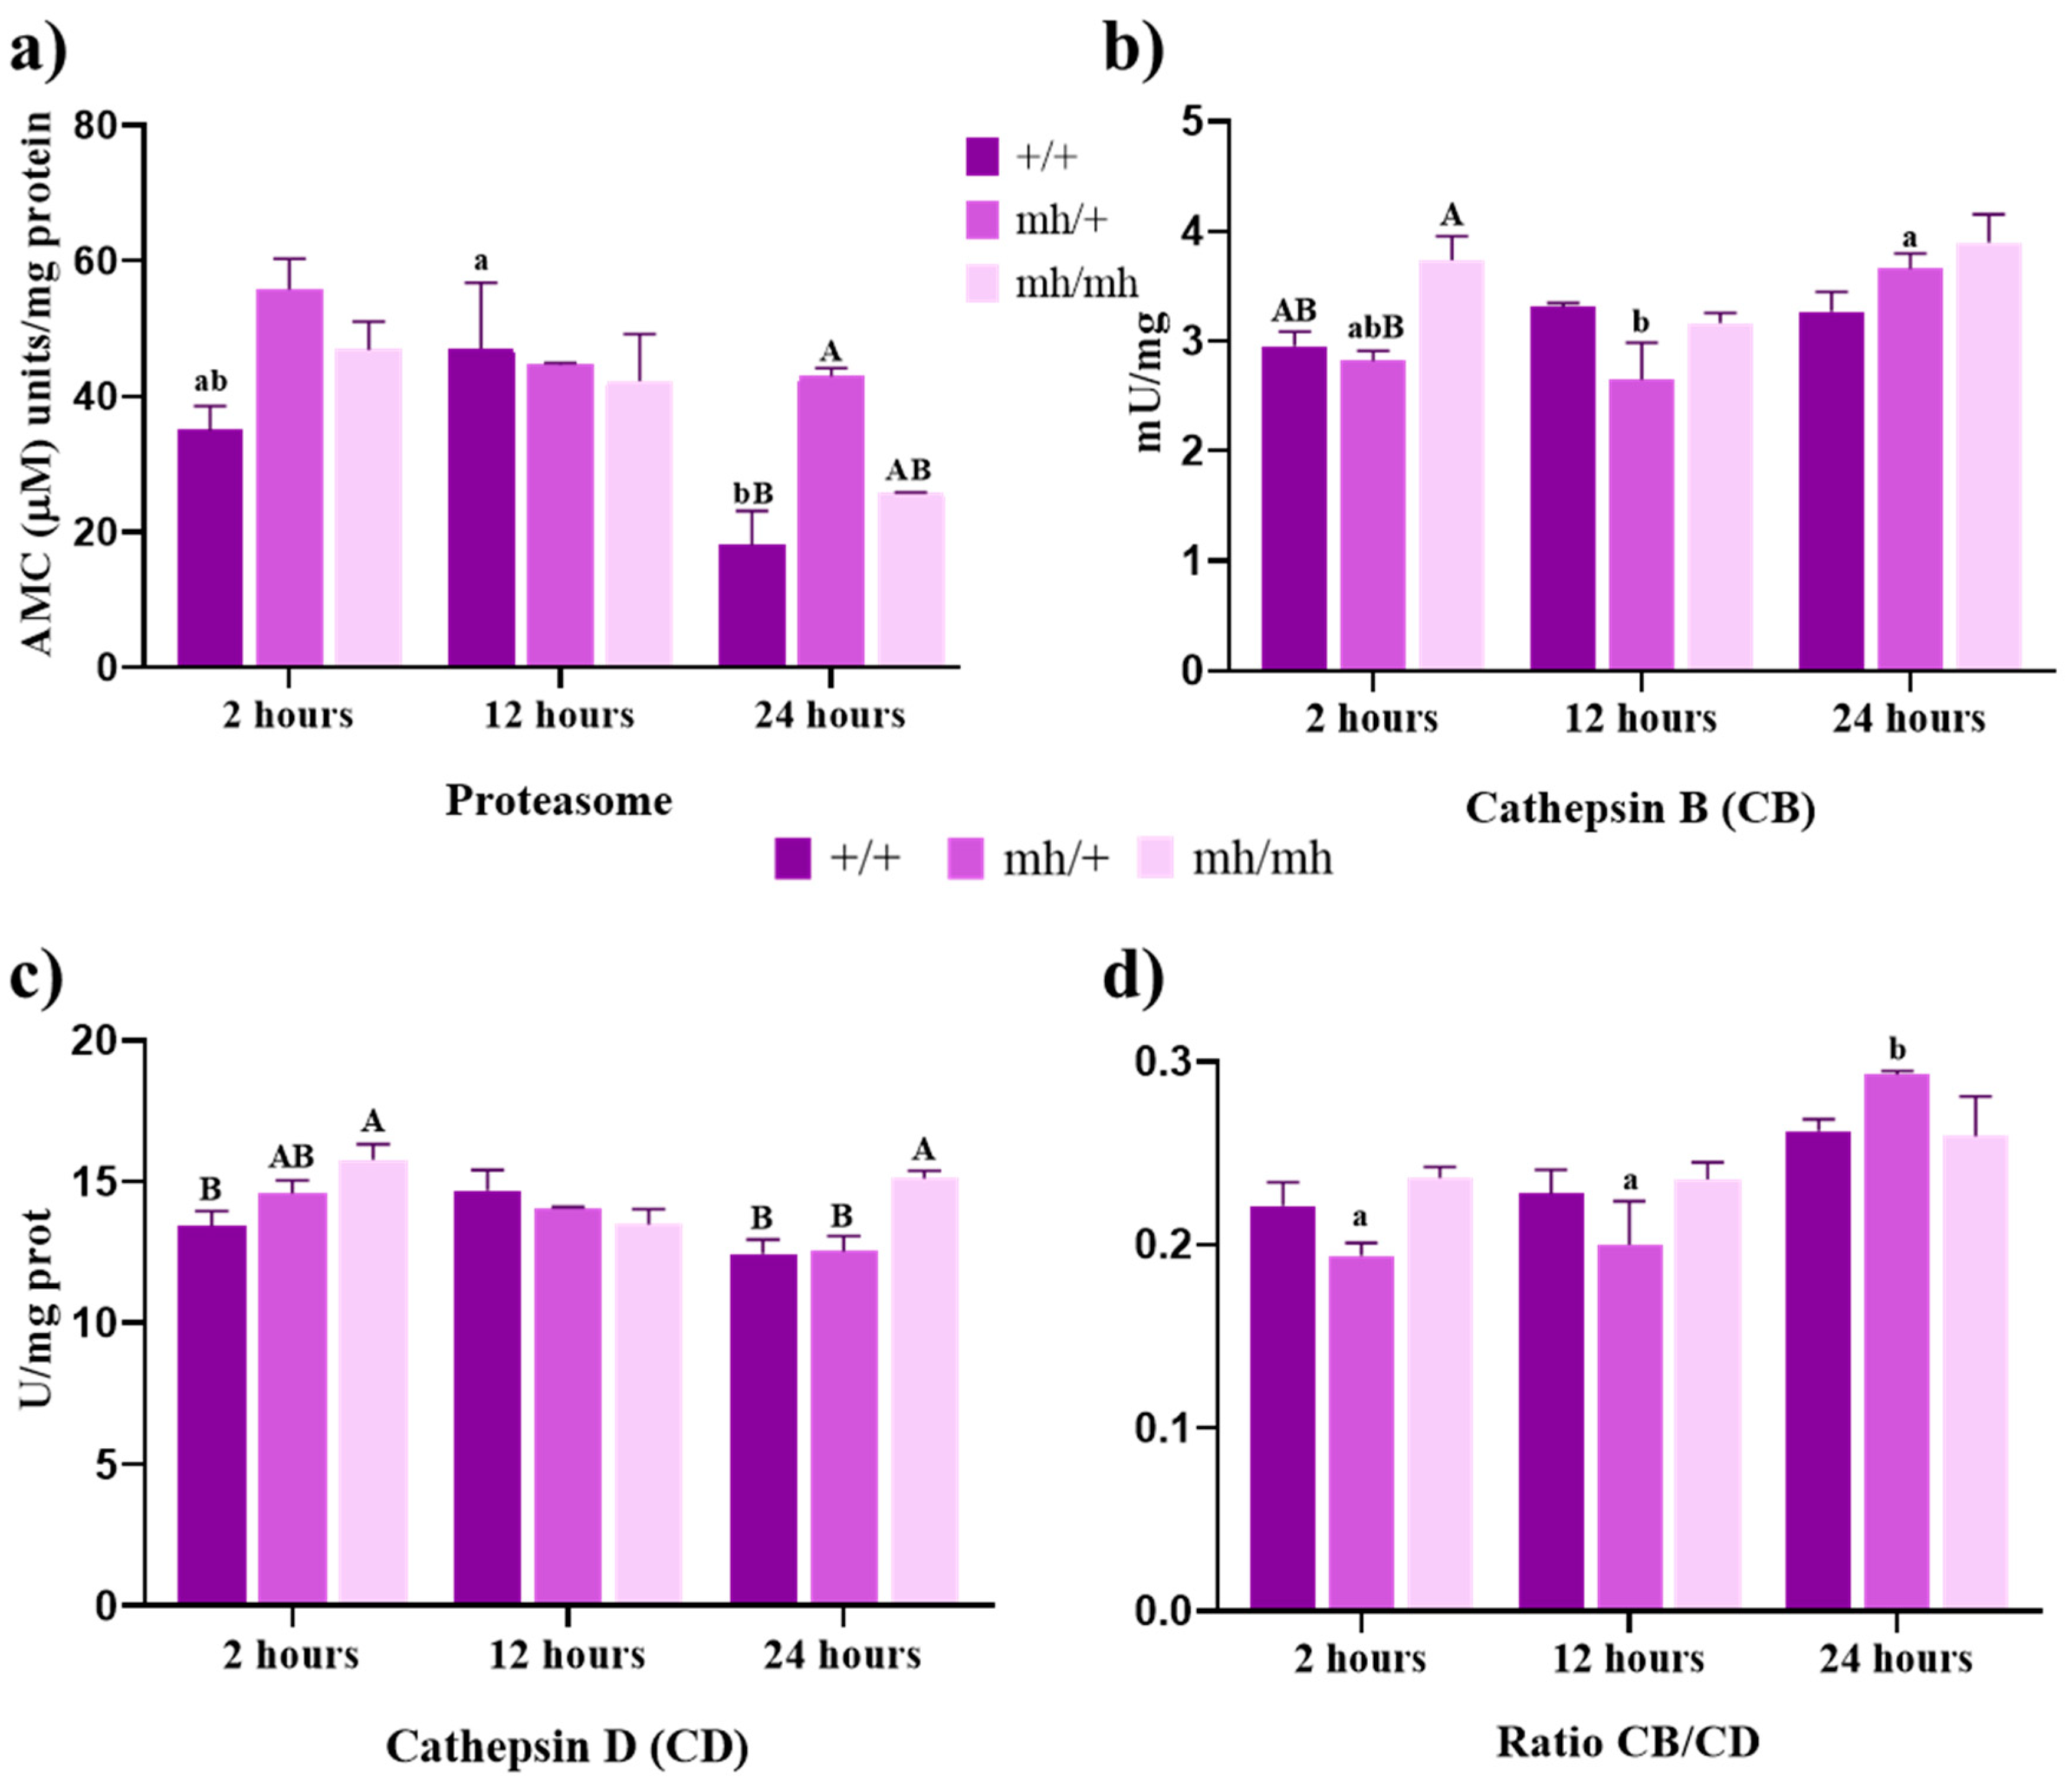
3.2. Proteolytic Activities
3.2.1. Proteosome Activity
3.2.2. Cathepsin Activities
3.3. Sarcomeres
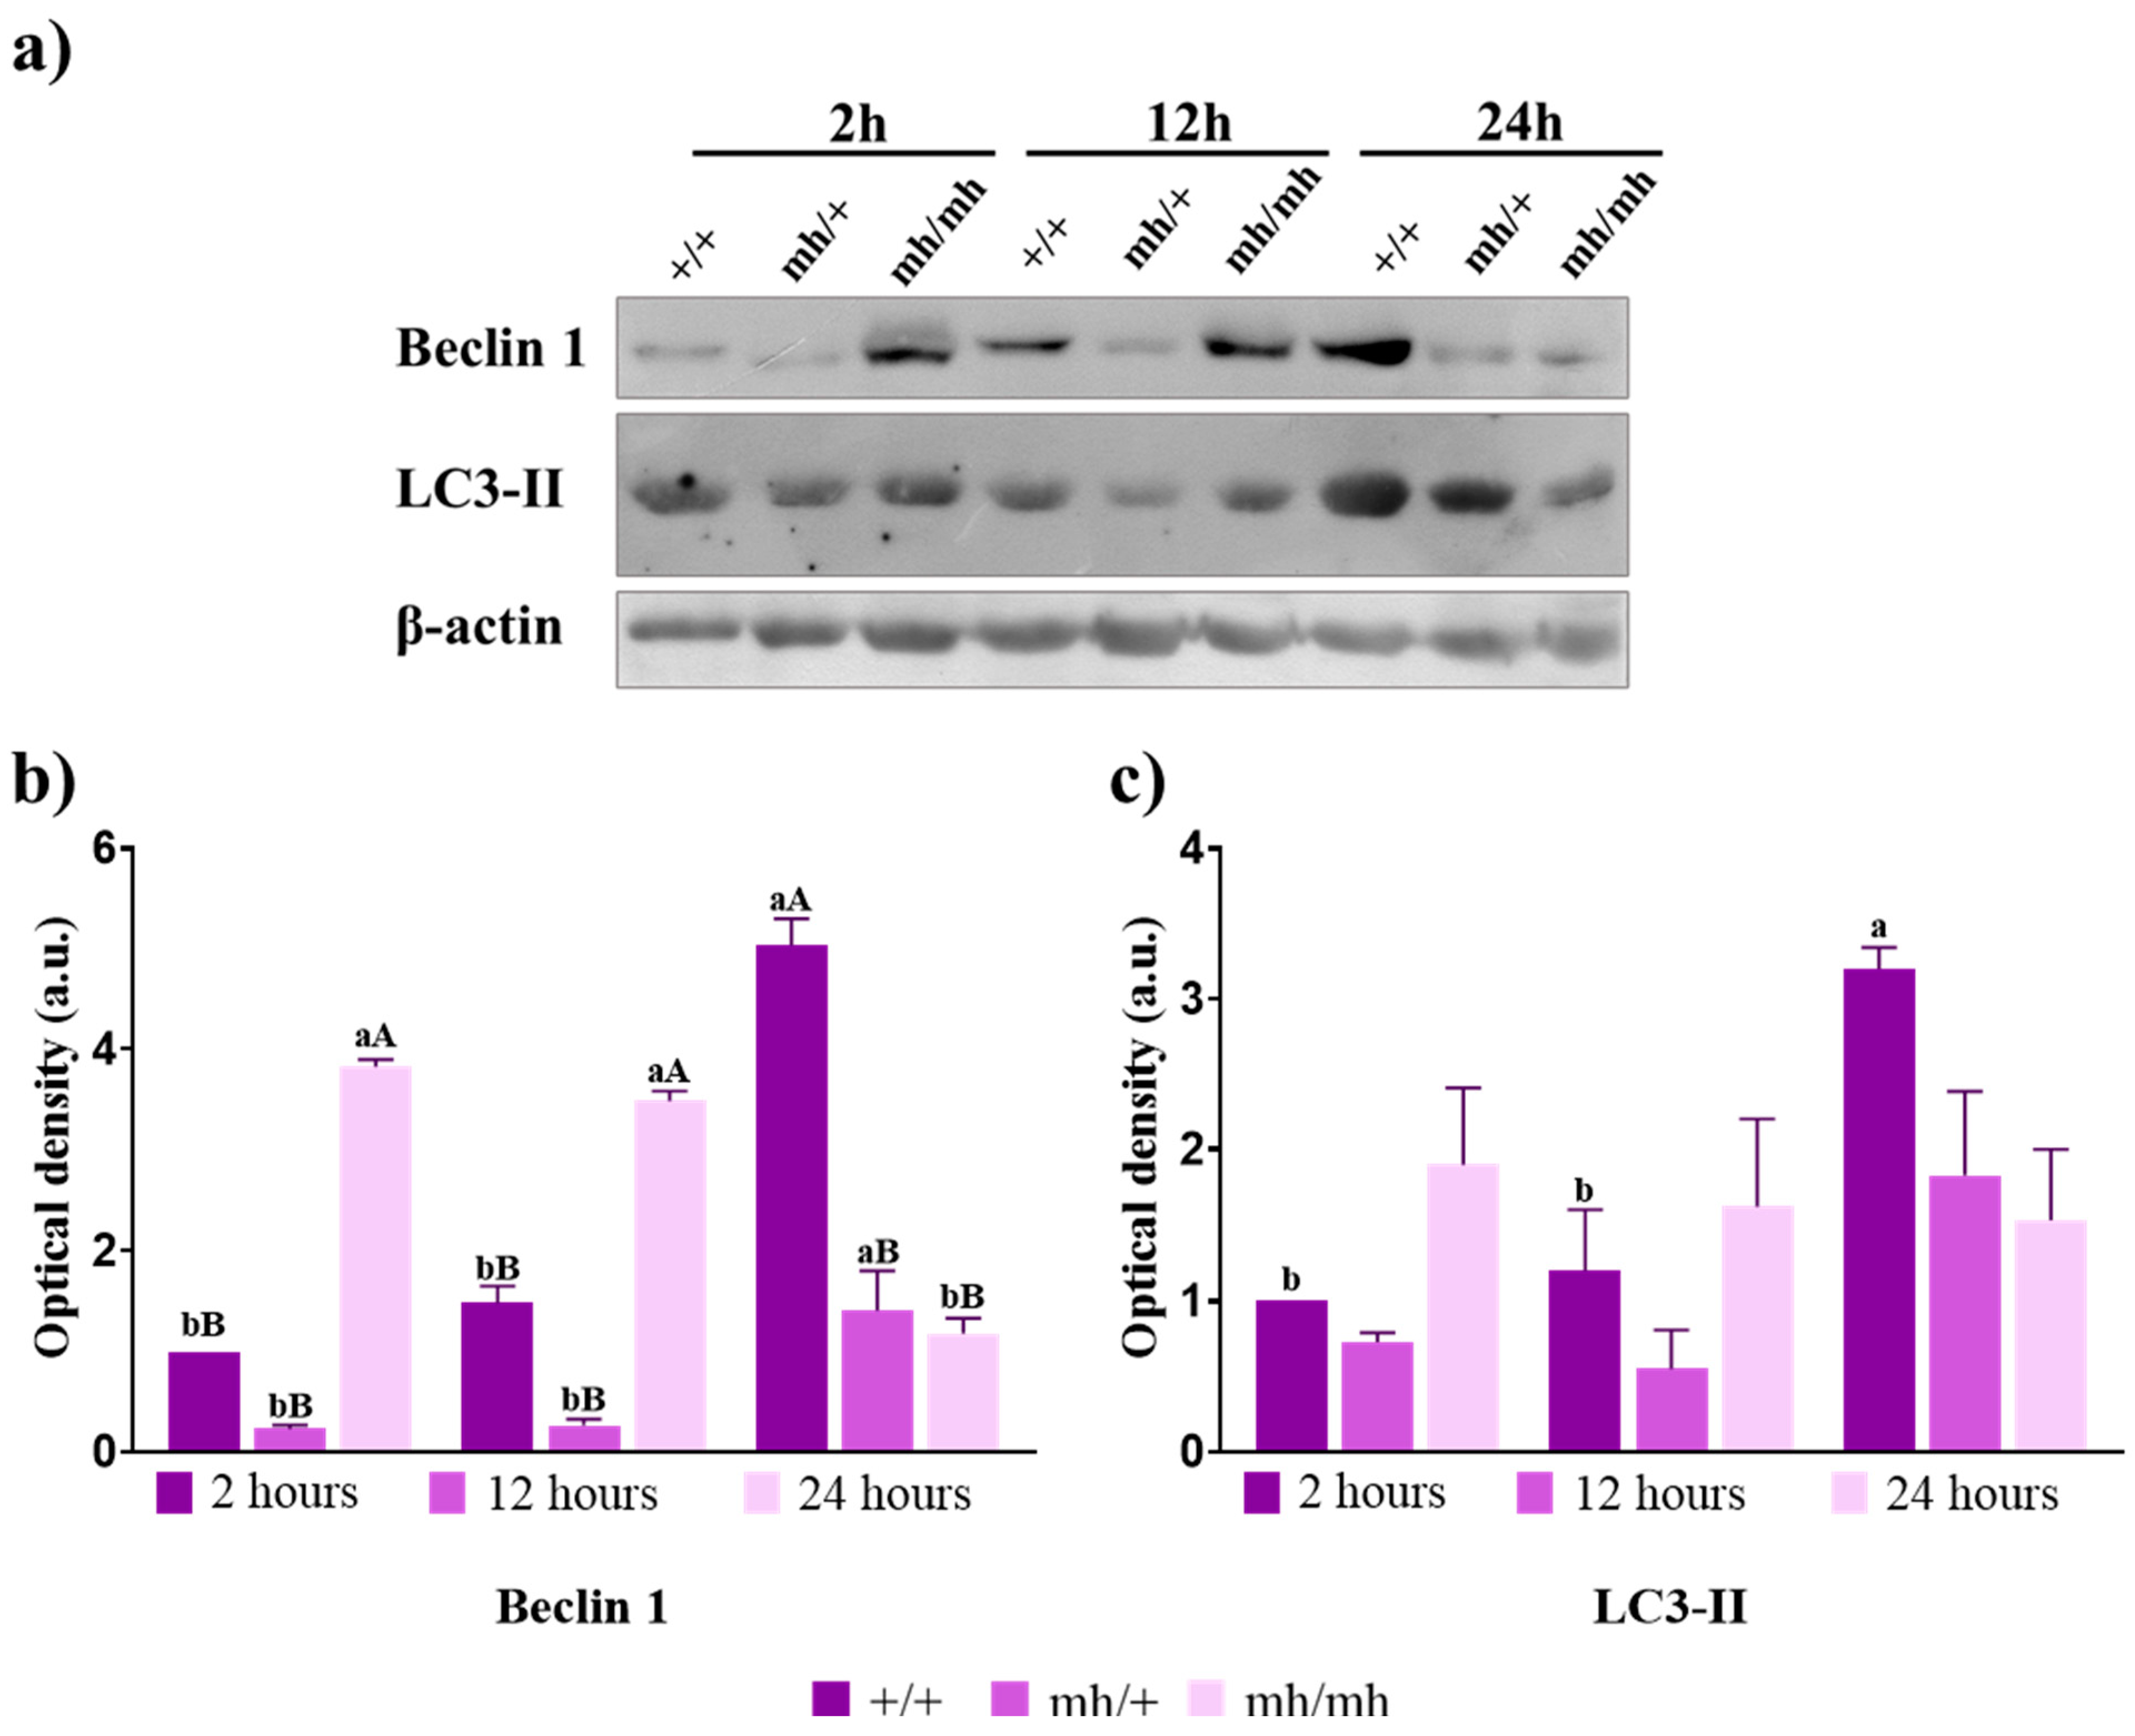
3.4. Autophagy
4. Discussion
5. Conclusions
Author Contributions
Funding
Institutional Review Board Statement
Informed Consent Statement
Data Availability Statement
Acknowledgments
Conflicts of Interest
References
- Muchenje, V.; Dzama, K.; Chimonyo, M.; Strydom, P.E.; Raats, J.G. Relationship between pre-slaughter stress responsiveness and beef quality in three cattle breeds. Meat Sci. 2009, 81, 653–657. [Google Scholar] [CrossRef]
- Sierra, V.; Guerrero, L.; Fernandez-Suarez, V.; Martinez, A.; Castro, P.; Osoro, K.; Rodriguez-Colunga, M.J.; Coto-Montes, A.; Olivan, M. Eating quality of beef from biotypes included in the PGI “Ternera Asturiana” showing distinct physicochemical characteristics and tenderization pattern. Meat Sci. 2010, 86, 343–351. [Google Scholar] [CrossRef]
- Ministerio de Agricultura, Pesca y Alimentación. Datos de las Denominaciones de Origen Protegidas (DOP), Indicaciones Geográficas Protegidas (IGP) y Especialidades Tradicionales Garantizadas (ETG) de Productos Agroalimentarios. Catálogo de Publicaciones de la Administración General del Estado (CPAGE). 2022. Available online: https://cpage.mpr.gob.es/producto/datos-de-las-denominaciones-de-origen-protegidas-dop-indicaciones-geograficas-protegidas-igp-y-especialidades-tradicionales-garantizadas-etg-de-productos-agroalimentarios-6/ (accessed on 22 January 2024).
- Sierra, V.; Fernandez-Suarez, V.; Castro, P.; Osoro, K.; Vega-Naredo, I.; Garcia-Macia, M.; Rodriguez-Colunga, P.; Coto-Montes, A.; Olivan, M. Identification of biomarkers of meat tenderisation and its use for early classification of Asturian beef into fast and late tenderising meat. J. Sci. Food Agric. 2012, 92, 2727–2740. [Google Scholar] [CrossRef]
- Dominguez, R.; Pateiro, M.; Munekata, P.E.S.; Zhang, W.; Garcia-Oliveira, P.; Carpena, M.; Prieto, M.A.; Bohrer, B.; Lorenzo, J.M. Protein Oxidation in Muscle Foods: A Comprehensive Review. Antioxidants 2021, 11, 60. [Google Scholar] [CrossRef] [PubMed]
- Dominguez, R.; Pateiro, M.; Gagaoua, M.; Barba, F.J.; Zhang, W.; Lorenzo, J.M. A Comprehensive Review on Lipid Oxidation in Meat and Meat Products. Antioxidants 2019, 8, 429. [Google Scholar] [CrossRef] [PubMed]
- Wang, L.L.; Yu, Q.L.; Han, L.; Ma, X.L.; Song, R.D.; Zhao, S.N.; Zhang, W.H. Study on the effect of reactive oxygen species-mediated oxidative stress on the activation of mitochondrial apoptosis and the tenderness of yak meat. Food Chem. 2018, 244, 394–402. [Google Scholar] [CrossRef] [PubMed]
- Kaur, L.; Hui, S.X.; Morton, J.D.; Kaur, R.; Chian, F.M.; Boland, M. Endogenous Proteolytic Systems and Meat Tenderness: Influence of Post-Mortem Storage and Processing. Food Sci. Anim. Resour. 2021, 41, 589–607. [Google Scholar] [CrossRef] [PubMed]
- Lana, A.; Zolla, L. Proteolysis in meat tenderization from the point of view of each single protein: A proteomic perspective. J. Proteom. 2016, 147, 85–97. [Google Scholar] [CrossRef] [PubMed]
- Garcia-Macia, M.; Sierra, V.; Palanca, A.; Vega-Naredo, I.; de Gonzalo-Calvo, D.; Rodriguez-Gonzalez, S.; Olivan, M.; Coto-Montes, A. Autophagy during beef aging. Autophagy 2014, 10, 137–143. [Google Scholar] [CrossRef] [PubMed]
- Grobet, L.; Poncelet, D.; Royo, L.J.; Brouwers, B.; Pirottin, D.; Michaux, C.; Menissier, F.; Zanotti, M.; Dunner, S.; Georges, M. Molecular definition of an allelic series of mutations disrupting the myostatin function and causing double-muscling in cattle. Mamm. Genome 1998, 9, 210–213. [Google Scholar] [CrossRef]
- Swatland, H.J. Meat research in Argentina. Meat Sci. 2008, 79, 407. [Google Scholar] [CrossRef]
- Bradford, M.M. A rapid and sensitive method for the quantitation of microgram quantities of protein utilizing the principle of protein-dye binding. Anal. Biochem. 1976, 72, 248–254. [Google Scholar] [CrossRef] [PubMed]
- Arnao, M.B.; Cano, A.; Acosta, M. The hydrophilic and lipophilic contribution to total antioxidant activity. Food Chem. 2001, 73, 239–244. [Google Scholar] [CrossRef]
- Garcia-Macia, M.; Rubio-Gonzalez, A.; de Luxan-Delgado, B.; Potes, Y.; Rodriguez-Gonzalez, S.; de Gonzalo-Calvo, D.; Boga, J.A.; Coto-Montes, A. Autophagic and proteolytic processes in the Harderian gland are modulated during the estrous cycle. Histochem. Cell Biol. 2014, 141, 519–529. [Google Scholar] [CrossRef] [PubMed]
- Levine, R.L.; Garland, D.; Oliver, C.N.; Amici, A.; Climent, I.; Lenz, A.G.; Ahn, B.W.; Shaltiel, S.; Stadtman, E.R. Determination of carbonyl content in oxidatively modified proteins. Methods Enzymol. 1990, 186, 464–478. [Google Scholar] [CrossRef] [PubMed]
- Coto-Montes, A.; Hardeland, R. Antioxidative effects of melatonin in Drosophila melanogaster: Antagonization of damage induced by the inhibition of catalase. J. Pineal Res. 1999, 27, 154–158. [Google Scholar] [CrossRef] [PubMed]
- Barret, A.J. Fluorimetric assays for cathepsin B and cathepsin H with methylcoumarylamide substrates. Biochem J. 1980, 187, 909–912. [Google Scholar] [CrossRef]
- Schreurs, F.J.; van der Heide, D.; Leenstra, F.R.; de Wit, W. Endogenous proteolytic enzymes in chicken muscles. Differences among strains with different growth rates and protein efficiencies. Poult. Sci. 1995, 74, 523–537. [Google Scholar] [CrossRef]
- Beatriz Caballero, V.S.; Oliván, M.; Vega-Naredo, I.; Tomás-Zapico, C.; Alvarez-García, Ó.; Tolivia, D.; Hardeland, R.; Rodríguez-Colunga, M.J.; Coto-Montes, A. Activity of cathepsins during beef aging related to mutations in the myostatin gene. J. Sci. Food Agric. 2007, 87, 192–199. [Google Scholar] [CrossRef]
- Takahashi, T.; Tang, J. Cathepsin D from porcine and bovine spleen. Methods Enzymol. 1981, 80 Pt C, 565–581. [Google Scholar] [CrossRef]
- Houbak, M.B.; Ertbjerg, P.; Therkildsen, M. In vitro study to evaluate the degradation of bovine muscle proteins post-mortem by proteasome and mu-calpain. Meat Sci. 2008, 79, 77–85. [Google Scholar] [CrossRef] [PubMed]
- Weaver, A.D.; Bowker, B.C.; Gerrard, D.E. Sarcomere length influences mu-calpain-mediated proteolysis of bovine myofibrils. J. Anim. Sci. 2009, 87, 2096–2103. [Google Scholar] [CrossRef] [PubMed]
- Levine, B.; Kroemer, G. Biological Functions of Autophagy Genes: A Disease Perspective. Cell 2019, 176, 11–42. [Google Scholar] [CrossRef] [PubMed]
- Klionsky, D.J.; Abdel-Aziz, A.K.; Abdelfatah, S.; Abdellatif, M.; Abdoli, A.; Abel, S.; Abeliovich, H.; Abildgaard, M.H.; Abudu, Y.P.; Acevedo-Arozena, A.; et al. Guidelines for the use and interpretation of assays for monitoring autophagy (4th edition)1. Autophagy 2021, 17, 1–382. [Google Scholar] [CrossRef] [PubMed]
- Aldai, N.; Murray, B.E.; Olivan, M.; Martinez, A.; Troy, D.J.; Osoro, K.; Najera, A.I. The influence of breed and mh-genotype on carcass conformation, meat physico-chemical characteristics, and the fatty acid profile of muscle from yearling bulls. Meat Sci. 2006, 72, 486–495. [Google Scholar] [CrossRef] [PubMed]
- Bouley, J.; Meunier, B.; Chambon, C.; De Smet, S.; Hocquette, J.F.; Picard, B. Proteomic analysis of bovine skeletal muscle hypertrophy. Proteomics 2005, 5, 490–500. [Google Scholar] [CrossRef] [PubMed]
- Wegner, J.; Albrecht, E.; Fiedler, I.; Teuscher, F.; Papstein, H.J.; Ender, K. Growth- and breed-related changes of muscle fiber characteristics in cattle. J. Anim. Sci. 2000, 78, 1485–1496. [Google Scholar] [CrossRef] [PubMed]
- Atalay, M.; Sen, C.K. Physical exercise and antioxidant defenses in the heart. Ann. N. Y. Acad. Sci. 1999, 874, 169–177. [Google Scholar] [CrossRef]
- Abi Habib, J.; Lesenfants, J.; Vigneron, N.; Van den Eynde, B.J. Functional Differences between Proteasome Subtypes. Cells 2022, 11, 421. [Google Scholar] [CrossRef]
- Dutaud, D.; Aubry, L.; Guignot, F.; Vignon, X.; Monin, G.; Ouali, A. Bovine muscle 20S proteasome. II: Contribution of the 20S proteasome to meat tenderization as revealed by an ultrastructural approach. Meat Sci. 2006, 74, 337–344. [Google Scholar] [CrossRef]
- Boya, P. Lysosomal function and dysfunction: Mechanism and disease. Antioxid. Redox Signal. 2012, 17, 766–774. [Google Scholar] [CrossRef]
- Amthor, H.; Macharia, R.; Navarrete, R.; Schuelke, M.; Brown, S.C.; Otto, A.; Voit, T.; Muntoni, F.; Vrbova, G.; Partridge, T.; et al. Lack of myostatin results in excessive muscle growth but impaired force generation. Proc. Natl. Acad. Sci. USA 2007, 104, 1835–1840. [Google Scholar] [CrossRef] [PubMed]
- Pellegrini, F.R.; De Martino, S.; Fianco, G.; Ventura, I.; Valente, D.; Fiore, M.; Trisciuoglio, D.; Degrassi, F. Blockage of autophagosome-lysosome fusion through SNAP29 O-GlcNAcylation promotes apoptosis via ROS production. Autophagy 2023, 19, 2078–2093. [Google Scholar] [CrossRef] [PubMed]
- Lopez-Fabuel, I.; Garcia-Macia, M.; Buondelmonte, C.; Burmistrova, O.; Bonora, N.; Alonso-Batan, P.; Morant-Ferrando, B.; Vicente-Gutierrez, C.; Jimenez-Blasco, D.; Quintana-Cabrera, R.; et al. Aberrant upregulation of the glycolytic enzyme PFKFB3 in CLN7 neuronal ceroid lipofuscinosis. Nat. Commun. 2022, 13, 536. [Google Scholar] [CrossRef]
- Sebastian, D.; Zorzano, A. Self-Eating for Muscle Fitness: Autophagy in the Control of Energy Metabolism. Dev. Cell 2020, 54, 268–281. [Google Scholar] [CrossRef]
- Klionsky, D.J.; Abdalla, F.C.; Abeliovich, H.; Abraham, R.T.; Acevedo-Arozena, A.; Adeli, K.; Agholme, L.; Agnello, M.; Agostinis, P.; Aguirre-Ghiso, J.A.; et al. Guidelines for the use and interpretation of assays for monitoring autophagy. Autophagy 2012, 8, 445–544. [Google Scholar] [CrossRef] [PubMed]
- Lomiwes, D.; Farouk, M.M.; Wiklund, E.; Young, O.A. Small heat shock proteins and their role in meat tenderness: A review. Meat Sci. 2014, 96, 26–40. [Google Scholar] [CrossRef]
- Alshudukhi, A.A.; Zhu, J.; Huang, D.; Jama, A.; Smith, J.D.; Wang, Q.J.; Esser, K.A.; Ren, H. Lipin-1 regulates Bnip3-mediated mitophagy in glycolytic muscle. FASEB J. 2018, 32, 6796–6807. [Google Scholar] [CrossRef]
- Hyatt, H.W.; Toedebusch, R.G.; Ruegsegger, G.; Mobley, C.B.; Fox, C.D.; McGinnis, G.R.; Quindry, J.C.; Booth, F.W.; Roberts, M.D.; Kavazis, A.N. Comparative adaptations in oxidative and glycolytic muscle fibers in a low voluntary wheel running rat model performing three levels of physical activity. Physiol. Rep. 2015, 3, e12619. [Google Scholar] [CrossRef]
- Wang, Y.; Pessin, J.E. Mechanisms for fiber-type specificity of skeletal muscle atrophy. Curr. Opin. Clin. Nutr. Metab. Care 2013, 16, 243–250. [Google Scholar] [CrossRef]


| AV (+/+) | AV (mh/+) | AV (mh/mh) | |||
|---|---|---|---|---|---|
| Mean | 2 h | 1.656 ± 0.044 | 1.621 ± 0.037 | 1.819 ± 0.025B | NS |
| 12 h | 1.652 ± 0.050 | 1.661 ± 0.025 | 1.588 ± 0.078A | NS | |
| 24 h | 1.562 ± 0.027 | 1.596 ± 0.009 | 1.522 ± 0.125A | NS | |
| ANOVA | Sign. Time | NS | NS | p = 0.017 | |
| % shortening | 2–24 h | 5.587a | 10.938a | 16.637b | |
| ANOVA | 0.001 | 0.048 |
Disclaimer/Publisher’s Note: The statements, opinions and data contained in all publications are solely those of the individual author(s) and contributor(s) and not of MDPI and/or the editor(s). MDPI and/or the editor(s) disclaim responsibility for any injury to people or property resulting from any ideas, methods, instructions or products referred to in the content. |
© 2024 by the authors. Licensee MDPI, Basel, Switzerland. This article is an open access article distributed under the terms and conditions of the Creative Commons Attribution (CC BY) license (https://creativecommons.org/licenses/by/4.0/).
Share and Cite
García-Macia, M.; Sierra, V.; Santos-Ledo, A.; de Luxán-Delgado, B.; Potes-Ochoa, Y.; Rodríguez-González, S.; Oliván, M.; Coto-Montes, A. Muscle Hypertrophy Is Linked to Changes in the Oxidative and Proteolytic Systems during Early Tenderization of the Spanish Breed “Asturiana de los Valles”. Foods 2024, 13, 443. https://doi.org/10.3390/foods13030443
García-Macia M, Sierra V, Santos-Ledo A, de Luxán-Delgado B, Potes-Ochoa Y, Rodríguez-González S, Oliván M, Coto-Montes A. Muscle Hypertrophy Is Linked to Changes in the Oxidative and Proteolytic Systems during Early Tenderization of the Spanish Breed “Asturiana de los Valles”. Foods. 2024; 13(3):443. https://doi.org/10.3390/foods13030443
Chicago/Turabian StyleGarcía-Macia, Marina, Verónica Sierra, Adrián Santos-Ledo, Beatriz de Luxán-Delgado, Yaiza Potes-Ochoa, Susana Rodríguez-González, Mamen Oliván, and Ana Coto-Montes. 2024. "Muscle Hypertrophy Is Linked to Changes in the Oxidative and Proteolytic Systems during Early Tenderization of the Spanish Breed “Asturiana de los Valles”" Foods 13, no. 3: 443. https://doi.org/10.3390/foods13030443
APA StyleGarcía-Macia, M., Sierra, V., Santos-Ledo, A., de Luxán-Delgado, B., Potes-Ochoa, Y., Rodríguez-González, S., Oliván, M., & Coto-Montes, A. (2024). Muscle Hypertrophy Is Linked to Changes in the Oxidative and Proteolytic Systems during Early Tenderization of the Spanish Breed “Asturiana de los Valles”. Foods, 13(3), 443. https://doi.org/10.3390/foods13030443