Article

Evaluation of Drying Characteristics and Quality Attributes for Microwave Vacuum Drying of Pork Skin Crisps

1
College of Food Science, Northeast Agricultural University, Harbin 150030, China
2
College of Engineering, Northeast Agricultural University, Harbin 150030, China
*
Authors to whom correspondence should be addressed.
Foods 2024, 13(24), 4020; https://doi.org/10.3390/foods13244020 (registering DOI)
Submission received: 20 October 2024 / Revised: 25 November 2024 / Accepted: 28 November 2024 / Published: 12 December 2024
(This article belongs to the Special Issue Emerging Techniques for the Processing and Preservation of Foods)

Abstract

:
As an important by-product of pork, pork skin can be processed into meat-based leisure food products to improve its utilization. In this study, microwave vacuum drying (MVD) technology was used to investigate the effects of microwave powers (600, 700, and 800 W) and processing duration on the drying characteristics and quality attributes of pork skin crisps (PSC). Five classical drying models were used to non-linearly fit the experimental data, and the Midilli et al. model was suitable for characterizing the MVD process of PSC. Before reaching a constant rate of drying, increasing microwave power and time can improve the brittleness and expansion ratio of PSC. In the constant rate drying stage, most of the free water in PSC was removed, showing the best brittleness and a stable expansion ratio. High power and long processing time can lead to serious lipid oxidation and change the flavor of PSC. Overall, the desired quality of PSC is recommended as 700 W for 6 min. This study can provide a reference for MVD application of meat-based by-product leisure foods.

1. Introduction

Pork is currently the most popular raw meat, and the sales volume of various pork products is also far ahead in the world and has become the second largest meat category [1]. However, there is still a big gap in the utilization rate of pork by-products compared with beef and mutton. However, the food plasticity of pig by-products is stronger than that of beef and mutton [2,3]. Pork skin is an indispensable part of pork by-product products and comes from a wide range of sources, and its price is low. Pork skin contains a large amount of collagen, which can improve the physiological function of the human body, and has a good water storage capacity to keep the skin moist and prolong aging. Leisure food has gained increasing attention for consumers, such as beef jerky and pork jerky [4]. Therefore, making pig skin into puffed leisure foods can not only meet the needs of consumers for easy-to-eat food but also provide high quality and high protein.
Currently, the processing methods of most puffed products are still traditional, such as frying puffing, hot air drying, extrusion puffing, etc. [5,6,7]. Deep-fried puffing is a method of rapidly puffing products through high-temperature frying, but deep-fried foods have high fat content and calories, and long-term consumption is harmful to human health. Excessive processing can lead to the loss of nutrients, greatly increasing processing time and energy costs [5]. Hot air drying can achieve the effect of puffing by removing moisture, but its puffing time is long and the operation is inconvenient. Long-term hot air drying will make the texture worse and the flavor defective of final leisure foods [8]. Extrusion puffing is achieved by high pressure, high temperature, and shear force to obtain high product quality. Although the puffing time is short, the processing costs are high and the heat loss is large [9]. To address the mentioned issues for the above processing methods, MVD technology may have great potential for processing PSC.
Microwave drying is to generate temperature differences through the electric-field-driven action of microwaves on polar molecules such as water, so that the water in the sample evaporates instantaneously and the polar molecules rub at a high speed to generate heat. Rapid evaporation causes water to damage muscle tissue, resulting in pores, thus expanding the material [10]. Compared with microwave drying, MVD has a negative pressure environment, which reduces the boiling point and ambient temperature of water to improve drying efficiency and reduce fat oxidation and the loss of phenolic substances [11]. Compared with the traditional expansion process, it has the characteristics of high production efficiency, less energy consumption, and less bacterial growth, mainly including ordinary microwave drying and MVD [12]. More importantly, under the action of a vacuum, the water vapor increases rapidly, which can rapidly modify the internal structure of pig skin to expand [13]. Liang et al. and Wang et al. conducted research on products such as pig and fish skin and found that microwave drying is mainly divided into two stages: the falling-rate stage and the constant-rate stage [14,15]. In the falling-rate stage, free water is rapidly removed from inside the material, while the material is mainly bound water in the constant-rate stage, which increases the resistance to water removal, and the quality is mainly formed in this stage [14].
MVD combines the common characteristics of vacuum drying and microwave drying and has been studied in fruits and vegetables, grain, and meat products [16]. Gaikwad et al. studied the drying characteristics of Indian leisure foods like black papaya and proved that MVD technology takes the least time compared with other drying technologies [17]. Ishibashi et al. measured the volume shrinkage of carrots and potatoes and confirmed that the drying rate increased with the decrease in moisture content before reaching the critical one [18]. Liu et al. reported the drying of garlic slices by MVD, evaluated its quality characteristics, and compared the difference between the dried garlic and the original sample by using the electronic nose, indicating that the vacuum and microwave methods had no effect on the original flavor of garlic [19]. Xu et al. carried out an MVD experiment on Tremella fuciformis and found that the Midilli model was the best fitting result among five kinetic models [8]. Sanchez et al. examined the effect of MVD on aroma compounds and sensory quality of rosemary and demonstrated that increasing microwave power or reducing vacuum value will increase the content of aroma compounds of rosemary within the standard range so as to improve its sensory quality [20]. Zheng et al. found that in the microwave process, the expansion ratio and brittleness are the considerable factors [21]. As the microwave power increases, the expansion ratio and brittleness of the material will increase to improve the quality and flavor of the product. Therefore, compared with microwave drying, MVD improves the brittleness and expansion ratio of products to meet the needs of consumers for expanded leisure food.
Therefore, under the condition of MVD, processing pork rinds into crispy, delicious, nutritious, and healthy ready-to-eat leisure food can not only solve the problem of single product variety of pork rinds but also enrich the varieties of puffed leisure food and further promote the development of the deep-processing industry of pork rinds. Analyze the drying characteristics and quality properties of PSC under different processing parameters. Store the completed PSC in a sealed plastic bag for further analysis.

2. Materials and Methods

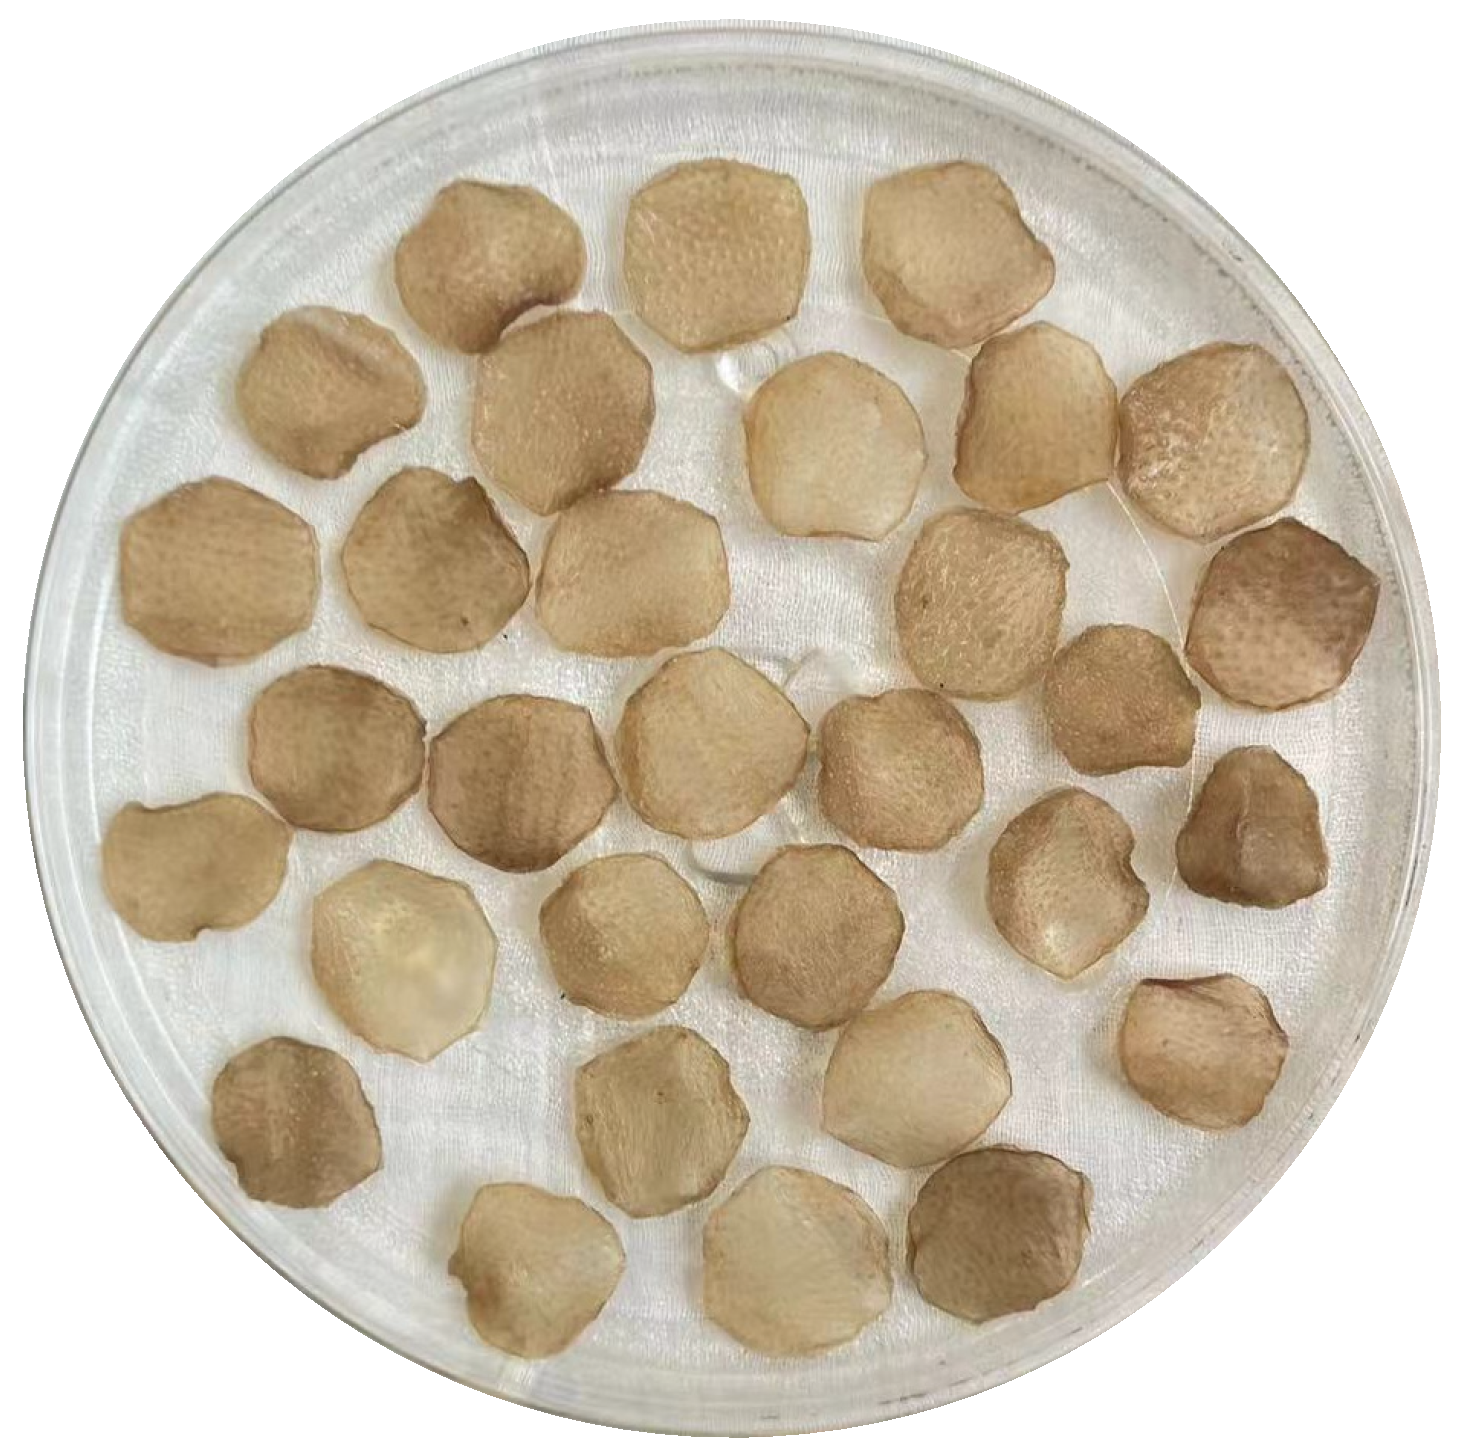
2.1. Pre-Treatment of PSC

In this study, the skin of the pig spine served as the raw material. The samples of pig skin were frozen at 18 ± 1 °C after being obtained from Beida Raw Meat Products Co., Ltd. in Harbin, China. Prior to MVD, the pig sample was defrosted at 4 ± 1 °C for 5 h, and the skin of the pig was then cooked at 85 °C for 10 min in hot water. Put the precooked pig skin on a clean kitchen board and remove the grease with a kitchen knife. The pig skin was cleaned with warm water and trimmed with a circular die with a diameter of 5 cm to obtain pig skin with a diameter of 5 cm and a thickness of 2 cm. The round pig skin was boiled in 85 °C water for 30 min. The specific formula for steaming pig skin is as follows: add 0.2% salt, 0.05% monosodium glutamate, 0.2% sugar, 0.3% pepper, 1% cumin powder, 0.05% ginger powder, 0.05% onion powder, 0.05% garlic powder, and 0.05% chicken powder. The cooked pig skin was laid neatly on the baking tray and put into the oven to bake at 85 °C for 3 h until the surface is dried.

2.2. Microwave Vacuum Drying Experiments

Arrange the pigskin neatly in the tray, as shown in Figure 1. Conduct MVD experiments in a stationary state. The MVD experiments were carried out in a microwave vacuum dryer (ORW1.0S-5Z, Orient Microwave, Nanjing, China) with a microwave frequency of 2450 ± 10 MHz and vacuum degree of −0.093 kPa. The microwave powers (600, 700, and 800 W) and drying times were used as experimental variables to examine the drying characteristics and quality attributes of PSC. According to the preliminary experiments, the total drying time was determined as 10, 8, and 6 min for 600, 700, and 800 W, respectively, and the corresponding time interval was 2, 1, and 1 min.

2.3. Drying Characteristics

2.3.1. Water Activity

An essential sign for preventing food corruption is water activity. A water activity meter (AquaLab 4TE, Instrument Group, Pullman, Washington, DC, USA) was used to determine the water activity of PSC samples under different drying conditions.

2.3.2. Moisture Content

Dry the completed PSC in a 110 °C oven for at least 17 h, take samples every hour, weigh it until it remains stable, and obtain the moisture content (MC) of the PSC as determined by Equation (1) [14].
M C = m t m d m d
where mt is the moisture content of PSC before drying, and md is the moisture content of PSC after drying.

2.3.3. Moisture Ratio

The moisture ratio (MR) of the PSC during MVD was determined by Equation (2) [14].
M R = M t M e M 0 M e M t M 0
where Mt is the moisture content at the drying time; M0 is the initial moisture content; and Me is the equilibrium moisture content, which is often overlooked due to its small value compared to Mt and M0.

2.3.4. Drying Rate

The drying rate (DR) of PSC during MVD was calculated by using Equation (3) [22].
D R = M t 1 M t 2 t 1 t 2
where t1 and t2 are drying times (min), and Mt1 and Mt2 are the moisture content at t1 and t2, respectively.

2.3.5. Effective Moisture Diffusion Coefficient

In order to further analyze the drying characteristics of PSC, the effective moisture diffusion coefficient (Deff) that indicates the water transfer rate during MVD is used to estimate the removal of water per unit time. The Deff of PSC was calculated as Equation (4) [23].
M R = 6 π 2 n = 1 1 n 2 exp n 2 π 2 D e f f t b 2
where MR is the moisture ratio; Deff is the effective moisture diffusion coefficient; b is the equivalent radius of PSC; and t is the drying time.
Due to the linear relationship between the logarithmic lnMR of the MR and t, using lnMR as the ordinate and drying time t as the abscissa, a linear regression fitting can be performed to obtain the slope k of the straight line and then calculate the Deff according to Equation (5).
D e f f = b 2 π 2 k

2.3.6. Kinetics Modeling

In order to quantitatively describe the drying characteristics of PSC, as shown in Table 1, the moisture ratios under different microwave intensities were fitted and analyzed using five traditional thin-layer drying models [24].
R 2 = Σ = 1 N M R e x p , i M R p r e , i 2 Σ = 1 N M R e x p , i M R p r e , i ¯ 2
χ 2 = 1 Σ i = 1 N M R e x p , i M R p r e , i 2 N n
R M S E = Σ = 1 N M R e x p , i M R p r e , i 2 N
where MRpre,i and MRexp,i represent the predicted and measured values of MR at the data points, respectively; N represents the number of test data points; n represents the number of test points in the model under test; and M R e x p , i ¯ is the average MR projected value at the data point.

2.4. Quality Characteristics

2.4.1. Color

Pig skin’s color was ascertained using a colorimeter (Nippon Denshoku, kogyo Co., Ltd., Tokyo, Japan). Cao et al. stated that the approach described is somewhat altered [25]. The color index is represented by L*, b*, and a*, respectively. Color L* represents brightness and darkness, 0 (black) and 100 (white). Color a* represents red (+) and green (−), while color b* represents yellow (+) and blue (−). Measure the color of PSC at different times under 600 W, 700 W, and 800 power. The color value of each sample is determined 6 times.

2.4.2. Determination of Brittleness

The texture characteristic parameters of PSC were determined by a texture analyzer (XT2i/50, Stable Micro Systems Co., Godalming, UK). The P/5 cylindrical probe with a diameter of 5 mm was used to test the sample. The test speed was 2, 0.1, and 2 mm/s before during and after testing, respectively. The Exponent software (Ver. 6.1.16.0) equipped with the instrument was used to calculate the brittleness of the product.

2.4.3. Determination of the Expansion Ratio

The volume replacement method was used to determine the volume before and after expansion. Briefly, taking a certain amount of about 20 mL of quartz sand into a measuring cylinder (accuracy of 2 mL), putting in the tested PSC, and then adding quartz sand, which is about 20 mL higher than the measured object, and putting it on an oscillator to vibrate until the height does not drop. Read out the total volume V1, take out the fruit slice, and also measure the volume V2 of quartz sand; then, the volume V3 before and after expansion can be calculated by Equation (9) [26].
V 3 = V 1 V 2 V 2

2.4.4. Electronic Nose

The electronic nose test was conducted using the method described by [27], and the PEN 3.5 electronic nose (Win Muster Airsense Analytics, Schwerin, Germany) was used. The PEN 3.5 system consists of 10 metal oxide gas sensors, named W1C, W5S, W3C, W6S, W5C, W1S, W1W, W2S, W2W, and W3S, respectively. These sensors have differential sensitivity for each characteristic volatile compound. The performance descriptions of each sensor were shown in Table 2. Finally, the principal component analysis (PCA) method was used to analyze the electronic nose data.

2.4.5. Measurement of Lipid Oxidation

Malondialdehyde (MDA) content was used to evaluate the lipid oxidation, and it was determined using a slightly modified version of the method [28]. Moreover, 1.0% TBA solution, 3.0 mL, 2.5% TCA-HCl solution, and 2.0 g of PSC should be combined. Then, vortex the mixture using a vortex mixer (3030A, Scientific Industries, INC., Bohemia, Czech Republic). After heating for 30 min, the swirling mixture was cooled to room temperature. Furthermore, 4.0 mL of the obtained supernatant was combined with 4.0 mL of chloroform, followed by centrifugation at 3000 rpm for 10 min. Finally, a UV visible spectrophotometer (T6 New Century, Beijing Puxi, Beijing, China) was used to measure the absorbance at 532 nm. The TBA reactive substance (TBARS) value was calculated by Equation (10).
T B A R S   ( mg / kg ) = O D 532 m × 9.48
where OD532 represents the absorbance at 532 nm; m represents the weight of the sample (g); and the constant 9.48 is a fixed value used in the calculation.

2.4.6. Sensory Evaluation

Sensory evaluation of PSC under different drying conditions was conducted using Chen’s method [29]. The number of PSC participants is 20, including 10 females and 10 males. Before conducting sensory evaluation tests, food professionals provided professional training to 20 students. Evaluate PSC as follows: color (1 = black, 7 = golden yellow), flavor (1 = obvious oxidized flavor, 7 = no odor), appearance (1 = no puffing at all, 7 = completely puffing), brittleness (1 = hard, 7 = crispy) (Table 3). Place the completed PSC in a randomly numbered sample tray and immediately send it to 20 students for sensory evaluation analysis.

2.5. Statistical Analysis

The PSC samples were prepared into three independent batches (repeated), and three replicates of each batch were run. The results were expressed as mean ± standard error (SE). SPSS statistical software (Ver. 22.0, IBM SPSS Co., Chicago, IL, USA) was used for data analysis. Two-way analysis of variance (ANOVA) and Duncan multivariate range test were used (p < 0.05). Data were plotted using Origin Software (Ver. 2022, Origin lab Corporation, Northampton, MA, USA).

3. Results

3.1. Drying Characteristics of PSC Under MVD

3.1.1. Changes in Water Activity of PSC During MVD

As shown in Table 4, the water activity of PSC during MVD first showed a rapid decline trend, followed by a slow decline trend when the water activity reached about 0.25. This type of feature has also appeared in the microwave process of pork crisps, which is called the rapid drying stage and the hindered drying stage [30]. Among microwave intensities, high-power microwave intensity can quickly make the PSC enter the hindered drying stage. This indicated that the water in the PSC evaporated rapidly during the rapid drying stage, and the water removal process was very fast. This was due to the high-speed heating of PSC with high moisture content, which caused PSC to absorb and convert higher microwave energy, resulting in significant dehydration of PSC [31]. In the hindered drying stage, although the water activity decreased from 0.25 to 0.23, the drying rate became significantly slower. This was because the moisture content in the sample was already in a low state. Although the microwave power remained unchanged, the drying rate of the sample decreased rapidly, and it was difficult to remove the remaining water, resulting in a declining rate of water activity. It was at this point that product quality began to take shape, and the change in sample quality should be noted at this stage.

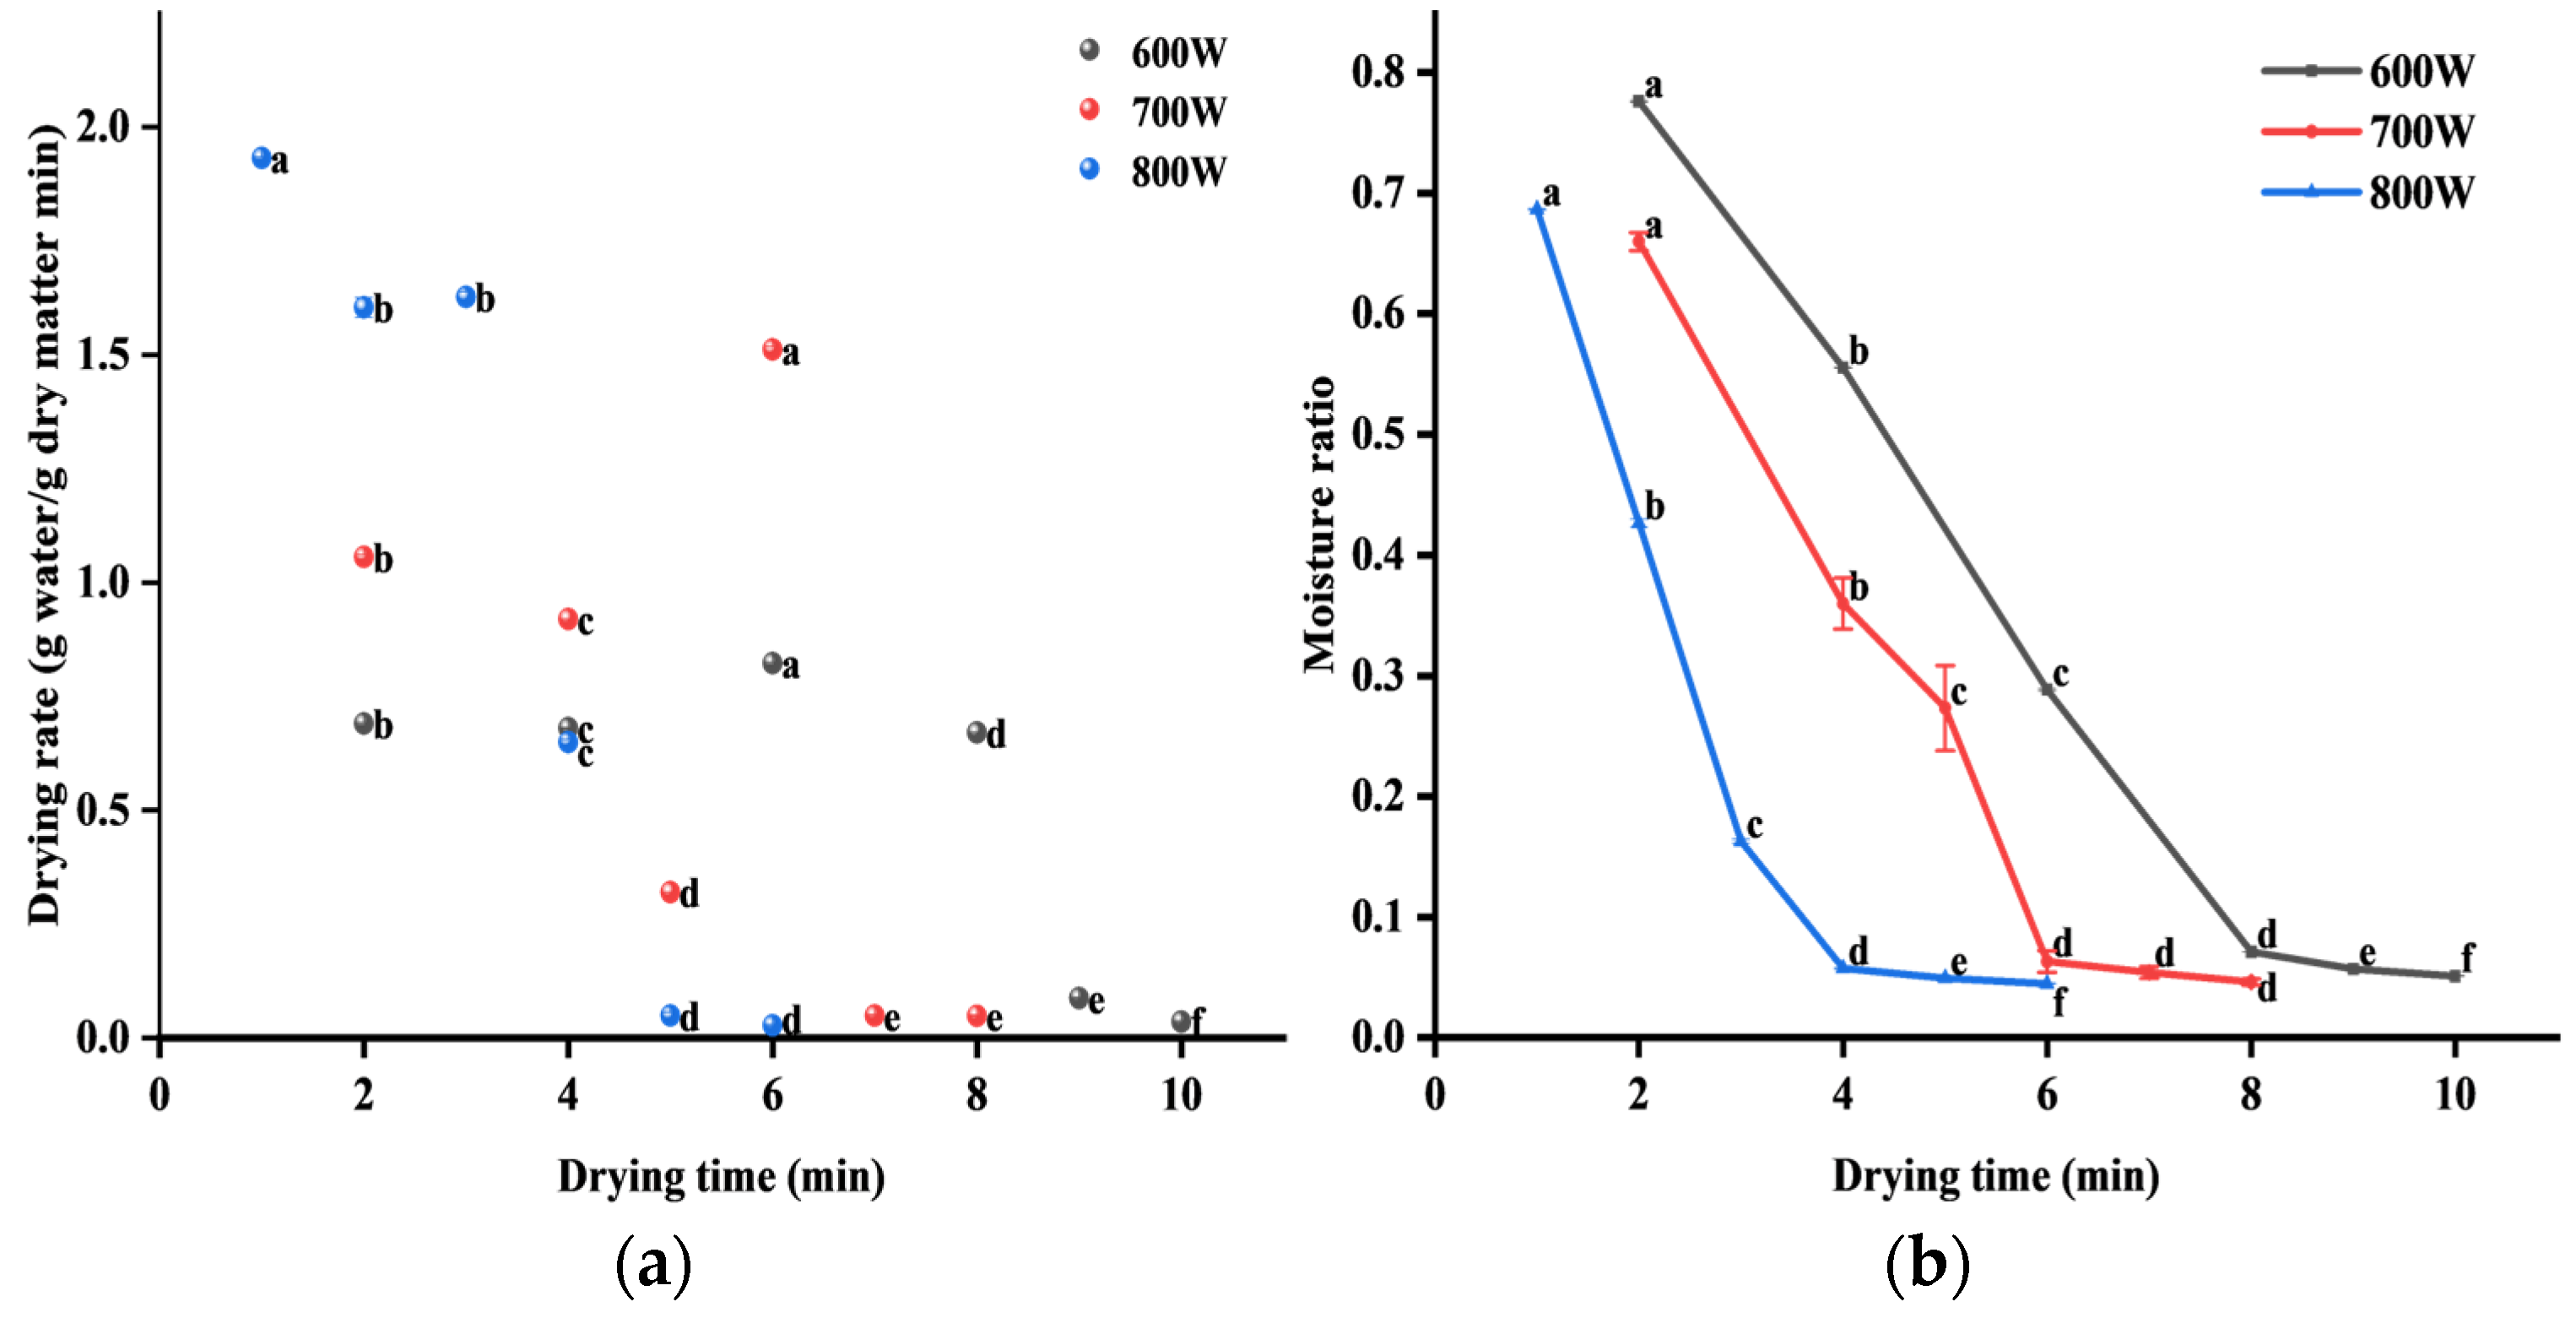
3.1.2. Changes in Drying Rate of PSC During MVD

Figure 2a shows the change in the drying rate of PSC with drying time from 600 to 800 W, and the drying rate also increased slowly with the increase in microwave intensity. It was obvious that the drying rate of PSC changes the most with drying time at 800 W and fluctuates locally at 600 and 700 W, which may be due to the pressure difference between the periphery and center of the PSC during the drying process, resulting in unstable and fluctuating moisture transfer. It can also be seen that the drying rate reaches its maximum at the beginning of drying. With the extension of drying time, the drying rate decreases slowly. Such phenomena have also occurred in germinated brown rice and apple slices [31,32]. This may be due to the movement of water molecules under the influence of variable electromagnetic fields at the beginning of drying. Due to friction with adjacent molecules, heat is generated, which can remove moisture from PSC [33].

3.1.3. Changes in Moisture Ratio of PSC During MVD

From Figure 2d, it can be seen that under the action of 600 W, 700 W, and 800 W power, the moisture content of PSC decreased from the initial 6.1657 to 0.3147, 0.2847, and 0.2764, respectively. Figure 2b shows the change in moisture ratio with drying time under 600 to 800 W. With the extension of drying time, the moisture ratio gradually decreased, reaching equilibrium at 600 W for 8 min, 700 W for 6 min, and 800 W for 4 min, respectively. The higher the microwave power, the faster the moisture ratio decreased. This may be because high microwave power enables PSC to absorb more energy, thereby creating a pressure difference between the inside and outside of the PSC to reduce surface moisture and increase the drying rate [34,35]. Therefore, increasing microwave intensity can quickly remove water and shorten drying time.

3.1.4. Changes in Effective Moisture Diffusion Coefficient of PSC During MVD

Table 5 shows that the estimated value of Deff was between 2.3695 × 10⁻⁵ and 3.3395 × 10⁻⁵ when the microwave intensity was between 600 and 800 W. In addition, the Deff value increases with the increase in microwave intensity. This was because in the same drying time, the material increases the volume heat generation under higher microwave intensity, which led to the enhancement of the activity of water molecules. This also confirms the above viewpoint [36]. Therefore, increasing the microwave intensity can accelerate the diffusion of water molecules in the PSC because the drying driving potential of water increased with the increase in temperature, which promoted the removal of water and caused the correspondingly high Deff value. This was also reflected in eggplant slices [37].

3.1.5. Analysis of Drying Kinetics of PSC During MVD

To further explain the kinetics of PSC in the MVD process, the moisture ratio of the PSC was modeled using five classical models listed in Table 1. According to previous research, the drying model should have higher R2 and χ 2 as well as lower RMSE [38]. Table 6 shows that the ranges for the R2, χ 2 , and RMSE were, respectively, 0.9154 to 0.9984, 0.0003 to 0.0328, and 0.0173 to 0.0991. Based on the above results, the Midelli et al. model was more suitable for characterizing the MVD process of PSC.

3.2. Drying Quality Characteristics of PSC Under MVD

3.2.1. Analysis of Color Characteristics of PSC

Color is an important visual index of PSC after MVD, and it characterizes the appearance quality. Table 4 shows that with the increase in microwave power and the extension of drying time, the a* and b* values of PSC increased, and the L* value decreased. It showed that when the hindered drying stage was just reached, the PSC was cash yellow, and with the extension of time, the PSC was burnt yellow and scorched. This may be due to the rapid removal of moisture during the rapid drying stage, where the PSC gradually started to mature and slowly turns golden yellow from milky white [39]. However, during the hindered drying stage, due to the low moisture content in PSC, the fat began to oxidize and the protein began to denature, while the high microwave intensity and long drying time accelerated the fat oxidation and protein denaturation, resulting in the appearance of burnt yellow [14].

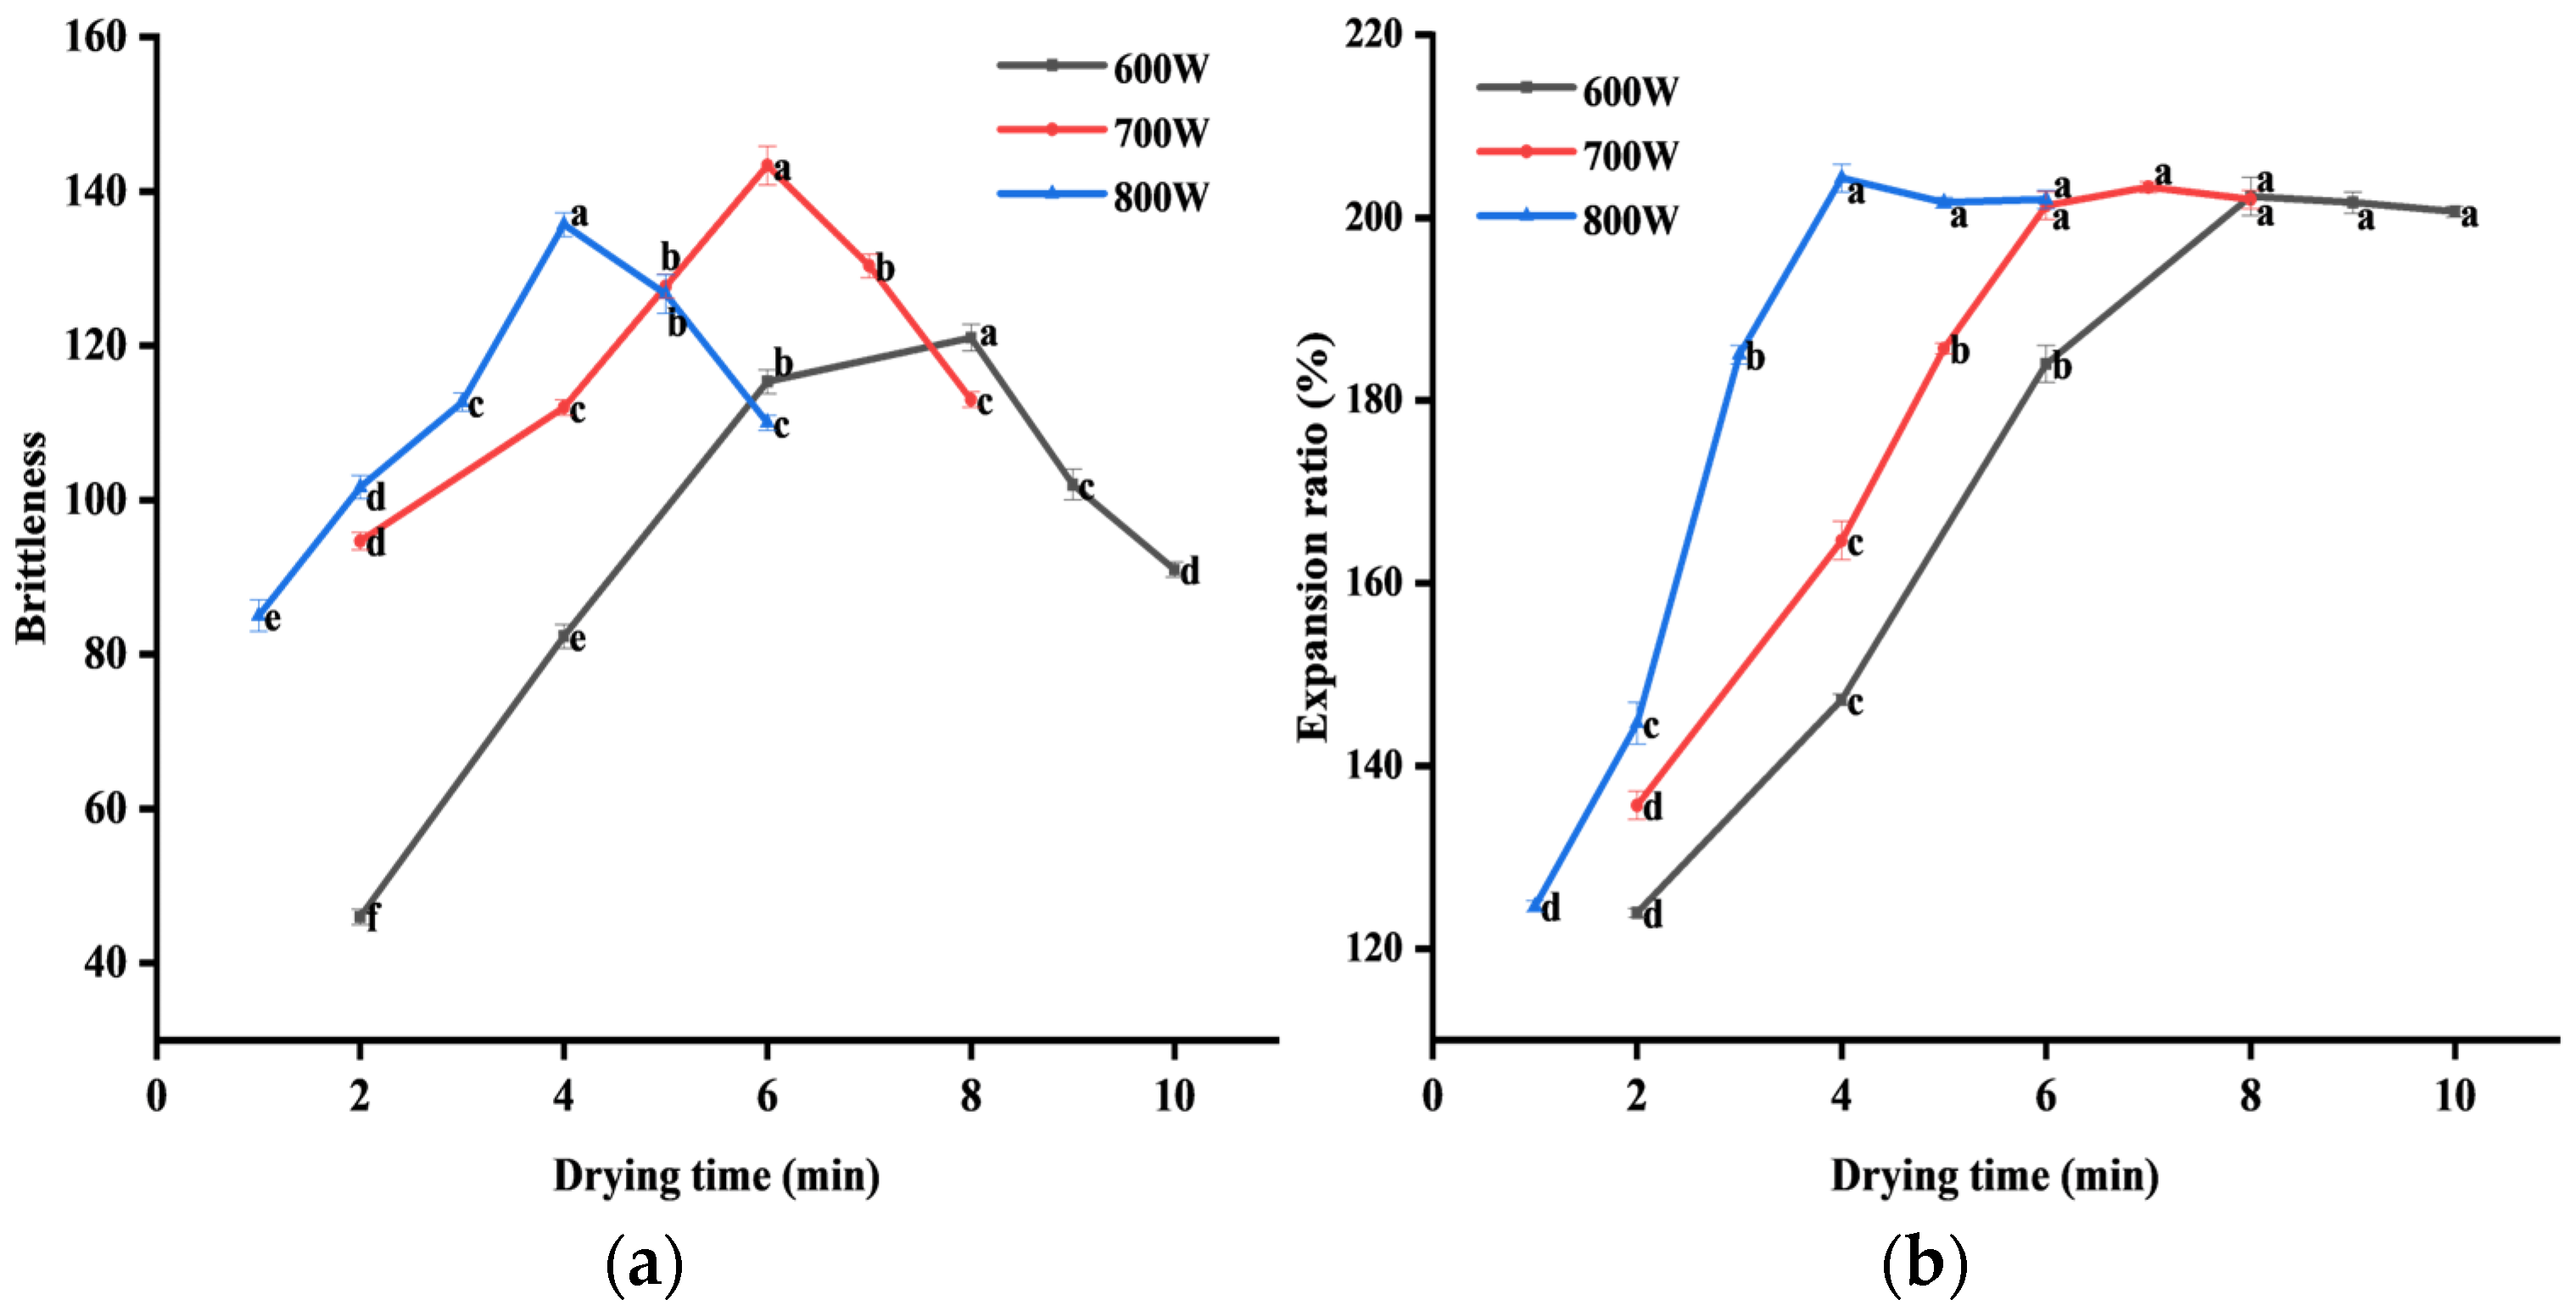
3.2.2. Changes in Brittleness of PSC

Figure 3a shows the changes in brittleness of PSC under different microwave intensities. The brittleness of PSC increases first and then decreases with the extension of drying time. The brittleness of the final PSC was greater at 600 W for 7 min, 700 W for 6 min, and 800 W for 4 min, respectively. Combined with the changes in moisture content (Figure 2b), the brittleness of PSC reached its maximum at the beginning of the hindered drying stage. For different microwave intensities, the brittleness dried at 700 W for 6 min and reached the maximum value. This may be because with the increase in microwave intensity and drying time, the moisture content in PSC was low, the protein in PSC was denatured, and the secondary structure and tertiary structure were changed, leading to the hardening of PSC [40]. In conclusion, the brittleness of PSC improved under MVD.

3.2.3. Changes in Expansion Ratio of PSC

Figure 3b shows the changes in the expansion ratio of PSC. The maximum expansion ratio of PSC was about 200%. With the extension of drying time, the expansion ratio of PSC slowly increased and finally tended to be stable. The higher the microwave intensity, the faster it reached the maximum expansion ratio. At the beginning of the hindered drying stage, the expansion ratio of PSC reached a stable stage. The expansion of PSC was mainly caused by the microwave puffing effect due to the large pressure difference between the inside and outside of the material under a microwave field [41].

3.2.4. Analysis of TBRAS

Lipid oxidation was one of the effects on sensory properties of meat products, and TBARS was an important index to detect secondary lipid oxidation. For the lipid oxidation of by-products such as PSC, TBARS was the most intuitive indicator that can be expressed within a certain range. It can be seen from Figure 4 that under the same microwave power, TBARS increased continuously with the extension of drying time and storage time. This was because with the continuous increase in drying temperature, the quality structure of the material was broken, resulting in significant changes in the degree of fat oxidation. Compared with Figure 4a–c, with the increase in microwave power, its TBARS also increased. It may be that heme iron releases free iron, which reacts with free iron in PSC and damages lipids and proteins through oxidation [42].

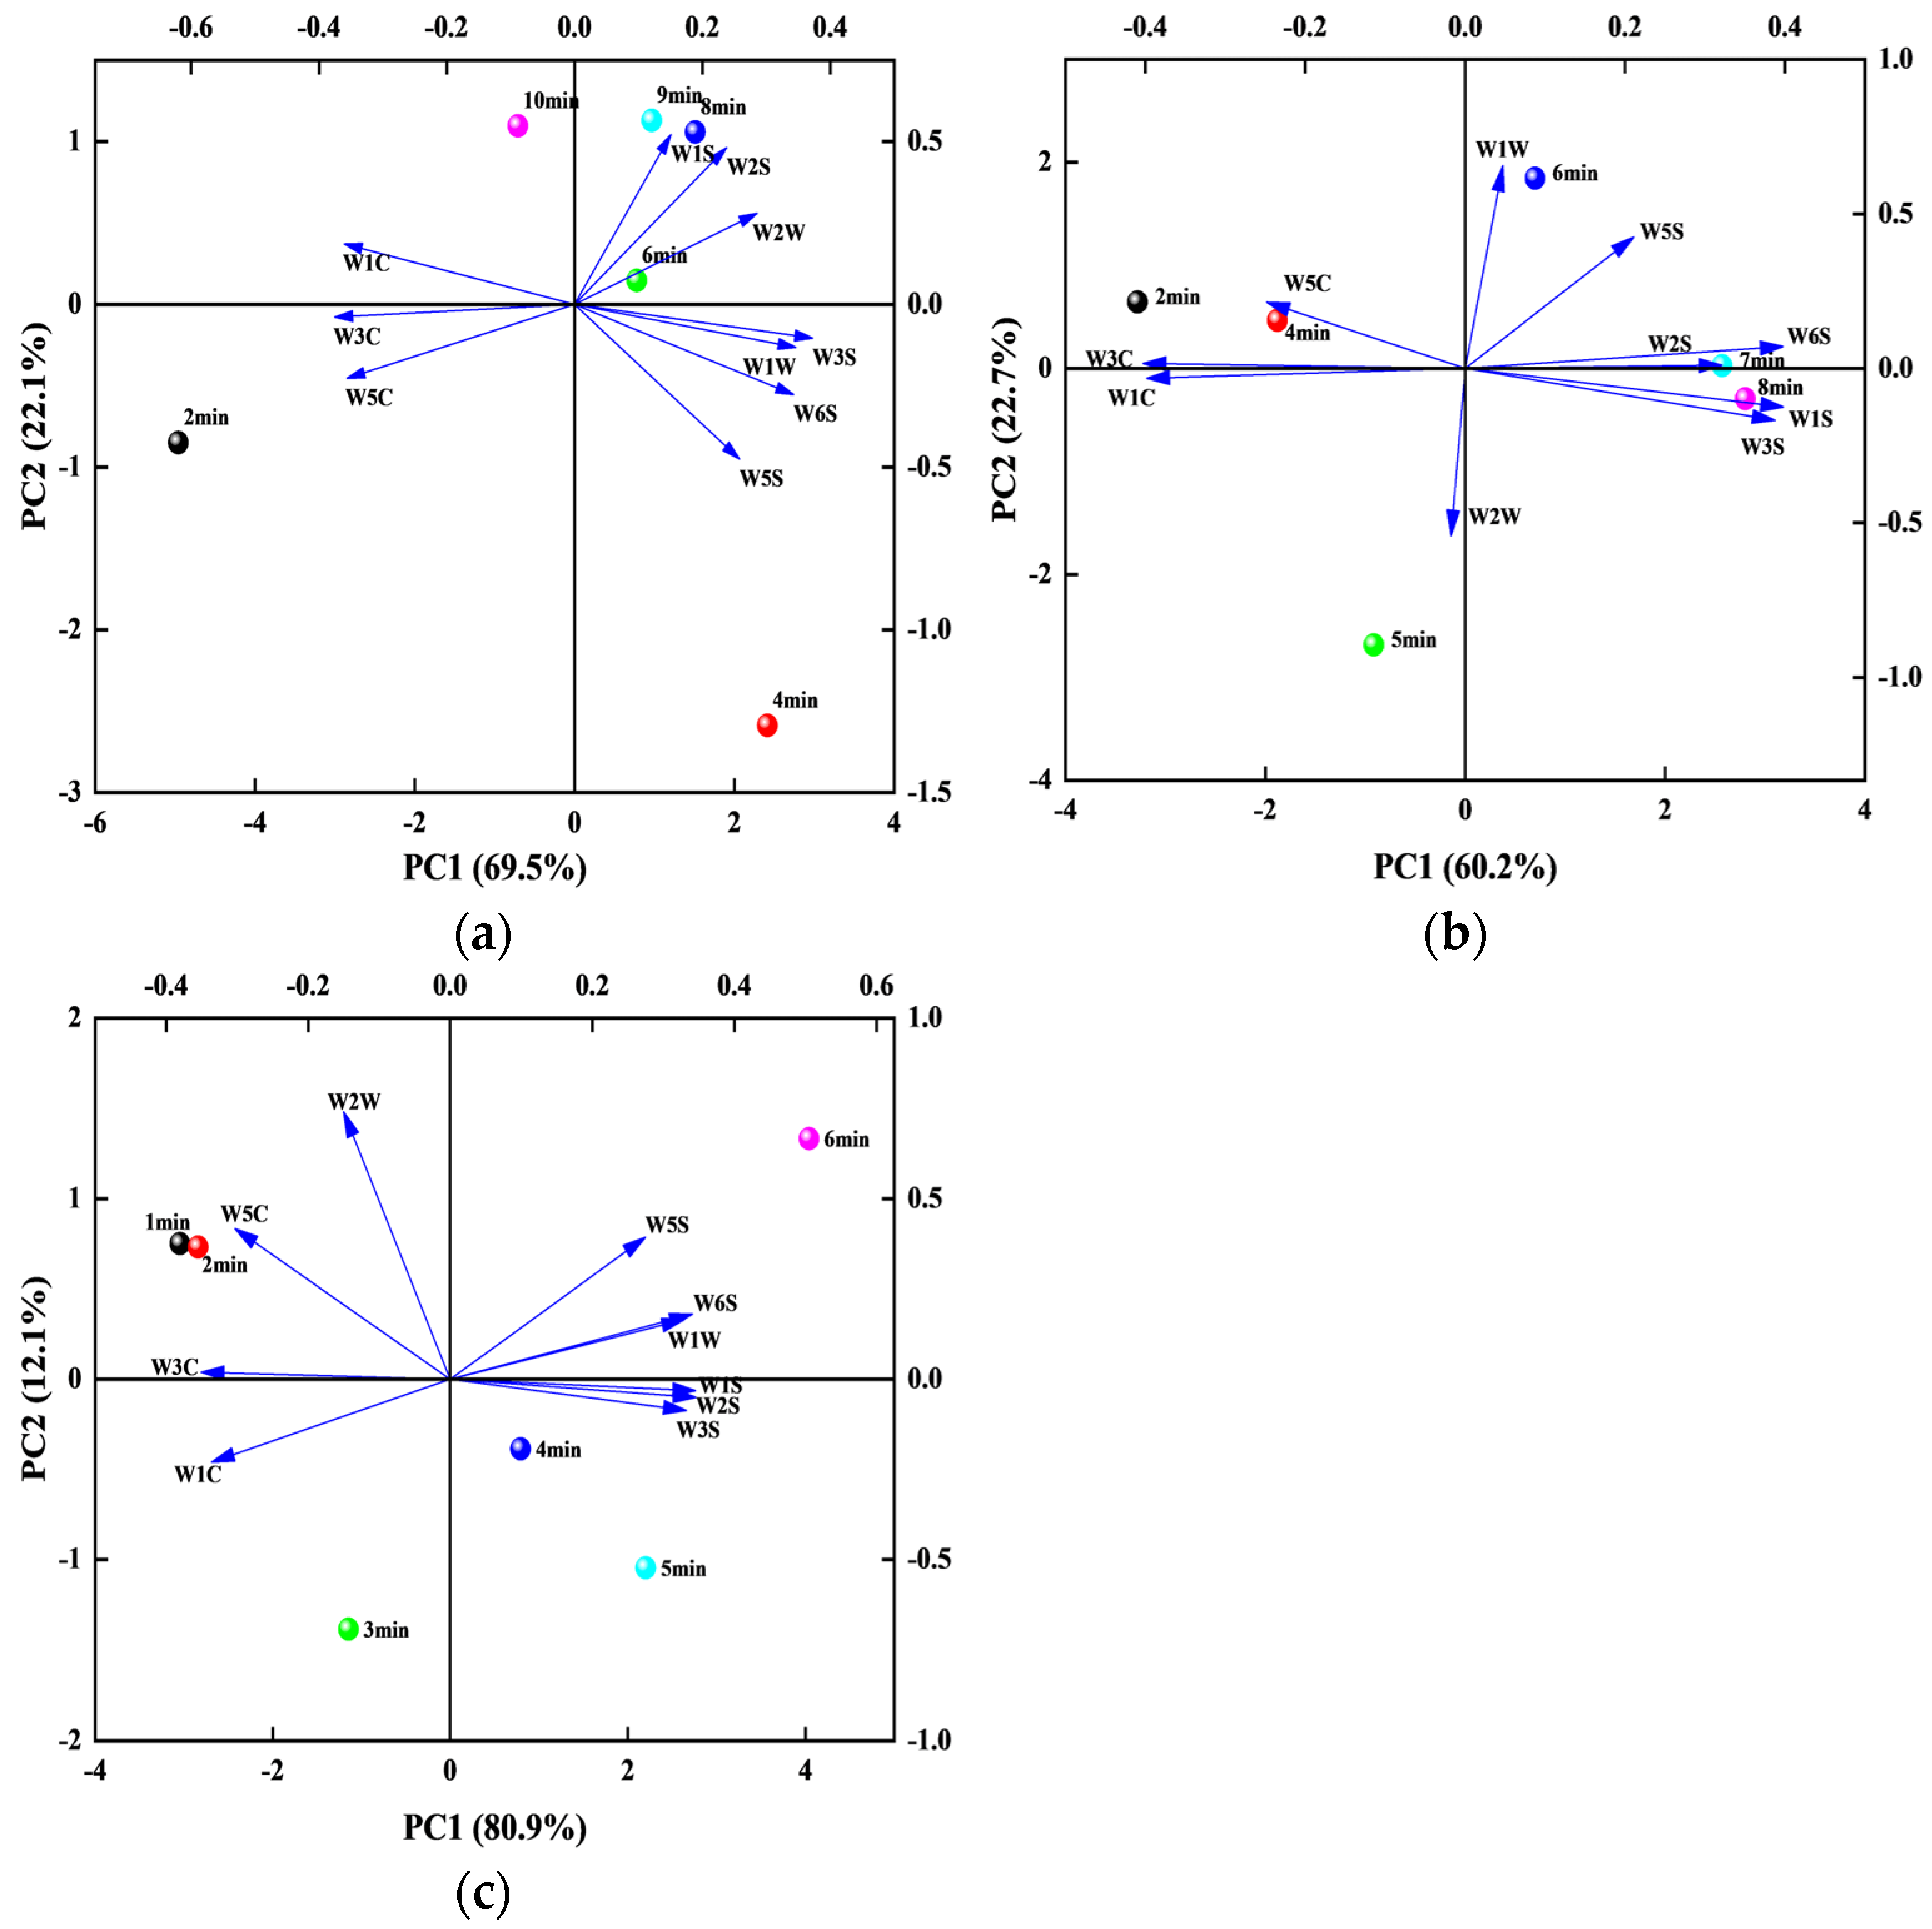
3.2.5. Detection of the Electronic Nose and PCA

It can be seen from Figure 5 that the response values of W1S (alkanes), W2S (alcohols), and W6S (hydrides) rank among the top three, and the top three response values at each power were the same, so the types of aroma substances of PSC were similar for different microwave powers [43]. However, with the increase in drying time, the response value basically increased gradually. In the MVD process, the increasing drying time can lead to the production of various components, the most obvious of which were alkanes, alcohols, and hydrides. It can be seen from Figure 5a,b that the hydride value of 600 W for 10 min was higher than that at 700 W for 8 min, which corresponded to TBARS. The interior temperature of PSC increased with the expansion of duration under 600 W, which caused fat oxidation.
The response values obtained through the electronic nose were used for PCA of PSC under different conditions. Figure 6 shows the PCA results at 600, 700, and 800 W, respectively. Under different microwave powers, the two principal components accounted for approximately 91.6%, 82.9%, and 93% of the total variance, with the first and second principal components accounting for 69.5% and 22.1%, 60.2% and 22.7%, 80.9% and 12.1%, respectively. Therefore, the first principal component was used for the analysis. As shown in Figure 6a, under 600 W, except for W1C, W3C, and W5C, all response values were positively correlated with the drying time of PSC. As shown in Figure 6b, under 700 W, except for W1C, W3C, W5C, and W2W, all response values were positively correlated with the drying time of PSC. As shown in Figure 6c, under 800 W, except for W1C, W3C, W5C, and W2W, all response values were positively correlated with the drying time of PSC. For the second principal component, W1S, W2S, and W1C all showed a negative correlation at different microwave powers, but W2W showed a negative and positive correlation under 700 and 800 W, respectively. Therefore, the combination of PC1 and PC2 can reflect the differences in the response values of PSC under different microwave powers and drying times [44].

3.2.6. Sensory Evaluation

Table 7 shows the effects of different drying conditions on the color, flavor, appearance, and brittleness of PSC. It can be seen from the table that the color and flavor of PSC gradually decrease with the extension of drying time and the continuous increase in drying power, which is consistent with the results of color difference, TBARS, and electronic nose. This indicates that with the extension of drying time and the continuous increase in drying power, the degree of PSC oxidation gradually increases and the flavor changes. However, with the extension of drying time and the continuous increase in drying power, the score of brittleness and appearance showed a trend of first increasing and then decreasing. The highest score appeared after drying for 6 min at 700 W power, which is roughly the same as the result of brittleness.

4. Conclusions

This study investigated the effects of different microwave powers and drying times on the drying characteristics (water activity, moisture ratio, drying rate, effective water diffusion coefficient) and quality attributes (color, brittleness, expansion ratio, electronic nose, fat oxidation) of PSC under MVD conditions. The results showed that the Midilli et al.’s model was found to be fit the best for characterizing the MVD process of PSC among five typical thin-layer drying models. Drying time and microwave power have a significant effect on the product quality of the final PCS. In the constant-rate drying stage, the drying characteristics of PSC were stable, and the brittleness and expansion effect were the best. Excessively long time and high power will lead to the deterioration of the quality of PSC. The quality formation of PSC mainly occurred in the constant-rate drying stage, and the effect was obvious at the critical moisture point at 700 W for 6 min. The optimal processing parameter of PSC under MVD was 700 W for 6 min, and it further showed that MVD had a significant impact on the quality of pig by-product leisure food such as PSC. The product is easy to make, with low energy consumption and a short working time, making it more convenient and efficient to produce the required samples. It is suitable for processing in factories. It provides a new idea for the processing of by-products in the future. By combining microwave technology with meat products, it further expands the field of microwave puffing products and meat product processing, providing a new idea for the future processing of pig skin by-products as leisure foods.

Author Contributions

Investigation, methodology, and writing—original draft: Y.L.; investigation and data curation: J.Z.; software and investigation: J.W.; methodology and visualization: J.R.; formal analysis and resources: C.C.; conceptualization, funding acquisition, supervision, and writing—review and editing: Q.L.; data curation, methodology, investigation, and validation: X.H. All authors have read and agreed to the published version of the manuscript.

Funding

This study was supported by the National Natural Science Foundation of China (Grant No. 32472383) and the Youth Leading Talent Support Program of Northeast Agricultural University (Grant No. NEAU2023QNLJ-014).

Institutional Review Board Statement

According to the National Standard of China (GB/T 43396-2023, GB/T 10220-2012, GB/T 16291.1-2012, and GB/T 23470.2-2009), ethical approval is not applicable for sensory analysis.

Informed Consent Statement

Informed consent was obtained from all subjects involved in the study.

Data Availability Statement

The original contributions presented in the study are included in the article, further inquiries can be directed to the corresponding authors.

Conflicts of Interest

The authors declare no conflicts of interest.

References

  1. Al-Zohairi, S.; Knudsen, M.T.; Mogensen, L. Utilizing animal by-products in European slaughterhouses to reduce the environmental footprint of pork products. Sustain. Prod. Consum. 2023, 37, 306–319. [Google Scholar] [CrossRef]
  2. Toldrá, F.; Aristoy, M.C.; Mora, L.; Reig, M. Innovations in value-addition of edible meat by-products. Meat Sci. 2012, 92, 290–296. [Google Scholar] [CrossRef] [PubMed]
  3. Toldrá, F.; Aristoy, M.C.; Mora, L.; Reig, M. New insights into meat by-product utilization. Meat Sci. 2016, 120, 54–59. [Google Scholar] [CrossRef] [PubMed]
  4. Vidal, V.A.; Biachi, J.P.; Paglarini, C.S.; Pinton, M.B.; Campagnol, P.C.; Esmerino, E.A.; Cruz, A.G.; Morgano, M.A.; Pollonio, M.A. Reducing 50% sodium chloride in healthier jerked beef: An efficient design to ensure suitable stability, technological and sensory properties. Meat Sci. 2019, 152, 49–57. [Google Scholar] [CrossRef]
  5. Chan, D.S.; Lin, H.T.V.; Huang, Y.H.; Syu, Y.J.; Sung, W.C. Prediction and optimization of frying conditions of air fried pork rind using a direct linking model. Int. J. Gastron. Food Sci. 2023, 34, 100837. [Google Scholar] [CrossRef]
  6. Wang, D.D.; Han, W.F.; Liu, S.; Guo, X.J.; Chen, S.; Chen, L.; Qiao, Y.; Wu, W.J.; Li, J.T.; Wang, L. Effects of explosion puffing on surimi-starch blends: Structural characteristics, physicochemical properties, and digestibility. LWT-Food Sci. Technol. 2023, 183, 114902. [Google Scholar] [CrossRef]
  7. Wang, X.H.; Tian, X.J.; Wang, Q.L.; Shen, R.X.; Ma, C.W.; Bai, L.; Wang, W.H. The combination of microwave and hot-air drying to prepare collagen fiber powder from cowhide. J. Food Eng. 2024, 363, 111773. [Google Scholar] [CrossRef]
  8. Xu, M.F.; Liu, Q.W.; Ni, X.X.; Chen, C.C.; Deng, X.H.; Fang, Y.J.; Wang, X.; Shen, Q.; Yu, R.R. Lipidomics reveals the effect of hot-air drying on the quality characteristics and lipid oxidation of Tai Lake whitebait (Neosalanx taihuensis Chen). LWT-Food Sci. Technol. 2024, 197, 115942. [Google Scholar] [CrossRef]
  9. Cheng, J.Y.; Wang, J.Y.; Chen, F.L.; Wu, D.; Gao, C.C.; Cheng, W.W.; Wang, Z.J.; Shen, X.C.; Tang, X.Z. Effect of low temperature extrusion-modified potato starch addition on properties of whole wheat dough and texture of whole wheat youtiao. Food Chem. 2023, 412, 135595. [Google Scholar] [CrossRef]
  10. Zaki, N.A.M.; Alwi, H.; Abd Hashib, S.; Ibrahim, U.K.; Jai, J. Microwave drying characteristics and quality of Ananas comosus peel, core and pulp. Mater. Today Proc. 2023, 87, 8–12. [Google Scholar] [CrossRef]
  11. Zhang, P.L.; Li, B.; Hu, Z.G.; Zhang, Q.Y.; Zhu, Y.S.; Hao, W.R. Effects of ultrasonic and microwave treatment on color, quality and drying characteristics of rice. J. Cereal Sci. 2024, 116, 103856. [Google Scholar] [CrossRef]
  12. Shao, Z.H.; Song, Y.; Hong, Y.; Tao, S.; Sun, J.; Liu, C.; Wu, Z.Y.; Cao, L. The extension of vacuum microwave drying time improved the physicochemical properties, in vitro digestibility and antioxidant activity of brown rice flour. LWT-Food Sci. Technol. 2023, 184, 115023. [Google Scholar] [CrossRef]
  13. Sharma, P.; Venugopal, A.P.; Sutar, P.P. Development of steam-impinged microwave-vacuum assisted blanching of ready-to-cook vegan patties. Innov. Food Sci. Emerg. Technol. 2024, 92, 103595. [Google Scholar] [CrossRef]
  14. Liang, X.; Xu, Z.H.; Li, X.; Kong, B.H.; Xia, X.F.; Zhang, Y.H.; Liu, Q.; Shen, L.Y. Effect of microwave drying on the brittleness quality of pork chip snacks: Perspectives on drying kinetics and microstructural traits. LWT-Food Sci. Technol. 2023, 185, 115147. [Google Scholar] [CrossRef]
  15. Wang, X.J.; Wang, X.W.; Feng, T.T.; Shen, Y.; Xia, S.Q. Saltiness perception enhancement of fish meat treated by microwave: The significance of conformational characteristics, water and sodium mobility. Food Chem. 2021, 347, 129033. [Google Scholar] [CrossRef]
  16. Gutiérrez, J.D.; Catalá-Civera, J.M.; Bows, J.; Peñaranda-Foix, F.L. Dynamic measurement of dielectric properties of food snack pellets during microwave expansion. J. Food Eng. 2017, 202, 1–8. [Google Scholar] [CrossRef]
  17. Gaikwad, P.S.; Sunil, C.K.; Negi, A.; Pare, A. Effect of microwave assisted hot-air drying temperatures on drying kinetics of dried black gram papad (Indian snack food): Drying characteristics of black gram papad. Appl. Food Res. 2022, 2, 100144. [Google Scholar] [CrossRef]
  18. Ishibashi, R.; Numata, T.; Tanigawa, H.; Tsuruta, T. In-situ measurements of drying and shrinkage characteristics during microwave vacuum drying of radish and potato. J. Food Eng. 2022, 323, 110988. [Google Scholar] [CrossRef]
  19. Liu, J.; Liu, Y.Y.; Li, X.L.; Zhu, J.B.; Wang, X.M.; Ma, L.C. Drying characteristics, quality changes, parameters optimization and flavor analysis for microwave vacuum drying of garlic (Allium sativum L.) slices. LWT-Food Sci. Technol. 2023, 173, 114372. [Google Scholar] [CrossRef]
  20. Calín-Sánchez, Á.; Szumny, A.; Figiel, A.; Jałoszyński, K.; Adamski, M.; Carbonell-Barrachina, Á.A. Effects of vacuum level and microwave power on rosemary volatile composition during vacuum–microwave drying. J. Food Eng. 2011, 103, 219–227. [Google Scholar] [CrossRef]
  21. Zheng, X.Z.; Liu, C.H.; Shi, J.; Xue, S.; Mu, Y.Q.; Lin, Z.; Liu, H.J. Analysis of volume expansion and dehydration rate of berry slab under microwave-vacuum puffing conditions. LWT-Food Sci. Technol. 2013, 52, 39–48. [Google Scholar] [CrossRef]
  22. Zhang, J.; Ding, C.J.; Lu, J.L.; Wang, H.X.; Bao, Y.T.; Han, B.Y.; Duan, S.S.; Song, Z.Q.; Chen, H. Influence of electrohydrodynamics on the drying characteristics and volatile components of iron stick yam. Food Chem. X 2023, 20, 101026. [Google Scholar] [CrossRef] [PubMed]
  23. Tanaka, F.; Tanaka, F.; Tanaka, A.; Uchino, T. Mathematical modelling of thin-layer drying according to particle size distribution in crushed feed rice. Biosyst. Eng. 2015, 136, 87–91. [Google Scholar] [CrossRef]
  24. Ahmed, M.; Faisal, M.; Laskar, A.; Abdullah, A.; Shahadat, M.; Umar, K.; Kamyab, H.; Ubaidullah, M.; Pandit, B.; Prakash, C.; et al. Experimental studies for thin layer model validation and microwave drying characteristics of beetroot considering energy optimization. Fuel 2023, 346, 128345. [Google Scholar] [CrossRef]
  25. Cao, C.A.; Yuan, D.X.; Kong, B.H.; Chen, Q.; He, J.J.; Liu, Q. Effect of different κ-carrageenan incorporation forms on the gel properties and in vitro digestibility of frankfurters. Food Hydrocoll. 2022, 129, 107637. [Google Scholar] [CrossRef]
  26. Li, X.; Bi, J.F.; Jin, X.; Lyu, J.; Wu, X.Y.; Li, B.; Li, X. Study on the mechanism of volume expansion and texture formation of apple cube dried by instant controlled pressure drop drying (DIC). J. Food Eng. 2021, 293, 110379. [Google Scholar] [CrossRef]
  27. Barbosa-Pereira, L.; Rojo-Poveda, O.; Ferrocino, I.; Giordano, M.; Zeppa, G. Assessment of volatile fingerprint by HS-SPME/GC-qMS and E-nose for the classification of cocoa bean shells using chemometrics. Food Res. Int. 2019, 123, 684–696. [Google Scholar] [CrossRef]
  28. Yuan, D.X.; Xu, Y.N.; Kong, B.H.; Cao, C.A.; Zhang, F.X.; Xia, X.F.; Zhang, H.W.; Liu, Q.; Zhao, J.H. Application of seaweed dietary fiber as a potential alternative to phosphates in frankfurters with healthier profiles. Meat Sci. 2023, 196, 109044. [Google Scholar] [CrossRef]
  29. Chen, Y.C.; Jia, X.W.; Sun, F.D.; Jiang, S.; Liu, H.T.; Liu, Q.; Kong, B.H. Using a stable pre-emulsified canola oil system that includes porcine plasma protein hydrolysates and oxidized tannic acid to partially replace pork fat in frankfurters. Meat Sci. 2019, 167, 107968. [Google Scholar] [CrossRef]
  30. García-Moreira, D.P.; Pacheco, N.; Hernández-Guzmán, H.; Bahammou, Y.; Tagnamas, Z.; Moreno, I.; López-Vidaña, E.C. Evaluation of various drying methods for mexican yahualica chili: Drying characteristics and quality assessment. Processes 2024, 12, 9. [Google Scholar] [CrossRef]
  31. Chen, A.; Achkar, G.E.; Liu, B.; Bennacer, R. Experimental study on moisture kinetics and microstructure evolution in apples during high power microwave drying process. J. Food Eng. 2021, 292, 110362. [Google Scholar] [CrossRef]
  32. Shen, L.Y.; Zhu, Y.; Liu, C.H.; Wang, L.; Liu, H.; Kamruzzaman, M.; Liu, C.; Zhang, Y.P.; Zheng, X.Z. Modelling of moving drying process and analysis of drying characteristics for germinated brown rice under continuous microwave drying. Biosyst. Eng. 2020, 195, 64–88. [Google Scholar] [CrossRef]
  33. Thongcharoenpipat, C.; Yamsaengsung, R. Microwave-assisted vacuum frying of durian chips: Impact of ripening level on the drying rate, physio-chemical characteristics, and acceptability. Food Bioprod. Process. 2023, 138, 40–52. [Google Scholar] [CrossRef]
  34. Mbegbu, N.N.; Nwajinka, C.O.; Amaefule, D.O. Thin layer drying models and characteristics of scent leaves (Ocimum gratissimum) and lemon basil leaves (Ocimum africanum). Heliyon 2021, 7, e05945. [Google Scholar] [CrossRef]
  35. Li, M.G.; Wang, B.; Lv, W.Q.; Zhao, D.L. Effect of ultrasound pretreatment on the drying kinetics and characteristics of pregelatinized kidney beans based on microwave-assisted drying. Food Chem. 2022, 397, 133806. [Google Scholar] [CrossRef]
  36. Sharma, G.P.; Prasad, S. Effective moisture diffusivity of garlic cloves undergoing microwave-convective drying. J. Food Eng. 2004, 65, 609–617. [Google Scholar] [CrossRef]
  37. Salehi, F.; Goharpour, K.; Kamran, H.R. Effects of different pretreatment techniques on the color indexes, drying characteristics and rehydration ratio of eggplant slices. Results Eng. 2024, 21, 101690. [Google Scholar] [CrossRef]
  38. Khan, W.U.H.; Khoja, A.H.; Gohar, H.; Naqvi, S.R.; Din, I.U.; Lumbers, B.; Salem, M.A.; Alzahrani, A.Y. In depth thermokinetic investigation on Co-pyrolysis of low-rank coal and algae consortium blends over CeO2 loaded hydrotalcite (MgNiAl) catalyst. J. Environ. Chem. Eng. 2022, 10, 108293. [Google Scholar] [CrossRef]
  39. Mendonça, K.S.; Corrêa, J.L.G.; Jesus Junqueira, J.R.; Carvalho, E.E.N.; Silveira, P.G.; Uemura, J.H.S. Peruvian carrot chips obtained by microwave and microwave-vacuum drying. LWT-Food Sci. Technol. 2023, 187, 115346. [Google Scholar] [CrossRef]
  40. Dong, X.; Wang, J.; Raghavan, V. Impact of microwave processing on the secondary structure, in-vitro protein digestibility and allergenicity of shrimp (Litopenaeus vannamei) proteins. Food Chem. 2021, 337, 127811. [Google Scholar] [CrossRef]
  41. Gutiérrez-Cano, J.D.; Hamilton, I.E.; Catalá-Civera, J.M.; Bows, J.; Peñaranda-Foix, F.L. Effect of water content on the dynamic measurement of dielectric properties of food snack pellets during microwave expansion. J. Food Eng. 2018, 232, 21–28. [Google Scholar] [CrossRef]
  42. Fang, W.J.; Zhang, Y.K.; Chen, Y.C.; Sun, J.X.; Yi, Y.W. TBARS predictive models of pork sausages stored at different temperatures. Meat Sci. 2014, 96, 1–4. [Google Scholar] [CrossRef]
  43. Jiang, N.; Liu, C.Q.; Li, D.J.; Zhang, Z.Y.; Liu, C.J.; Wang, D.; Niu, L.Y.; Zhang, M. Evaluation of freeze drying combined with microwave vacuum drying for functional okra snacks: Antioxidant properties, sensory quality, and energy consumption. LWT-Food Sci. Technol. 2017, 82, 216–226. [Google Scholar] [CrossRef]
  44. Wang, R.; Wang, L.H.; Wen, Q.H.; He, F.; Xu, F.Y.; Chen, B.R.; Zeng, X.A. Combination of pulsed electric field and pH shifting improves the solubility, emulsifying, foaming of commercial soy protein isolate. Food Hydrocoll. 2023, 134, 108049. [Google Scholar] [CrossRef]
Figure 1. PSC tray placement before MVD.
Foods 13 04020 g001
Figure 2. Drying curves of PSC under different microwave intensities. (a) The change in drying rate with drying time. (b) The change in moisture ratio with drying time. (c) The relationship between LnMR and drying time. (d) The change in moisture content with drying time. The letters a–f indicate the significance at p < 0.05 between the different treatments.
Foods 13 04020 g002aFoods 13 04020 g002b
Figure 3. Quality changes in (a) brittleness and (b) expansion ratio of PSC with the drying time under different microwave intensities. The letters a–f indicate the significance at p < 0.05 between the different treatments.
Foods 13 04020 g003
Figure 4. The change in TBRAS value at (a) 600 W, (b) 700 W, and (c) 800 W with the storage days under different drying times. The different letters indicate the significance at p < 0.05 between the different treatments.
Foods 13 04020 g004
Figure 5. Changes in the electronic nose data at (a) 600 W, (b) 700 W, and (c) 800 W under different drying times.
Foods 13 04020 g005
Figure 6. PCA of the electronic nose at different times under (a) 600 W, (b) 700 W, and (c) 800 W.
Foods 13 04020 g006
Table 1. Drying models used for characterizing the MVD process of PSC.
NumberModel NameModel ExpressionModel Parameters
1NewtonMR = exp(−kt)k
2PageMR = exp(−ktn)k, n
3Wang and SinghMR = 1 + at + bt2a, b
4Henderson and PabisMR = a × exp(−kt)a, k
5Midilli et al.MR = a × exp(−ktn) + bta, k, n, b
Table 2. Material classification of electronic nose sensor.
NumberSensorSubstances for Sensing
S1W1CAromatic compounds
S2W5SNitrogen oxide
S3W3CAromatic molecule
S4W6SHydride
S5W5COlefin, Aromatics
S6W1SAlkanes
S7W1WSulfur compound
S8W2SAlcohols
S9W2WOrganic compounds of sulfur
S10W3SAliphatic group
Table 3. Sensory scoring criteria.
Sensory ItemsScoring CriteriaScore
ColorGolden yellow color, uniform color, no burnt phenomenon6–7
It appears golden or brownish yellow, with a relatively uniform color and a slight burnt appearance4–5
Brownish yellow in color, uneven in color, almost dull, partially burnt2–3
Black brown in color, uneven in color, severely burnt1
FlavorNo odor6–7
There is a slight smell of oxidation4–5
Has a strong oxidizing odor2–3
There is a noticeable smell of oxidation1
AppearanceHoneycomb-like uniformity, complete and evenly distributed foaming, fully expanded6–7
Honeycomb-shaped uniform, with less complete and evenly distributed foaming and some puffing4–5
Honeycomb-like structure is relatively uniform, with incomplete foaming and uneven distribution around the edges and no puffing at the edges2–3
Honeycomb-like unevenness, incomplete foaming, significant size differences, and overall uneven distribution, without any puffing at all1
BrittlenessCrispy texture and good chewiness6–7
Relatively crispy, with slightly an uneven texture of softness and hardness4–5
Partially crispy, with uneven texture of softness and hardness2–3
Soft or severely hardened texture, difficult to chew1
Table 4. Changes in water activity and color of PSC with the drying time under different microwave intensities.
Microwave Intensity (W)Drying Time (min)Water ActivityL* Valuea* Valueb* Value
60020.462 ± 0.006 A80.563 ± 0.007 A5.087 ± 0.189 I17.618 ± 0.108 Q
40.393 ± 0.002 C79.710 ± 0.021 B4.717 ± 0.024 J18.753 ± 0.072 P
60.323 ± 0.002 F79.203 ± 0.039 BC4.523 ± 0.058 K19.580 ± 0.087 O
80.250 ± 0.003 IJK78.863 ± 0.033 C4.403 ± 0.049 L20.097 ± 0.041 N
90.246 ± 0.006 JKL77.863 ± 0.033 D4.253 ± 0.026 M20.703 ± 0.113 M
100.239 ± 0.002 LM76.380 ± 0.015 E4.237 ± 0.034 M21.337 ± 0.112 AL
70020.426 ± 0.007 B75.373 ± 0.218 E5.877 ± 0.058 E21.850 ± 0.068 K
40.347 ± 0.003 E74.753 ± 0.041 F5.730 ± 0.057 F22.133 ± 0.062 J
50.296 ± 0.004 H73.887 ± 0.007 G5.503 ± 0.030 G22.657 ± 0.084 I
60.253 ± 0.009 IJ73.073 ± 0.050 H5.373 ± 0.021 H23.080 ± 0.064 H
70.243 ± 0.003 JKL72.910 ± 0.060 H5.270 ± 0.031 H23.533 ± 0.056 G
80.238 ± 0.002 LM71.383 ± 0.096 J5.137 ± 0.064 I24.233 ± 0.056 F
80010.458 ± 0.003 A72.070 ± 0.070 I6.860 ± 0.036 A24.873 ± 0.067 E
20.381 ± 0.001 D71.223 ± 0.088 J6.670 ± 0.064 B25.250 ± 0.055 D
30.309 ± 0.005 G69.807 ± 0.046 K6.490 ± 0.0292 C26.230 ± 0.121 C
40.258 ± 0.002 I69.127 ± 0.056 K6.423 ± 0.038 C26.317 ± 0.055 C
50.240 ± 0.003 KLM69.093 ± 0.060 K6.267 ± 0.074 D26.587 ± 0.029 B
60.231 ± 0.002 M69.323 ± 0.304 K6.193 ± 0.009 D26.980 ± 0.017 A
P (Microwave intensity) ********
P (Drying time) ********
P (Microwave intensity × Drying time) ****ns**
Note: Data were expressed as means ± standard deviation (n = 3); A–M in the third column, A–K in the fourth column, A–M in the fifth column, and A–Q in the sixth column indicate significant differences (p < 0.05) in water activity, brightness, redness, and yellowness values among samples with different degrees of dryness. **, very important (p < 0.01). ns, the difference is not significant.
Table 5. Effective moisture diffusion coefficient of PSC under different microwave intensities.
Microwave Intensity (W)Fitted EquationR2Deff (m2/s)
600LnMR = 0.6380 − 0.3738t0.95622.3695 × 10−5
700LnMR = 0.7209 − 0.4999t0.92143.1689 × 10−5
800LnMR = −0.0451 − 0.5356t0.93903.3395 × 10−5
Table 6. According to the drying model shown in Table 1, the modeling results of moisture ratio and drying time under different microwave intensities.
NumberModel NameMicrowave Intensity (W)Model ParameterR2χ2RMSE
1Newton600k = 0.21060.97340.22780.0900
700k = 0.28730.97940.19430.0740
800k = 0.50260.98070.09300.0543
2Page600k = 0.0589
n = 1.7345
0.98680.02760.0289
700k = 0.1311
n = 1.5152
0.98050.08560.0461
800k = 0.3516
n = 1.4190
0.98760.12080.0245
3Wang and Singh600a = −0.1378
b = 0.0038
0.98400.17400.0401
700a = −0.1972
b = 0.0092
0.98390.17780.0432
800a = −0.3746
b = 0.0360
0.99560.03610.0238
4Henderson and Pabis600a = 1.0711
k = 0.2231
0.94870.20160.0848
700a = 1.0403
k = 0.2962
0.95670.18510.0722
800a = 1.0387
k = 0.5192
0.97940.08370.0519
5Midilli et al.600a = 1.0111
b = 0.1197
n = 7.5693
k = −5.7674
0.99800.01920.0157
700a = 0.9870
b = −0.1531
n = 5.8489
k = −1.3273
0.98880.05520.0362
800a = 0.9930
b = 0.0046
n = 1.5124
k = 0.3391
0.99600.01810.0218
Table 7. Sensory scoring results of PSC.
Microwave Intensity (W)Drying Time (min)ColorFlavorAppearanceBrittleness
60026.23 ± 0.252 B6.40± 0.100 A5.33 ± 0.058 CD3.70 ± 0.200 EFG
46.21 ± 0.100 A6.20 ± 0.100 A5.13 ± 0.153 D4.27 ± 0.252 CDEF
66.17 ± 0.153 B6.23 ± 0.208 A5.77 ± 0.321 B5.87 ± 0.252 AB
85.67 ± 0.115 C5.70 ± 0.265 CD6.23 ± 0.115 A6.20 ± 0.100 A
94.20 ± 0.100 E4.97 ± 0.208 E5.53 ± 0.208 BC4.90 ± 1.646 CD
102.47 ± 0.208 F3.43 ± 0.252 GH5.30 ± 0.100 CD4.20 ± 0.100 CDEF
70026.70 ± 0.100 A6.33 ± 0.208 A5.60 ± 0.300 BC3.33 ± 0.208 FG
46.40 ± 0.200 AB6.30 ± 0.100 A5.17 ± 0.058 D4.10 ± 0.100 DEFG
56.20 ± 0.200 B6.33 ± 0.153 A6.27 ± 0.058 A5.93 ± 0.351 AB
65.27 ± 0.153 D6.13 ± 0.153 AB6.50 ± 0.200 A6.67 ± 0.153 A
74.10 ± 0.200 E5.73 ± 0.153 CD4.73 ± 0.153 E5.20 ± 0.100 BC
82.13 ± 0.306 G4.63 ± 0.058 F3.50 ± 0.100 H4.17 ± 0.115 CDEF
80016.70 ± 0.100 A6.30 ± 0.100 A5.30 ± 0.100 CD3.33 ± 0.321 FG
26.40 ± 0.200 AB5.87 ± 0.153 BC5.20 ± 0.173 D4.23 ± 0.058 CDEF
36.20 ± 0.200 B5.43 ± 0.153 D5.73 ± 0.153 B4.67 ± 1.429 CDE
45.27 ± 0.153 D4.53 ± 0.289 F6.30 ± 0.100 A6.33 ± 0.153 A
54.10 ± 0.200 E3.73 ± 0.252 G5.30 ± 0.100 CD4.80 ± 0.100 CD
62.13 ± 0.306 G3.23 ± 0.153 H4.30 ± 0.265 G3.10 ± 0.300 G
P (Microwave intensity) ********
P (Drying time) ********
P (Microwave intensity × Drying time) ********
Note: The different superscripted letters in each column indicate the significance at p < 0.05 between the different treatments. **, very important (p < 0.01).
Disclaimer/Publisher’s Note: The statements, opinions and data contained in all publications are solely those of the individual author(s) and contributor(s) and not of MDPI and/or the editor(s). MDPI and/or the editor(s) disclaim responsibility for any injury to people or property resulting from any ideas, methods, instructions or products referred to in the content.

