
Comparative Study on the Nutritional Quality of Peanut in Saline and Non-Saline Land


Abstract
1. Introduction
2. Materials and Experimental Methods
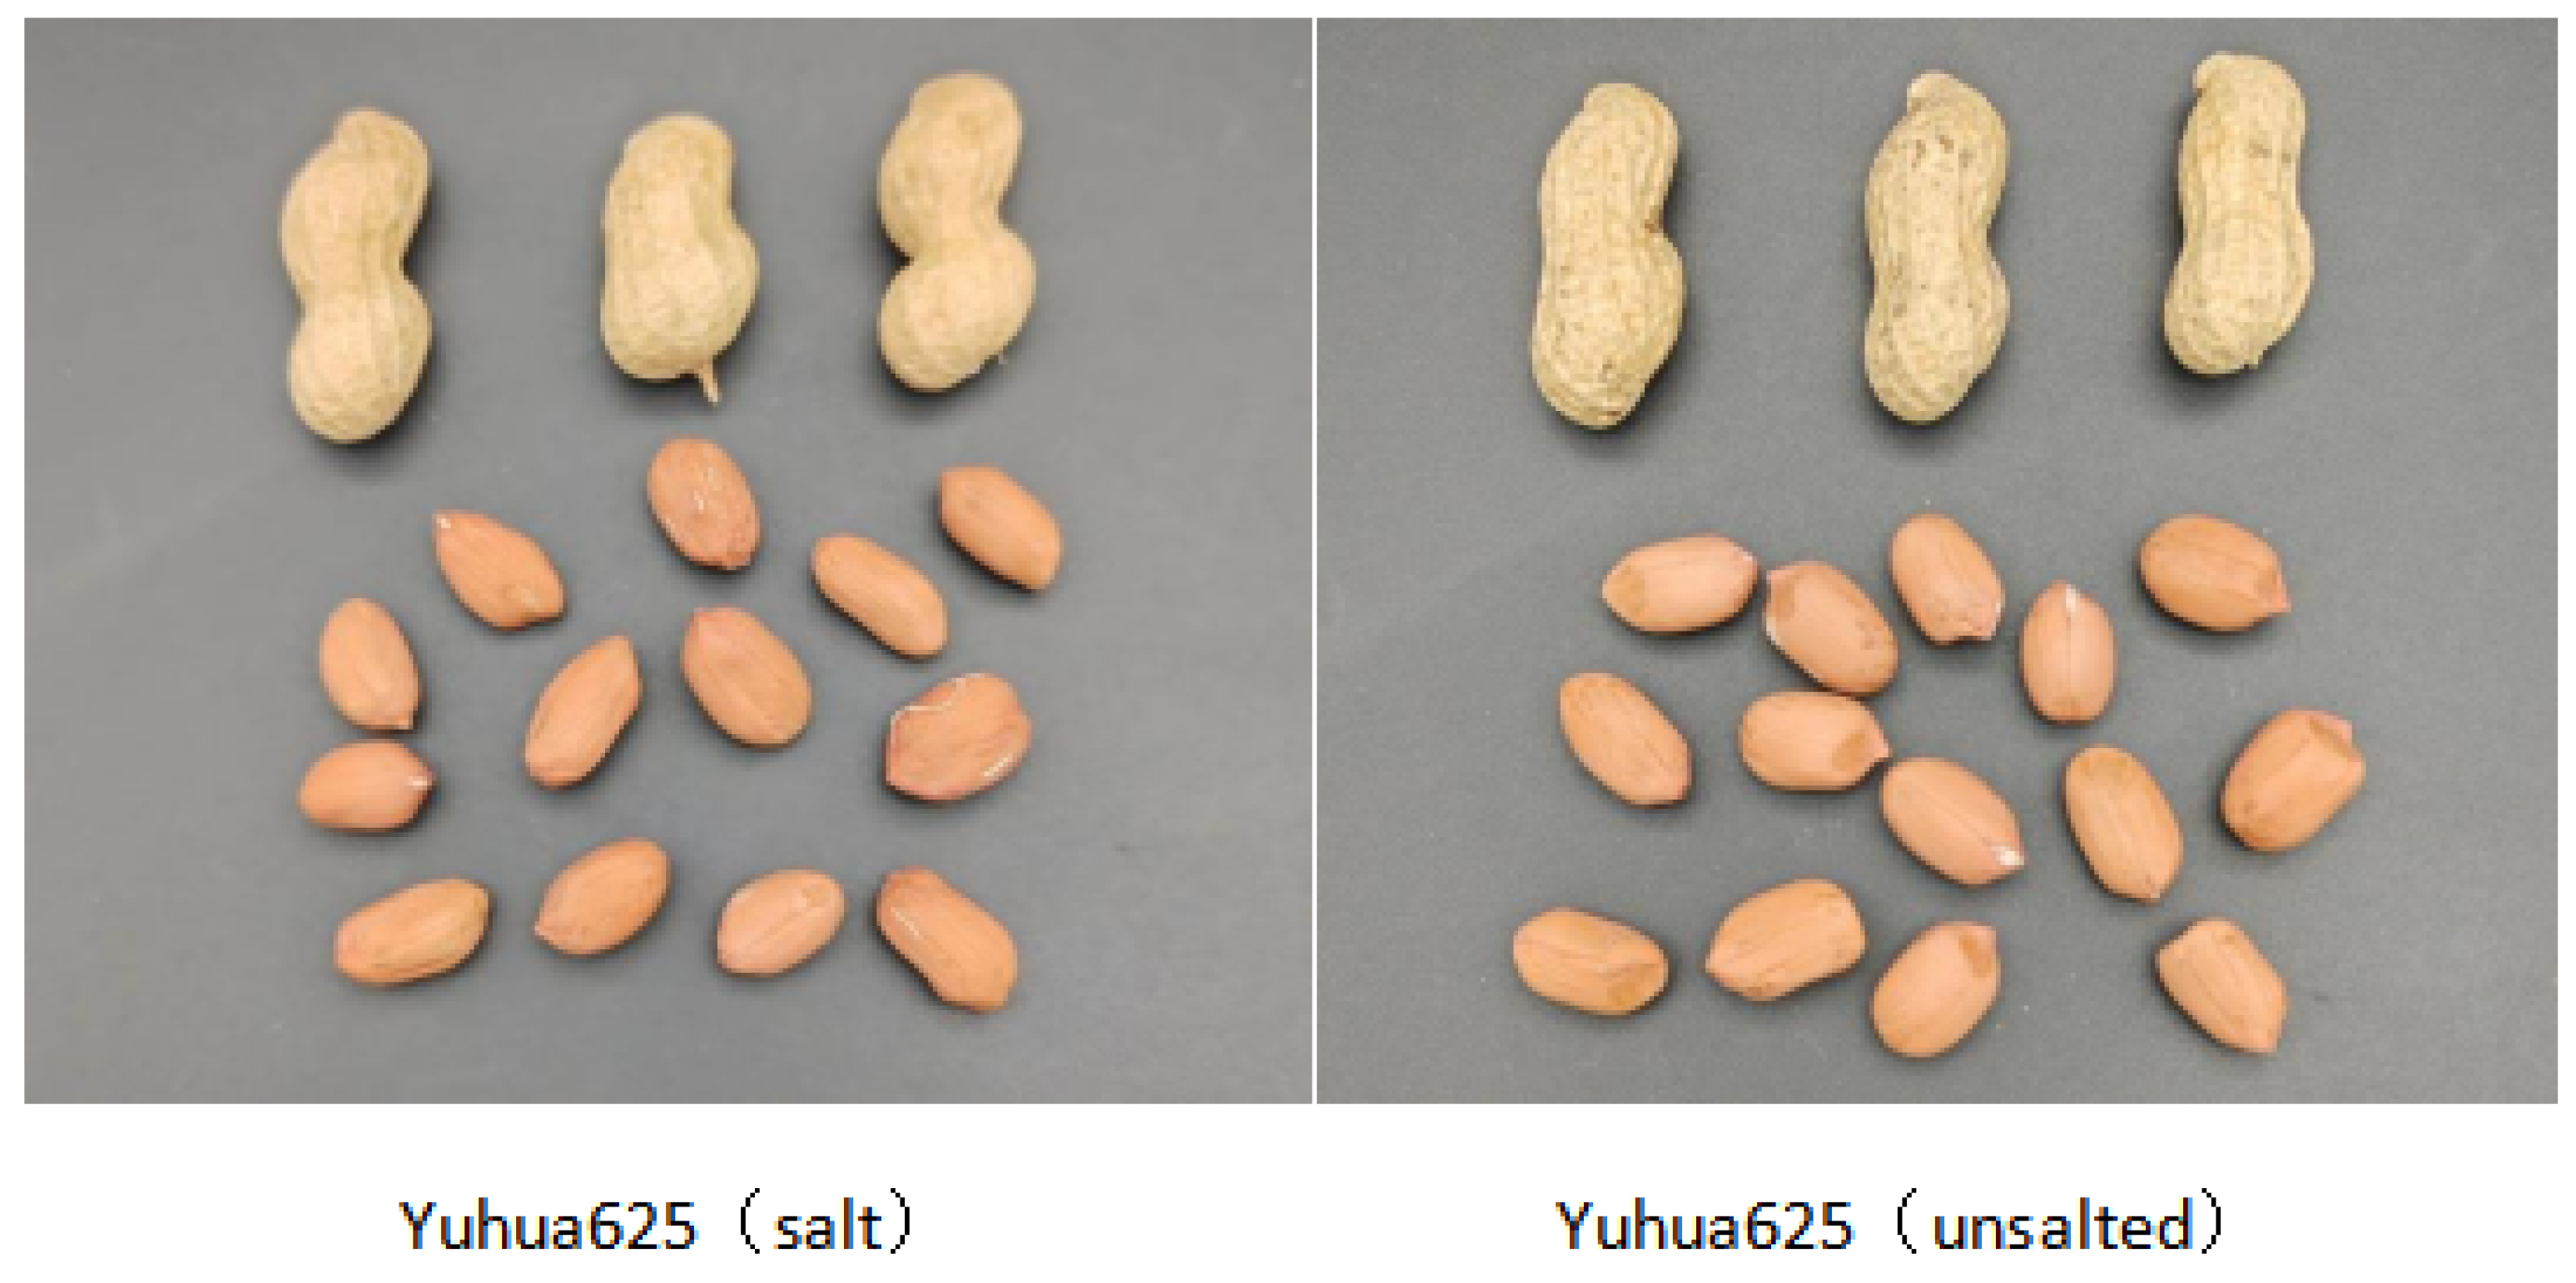
2.1. Raw Materials
2.2. Instrumentation and Chemicals
2.3. Determination of Nutrient Content
2.3.1. Determination of Macronutrients
2.3.2. Determination of Mineral Content
2.3.3. Determination of Vitamin Content
2.3.4. Determination of Phytosterol Content
2.3.5. Determination of Guanine Content
2.3.6. Determination of Fatty Acid Content
2.4. Determination of Functional Components
2.4.1. Determination of Superoxide Dismutase (SOD) Activity and Total Antioxidant Capacity
2.4.2. Determination of ABTS Free Radical Scavenging Capacity and DPPH Free Radical Scavenging Capacity
2.4.3. Determination of Total Phenol Content
2.4.4. Determination of Total Flavonoid Content
- (1)
- Accurately weigh 15 mg of rutin; dissolve it with 70% ethanol acidic solution until the volume reaches 100 mL of the volumetric flask. Shake well and spare, that is, the standard solution of rutin. Accurately absorb the standard solutions at 0, 0.5, 1, 2, 3, and 4 mL of a 10 mL colorimeter; add 70% ethanol acidic solution to the 5 mL solution, add 0.3 mL 5% NaNO2 for 5 min, add 0.3 mL 10% AlCl3 for 6 min, and then add 2 mL 1 mol/L NaOH. Add water to the 10 mL solution, and finally measure the absorbance value at a wavelength of 510 nm and establish the standard curve.
- (2)
- Weigh the sample to 20 g. Prepare a homogeneous slurry by adding an appropriate amount of water and then extract it into a conical flask by ultrasonic extraction with 100 mL of 70% acidic ethanol solution. Extraction time should be 40 min; extraction temperature, 40 °C. After cooling, centrifuge the supernatant (3500 r/min, 20 min) into a 100 mL volumetric flask.
- (3)
- Determine the flavonoid content of the above samples by drawing 1.0 mL of the samples separately according to the standard curve method. The sample without reaction solution should be used as the blank sample.
2.5. Statistical Analysis
3. Results and Discussion
3.1. Comparative Analysis of Macronutrient Content
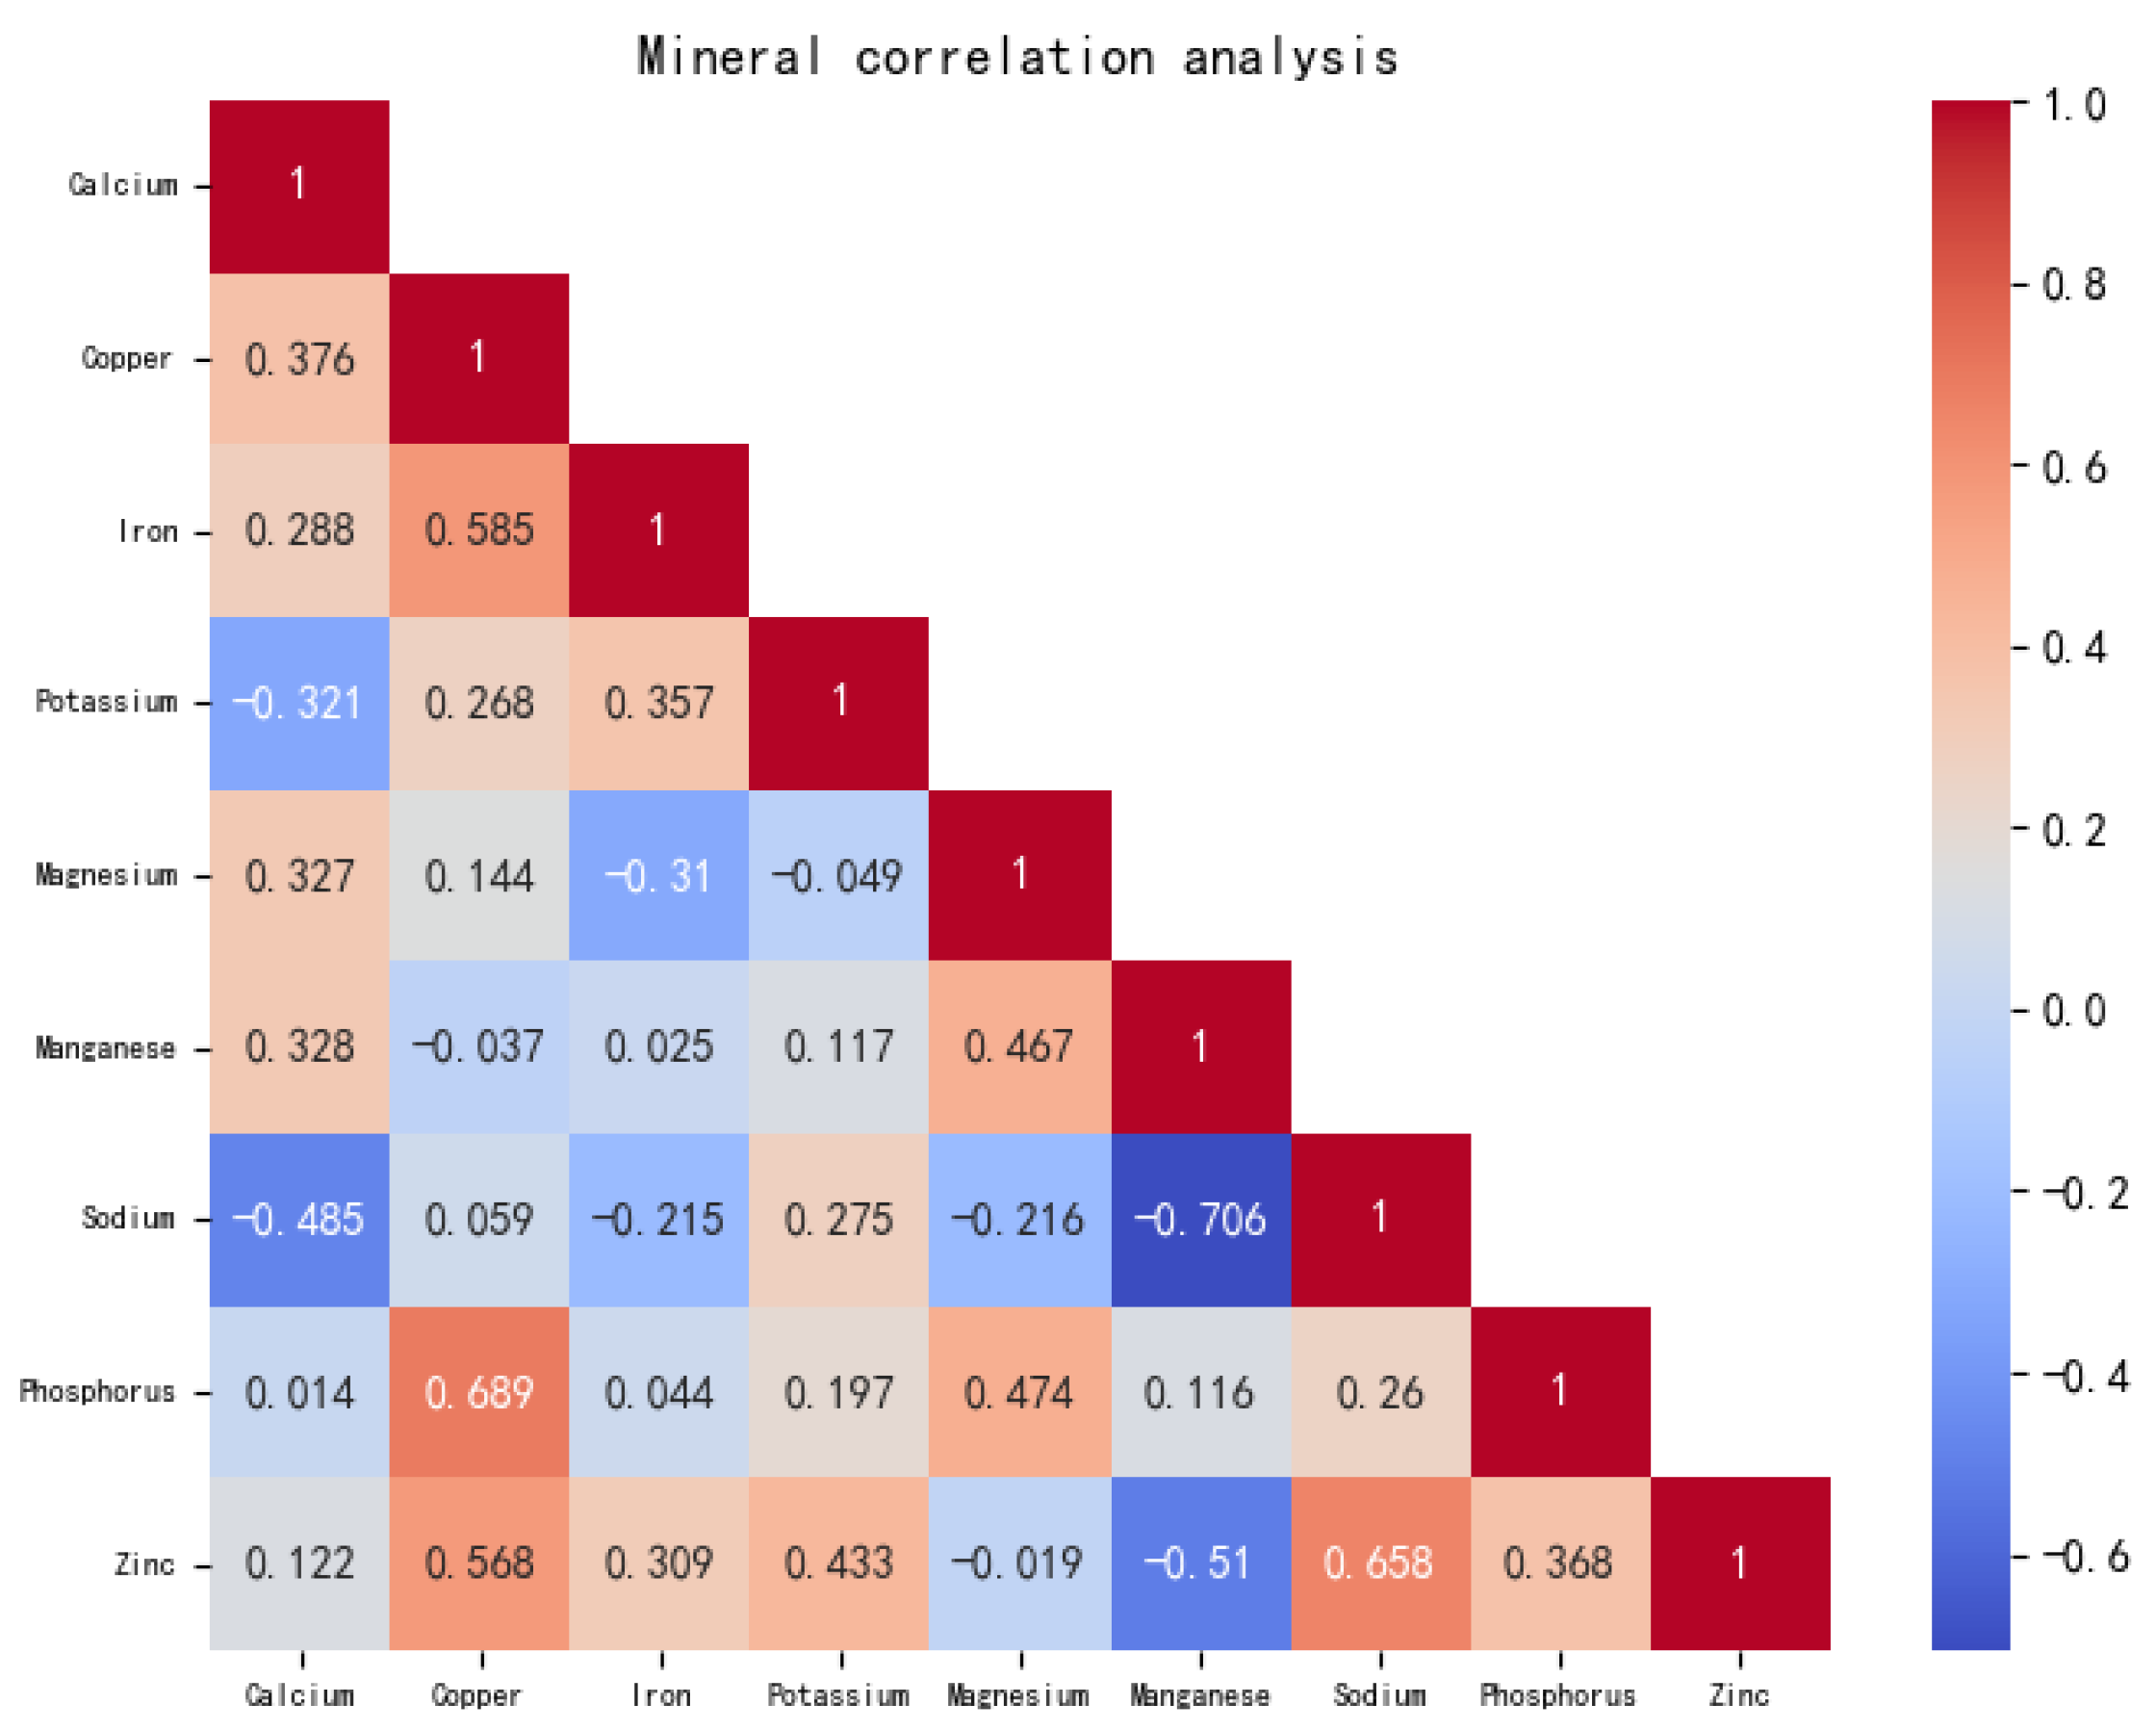
3.2. Comparative Analysis of Mineral Element Content
3.3. Comparative Analysis of Vitamin Content
3.4. Comparative Analysis of Phytosterol Composition and Content
3.5. Comparative Analysis of Guanine Content
3.6. Analysis of Fatty Acid Composition and Relative Content of Peanuts
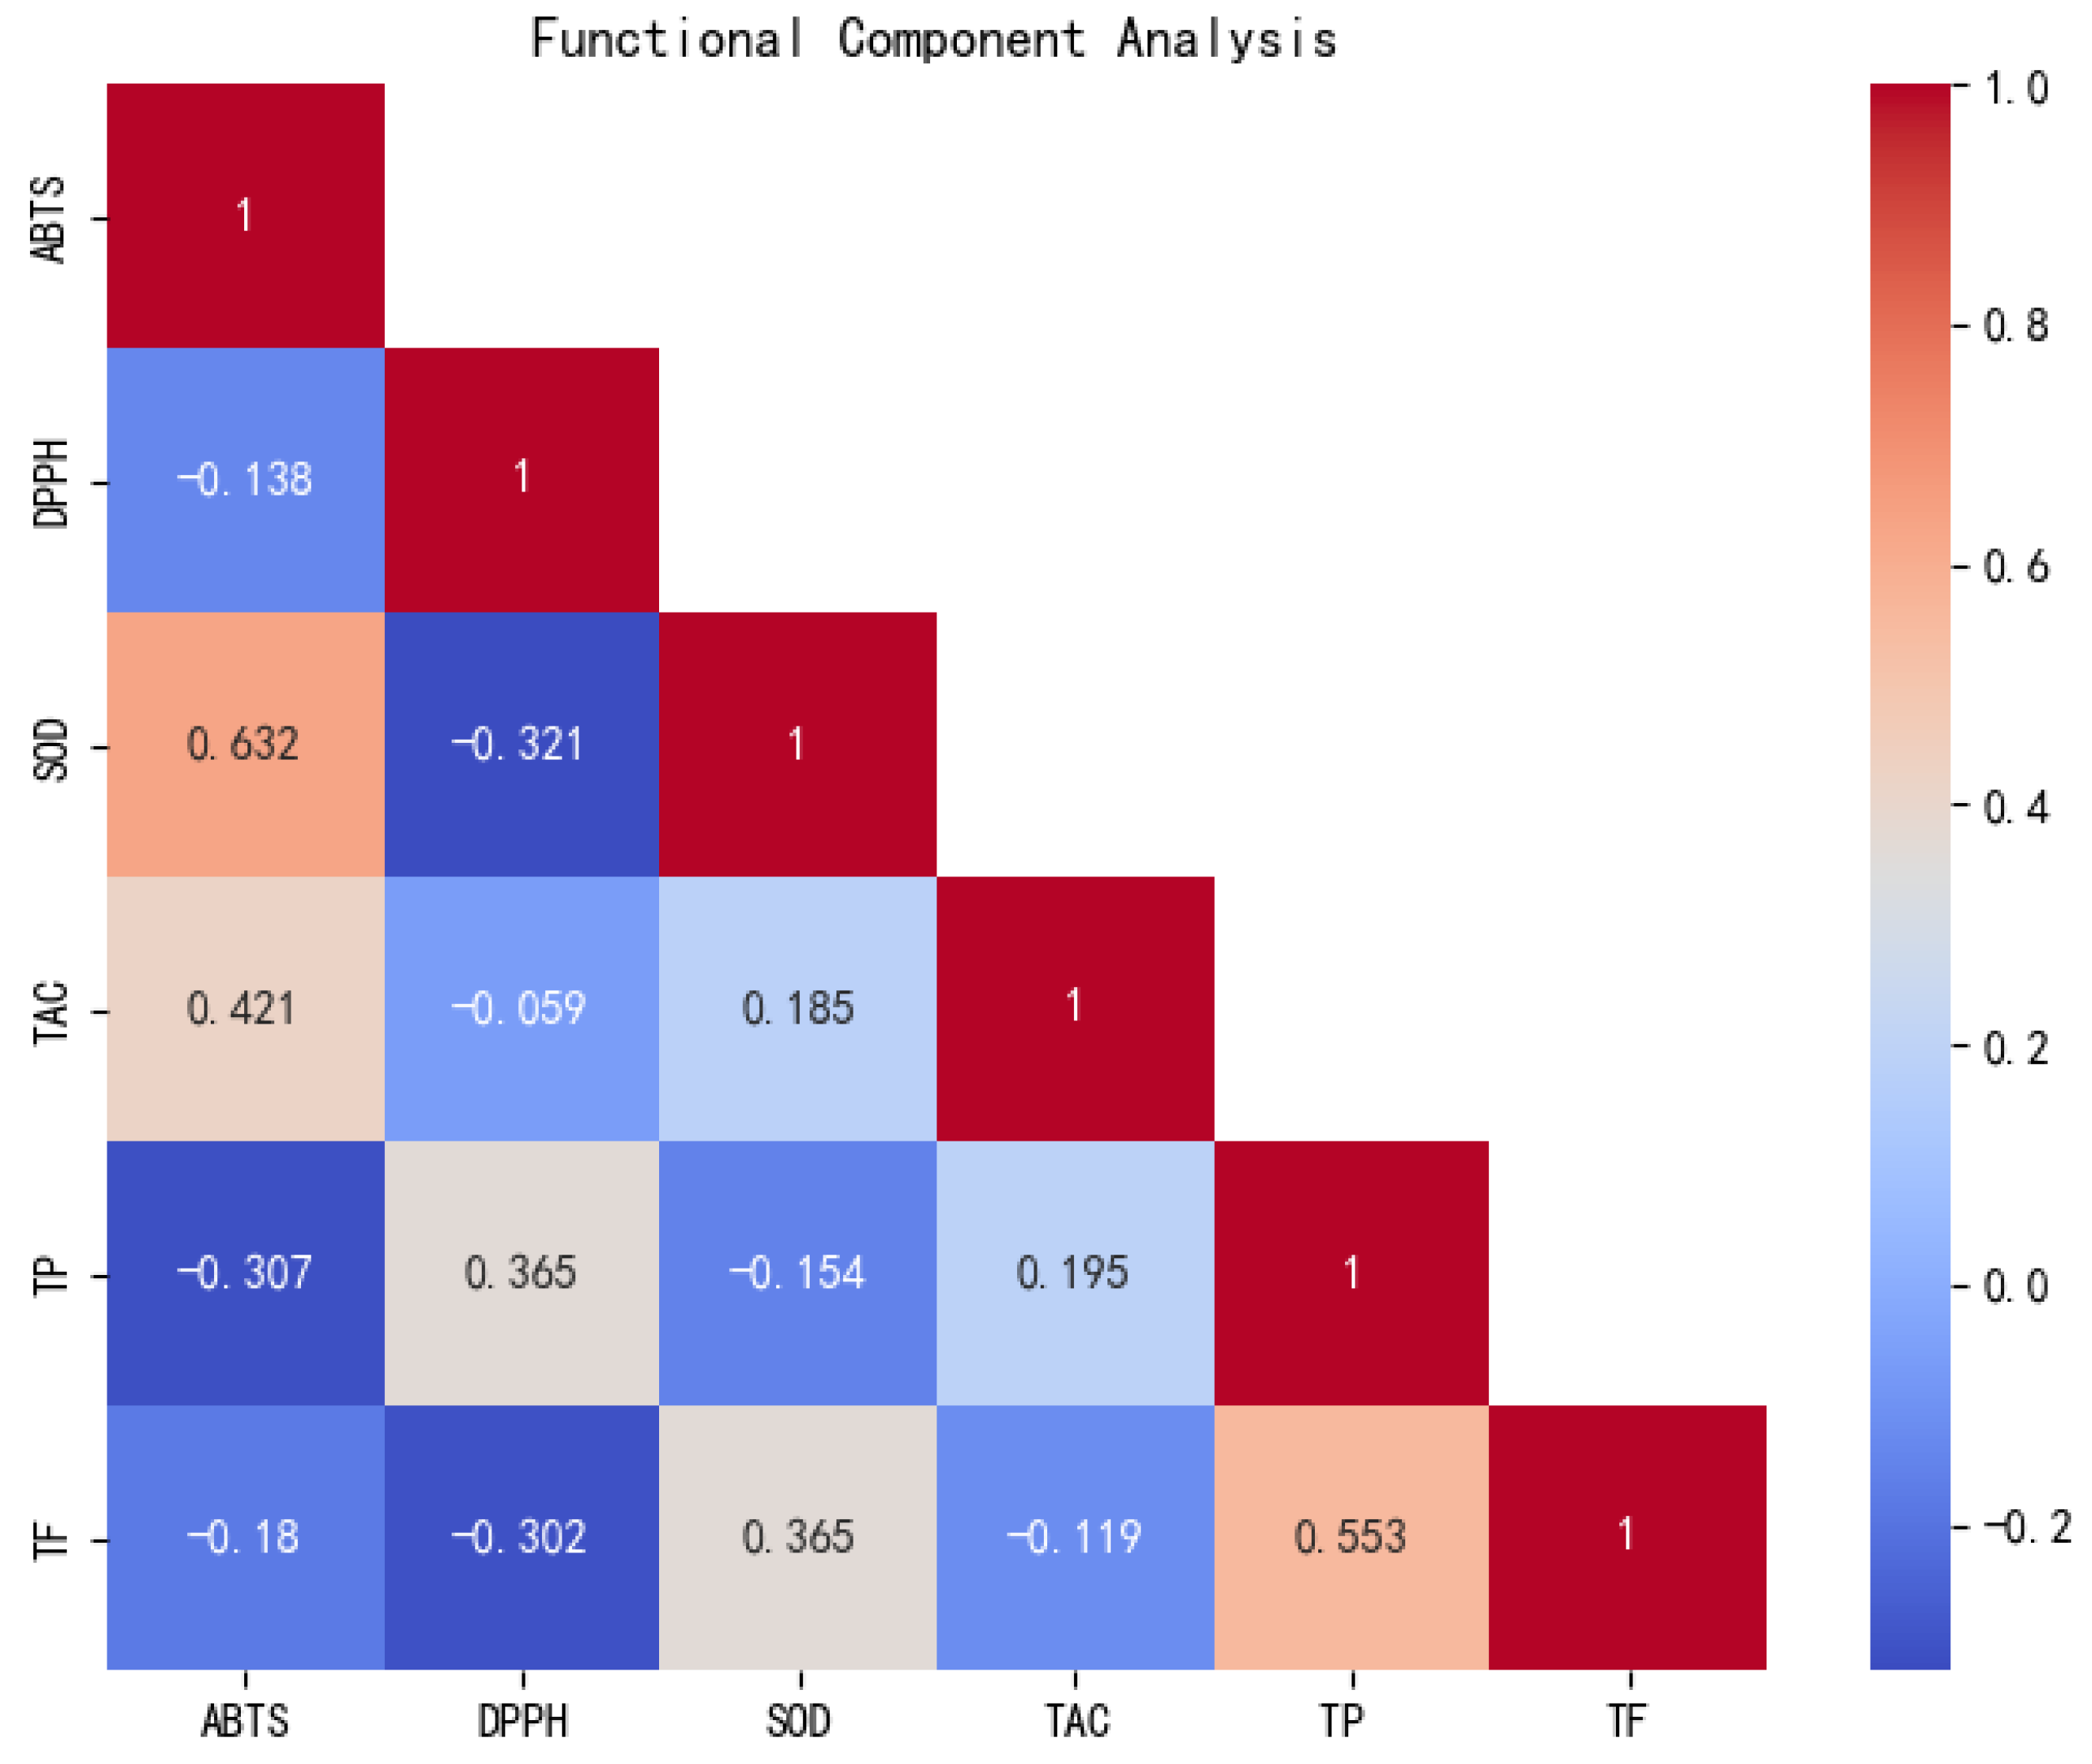
3.7. Analysis of the Relative Content of Functional Components of Peanuts
4. Conclusions
Author Contributions
Funding
Institutional Review Board Statement
Informed Consent Statement
Data Availability Statement
Conflicts of Interest
References
- Zhao, Z.; Chen, J.; Peng, E.; Li, R.; Wu, D. Research Progress on Soil Salinization and Management. China Rural. Water Hydropower 2023, 202–208. (In Chinese) [Google Scholar] [CrossRef]
- Zhu, J.; Feng, Q. Screening experiment of soil conditioner for direct seeding rice in saline-alkali soil. J. Zhejiang Agric. Sci. 2024, 65, 848–853. (In Chinese) [Google Scholar]
- Wen, S.; Ding, H.; Xu, Y.; Zhang, G.; Zhang, Z.; Dai, L. Physiological Response Characteristics of Peanut Varieties with Different Salt Resistance under NaCl Stress. Acta Bot.-Boreali-Occident. Sin. 2021, 41, 1535–1544. (In Chinese) [Google Scholar]
- Barrett-Lennard, E.G. Restoration of saline land through revegetation. Agric. Water Manag. 2002, 53, 213–226. [Google Scholar] [CrossRef]
- Ouyang, Z.; Wang, H.; Lai, J.; Wang, C.; Liu, Z.; Sun, Z.; Hou, R. New Approach of High-quality Agricultural Development in the Yellow River Delta. Bull. Chin. Acad. Sci. 2020, 35, 145–153. (In Chinese) [Google Scholar]
- Bian, L.; Wang, J.; Liu, J.; Han, B. Spatiotemporal changes of soil salinization in the Yellow River Delta of China from 2015 to 2019. Sustainability 2021, 13, 822. [Google Scholar] [CrossRef]
- Pei, Z.; Kong, Q.; Guo, D. Effect of succession of halophytic vegetation on soil microbial carbon metabolic activity. China Environ. Sci. 2017, 37, 373–380. (In Chinese) [Google Scholar]
- Zhang, T.; Chen, Y.; Liu, J. Characteristics of soil salinization in coastal wetlands based on canonical correspondence analysis. Acta Ecol. Sin. 2019, 39, 3322–3332. (In Chinese) [Google Scholar]
- Akhtar, S.; Khalid, N.; Ahmed, I.; Shahzad, A.; Suleria, H. Physicochemical characteristics, functional properties, and nutritional benefits of peanut oil: A review. Crit. Rev. Food Sci. Nutr. 2014, 54, 1562–1575. [Google Scholar] [CrossRef]
- Huang, F.; Liu, A.; Fang, M.; Wang, D.; Yu, L.; Ma, F.; Wang, X.; Zhang, L.; Li, P. Characteristic volatile flavors of high-oleic peanut oil and normal peanut oil. Microchem. J. 2024, 200, 110389. [Google Scholar] [CrossRef]
- Ma, Y.; Zhang, K.; Xu, C.; Lai, C.; Liu, Y.; Cao, Y.; Zhao, L. Contribution of lipid to the formation of characteristic volatile flavor of peanut oil. Food Chem. 2024, 442, 138496. [Google Scholar] [CrossRef] [PubMed]
- Łozowicka, B.; Kaczyński, P.; Iwaniuk, P.; Rutkowska, E.; Socha, K.; Orywal, K.; Farhan, J.A.; Perkowski, M. Nutritional compounds and risk assessment of mycotoxins in ecological and conventional nuts. Food Chem. 2024, 458, 140222. [Google Scholar] [CrossRef] [PubMed]
- Fritz, K.R.; Dean, L.L.; Hendrix, K.W.; Andres, R.J.; Newman, C.S.; Oakley, A.T.; Clevenger, J.P.; Dunne, J.C. Flavor quality and composition of accession resources in the North Carolina State University peanut breeding program. Crop Sci. 2022, 62, 1880–1890. [Google Scholar] [CrossRef]
- Li, X.; Xu, Z.; Cai, Y.; Guo, J.; Huang, L.; Ren, X.; Li, Z.; Chen, W.; Luo, H.; Zhou, X.; et al. Quantitative trait locus analysis for main quality traits in cultivated peanut (Arachis hypogaea L.). Chin. J. Oil Crop. Sci. 2016, 38, 415. (In Chinese) [Google Scholar]
- Liang, K.; Zhu, D.; Sun, J.; Qin, Y. Effects of Different Varieties and Years on Nutritional Quality of Peanut. Food Ind. 2017, 38, 149–151. (In Chinese) [Google Scholar]
- Lin, M.; Zhao, J.; Zheng, X.; Meng, F.; Huang, D.; Li, G.; Chen, X.; Song, G.; Jiang, L. Analysis of Nutrition, Sense and Quality of Peanut Seed with Different Testa Color. Mol. Plant Breed. 2019, 17, 1647–1657. (In Chinese) [Google Scholar]
- Misra, J.B.; Ghosh, P.K.; Dayal, D.; Mathur, R.S. Agronomic, nutritional and physical characteristics of some Indian groundnut cultivars. Indian J. Agric. Sci. 2013, 70, 741–746. [Google Scholar]
- Li, Y.; Liu, Y.; Hu, X.; Li, Y.; Liu, Y.; Sun, Q.; Sun, C.; Wang, X.; Liu, J. Oil Quality of Two High-Oil Peanut Cultivars. Food Res. Dev. 2022, 43, 147–155. (In Chinese) [Google Scholar]
- Luo, S.; Zhang, Y.; Zhang, T.; Dai, L.; Gao, J.; Wang, Q. Comparison of the Nutritional Composition of Peanuts Originating from Different Regions of Xinjiang for Processing. Mod. Food Sci. Technol. 2024, 40, 19–28. (In Chinese) [Google Scholar]
- Zhao, Y.; Yan, C.; Yang, L.; Ning, D.; Yang, X.; Yang, L.; Li, N. Effects of Different Mulching Patterns on Leaf Photosynthetic Characters and Quality Traits in Black Peanut. Acta Agric.-Boreali-Sin. 2018, 33, 117–121. (In Chinese) [Google Scholar]
- Xu, T.; Liu, Y.; Wang, H. Effects of different modifiers on growth characteristics and yield of peanut in saline alkali soil. Southwest China J. Agric. Sci. 2023, 36, 62–74. (In Chinese) [Google Scholar]
- Xue, Z.; Yang, Y.; Zhang, W.; Zhang, G. Effects of Salt Stress on the Quality of Fruits and Vegetables. Mod. Agric. Sci. Technol. 2017, 63–64. (In Chinese) [Google Scholar]
- Rehanguli·ABULA. Effect of soil salinity on agronomic traits and hay quality of alfalfa. Chin. Inf. 2020, 82. (In Chinese) [Google Scholar]
- Xu, T.; Wang, Z.; Ren, Z.; Wan, F.; Wang, M.; Chen, M.; Pan, L.; Wang, T.; Yu, S.; Chen, J.; et al. Study on Yield and Quality Characters of Peanut Varieties with High Oleic Acid in Saline and Alkaline Land. J. Peanut Sci. 2019, 48, 48–51. (In Chinese) [Google Scholar]
- Gao, H.; Zhang, J.; Wang, J.; Ci, D.; Yang, S.; Tang, Z.; Guo, F.; Liu, K.; Wan, S. Research Progress and Challenge of High-Yield Cultivation of Peanut in Saline-Alkali Lands. Shandong Agric. Sci. 2024, 56, 142–148. (In Chinese) [Google Scholar]
- Xian, J.; Wang, J. Effects of different cropping patterns of peanut on growth and soil properties in saline soils. Agric. Eng. Technol. 2022, 42, 31–32. (In Chinese) [Google Scholar]
- Ci, D.; Qin, F.; Tang, Z.; Zhang, G.; Zhang, J.; Si, T.; Yang, J.; Xu, Y.; Yu, T.; Xu, M.; et al. Arbuscular Mycorrhizal Fungi Restored the Saline–Alkali Soil and Promoted the Growth of Peanut Roots. Plants 2023, 12, 3426. [Google Scholar] [CrossRef]
- Qi, C.; Xin, Y. Simplification of the Determination Method of Total Ash in Food. Mod. Food 2021, 210–212. (In Chinese) [Google Scholar] [CrossRef]
- Luo, S.; Yuan, Y.; Zhang, J.; Lu, Z. Determination of the Action of Superoxide Dismutase in Health Foods; Ministry of Health of the People’s Republic of China and Standardization Administration of China: Beijing, China, 2003; pp. 410–417. [Google Scholar]
- Liang, K.; Zhu, D.; Sun, J.; Qin, Y. Effect of variety and origin factors on the nutritional quality of peanuts. Jiangsu Agric. Sci. 2017, 45, 73–76. (In Chinese) [Google Scholar]
- Wang, C.; Liu, Y.; Wu, Z.; Zheng, Y.; Wan, S.; Sun, K.; Sun, X.; Feng, H. Diversity and stability of peanut kernel quality in different ecological regions of Shandong Province. Chin. J.-Eco-Agric. 2008, 16, 1138–1142. (In Chinese) [Google Scholar] [CrossRef]
- Zhu, Z.; Li, X.; Yang, L.; Zhang, W.; Guo, H. Effects of Different Soil Types on Peanut Quality. Shandong Agric. Sci. 2015, 47, 67–70. (In Chinese) [Google Scholar]
- Huang, D.; Chen, Z.; Zhang, H. Effect of different soil types on the elemental content of nitrogen and ash in peanuts. J. Peanut Sci. 1978, 4, 12–15. (In Chinese) [Google Scholar]
- Dai, L.; Song, W.; Ding, H.; Wan, S.; Sun, K.; Zhao, D.; Zhang, Z. Soil water stress on mineral element content of peanut seed kernel. Ecol. Environ. Sci. 2011, 20, 869–874. (In Chinese) [Google Scholar]
- Jia, L.; Zhao, C.; Wang, Y.; Wang, M. Effects of different soil textures on the growth and distribution of root system and yield in peanut. Chin. J. Plant Ecol. 2013, 37, 684–690. (In Chinese) [Google Scholar] [CrossRef]
- Zhang, Z.; Lyu, F.; Xiao, Y.; Wang, R.; Lin, H.; Yuan, Z.; Wei, L.; Lyu, R. Effects of nitrogen fertilizer reduction under organic and inorganic fertilizers combination on yield and quality of peanut in red soil farmland. Soils Crop. 2022, 11, 417–427. (In Chinese) [Google Scholar]
- Zheng, Y. Effect of non-soil pH on crop growth. J. Yuxi Norm. Univ. 1994, 10, 64–67. (In Chinese) [Google Scholar]
- Wang, S.; Yan, C.; Yu, L.; Zhang, X.; Yan, D.; Yao, J. Comparative Analysis of Nutritional Components of Different Varieties of Peanut in Three Major Producing Areas of China. China Food Saf. Mag. 2024, 84–90. (In Chinese) [Google Scholar] [CrossRef]
- Zhang, J.; Wang, Q.; Liu, H.; Liu, L.; Wang, L. Comparative Analysis of Tocopherol and Phytosterol Composition of Peanut Cultivars from Different Regions. Food Sci. 2012, 33, 191–195. (In Chinese) [Google Scholar]
- Wang, Y.; Hu, X.; Gao, L.; Leng, Y.; Zhu, L.; Hu, L.; Zhong, W. Effects of Various Soil Types on Quality of Purple Flowering Stalk. Hubei Agric. Sci. 2014, 53, 1099–1102+1105. (In Chinese) [Google Scholar]
- Grosso, N.R.; Zygadlo, J.A.; Lamarque, A.L.; Maestri, D.M.; Guzmán, C.A. Proximate, fatty acid and sterol compositions of aboriginal peanut (Arachis hypogaea L.) seeds from Bolivia. J. Sci. Food Agric. 1997, 73, 349–356. [Google Scholar] [CrossRef]
- He, X.; Xu, H.; Long, J.; Chen, L.; Li, K. Progresses on Phytosterols in Plant Stress. Life Sci. Res. 2013, 17, 7. (In Chinese) [Google Scholar]
- Bajguz, A.; Hayat, S. Effects of brassinosteroids on the plant responses to environmental stresses. Plant Physiol. Biochem. 2009, 47, 1–8. [Google Scholar] [CrossRef] [PubMed]
- Peng, H. The Plant Sterols Components and Content of Several Common Nuts Analyzed by Gas Cheromatography. Cereals Oils 2006, 28–29. (In Chinese) [Google Scholar]
- Fei, M.; Han, J.; Liu, C.; Yang, Y. Use of Gas Chromatography for Determination of Phytosterols in Plant Oils. Chin. J. Food Hyg. 2006, 37, 197–201. (In Chinese) [Google Scholar]
- Qu, P. Analysis of the Effects of Salt Stress on the Agronomic Traits and Physiological and Biochemical Indicators of Peanuts. Mod. Food 2023, 29, 217–219. (In Chinese) [Google Scholar]
- Xu, Y.; Zhang, D.; Kang, T.; Wen, S.; Zhang, G.; Ding, H.; Guo, Q.; Qin, F.; Dai, L.; Zhang, Z. Effects of salt stress on ion dynamics and the relative expression level of salt tolerance genes in peanut seedlings. Acta Agron. Sin. 2023, 49, 2373–2384. (In Chinese) [Google Scholar]
- Giuffrè, A.M.; Tellah, S.; Capocasale, M.; Zappia, C.; Latati, M.; Badiani, M.; Ounane, S.M. Seed oil from ten Algerian peanut landraces for edible use and biodiesel production. J. Oleo Sci. 2016, 65, 9–22. [Google Scholar] [CrossRef]
- Kavera, B. Oil Quality Improvement in Groundnut (Arachis hypogaea L.) Through Induced Mutagenesis; University of Agricultural Science: Dharwad, India, 2008. [Google Scholar]
- Guo, J.; Zhang, B.; Wang, J.; Huang, G.; Zeng, X.; Bai, W.; Xie, Y.; Yang, J. Study on Nutrient Components of Different Peanut Varieties in Different Producing Areas in Guangdong Province. Sci. Technol. Food Ind. 2022, 439, 293–300. (In Chinese) [Google Scholar]
- Chi, X.; Hao, C.; Pan, L.; Chen, N.; Chen, M.; Wang, T.; Wang, M.; Yang, Z.; Liang, C.; Yu, S. Fatty Acid Accumulation Pattern in Different Types of Peanut. J. Peanut Sci. 2016, 45, 32–36. (In Chinese) [Google Scholar]
- Shi, Y.; Hu, X.; Miao, H.; Chen, J. Effects of Saline-Alkaline Stress on Quality of Peanut Fatty Acids. Shandong Agric. Sci. 2017, 49, 44–47. (In Chinese) [Google Scholar]
- Hu, X.; Miao, H.; Shi, Y.; Chen, J. Effect of saline and alkaline stress on the quality of peanuts. Chin. J. Oil Crop. Sci. 2013, 35, 346. (In Chinese) [Google Scholar]
- Li, G.; Guo, X.; Sun, Y.; Zhang, W.; Zhao, H.; Zhao, H.; Wang, X.; Fu, C.; Zhao, C. Flavonoid contents and antioxidant enzyme activities of different peanut cultivars under salt stress. Chin. J. Oil Crop. Sci. 2023, 45, 803–809. (In Chinese) [Google Scholar]
- Zhang, G.; Zhang, Z.; Ci, D.; Ding, H.; Yang, J.; Shi, X.; Tian, J.; Dai, L. Effects of Drought and Salt Stress on Osmotic Regulator and Antioxidase Activities. Acta Agric.-Boreali-Sin. 2018, 33, 176–181. (In Chinese) [Google Scholar]
- Xu, T.; Li, S.; Wang, H.; Dong, H.; Li, Q.; Liu, Y. Study on Growth and Physiological Characteristics of Peanut under Saline-alkali Stress. Acta Agric.-Boreali-Occident. Sin. 2023, 23, 866–877. (In Chinese) [Google Scholar]

| Assortment | Land Type | Sample Site | Salinity–Alkalinity |
|---|---|---|---|
| Yuhua 625 | saline soil | Maotuo Village, Lijin County, Dongying City, Shandong Province | 0.3% 0.5% |
| non-saline soil | Pingdu City, Shandong Province | 0 | |
| Yuhua 155 | saline soil | Maotuo Village, Lijin County, Dongying City, Shandong Province | 0.3% 0.5% |
| non-saline soil | Henan Academy of Agricultural Sciences | 0 | |
| Puhua 75 | saline soil | Maotuo Village, Lijin County, Dongying City, Shandong Province | 0.3% 0.5% |
| non-saline soil | Henan Puyang Academy of Agricultural Sciences | 0 | |
| Shanhua 155 | saline soil | Maotuo Village, Lijin County, Dongying City, Shandong Province | 0.3% 0.5% |
| non-saline soil | Shandong Agricultural University | 0 | |
| Zhonghua 155 | saline soil | Maotuo Village, Lijin County, Dongying City, Shandong Province | 0.3% 0.5% |
| non-saline soil | Wuhan Oil Institute | 0 |
| Assortment | Land Type | Water Content | Ash Content | Protein Content | Fat Content |
|---|---|---|---|---|---|
| Yuhua 625 | saline soil | 3.13 | 2.65 | 23.90 ± 0.06 | 42.12 ± 0.57 |
| non-saline soil | 3.02 | 2.56 | 24.41 ± 0.16 | 43.22 ± 1.70 | |
| Yuhua 155 | saline soil | 2.54 | 2.69 | 23.42 ± 0.01 | 47.18 ± 3.13 |
| non-saline soil | 3.27 | 2.65 | 21.44 ± 0.18 | 49.53 ± 2.09 | |
| Puhua 75 | saline soil | 2.82 | 2.69 | 23.33 ± 0.08 | 44.01 ± 4.79 |
| non-saline soil | 2.58 | 2.67 | 20.09 ± 0.11 | 45.60 ± 4.24 | |
| Shanhua 31 | saline soil | 2.57 | 2.59 | 19.15±0.06 | 50.68 ± 1.65 |
| non-saline soil | 3.63 | 2.39 | 24.82 ± 0.19 | 46.02 ± 1.58 | |
| Zhonghua 215 | saline soil | 1.98 | 2.72 | 20.03 ± 0.11 | 57.85 ± 2.95 |
| non-saline soil | 2.33 | 2.50 | 24.75 ± 0.09 | 55.60 ± 0.91 | |
| saline soil | 2.60 ± 0.42 | 2.67 ± 0.05 | 21.97 ± 2.20 | 48.37 ± 6.22 | |
| non-saline soil | 2.96 ± 0.52 | 2.55 ± 0.11 | 23.10 ± 2.19 | 47.99 ± 4.81 |
| Saline Normality | Non-Saline Normality | Average Value | Standard Deviation | t | p | z | |
|---|---|---|---|---|---|---|---|
| Water | 0.544 | 0.461 | −0.358 | 0.522 | −0.217 | 0.58 | - |
| Ash | 0.088 | 0.361 | 0.108 | 0.126 | 2.706 | 0.036 * | - |
| Fat | 0.736 | 0.753 | 0.446 | 3.153 | 0.447 | 0.665 | - |
| Protein | 0.005 * | 0.016 * | - | - | - | 0.114 | −1.58 b |
| Mineral | Land Type | Yuhua 625 | Yuhua 155 | Puhua 75 | Shanhua 31 | Zhonghua 215 | Average Value |
|---|---|---|---|---|---|---|---|
| saline soil | 640.1 ± 5.30 | 596.6 ± 0.99 | 910.0 ± 2.33 | 801.1 ± 0.85 | 820.6 ± 3.89 | 760.7 ± 136 | |
| Calcium | non-saline soil | 736.2 ± 0.49 | 555.7 ± 3.89 | 732.6 ± 2.12 | 855.8 ± 2.90 | 1253 ± 16.9 | 826.7 ± 261 |
| saline soil | 9.592 ± 0.02 | 13.36 ± 0.14 | 11.32 ± 0.06 | 11.17 ± 0.06 | 13.43 ± 0.13 | 11.77 ± 1.63 | |
| Copper | non-saline soil | 7.633 ± 0.08 | 13.15 ± 0.29 | 9.622 ± 0.07 | 10.23 ± 0.05 | 16.28 ± 0.04 | 11.38 ± 3.38 |
| saline soil | 24.36 ± 0.40 | 23.48 ± 0.37 | 20.48 ± 0.07 | 18.67 ± 0.04 | 22.80 ± 0.09 | 22.13 ± 2.44 | |
| Iron | non-saline soil | 20.33 ± 0.23 | 25.35 ± 0.26 | 24.39 ± 0.06 | 23.67 ± 0.05 | 28.86 ± 0.13 | 24.52 ± 3.07 |
| saline soil | 8735 ± 21.2 | 8889 ± 75.7 | 7528 ± 77.1 | 7943 ± 1.41 | 9319 ± 91.9 | 8482 ± 729 | |
| Potassium | non-saline soil | 7784 ± 10.6 | 8323 ± 112 | 9100 ± 41.0 | 7543 ± 4.95 | 8296 ± 26.2 | 8209 ± 599 |
| saline soil | 2144 ± 19.1 | 2161 ± 1.41 | 2178 ± 6.36 | 2535 ± 7.07 | 2527 ± 7.78 | 2309 ± 203 | |
| Magnesium | non-saline soil | 2275 ± 2.12 | 2233 ± 29.7 | 2207 ± 4.24 | 2398 ± 7.07 | 2300 ± 3.54 | 2282 ± 73.9 |
| saline soil | 9.44 ± 0.08 | 9.90 ± 0.07 | 11.64 ± 0.24 | 10.81 ± 0.01 | 22.80 ± 0.10 | 12.92 ± 5.59 | |
| Manganese | non-saline soil | 21.21 ± 0.11 | 12.96 ± 0.01 | 15.16 ± 0.05 | 15.72 ± 0.09 | 16.29 ± 0.06 | 16.27 ± 3.04 |
| saline soil | 530.2 ± 8.70 | 523.9 ± 1.63 | 288.4 ± 2.97 | 401.7 ± 5.09 | 239.9 ± 3.32 | 396.8 ± 132 | |
| Sodium | non-saline soil | 96.53 ± 0.05 | 196.2 ± 0.14 | 130.9 ± 1.20 | 117.7 ± 0.21 | 133.3 ± 0.14 | 134.9 ± 37 |
| saline soil | 4513 ± 26.9 | 4911 ± 31.9 | 4575 ± 14.9 | 4949 ± 19.1 | 5380 ± 14.1 | 4865 ± 347 | |
| Phosphorus | non-saline soil | 4403 ± 3.54 | 5076 ± 40.3 | 3918 ± 13.4 | 4435 ± 1.41 | 4891 ± 3.54 | 4544 ± 455 |
| saline soil | 39.18 ± 0.45 | 37.33 ± 0.42 | 36.07 ± 0.17 | 36.67 ± 0.06 | 37.02 ± 0.16 | 37.51 ± 0.97 | |
| Zinc | non-saline soil | 27.86 ± 0.25 | 33.74 ± 0.44 | 34.40 ± 0.01 | 33.30 ± 0.16 | 37.77 ± 0.23 | 33.41 ± 3.57 |
| Saline Normality | Non-Saline Normality | Average Value | Standard Deviation | t | p | z | |
|---|---|---|---|---|---|---|---|
| Calcium | 0.116 | 0.060 | −98.98 | 205.20012 | −1.525 | 0.162 | − |
| Copper | 0.065 | 0.196 | −0.387 | 1.83066 | 0.667 | 0.521 | − |
| Iron | 0.180 | 0.363 | −2.560 | 3.78072 | −2.141 | 0.061 | - |
| Potassium | 0.263 | 0.219 | 273.800 | 1003.38912 | 0.863 | 0.411 | - |
| Phosphorus | 0.112 | 0.209 | 320.500 | 320.89952 | 3.158 | 0.012 * | - |
| Zinc | 0.151 | 0.103 | 3.840 | 4.28053 | 2.837 | 0.020 * | - |
| Sodium | 0.046 * | 0.025 * | - | - | - | 0.005 ** | −2.803 b |
| Magnesium | 0.001 * | 0.168 | - | - | - | 0.646 | −0.459 b |
| Manganese | 0.000 * | 0.057 | - | - | - | 0.203 | −1.274 b |
| Assortment | Land Type | Vc | -VE | -VE | total-VE | VB3 | 5-formyl-tetrahydrofo Late | 5-methyl-tetrahydrofo Late |
|---|---|---|---|---|---|---|---|---|
| Yuhua 625 | saline soil | 8.13 ± 0.06 | 11.01 ± 1.01 | 5.30 ± 0.10 | 16.31 | 5.48 ± 0.01 | 4.98 ± 0.32 | 3.01 ± 0.18 |
| non-saline soil | 7.63 ± 0.00 | 11.34 ± 0.01 | 8.64 ± 1.12 | 19.98 | 4.98 ± 0.05 | 4.00 ± 0.64 | 2.53 ± 0.30 | |
| Yuhua 155 | saline soil | 8.66 ± 0.06 | 6.89 ± 0.96 | 5.99 ± 0.33 | 12.88 | 4.20 ± 0.07 | 3.52 ± 0.90 | 1.71 ± 0.05 |
| non-saline soil | 9.43 ± 0.11 | 5.80 ± 0.29 | 6.09 ± 0.13 | 11.88 | 4.30 ± 0.01 | 3.62 ± 0.83 | 2.44 ± 0.00 | |
| Puhua 75 | saline soil | 9.00 ± 0.06 | 13.46 ± 1.32 | 10.11 ± 0.26 | 23.57 | 4.20 ± 0.01 | 3.26 ± 0.91 | 3.58 ± 1.37 |
| non-saline soil | 7.29 ± 0.06 | 4.90 ± 0.31 | 2.72 ± 0.14 | 7.62 | 6.89 ± 0.04 | 3.50 ± 0.31 | 2.11 ± 0.20 | |
| Shanhua 31 | saline soil | 6.50 ± 0.00 | 28.01 ± 0.58 | 9.61 ± 1.10 | 37.61 | 4.73 ± 0.04 | 4.27 ± 0.51 | 2.57 ± 0.25 |
| non-saline soil | 6.17 ± 0.06 | 11.34 ± 0.03 | 6.50 ± 0.65 | 17.84 | 3.68 ± 0.08 | 5.05 ± 0.41 | 1.86 ± 0.20 | |
| Shanhua 215 | saline soil | 6.69 ± 0.06 | 25.48 ± 0.37 | 10.28 ± 0.42 | 35.76 | 5.33 ± 0.09 | 3.52 ± 0.10 | 3.25 ± 0.03 |
| non-saline soil | 6.96 ± 0.00 | 6.57 ± 0.57 | 5.08 ± 0.61 | 11.64 | 3.38 ± 0.01 | 3.02 ± 0.11 | 1.38 ± 0.25 | |
| saline soil | 7.79 ± 1.08 | 16.97 ± 8.77 | 8.26 ± 2.31 | 25.23 ± 11.17 | 4.79 ± 0.57 | 3.91 ± 0.81 | 2.82 ± 0.83 | |
| non-saline soil | 7.49 ± 1.14 | 7.99 ± 2.95 | 5.80 ± 2.09 | 13.79 ± 5.03 | 4.65 ± 1.32 | 3.84 ± 0.82 | 2.06 ± 0.47 |
| Saline Normality | Non-Saline Normality | Average Value | Standard Deviation | t | p | z | |
|---|---|---|---|---|---|---|---|
| total-VE | 0.382 | 0.619 | 11.434 | 12.12247 | 2.109 | 0.103 | - |
| 5-methyl-tetrahydrofolate | 0.487 | 0.853 | 0.4715 | 0.07492 | 1.99 | 0.078 | - |
| 5-formyl-tetrahydrofolate | 0.943 | 0.357 | 0.0745 | 0.68501 | 0.344 | 0.739 | - |
| -VE | 0.014 * | 0.764 | - | - | - | 0.93 | −1.682 b |
| -VE | 0.074 | 0.008 * | - | - | - | 0.013 * | −2.497 b |
| Vc | 0.033 * | 0.110 | - | - | - | 0.386 | -0.867 b |
| VB3 | 0.041 * | 0.045 * | - | - | - | 0.575 | −0.567 b |
| Assortment | Land Type | -Sitosterol | Stigmastero | Campesterol |
|---|---|---|---|---|
| Yuhua 625 | saline soil | 31.08 ± 1.76 | 5.91 ± 0.35 | 9.54 ± 0.79 |
| non-saline soil | 27.14 ± 0.97 | 4.74 ± 0.11 | 15.38 ± 1.44 | |
| Yuhua 155 | saline soil | 32.61 ± 1.43 | 3.38 ± 0.03 | 14.02 ± 0.62 |
| non-saline soil | 36.79 ± 1.59 | 6.03 ± 0.49 | 13.59 ± 0.71 | |
| Puhua 75 | saline soil | 30.45 ± 2.18 | 5.34 ± 0.24 | 12.87 ± 0.02 |
| non-saline soil | 17.91 ± 0.28 | 4.23 ± 0.05 | 41.23 ± 0.36 | |
| Shanhua 31 | saline soil | 42.74 ± 1.98 | 5.31 ± 0.18 | 12.60 ± 0.77 |
| non-saline soil | 27.26 ± 1.22 | 7.30 ± 0.64 | 22.65 ± 0.53 | |
| Shanhua 215 | saline soil | 52.01 ± 5.44 | 18.39 ± 0.79 | 42.42 ± 0.47 |
| non-saline soil | 75.03 ± 0.62 | 20.35 ± 0.64 | 40.62 ± 0.01 | |
| saline soil | 37.78 ± 9.12 | 7.67 ± 5.73 | 18.29 ± 12.82 | |
| non-saline soil | 36.82 ± 21.11 | 8.53 ± 6.34 | 26.69 ± 12.67 |
| -Sitosterol | Stigmasterol | Campesterol | |
|---|---|---|---|
| Saline normality | 0.078 | 0.000 * | 0.000 * |
| Non-saline normality | 0.005 * | 0.000 * | 0.011 * |
| z | −0.357 b | −1.785 b | −1.1886 b |
| p | 0.721 | 0.074 | 0.059 |
| Assortment | Land Type | Guanine |
|---|---|---|
| Yuhua 625 | saline soil | 0.24 |
| non-saline soil | 0.13 | |
| Yuhua 155 | saline soil | 0.25 |
| non-saline soil | 0.12 | |
| Puhua 75 | saline soil | 0.18 |
| non-saline soil | 0.25 | |
| Shanhua 155 | saline soil | 0.10 |
| non-saline soil | 0.04 | |
| Zhonghua 155 | saline soil | 0.22 |
| non-saline soil | 0.20 | |
| saline soil | 0.2 | |
| non-saline soil | 0.15 |
| Saline Normality | Non-Saline Normality | Average Value | Standard Deviation | t | p | |
|---|---|---|---|---|---|---|
| Guanine | 0.064 | 0.324 | 0.047 | 0.075 | 1.99 | 0.078 |
| Chemical Compound | Land Type | Yuhua 625 | Yuhua 155 | Puhua 75 | Shanhua 31 | Zhonghua 215 | Average Value |
|---|---|---|---|---|---|---|---|
| Myristic acid | saline soil | 0.02% | 0.02% | 0.02% | 0.02% | 0.02% | 0.02% |
| non-saline soil | 0.02% | 0.01% | 0.02% | 0.02% | 0.02% | 0.018% | |
| Palmitic acid | saline soil | 9.80% | 9.61% | 9.52% | 10.86% | 9.43% | 9.84% |
| non-saline soil | 8.96% | 8.90% | 9.91% | 11.36% | 9.63% | 9.75% | |
| Palmitoleic acid | saline soil | 0.10% | 0.10% | 0.10% | 0.04% | 0.16% | 0.10% |
| non-saline soil | 0.07% | 0.08% | 0.08% | 0.04% | 0.17% | 0.09% | |
| Seventeen carbonates | saline soil | 0.10% | 0.11% | 0.17% | 0.04% | 0.07% | 0.10% |
| non-saline soil | 0.11% | 0.12% | 0.10% | 0.05% | 0.32% | 0.14% | |
| Stearate | saline soil | 4.60% | 5.94% | 6.87% | 3.58% | 6.13% | 5.42% |
| non-saline soil | 5.21% | 6.40% | 6.00% | 4.08% | 8.61% | 6.06% | |
| Oleic acid | saline soil | 67.43% | 70.06% | 68.25% | 20.15% | 70.36% | 59.25% |
| non-saline soil | 70.43% | 71.22% | 66.50% | 20.69% | 70.56% | 59.88% | |
| Linoleic acid | saline soil | 9.18% | 6.43% | 5.83% | 60.55% | 5.19% | 17.44% |
| non-saline soil | 7.54% | 5.51% | 9.78% | 58.20% | 3.56% | 16.92% | |
| Linolenic acid | saline soil | 0.07% | 0.44% | 0.04% | 0.05% | 0.04% | 0.05% |
| non-saline soil | 0.05% | 0.04% | 0.04% | 0.04% | 0.03% | 0.04% | |
| Arachidonic acid | saline soil | 1.52% | 2.19% | 2.21% | 1.15% | 2.24% | 1.86% |
| non-saline soil | 1.61% | 2.41% | 2.15% | 1.47% | 0.72% | 1.67% | |
| Cis-11-Eicosate traenoic acid | saline soil | 2.14% | 1.41% | 1.70% | 0.57% | 1.58% | 1.48% |
| non-saline soil | 1.70% | 1.32% | 1.50% | 0.72% | 0.86% | 1.12% | |
| Cis,cis-11, cis-14- Eicosadienoic acid | saline soil | 0.05% | 0.00% | 0.03% | 0.02% | 0.01% | 0.02% |
| non-saline soil | 0.02% | ND | 0.01% | 0.02% | 0.01% | 0.02% | |
| Wasabiic acid | saline soil | 2.86% | 2.57% | 3.41% | 1.98% | 2.96% | 2.76% |
| non-saline soil | 2.52% | 2.48% | 2.63% | 2.26% | 3.46% | 2.67% | |
| Erucic acid | saline soil | 0.15% | 0.07% | 0.10% | 0.01% | 0.08% | 0.08% |
| non-saline soil | 0.10% | 0.07% | 0.06% | 0.01% | 0.08% | 0.06% | |
| 23-carbonate | saline soil | 0.04% | 0.03% | 0.04% | 0.02% | 0.03% | 0.03% |
| non-saline soil | 0.04% | 0.03% | 0.04% | 0.02% | 0.05% | 0.04% | |
| Lignocaine | saline soil | 1.94% | 1.41% | 1.72% | 0.95% | 1.70% | 1.54% |
| non-saline soil | 1.63% | 1.41% | 1.17% | 1.02% | 1.94% | 1.43% | |
| Oil substitution | saline soil | 7.34% | 10.90% | 6.80% | 0.33% | 19.83% | 8.77% |
| non-saline soil | 9.34% | 12.92% | 11.71% | 0.36% | 13.57% | 9.85% |
| Chemical Compound | Land Type | Yuhua 625 | Yuhua 155 | Puhua 75 | Shanhua 31 | Zhonghua 215 | Average Value |
|---|---|---|---|---|---|---|---|
| monounsaturated fatty acid | saline soil | 67.68% | 70.23% | 68.45% | 20.19% | 70.61% | 59.43% |
| non-saline soil | 70.61% | 71.31% | 66.65% | 20.74% | 70.81% | 60.02% | |
| polyunsaturated fatty acid | saline soil | 11.45% | 7.88% | 7.60% | 61.20% | 6.81% | 18.99% |
| non-saline soil | 9.31% | 6.87% | 11.33% | 58.91% | 4.55% | 18.19% | |
| unsaturated fatty acid | saline soil | 79.13% | 78.11% | 76.05% | 81.39% | 77.42% | 78.42% |
| non-saline soil | 79.92% | 78.24% | 77.98% | 79.71% | 75.26% | 78.22% | |
| saturated fatty acid (SFA) | saline soil | 20.87% | 21.89% | 23.95% | 18.61% | 22.58% | 21.58% |
| non-saline soil | 20.08% | 21.76% | 22.02% | 20.29% | 22.74% | 21.38% | |
| MUFA/PUFA | saline soil | 5.91 | 8.91 | 9.01 | 0.33 | 10.37 | 6.91 |
| non-saline soil | 7.58 | 10.38 | 5.88 | 0.35 | 15.56 | 7.95 |
| Saline Normality | Non-Saline Normality | Average Value | Standard Deviation | t | p | z | |
|---|---|---|---|---|---|---|---|
| Myristic acid | 0.440 | 0.846 | 0.0183 | 0.00484 | 1.195 | 0.263 | - |
| Palmitic acid | 0.423 | 0.493 | 0.4790 | 0.86518 | 0.175 | 0.865 | - |
| Cis-11-Eicosatetraenoic acid | 0.214 | 0.198 | 0.2642 | 0.32590 | 2.564 | 0.030 * | - |
| Cis-11,14-Eicosadienoic acid | 0.104 | 0.573 | 0.0105 | 0.14988 | 2.213 | 0.054 | - |
| Stearic acid | 0.186 | 0.230 | −0.6559 | 1.16368 | −1.782 | 0.108 | - |
| Erucic acid | 0.315 | 0.295 | 0.1781 | 0.02802 | 2.010 | 0.075 | - |
| 23-carbonate | 0.115 | 0.320 | −0.0028 | 0.00740 | −1.182 | 0.267 | - |
| Lignocaine | 0.161 | 0.371 | 0.1121 | 0.30739 | 1.153 | 0.279 | - |
| Palmitoleic acid | 0.384 | 0.043 * | - | - | - | 0.037 * | −2.090 b |
| Seventeen carbonates | 0.271 | 0.003 * | - | - | - | 0.203 | −1.274 b |
| Oleic acid | 0.000 * | 0.000 * | - | - | - | 0.114 | −1.580 b |
| Linoleic acid | 0.000 * | 0.000 * | - | - | - | 0.386 | −0.866 b |
| Linolenic acid | 0.016 * | 0.722 | - | - | - | 0.022 * | −2.293 b |
| Arachidonic acid | 0.016 * | 0.637 | - | - | - | 0.646 | −0.459 b |
| Wasabiic acid | 0.192 | 0.014 * | - | - | - | 0.575 | −0.561 b |
| Assortment | Land Type | Total Phenol | Total Flavonoids | SOD | DPPH | ABTS | Total Antioxidant Capacity |
|---|---|---|---|---|---|---|---|
| Yuhua 625 | saline soil | 212.82 ± 1.87 | 592.31 ± 5.57 | 1697 ± 139 | 189.69 ± 6.01 | 92.28 ± 0.76 | 37.60 ± 1.54 |
| non-saline soil | 166.70 ± 6.36 | 501.61 ± 5.43 | 1288 ± 79.5 | 192.69 ± 2.67 | 87.82 ± 6.48 | 34.47 ± 3.82 | |
| Yuhua 155 | saline soil | 246.59 ± 1.33 | 743.90 ± 4.45 | 1779 ± 368 | 274.47 ± 2.32 | 94.10 ± 0.06 | 35.15 ± 3.58 |
| non-saline soil | 264.98 ± 3.37 | 419.44 ± 0.06 | 1493 ± 215 | 271.20 ± 3.56 | 94.10 ± 0.18 | 52.97 ± 3.93 | |
| Puhua 75 | saline soil | 152.51 ± 2.05 | 158.66 ± 2.35 | 1308 ± 177 | 272.14 ± 0.74 | 91.37 ± 1.69 | 31.58 ± 1.03 |
| non-saline soil | 210.73 ± 6.88 | 296.85 ± 5.20 | 1070 ± 109 | 262.61 ± 5.28 | 94.67 ± 0.06 | 56.59 ± 2.57 | |
| Shanhua 31 | saline soil | 183.51 ± 6.92 | 288.11 ± 4.46 | 1124 ± 310 | 280.56 ± 4.90 | 91.55 ± 1.43 | 28.70 ± 7.93 |
| non-saline soil | 252.30 ± 0.75 | 420.88 ± 1.37 | 660 ± 158 | 283.36 ± 0.30 | 92.90 ± 1.40 | 32.39 ± 9.34 | |
| Zhonghua 215 | saline soil | 267.22 ± 4.86 | 604.11 ± 6.63 | 689 ± 33.2 | 271.61 ± 1.87 | 51.49 ± 7.17 | 28.49 ± 9.00 |
| non-saline soil | 228.11 ± 2.03 | 386.69 ± 0.38 | 660 ± 35.3 | 270.87 ± 1.13 | 59.04 ± 5.01 | 30.98 ± 4.50 | |
| saline soil | 212.53 ± 46.36 | 477.42 ± 243.8 | 1319 ± 444 | 257.69 ± 38.18 | 84.16 ± 18.29 | 32.30 ± 4.01 | |
| non-saline soil | 224.56 ± 38.58 | 405.09 ± 73.87 | 1034 ± 373 | 256.12 ± 36.24 | 85.71 ± 15.15 | 41.48 ± 12.27 |
| Saline Normality | Non-Saline Normality | Average Value | Standard Deviation | t | p | z | |
|---|---|---|---|---|---|---|---|
| Total phenol | 0.435 | 0.342 | −12.0320 | 50.48858 | −0.754 | 0.470 | - |
| Total flavonoids | 0.064 | 0.215 | 73.3890 | 195.11871 | 1.173 | 0.271 | - |
| Total antioxidant capacity | 0.712 | 0.231 | −9.1760 | 11.12894 | −2.607 | 0.028 * | - |
| SOD | 0.089 | 0.274 | 285.3090 | 273.72506 | 4.661 | 0.000 ** | - |
| ABTS | 0.000 * | 0.000 * | - | - | - | 0.386 | −0.868 b |
| DPPH | 0.000 * | 0.001 * | - | - | - | 0.386 | −0.866 b |
Disclaimer/Publisher’s Note: The statements, opinions and data contained in all publications are solely those of the individual author(s) and contributor(s) and not of MDPI and/or the editor(s). MDPI and/or the editor(s) disclaim responsibility for any injury to people or property resulting from any ideas, methods, instructions or products referred to in the content. |
© 2024 by the authors. Licensee MDPI, Basel, Switzerland. This article is an open access article distributed under the terms and conditions of the Creative Commons Attribution (CC BY) license (https://creativecommons.org/licenses/by/4.0/).
Share and Cite
Zhang, Y.; Li, Y.; Ren, X.; Gao, J.; Wang, Y.; Zhu, D. Comparative Study on the Nutritional Quality of Peanut in Saline and Non-Saline Land. Foods 2024, 13, 3751. https://doi.org/10.3390/foods13233751
Zhang Y, Li Y, Ren X, Gao J, Wang Y, Zhu D. Comparative Study on the Nutritional Quality of Peanut in Saline and Non-Saline Land. Foods. 2024; 13(23):3751. https://doi.org/10.3390/foods13233751
Chicago/Turabian StyleZhang, Yimin, Yanmi Li, Xiao Ren, Jieying Gao, Yuchen Wang, and Dazhou Zhu. 2024. "Comparative Study on the Nutritional Quality of Peanut in Saline and Non-Saline Land" Foods 13, no. 23: 3751. https://doi.org/10.3390/foods13233751
APA StyleZhang, Y., Li, Y., Ren, X., Gao, J., Wang, Y., & Zhu, D. (2024). Comparative Study on the Nutritional Quality of Peanut in Saline and Non-Saline Land. Foods, 13(23), 3751. https://doi.org/10.3390/foods13233751