
Detection of Anthocyanins in Potatoes Using Micro-Hyperspectral Images Based on Convolutional Neural Networks


Abstract
1. Introduction
- (1)
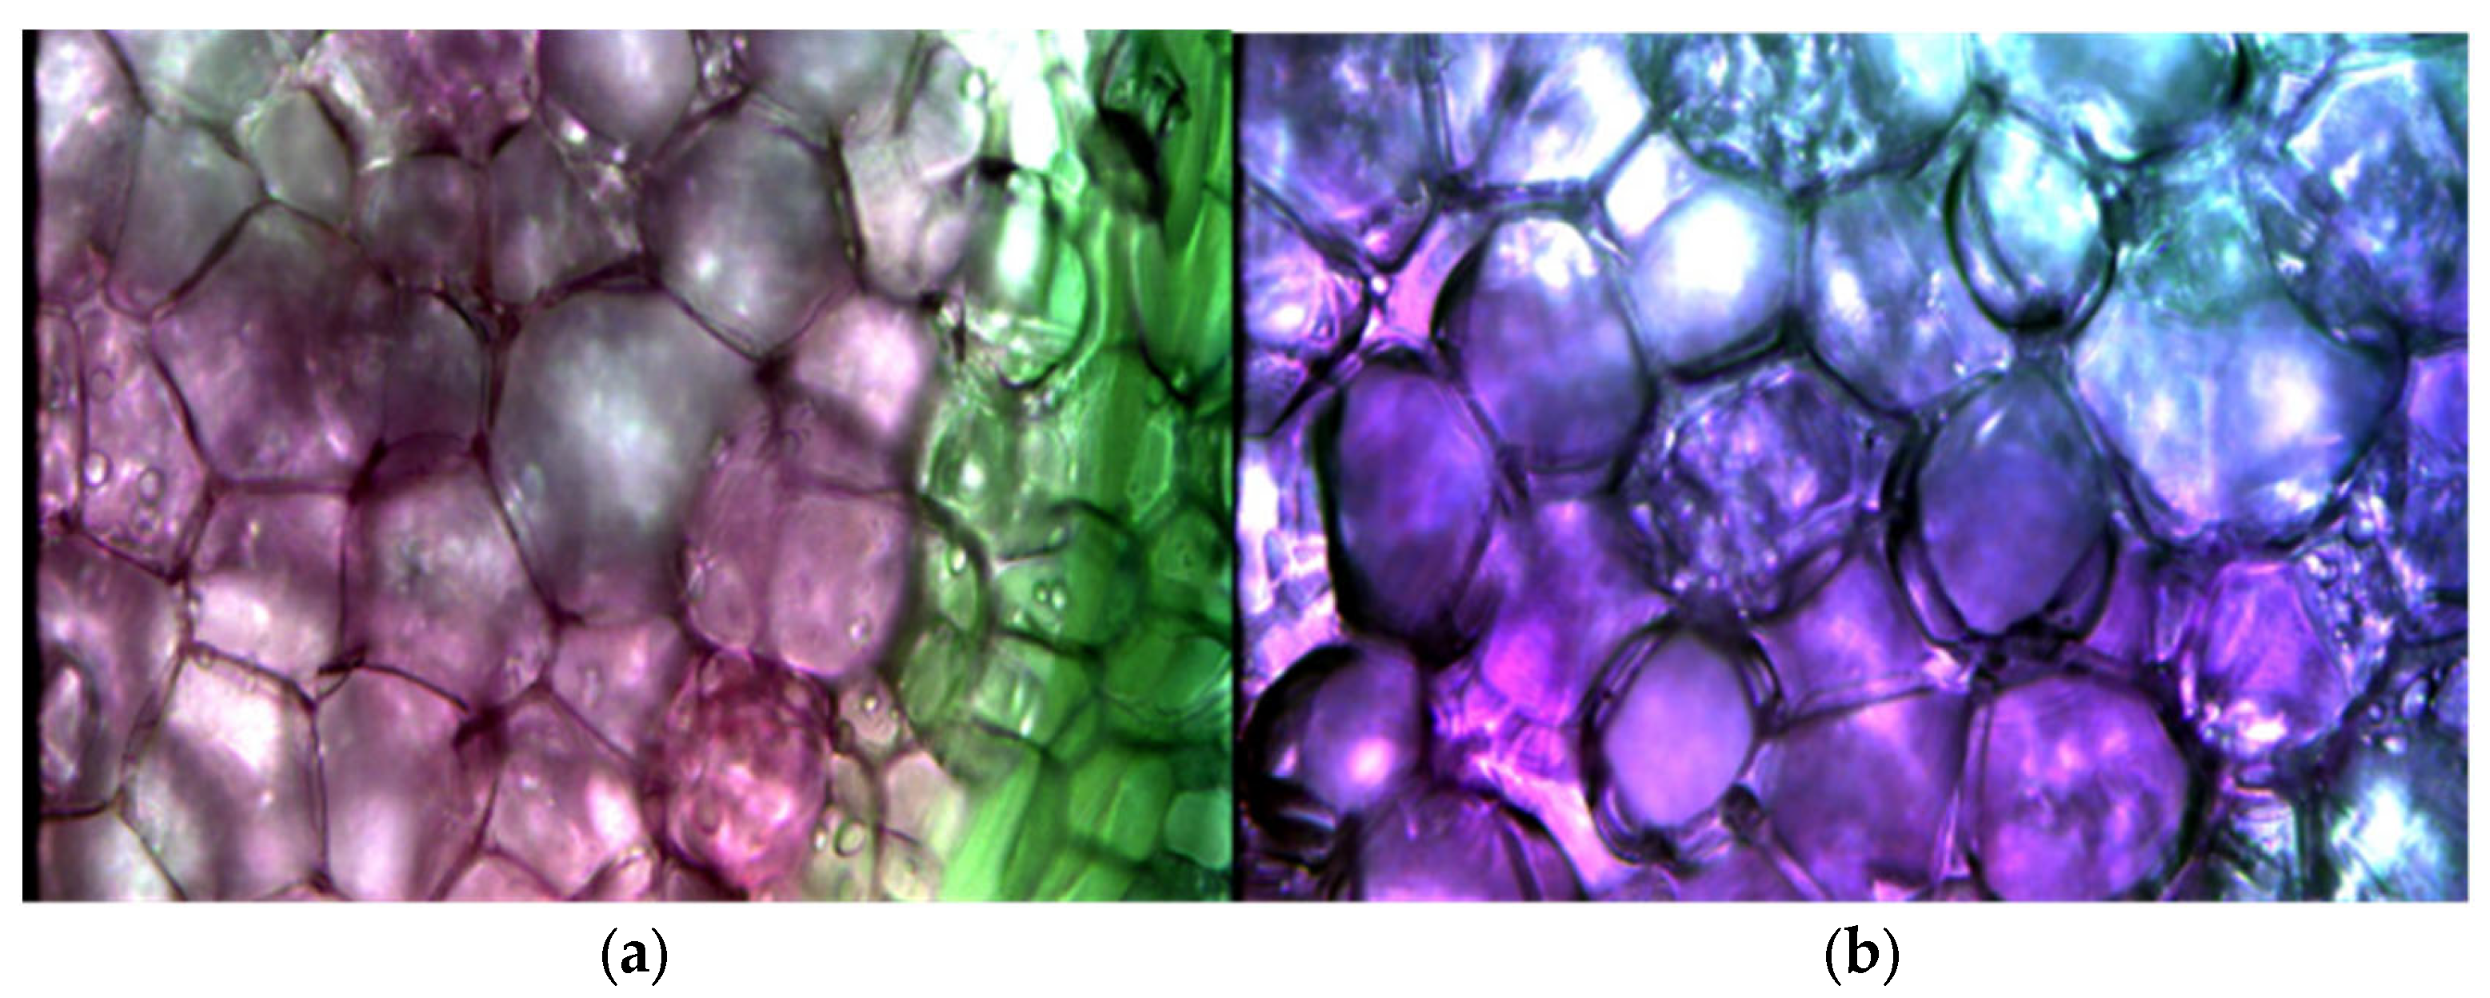
- To obtain spectral information on the microstructures of different parts of potatoes.
- (2)
- To build a model based on the CNN, conforming to the characteristics of the spectral data.
- (3)
- To construct a convolutional neural network and partial least regression prediction model of potato anthocyanins based on the original spectrum, pre-process the spectrum and characteristic spectrum variables and obtain the optimal prediction model through comparative analysis.
2. Materials and Methods
2.1. Preparation of Experimental Samples
2.2. Hyperspectral Image Acquisition
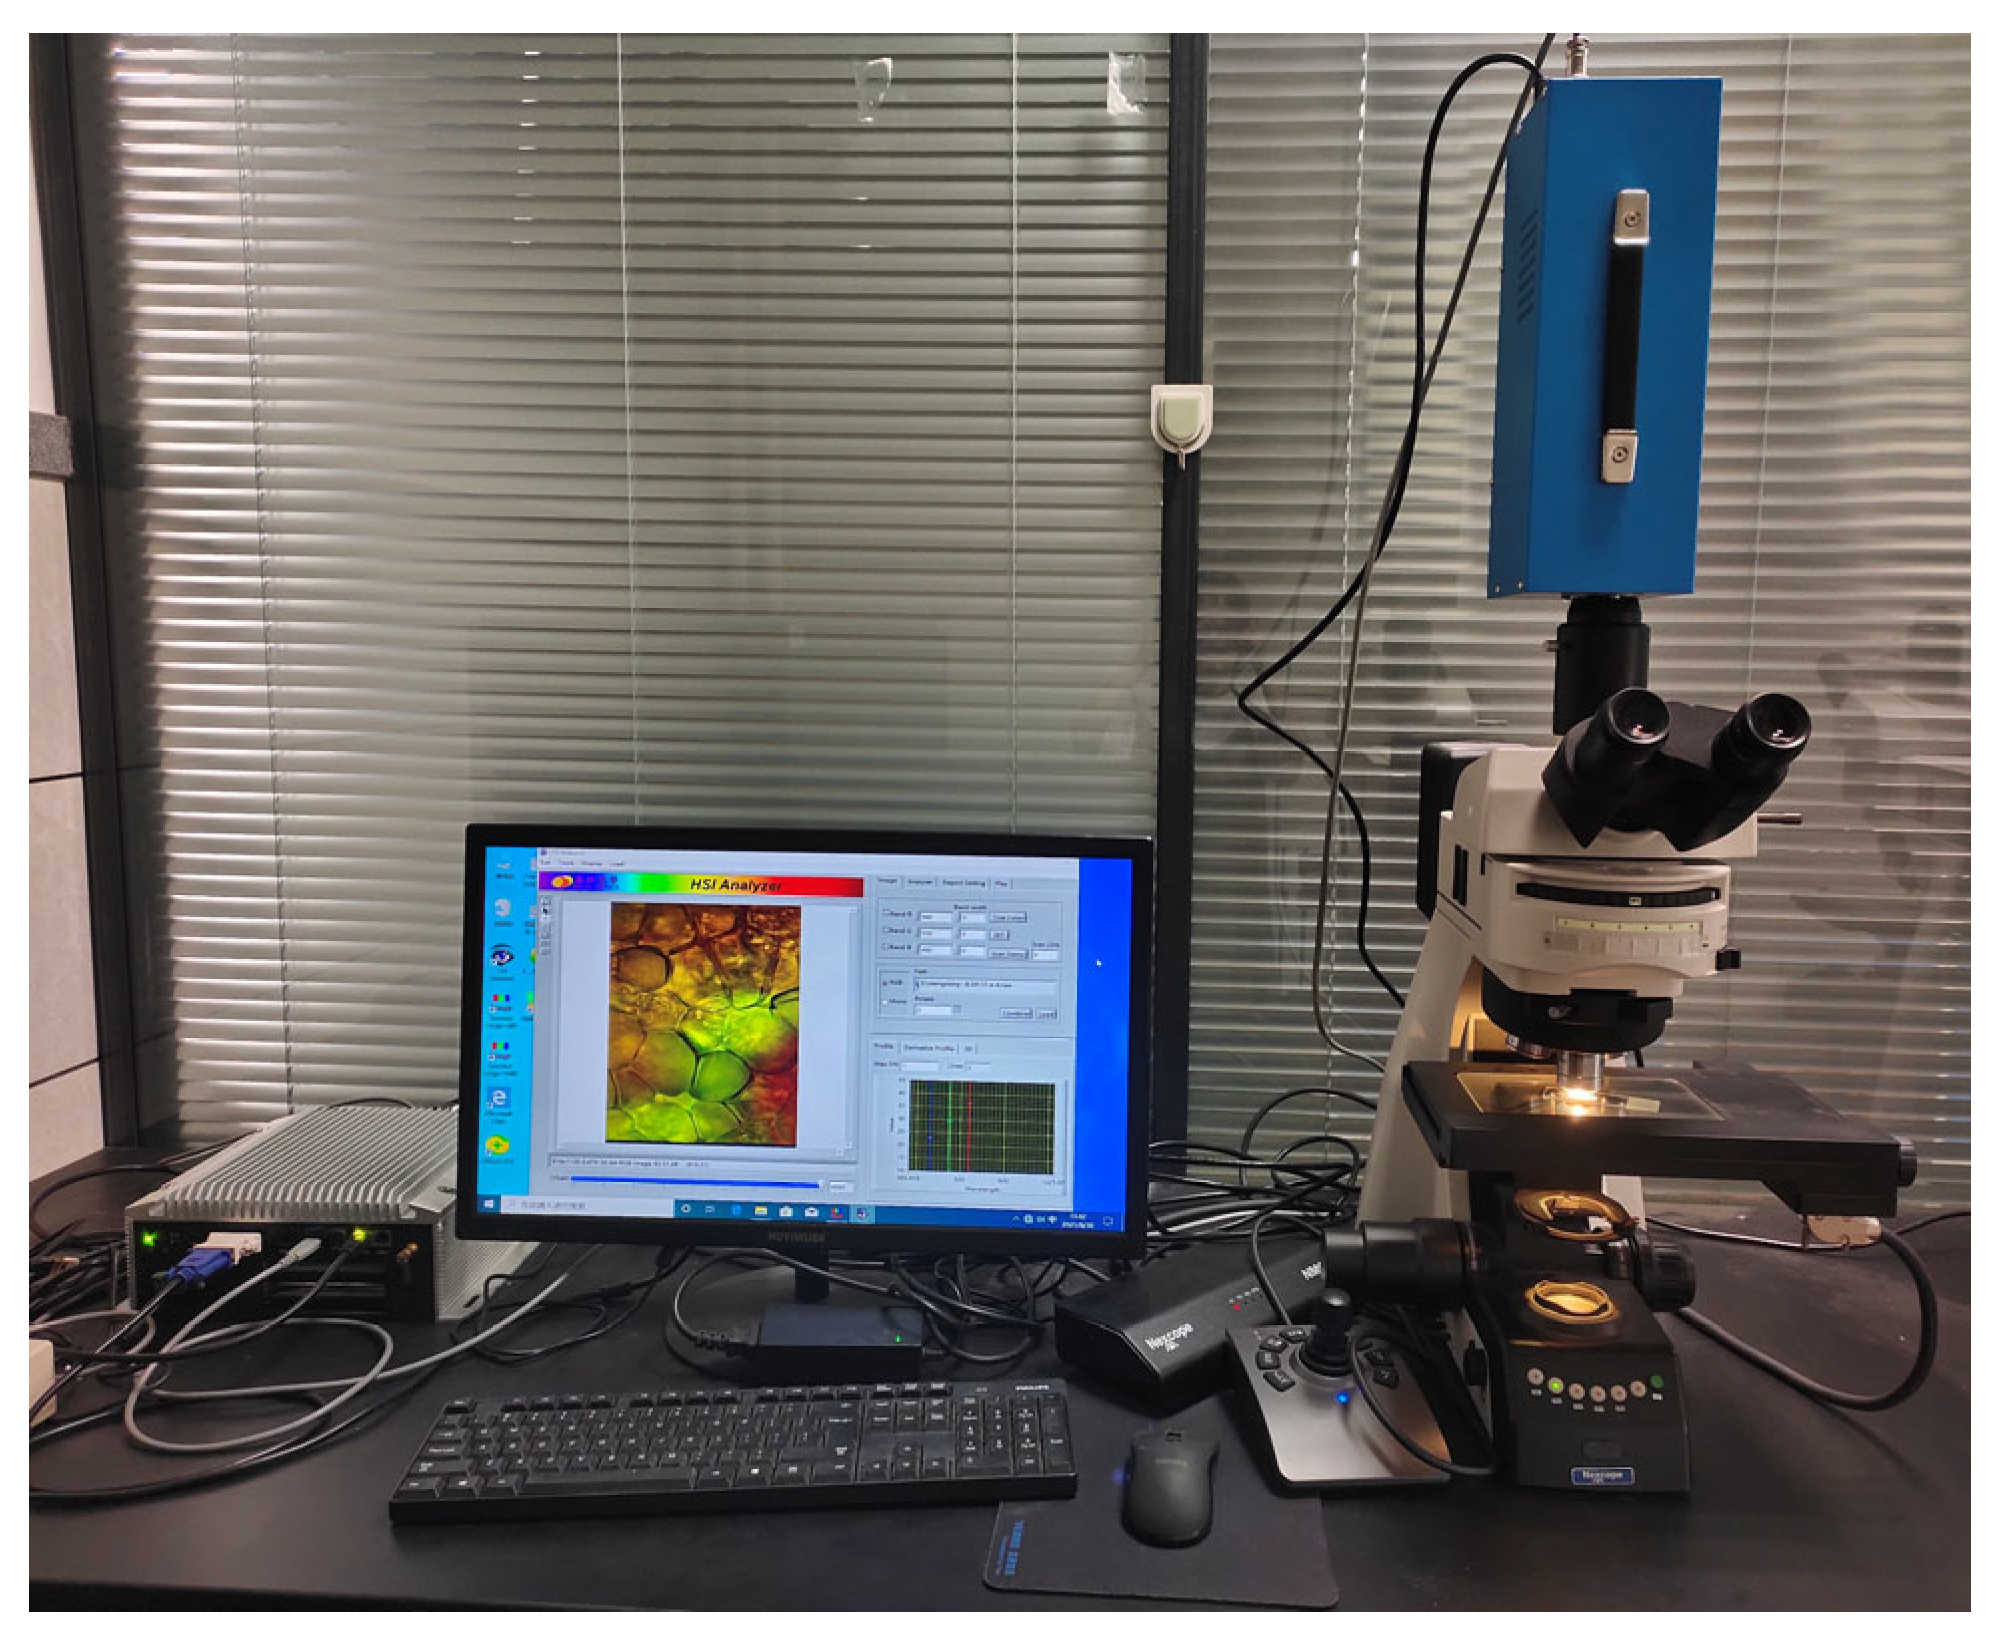
2.2.1. Microscopic Hyperspectral Imaging System
2.2.2. Micro-Hyperspectral Data Acquisition
- (1)
- Before collecting the micro-high-resolution spectral images, the instrument and equipment were maintained open for 30 min to ensure that the light source irradiation intensity was stable. This study used the transmitted light source.
- (2)
- The potato slices were fixed on a microscope carrier table.
- (3)
- The image collection software Hyperspec was opened; the carrier table was initialized, and preliminary focusing was attained; the eye mirror adjustment focal length was observed to make the image clear; the image of the image was avoided; and the strength of the light source was adjusted until the sample reached a reasonable light source exposure value.
- (4)
- The collection parameters were set in Hyperspec software. The specific parameters are listed in Table 1.
- (5)
- The software was then executed, and the instrument was scanned until the image collection was completed. This process was repeated to collect all samples.
2.2.3. Micro-Hyperspectral Image Correction
2.3. Experimental Methods
2.3.1. Determination of Anthocyanin Content
2.3.2. Extraction of Microscopic Hyperspectral Data
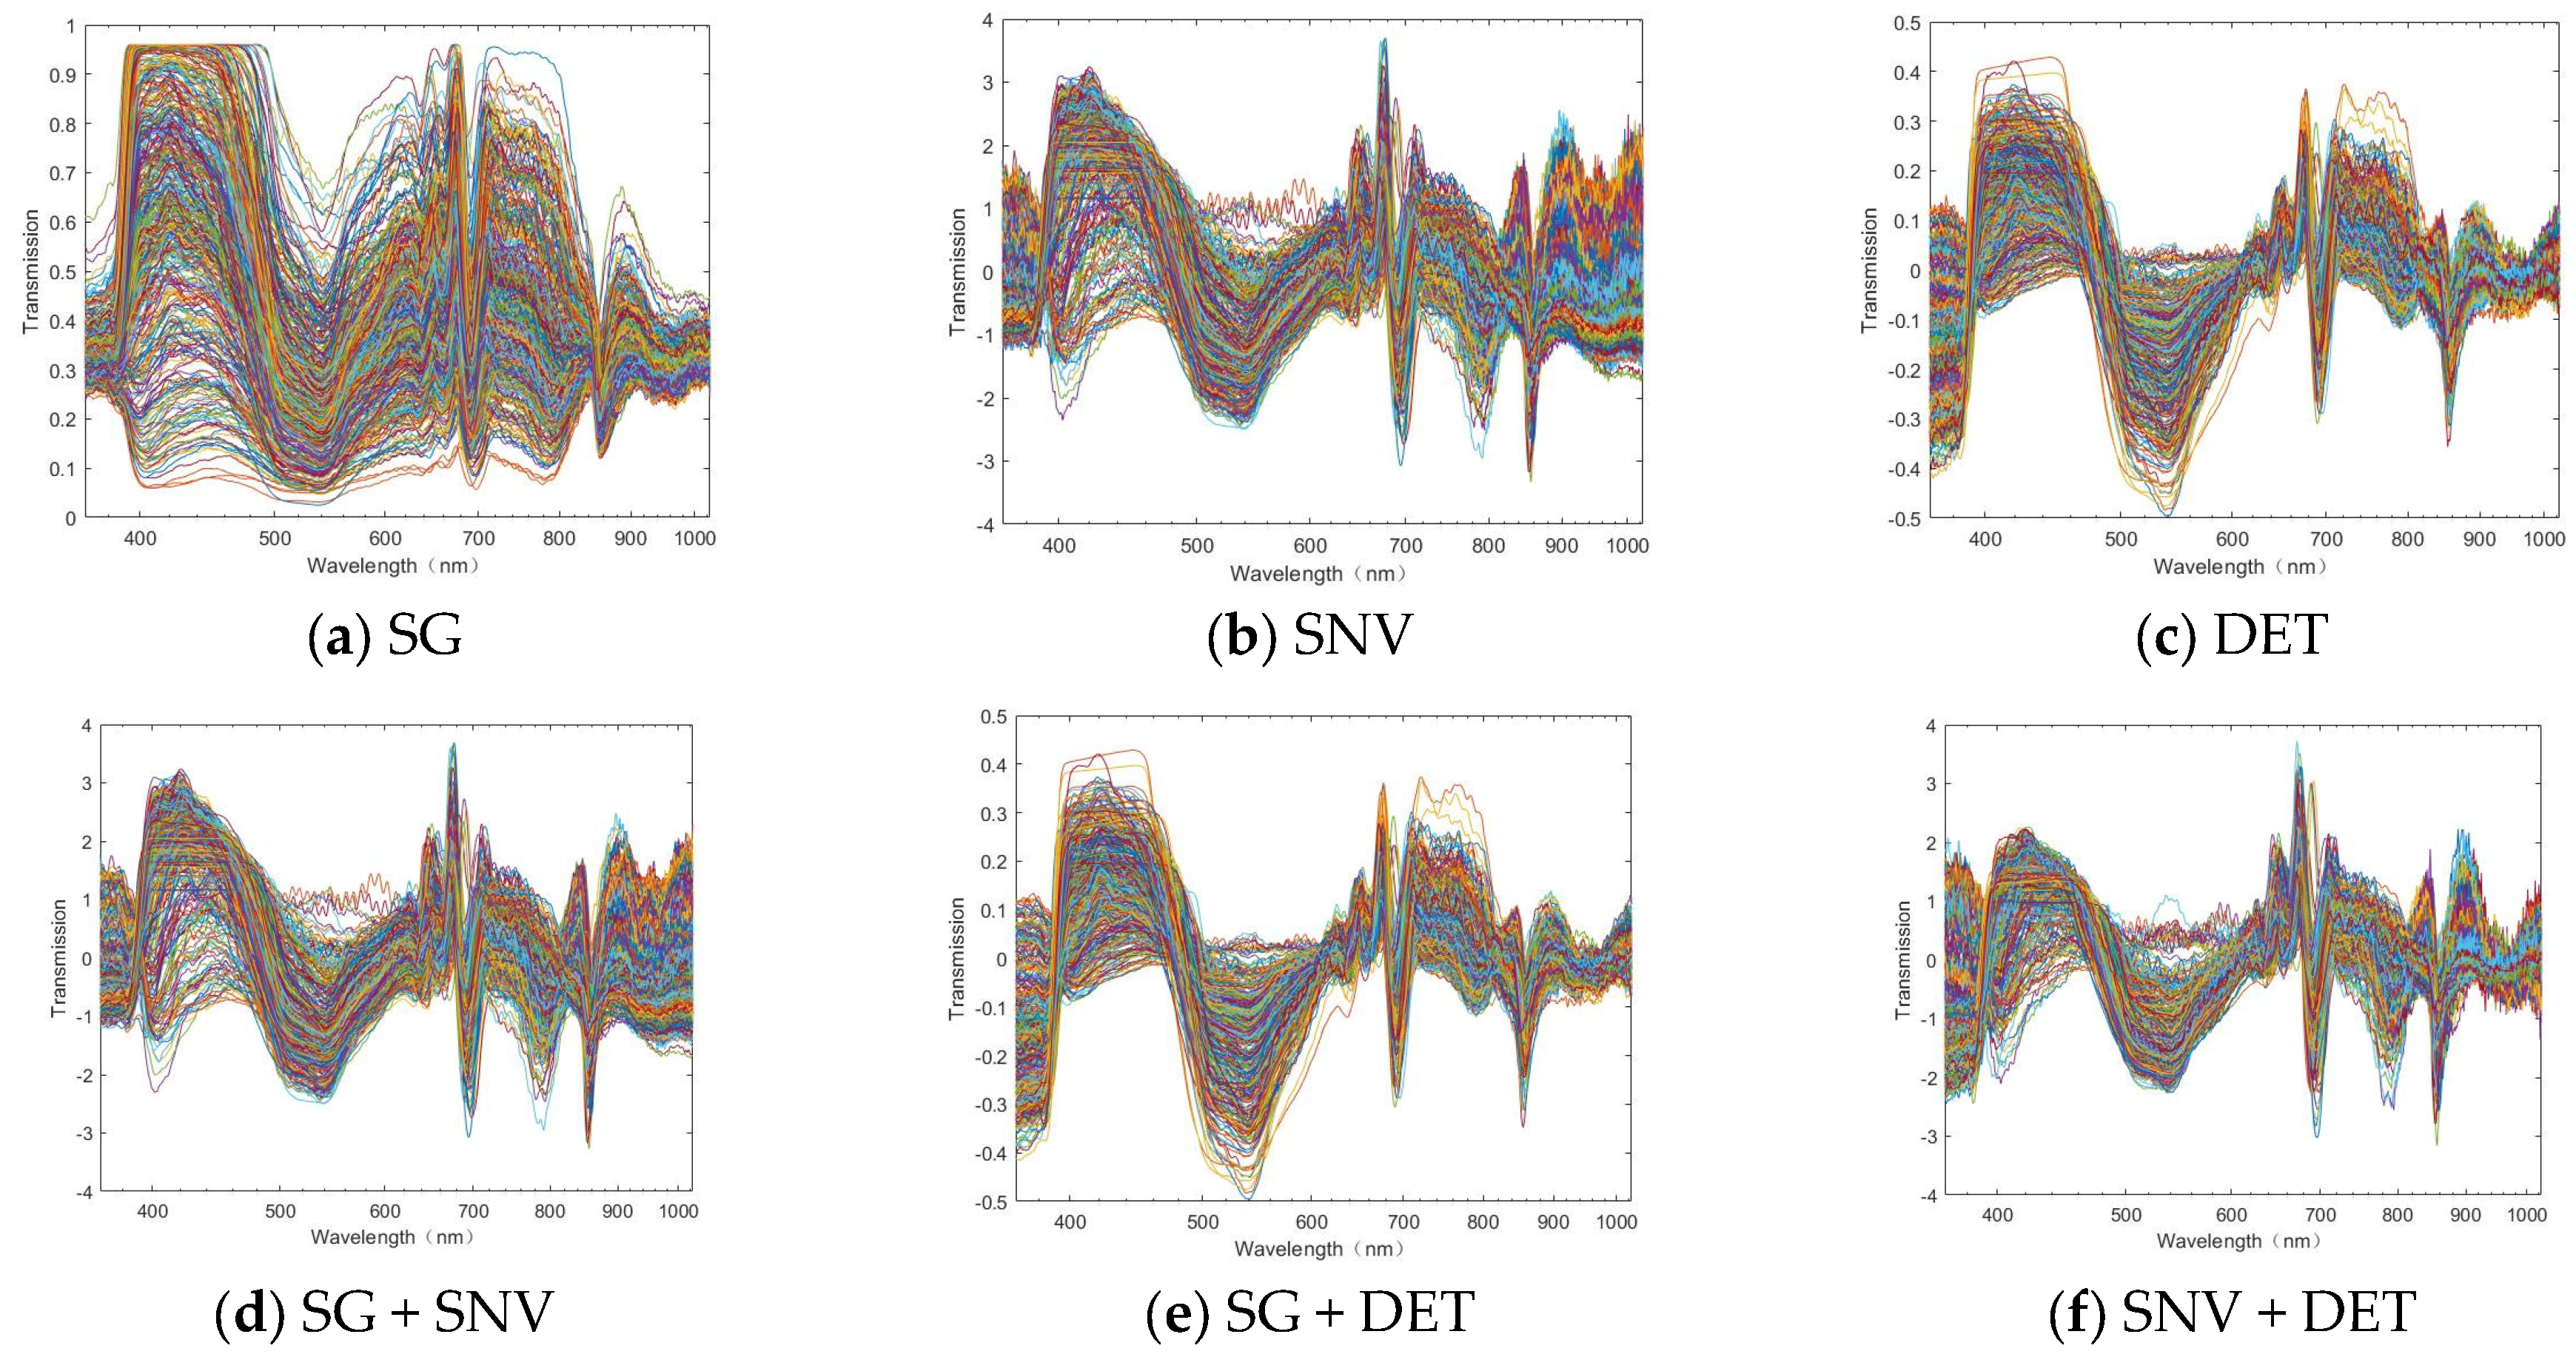
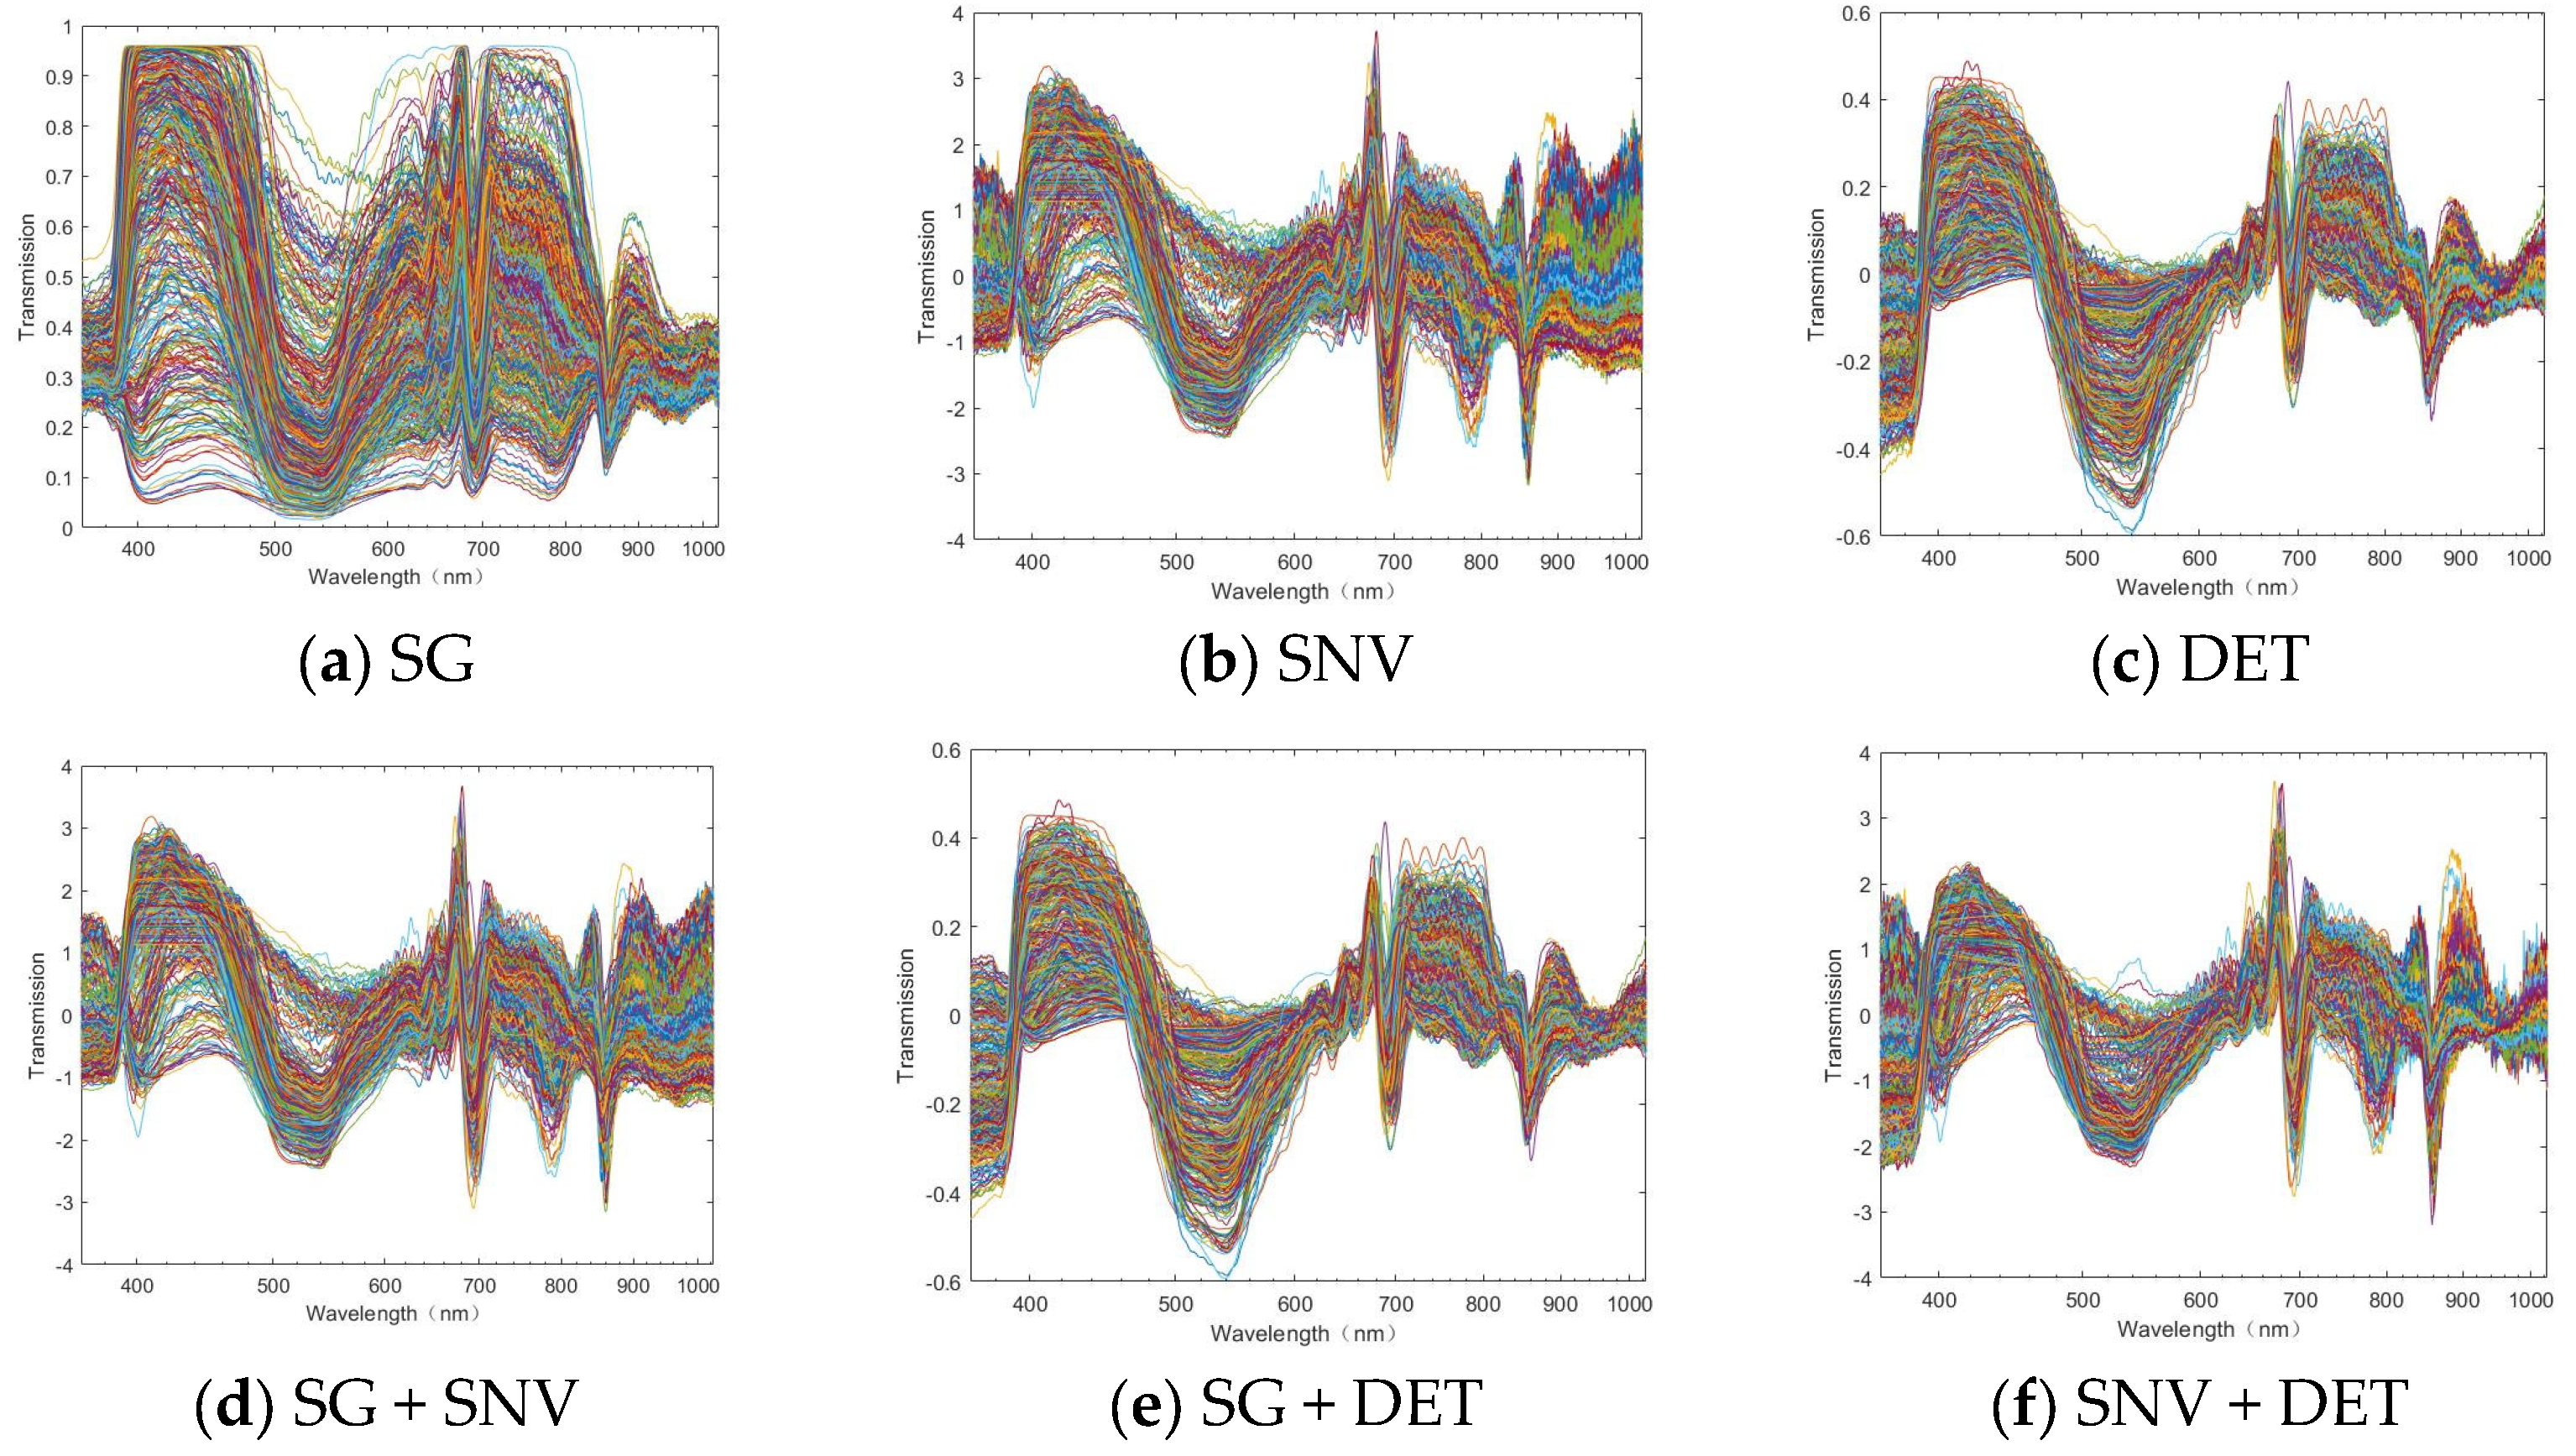
2.3.3. Micro-Hyperspectral Data Pre-Processing
2.3.4. Feature Wavelength Selection
2.3.5. Establishment of Regression Prediction Model
Partial Least Squares Regression Algorithm
Convolutional Neural Network Regression Algorithm
- Combined with the spectral data and several experiments, three convolution layers were built, and the number of convolution nuclei in each layer was 16 and the sample ratio of the model training set and the test set is 4:1.
- This study proposes introducing batch normalization (BN) after the convolutional layer, standardizing the data after convolution, and then inputting it into the next layer [37], which can significantly simplify the data after the convolutional layer and improve the speed after extracting useful information.
- In this study, the rectified linear unit (ReLU) activation function was introduced after normalization.
Data Processing Software
3. Results and Discussion
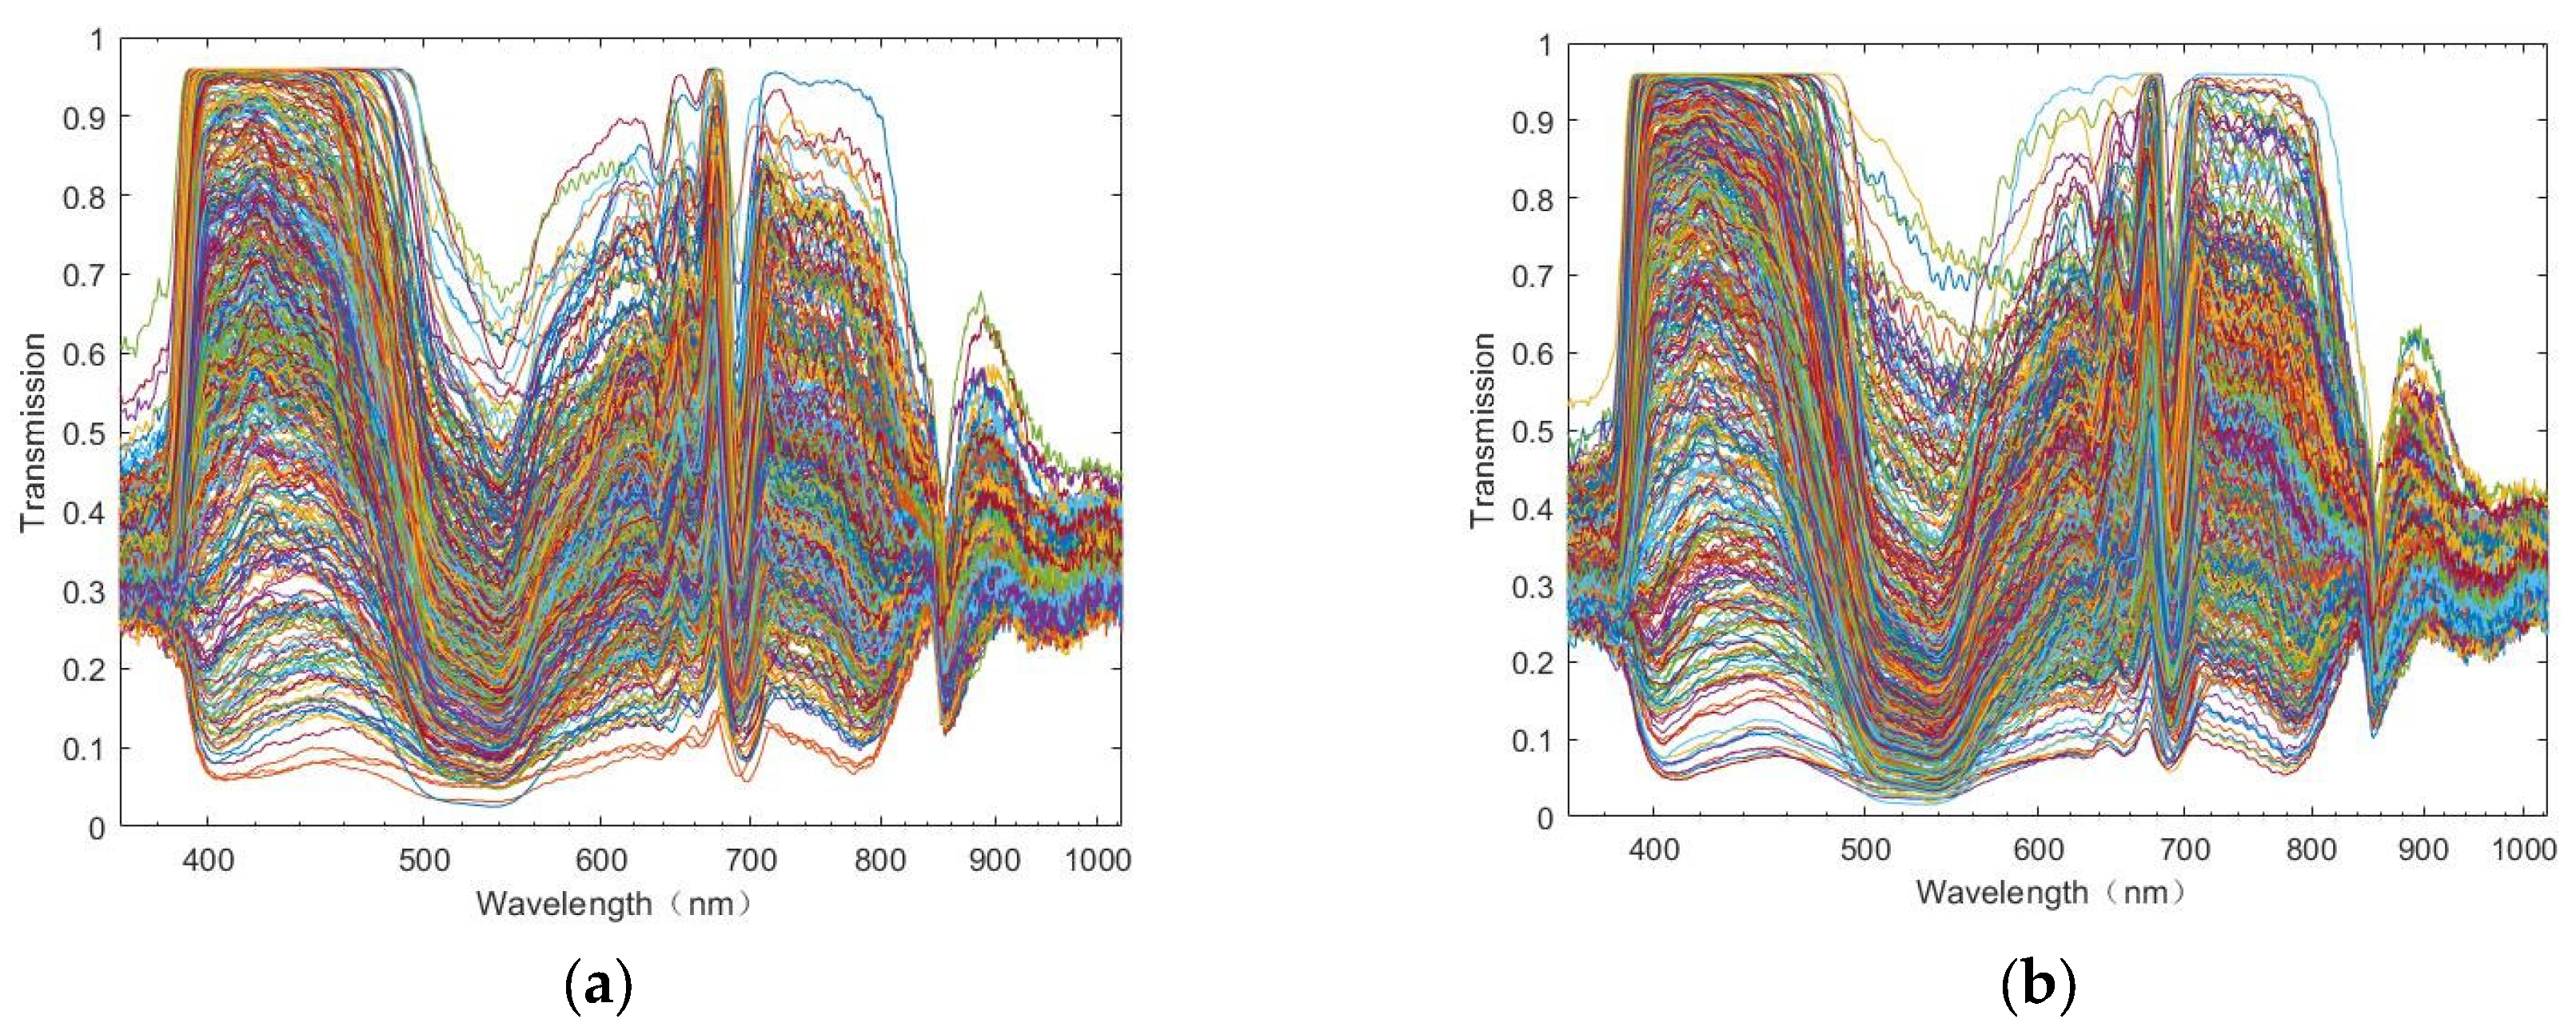
3.1. Characteristic Analysis of Spectral Information
3.2. Characteristic Wavelenght Extraction Analysis
3.3. Different Algorithms Predict Anthocyanin Content
3.3.1. PLS Method Was Used to Predict Anthocyanin Content
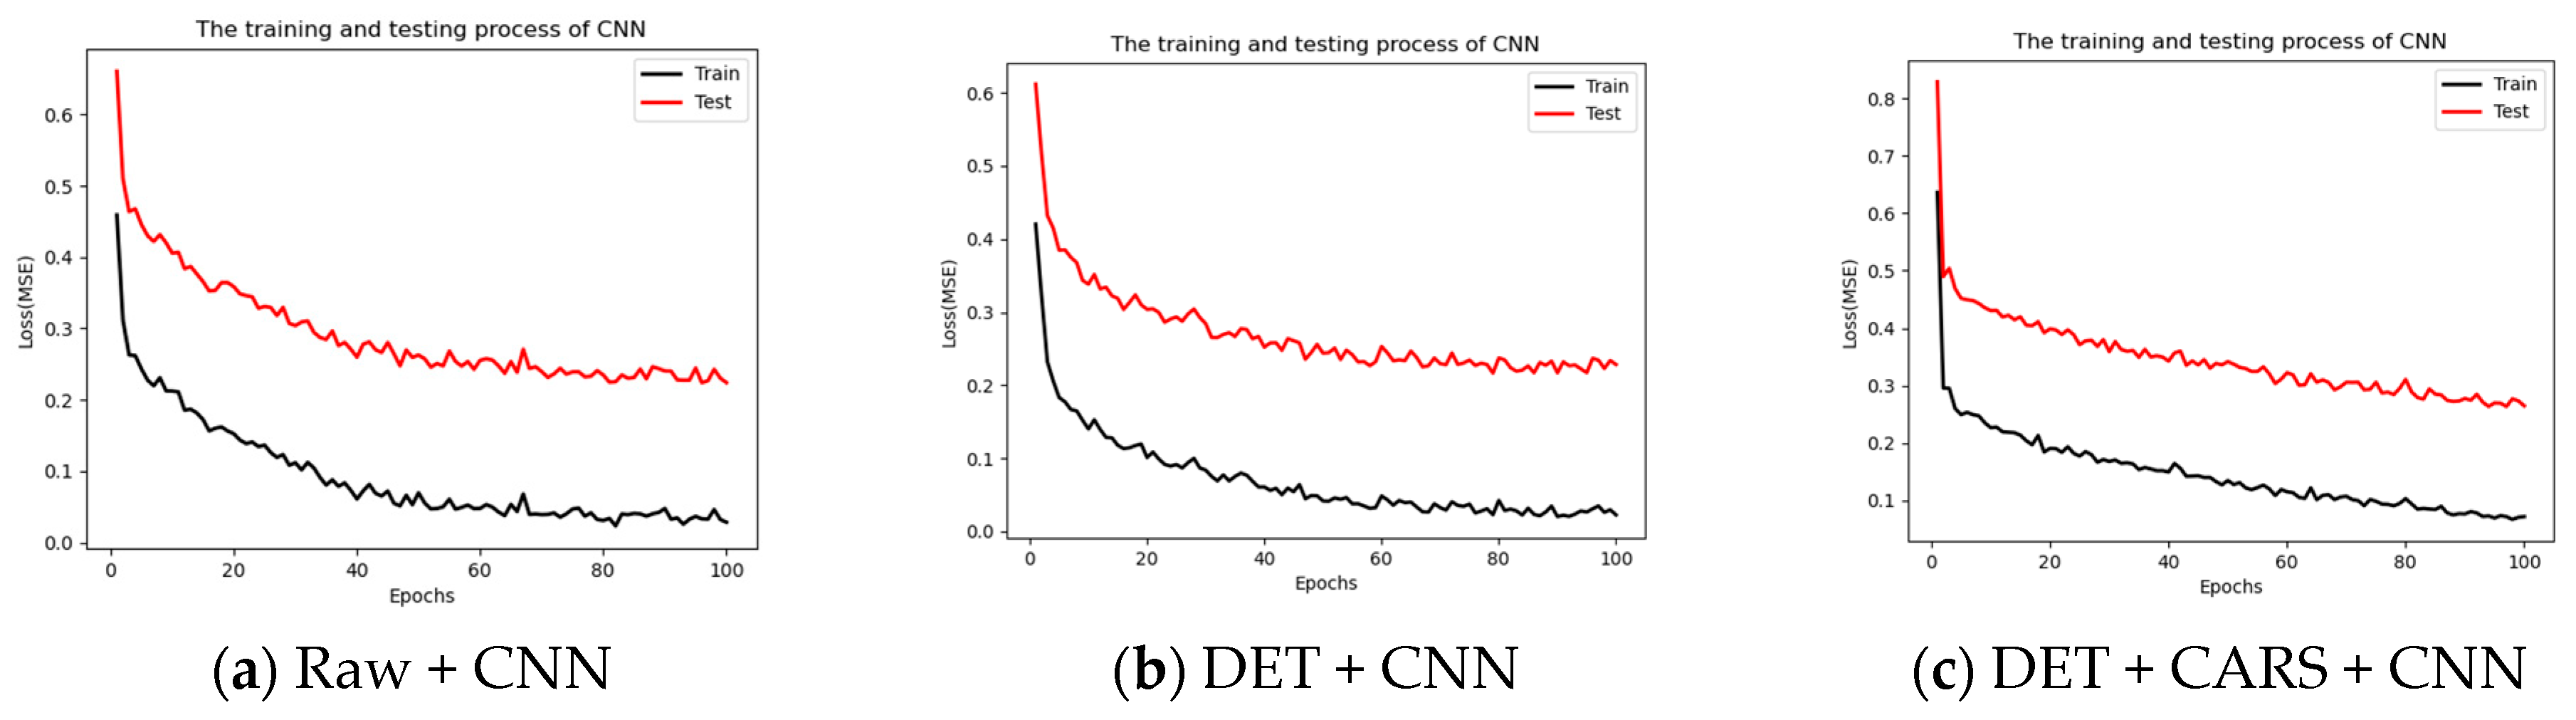
3.3.2. Prediction of Anthocyanin Content by CNN Method
4. Conclusions
Author Contributions
Funding
Data Availability Statement
Acknowledgments
Conflicts of Interest
References
- Yi, K.; Fei, G.; Tao, J.; Zheng, L. Research progress on effects of temperature on anthocyanin synthesis in plants. Chin. Agric. Sci. Bull. 2015, 31, 101–105. [Google Scholar]
- Shaochuan, S.; Yike, G.; Xiuhai, Z.; Wang, Y. Study and application of genes related to anthocyanin biosynthesis in plants. Plant Res. 2011, 31, 633–664. [Google Scholar]
- Karadeniz, F.; Burdurlu, H.S.; Koca, N.; Soyer, Y. Antioxidant activity of selected fruits and vegetables grown in Turkey. Turk. J. Agric. For. 2005, 89, 297–303. [Google Scholar]
- Zarzecka, K.; Gugala, M. The effect of herbicides and soil tillage systems on the content of polyphenols in potato tubers. Pol. J. Environ. Stud. 2011, 20, 513–517. [Google Scholar]
- Liming, H.; Dan, T. Research status and prospect of anthocyanins in “Black beauty” potato. J. Chin. Vet. Med. 2019, 39, 95–98. (In Chinese) [Google Scholar]
- Stintzing, F.C.; Carle, R. Functional properties of anthocyanins and betalains in plants, food, and in human nutrition. Trends Food Sci. Technol. 2004, 15, 19–38. [Google Scholar] [CrossRef]
- Dianxin, L.; Yuanwei, D.; Wei, C.; Liu, H. Research progress on the nutritional value and health function of Blueberry. Agric. Prod. Process. 2018, 47, 69–70. [Google Scholar]
- Hamouz, K.; Lachman, J.; Pazderu, K. Differences in anthocyanin content and antioxidant activity of potato tubers with different flesh colour. Plant Soil Environ. 2011, 57, 478–485. [Google Scholar] [CrossRef]
- Huck, C.W. Near-Infrared Spectroscopy as a Rapid Screening Method for the Determination of Total Anthocyanin Content in Sambucus Fructus. Sensors 2020, 20, 4983. [Google Scholar] [CrossRef]
- Dinish, U.S.; Teng, M.T.J.; Xinhui, V.T.; Dev, K.; Tan, J.J.; Koh, S.S.; Urano, D.; Olivo, M. Miniaturized Vis–NIR handheld spectrometer for non-invasive pigment quantification in agritech applications. Sci. Rep. 2023, 13, 9524. [Google Scholar] [CrossRef]
- Zhu, Y.; Zhang, J.; Li, M.; Zhao, L.; Ren, H.; Yan, L.; Zhao, G.; Zhu, C. Rapid determination of spore germinability of Clostridium perfringens based on microscopic hyperspectral imaging technology and chemometrics. J. Food Eng. 2020, 280, 109896. [Google Scholar] [CrossRef]
- Li, Q.L.; Xue, Y.Q.; Xiao, G.H. Study on microscope hyperspectral medical imaging method for biomedical quantitative analysis. Sci. Bull. 2008, 53, 1431–1434. [Google Scholar] [CrossRef]
- Monma, C.; Hatakeyama, K.; Obata, H. Four Foodborne Disease Outbreaks Caused by a New Type of Enterotoxin-Producing Clostridium perfringens. J. Clin. Microbiol. 2015, 53, 859–867. [Google Scholar] [CrossRef]
- Du, M.H. Detection of Antioxidant Oxidase Activity in Tomato Leaves Based on Microscopic Hyperspectral Imaging; Ningxia University: Ningxia, China, 2023. [Google Scholar]
- Wei, X.; Liu, Y.; Song, Q.; Zou, J.; Wen, Z.; Li, J.; Jie, D. Microscopic hyperspectral imaging and an improved detection model based detection of Mycogone perniciosa chlamydospore in soil. Eur. J. Agron. 2023, 152, 1–9. [Google Scholar] [CrossRef]
- Guo, J.H. Changes of Antioxidant Enzymes and their Molecular Hyperspectral Detection during Cold Storage of Tan Sheep Meat; Ningxia University: Ningxia, China, 2022. [Google Scholar]
- Jinping, Z.; Xuan, W. Target detection of thick-wall spores of Agaricus bisporus based on microscopic hyperspectral images. Fujian Agric. Sci. Technol. 2022, 53, 1–8. [Google Scholar]
- Lu, Q. Comparative Study on Rapid Detection of Antioxidants in Mutton by Hyperspectral Method with Different Spatial Resolution; Ningxia University: Ningxia, China, 2022. [Google Scholar]
- Huan, D.; Longguo, W.; Xiaoguang, H.; Songlei, W. Study on the method of detecting superoxide dismutase activity in muscle cells by microhyperspectral technique. Sci. Technol. Food Ind. 2019, 40, 225–230. [Google Scholar]
- Xiaoli, L.; Dongyi, Z.; Yulun, D.; Juanjuan, J.; Yong, H. Rapid spectral detection method of main inclusions in fresh tea leaves based on Convolutional neural network. J. China Agric. Univ. 2021, 26, 113–122. [Google Scholar]
- Ahn, D.H.; Choi, J.Y.; Kim, H.C. Estimating the Composition of Food Nutrients from Hyperspectral Signals Based on Deep Neural Networks. Sensors 2019, 19, 1560. [Google Scholar] [CrossRef]
- Yu, X.; Wang, J.; Wen, S. A deep learning based feature extraction method on hyperspectral images for nondestructive prediction of TVB-N content in Pacific white shrimp (Litopenaeus vannamei). Biosyst. Eng. 2019, 178, 244–255. [Google Scholar] [CrossRef]
- Xiao-Lei, Z. Convolutional Neural Network Spectral Analysis Method and Its Application in Quality Detection of Agricultural Products; Zhejiang University: Hangzhou, China, 2021. [Google Scholar]
- Segler, M.; Preuss, M.; Waller, M.P. Planning chemical syntheses with deep neural networks and symbolic AI. Nature 2018, 555, 604. [Google Scholar] [CrossRef]
- Silver, D.; Huang, A.; Maddison, C.J. Mastering the game of Go with deep neural networks and tree search. Nature 2016, 529, 484–489. [Google Scholar] [CrossRef]
- Chen, Y.; Wang, Z. Quantitative analysis modeling of infrared spectroscopy based on ensemble convolutional neural networks. Chemom. Intell. Lab. Syst. 2018, 181, 1–10. [Google Scholar]
- Ju, L.; Lyu, A.; Hao, H. Deep learning-assisted three-dimensional fluorescence difference spectroscopy for identification and semiquantification of illicit drugs in biofluids. Anal. Chem. 2019, 91, 9343–9347. [Google Scholar] [CrossRef] [PubMed]
- Nyman, N.A.; Kumpulainen, J.T. Determination of anthocyanins in plant-derived foods by high performance liquid chromatography. J. Agric. Food Chem. 2001, 49, 4183–4187. [Google Scholar] [CrossRef] [PubMed]
- Kamruzzaman, M.; Makino, Y.; Oshita, S. Hyperspectral imaging for real-time monitoring of water holding capacity in red meat. LWT—Food Sci. Technol. 2016, 66, 685–691. [Google Scholar] [CrossRef]
- Luypaert, J.; Zhang, M.H.; Massart, D.L. Feasibility study for the use of near infrared spectroscopy in the qualitative and quantitative analysis of green tea, Camellia sinensis (L.). Anal. Chim. Acta 2003, 478, 303–312. [Google Scholar] [CrossRef]
- Li, H.; Liang, Y.; Xu, Q.; Cao, D. Key wavelengths screening using competitive adaptive reweighted sampling method for multivariate calibration. Anal. Chim. Acta 2009, 648, 77–84. [Google Scholar] [CrossRef]
- Araujo, M.C.U.; Saldanha, T.C.B.; Galvao, R.K.H.; Yoneyama, T.; Chame, H.C.; Visani, V. The successive projections algorithm for variable selection in spectroscopic multicomponent analysis. Chemometr. Intell. Lab. 2001, 57, 65–73. [Google Scholar] [CrossRef]
- Kutsanedzie, F.Y.H.; Agyekum, A.A.; Annavaram, V.; Chen, Q.S. Signal-enhanced SERS sensors of CAR-PLS and GA-PLS coupled AgNPs for ochratoxin a and aflatoxin B1 detection. Food Chem. 2020, 315, 126231. [Google Scholar] [CrossRef]
- Xu, Y.; Kutsanedzie, F.Y.H.; Hassan, M.; Zhu, J.; Ahmad, W.; Li, H.H.; Chen, Q.S. Mesoporous silica supported orderly-spaced gold nanoparticles SERS-based sensor for pesticides detection in food. Food Chem. 2020, 315, 126300. [Google Scholar] [CrossRef]
- Jiao, L.; Zhang, F.; Liu, F. A Survey of Deep Learning-based Object Detection. IEEE Access 2019, 7, 128837–128868. [Google Scholar] [CrossRef]
- Lecun, Y.; Bottou, L. Gradient-based learning applied to document recognition. Proc. IEEE 1998, 86, 2278–2324. [Google Scholar] [CrossRef]
- Ioffe, S.; Szegedy, C. Batch normalization: Accelerating deep network training by reducing internal covariate shift. In Proceedings of the International Conference on Machine Learning PMLR, Lille, France, 7–9 July 2015; pp. 448–456. [Google Scholar]
- Wei, L.; Miaomiao, C.; Qiang, Z.; Shan, L. Rapid classification method of black wolfberry by hyperspectral and ensemble learning. Spectrosc. Spectr. Anal. 2021, 41, 2196–2204. (In Chinese) [Google Scholar]
- Xiong, Z.; Sun, D.W.; Xie, A. Quantitative determination of total pigments in red meats using hyperspectral imaging and multivariate analysis. Food Chem. 2015, 178, 339–345. [Google Scholar] [CrossRef] [PubMed]
- Haixia, Z.; Ye, Z. Comparison of anthocyanin contents in two kinds of purple potato. Agric. Process. 2020, 10, 52–53. [Google Scholar]
- Weidong, W.; Qingrui, C.; Yuna, W. Hyperspectral monitoring of relative content of anthocyanins in winter wheat leaves. J. Triticum Crops 2020, 40, 754–761. [Google Scholar]
- Rady, A.; Guyer, D.; Lu, R. Evaluation of Sugar Content of Potatoes using Hyperspectral Imaging. Food Bioprocess Technol. 2015, 8, 995–1010. [Google Scholar] [CrossRef]
- Chen, J.Y.; Zhang, H.; Yelian, M.; Mitsunaka, A. Nondestructive determination of sugar content in potato tubers using visible and near infrared spectroscopy. J. Food Eng. 2010, 11, 59–64. [Google Scholar] [CrossRef]
- Wang, X.; Yu, L.; Tian, S.; Lv, X.; Meng, X. End-to-end analysis modeling of vibrational spectroscopy based on deep learning approach. J. Chemom. 2020, 34, e3291. [Google Scholar] [CrossRef]


| System Parameter | Parameter Value |
|---|---|
| Wavelength range | 365–1025 nm |
| Number of bands | 616 |
| Image space size | 816 × 616 |
| Objective factor | 20 |
| Moving speed | 0.2 mm/s |
| Exposure time | 100 ms |
| Method | All-Band Number | Number of Characteristic Variables | Specific Band |
|---|---|---|---|
| SG + CARS | 616 | 47 | 370,377,378,378,535,560,579,606,636,661, 763,770,781,782,783,814,819,821,827,842, 845,856,866,880,889,893,905,907,916,921, 927,947,949,969,973,978,987,993,1003, 1004,1008,1019,1020,1021,1023,1024 |
| SNV + CARS | 616 | 59 | 365,372,373,378,383,392,396,398,419,425, 457,494,534,535,574,596,648,654,661,688, 690,700,745,750,784,813,814,818,820,821, 824,825,827,828,837,843,849,850,879,886, 889,892,894,900,905,906,916,935,942,950, 951,957,964,970,977,979,989,1008,1023 |
| DET + CARS | 616 | 75 | 365,370,373,378,378,383,395,398,409,418, 446,473,494,541,542,552,566,574,648,649, 660,688,699,736,780,783,796,807,809,814, 818,819,827,831,837,841,843,847,849,864, 874,879,881,886,889,894,897,904,906,907, 915,916,917,922,928,946,949,950,951,953, 957,966,967,969,977,997,1001,1003,1004, 1005,1008,1010,1020,1023,1024 |
| SG + SNV + CARS | 616 | 42 | 365,374,378,379,384,408,419,438,479,493, 534,535,551,552,560,662,689,699,750,783, 813,814,819,821,825,827,836,845,848,866, 872,880,893,906,923,947,970,988,1004,1019,1020,1023 |
| SG + DET + CARS | 616 | 67 | 370,373,375,376,378,378,379,409,417,495, 534,535,560,561,565,592,602,660,690,764, 781,782,792,806,813,814,819,821,827,836, 842,843,845,848,864,866,879,880,889,890, 893,905,906,907,914,922,923,931,932,947, 948,949,965,968,969,978,988,1003,1004, 1005,1008,1019,1020,1021,1023,1024 |
| SNV + DET + CARS | 616 | 53 | 373,378,391,420,489,494,535,560,575,662, 691,699,712,750,781,784,807,813,814,816, 818,820,824,825,827,837,843,857,867,873, 874,883,886,889,892,894,897,901,906,907, 920,922,928,932,938,946,947,950,951,953,977,1005,1020 |
| SG + SPA | 616 | 12 | 379,381,696,820,845,857,880,931,947,1003,1021,1023 |
| SNV + SPA | 616 | 29 | 383,388,390,418,465,489,541,646,663,685, 706,712,763,802,809,813,816,818,819,823, 824,825,826,846,849,861,867,879,1017 |
| DET + SPA | 616 | 19 | 480,624,637,664,686,706,827,890,951,953, 957,964,965,970,976,978,988,1003,1010 |
| SG + SNV + SPA | 616 | 53 | 365,372,378,382,408,423,486,573,577,596, 612,621,624,641,653,662,665,688,697,706, 712,729,734,739,742,750,778,794,798,814, 816,818,820,827,837,845,853,866,869,872, 875,888,893,907,926,929,940,947,958,964, 967,994,1021 |
| SG + DET + SPA | 616 | 63 | 408,423,451,492,585,617,619,625,629,633, 635,659,670,674,677,693,704,710,715,730, 818,827,831,835,838,848,878,899,907,911, 916,918,921,923,925,931,936,944,946,948, 949,951,954,955,956,966,967,968,970,978, 980,981,989,992,994,996,1002,1004,1008, 1019,1021,1023 |
| SNV + DET + SPA | 616 | 12 | 636,670,677,708,852,881,951,957,964,968, 989,990 |
| Method | All-Band Number | Number of Characteristic Variables | Specific Band |
|---|---|---|---|
| SG + CARS | 616 | 59 | 378,484,524,525,546,549,558,562,570, 582,585,590,608,625,632,635,637,683, 748,756,772,775,792,793,796,814,827, 828,835,854,857,862,866,873,874,889, 893,896,902,905,907,912,914,915,921, 935,940,956,962,970,971,988,1004, 1014,1016,1021,1023,1024 |
| SNV + CARS | 616 | 53 | 368,380,389,392,409,422,448,507,570, 571,626,646,655,685,755,766,773,777, 782,789,792,793,798,812,814,818,827, 832,837,851,853,855,889,891,897,903, 905,907,926,934,951,957,967,972,974, 987,989,994,1010,1020,1022,1023,1025 |
| DET + CARS | 616 | 84 | 369,370,378,388,389,422,426,519,548, 553,570,571,582,583,586,590,625,626, 627,630,632,635,637,668,683,693,739, 753,754,755,765,766,773,782,784,789, 793,796,798,810,814,819,827,837,855, 856,859,865,874,883,889,891,895,897, 902,905,906,907,916,921,922,926,927, 934,935,940,942,949,953,957,962,967, 970,971,974,975,989,994,1007,1014, 1017,1022,1023,1025 |
| SG + SNV + CARS | 616 | 59 | 378,379,390,397,405,507,512,558,563, 570,571,643,655,685,752,766,771,773, 776,777,792,793,797,812,813,814,826, 827,829,856,862,866,873,875,887,889, 894,898,906,915,923,930,941,946,956, 959,971,972,980,988,989,993,994, 1005,1014,1017,1019,1021,1025 |
| SG + DET + CARS | 616 | 42 | 507,518,520,526,548,549,570,590,594, 599,625,630,740,754,767,782,788,793, 797,805,813,827,856,865,875,889,894, 902,907,912,914,922,940,956,959,961, 970,988,1004, 1021,1023,1024 |
| SNV + DET + CARS | 616 | 37 | 408,505,559,562,565,571,590,630,752, 764,771,792,794,795,815,827,830,832, 835,840,850,859,860,889,891,892,904, 906,957,966,967,985,989,993,1022,1023,1024 |
| SG + SPA | 616 | 20 | 367,537,577,654,681,716,830,856,859, 907,914,921,934,957,959,960,987,988, 1020,1021 |
| SNV + SPA | 616 | 9 | 391,588,636,704,793,813,826,867,873 |
| DET + SPA | 616 | 12 | 625,685,821,854,891,946,947,971,976, 989,993,1016 |
| SG + SNV + SPA | 616 | 33 | 379,382,400,577,590,593,618,636,639, 643,646,651,654,678,681,729,734,751, 760,802,814,820,824,827,835,868,871, 874,923,929,947,992,1014 |
| SG + DET + SPA | 616 | 31 | 365,389,460,470,611,619,625,629,636, 638,670,683,710,814,824,828,874,907, 922,929,940,949,956,959,960,969,971, 981,1002,1004,1020 |
| SNV + DET + SPA | 616 | 11 | 533,854,939,946,950,957,961,965,989, 993,998 |
| Treatment Method | Rp | RMSEP | Rc | RMSEC | RPD |
|---|---|---|---|---|---|
| Primary spectrum (Raw) | 0.7765 | 0.426 | 0.7874 | 0.429 | 2.30 |
| SG | 0.7161 | 0.448 | 0.7216 | 0.459 | 2.18 |
| SNV | 0.7496 | 0.435 | 0.7439 | 0.449 | 2.25 |
| DET | 0.7446 | 0.444 | 0.7928 | 0.425 | 2.20 |
| SG + SNV | 0.7237 | 0.451 | 0.7249 | 0.462 | 2.17 |
| SG + DET | 0.7130 | 0.457 | 0.7227 | 0.469 | 2.14 |
| SNV + DET | 0.7419 | 0.437 | 0.7490 | 0.444 | 2.24 |
| SG + CARS | 0.8267 | 0.387 | 0.8509 | 0.380 | 2.53 |
| SNV + CARS | 0.8462 | 0.373 | 0.8410 | 0.386 | 2.62 |
| DET + CARS | 0.8593 | 0.370 | 0.8158 | 0.334 | 2.64 |
| SG + SNV + CARS | 0.8382 | 0.378 | 0.8147 | 0.403 | 2.59 |
| SG + DET + CARS | 0.8398 | 0.378 | 0.8429 | 0.386 | 2.59 |
| SNV + DET + CARS | 0.8409 | 0.378 | 0.8359 | 0.389 | 2.59 |
| SG + SPA | 0.7464 | 0.428 | 0.7837 | 0.466 | 2.29 |
| SNV + SPA | 0.7123 | 0.445 | 0.7274 | 0.448 | 2.20 |
| DET + SPA | 0.6316 | 0.477 | 0.6233 | 0.491 | 2.05 |
| SG + SNV + SPA | 0.7347 | 0.433 | 0.7093 | 0.455 | 2.26 |
| SG + DET + SPA | 0.7263 | 0.454 | 0.7897 | 0.418 | 2.15 |
| SNV + DET + SPA | 0.6281 | 0.477 | 0.6046 | 0.495 | 2.05 |
| Treatment Method | Rp | RMSEP | Rc | RMSEC | RPD |
|---|---|---|---|---|---|
| Primary spectrum (Raw) | 0.8429 | 0.403 | 0.8159 | 0.422 | 2.45 |
| SG | 0.8205 | 0.421 | 0.7877 | 0.441 | 2.35 |
| SNV | 0.8390 | 0.395 | 0.7707 | 0.446 | 2.50 |
| DET | 0.8334 | 0.406 | 0.7985 | 0.431 | 2.43 |
| SG + SNV | 0.8397 | 0.396 | 0.7509 | 0.452 | 2.50 |
| SG + DET | 0.7870 | 0.429 | 0.7814 | 0.439 | 2.30 |
| SNV + DET | 0.8370 | 0.397 | 0.7566 | 0.449 | 2.49 |
| SG + CARS | 0.9086 | 0.346 | 0.9019 | 0.346 | 2.85 |
| SNV + CARS | 0.8868 | 0.360 | 0.8524 | 0.381 | 2.74 |
| DET + CARS | 0.9287 | 0.325 | 0.9227 | 0.329 | 3.03 |
| SG + SNV + CARS | 0.8832 | 0.362 | 0.8577 | 0.383 | 2.73 |
| SG + DET + CARS | 0.9178 | 0.332 | 0.8738 | 0.371 | 2.97 |
| SNV + DET + CARS | 0.9057 | 0.345 | 0.8561 | 0.378 | 2.86 |
| SG + SPA | 0.8668 | 0.376 | 0.8134 | 0.413 | 2.63 |
| SNV + SPA | 0.7829 | 0.432 | 0.7145 | 0.467 | 2.29 |
| DET + SPA | 0.8123 | 0.414 | 0.7501 | 0.450 | 2.38 |
| SG + SNV + SPA | 0.8087 | 0.417 | 0.7870 | 0.434 | 2.37 |
| SG + DET + SPA | 0.8139 | 0.414 | 0.8001 | 0.422 | 2.38 |
| SNV + DET + SPA | 0.8220 | 0.410 | 0.7708 | 0.439 | 2.41 |
| Treatment Method | Input Variable | Rc | RMSEC | Rp | RMSEP | RPD |
|---|---|---|---|---|---|---|
| Primary spectrum (Raw) | 616 | 0.9486 | 0.0312 | 0.9446 | 0.2291 | 4.41 |
| SG | 616 | 0.9506 | 0.0312 | 0.9440 | 0.2339 | 4.3728 |
| SNV | 616 | 0.9503 | 0.0274 | 0.9446 | 0.2273 | 4.4556 |
| DET | 616 | 0.9499 | 0.0235 | 0.9457 | 0.2234 | 4.4893 |
| SG + SNV | 616 | 0.9487 | 0.0318 | 0.9452 | 0.2309 | 4.4367 |
| SG + DET | 616 | 0.9518 | 0.0278 | 0.9445 | 0.2282 | 4.4782 |
| SNV + DET | 616 | 0.9504 | 0.0225 | 0.9456 | 0.2237 | 4.3895 |
| SG + CARS | 47 | 0.9539 | 0.1103 | 0.9494 | 0.3137 | 3.7346 |
| SNV + CARS | 59 | 0.9527 | 0.0815 | 0.9501 | 0.2843 | 3.9260 |
| DET + CARS | 75 | 0.9524 | 0.0657 | 0.9468 | 0.2651 | 4.0942 |
| SG + SNV + CARS | 42 | 0.9536 | 0.1028 | 0.9483 | 0.300 | 3.8091 |
| SG + DET + CARS | 67 | 0.9509 | 0.0673 | 0.9474 | 0.2687 | 4.0421 |
| SNV + DET + CARS | 53 | 0.9549 | 0.0909 | 0.9484 | 0.2911 | 3.9047 |
| SG + SPA | 12 | 0.9600 | 0.2019 | 0.9543 | 0.4012 | 3.3207 |
| SNV + SPA | 29 | 0.9565 | 0.1375 | 0.9519 | 0.3379 | 3.6080 |
| DET + SPA | 19 | 0.9573 | 0.1823 | 0.9526 | 0.3839 | 3.4089 |
| SG + SNV + SPA | 53 | 0.9524 | 0.0776 | 0.9492 | 0.2767 | 3.9991 |
| SG + DET + SPA | 63 | 0.9536 | 0.0857 | 0.9479 | 0.2860 | 3.9538 |
| SNV + DET + SPA | 12 | 0.9592 | 0.2205 | 0.9541 | 0.4232 | 3.2656 |
| Treatment Method | Input Variable | Rc | RMSEC | Rp | RMSEP | RPD |
|---|---|---|---|---|---|---|
| Primary spectrum (Raw) | 616 | 0.9508 | 0.0374 | 0.9461 | 0.2361 | 4.4933 |
| SG | 616 | 0.9518 | 0.0356 | 0.9444 | 0.2364 | 4.5894 |
| SNV | 616 | 0.9484 | 0.0380 | 0.9450 | 0.2390 | 4.5236 |
| DET | 616 | 0.9512 | 0.0354 | 0.9450 | 0.2348 | 4.5869 |
| SG + SNV | 616 | 0.9501 | 0.0392 | 0.9458 | 0.2356 | 4.5635 |
| SG + DET | 616 | 0.9499 | 0.0359 | 0.9439 | 0.2384 | 4.6516 |
| SNV + DET | 616 | 0.9509 | 0.0364 | 0.9453 | 0.2402 | 4.4951 |
| SG + CARS | 59 | 0.9526 | 0.0891 | 0.9489 | 0.2876 | 4.1448 |
| SNV + CARS | 53 | 0.9540 | 0.0998 | 0.9487 | 0.3001 | 4.0022 |
| DET + CARS | 84 | 0.9527 | 0.0708 | 0.9457 | 0.2711 | 4.1623 |
| SG + SNV + CARS | 59 | 0.9530 | 0.0988 | 0.9476 | 0.2997 | 4.0345 |
| SG + DET + CARS | 42 | 0.9542 | 0.1201 | 0.9512 | 0.3118 | 3.8870 |
| SNV + DET + CARS | 37 | 0.9542 | 0.1168 | 0.9473 | 0.3194 | 3.9253 |
| SG + SPA | 20 | 0.9565 | 0.1419 | 0.9510 | 0.3409 | 3.8222 |
| SNV + SPA | 9 | 0.9596 | 0.2092 | 0.9559 | 0.4103 | 3.4881 |
| DET + SPA | 12 | 0.9561 | 0.1649 | 0.9511 | 0.3672 | 3.6420 |
| SG + SNV + SPA | 33 | 0.9521 | 0.0995 | 0.9479 | 0.3010 | 4.0386 |
| SG + DET + SPA | 31 | 0.9542 | 0.1210 | 0.9492 | 0.3221 | 3.8943 |
| SNV + DET + SPA | 11 | 0.9592 | 0.2184 | 0.9534 | 0.4201 | 3.3842 |
Disclaimer/Publisher’s Note: The statements, opinions and data contained in all publications are solely those of the individual author(s) and contributor(s) and not of MDPI and/or the editor(s). MDPI and/or the editor(s) disclaim responsibility for any injury to people or property resulting from any ideas, methods, instructions or products referred to in the content. |
© 2024 by the authors. Licensee MDPI, Basel, Switzerland. This article is an open access article distributed under the terms and conditions of the Creative Commons Attribution (CC BY) license (https://creativecommons.org/licenses/by/4.0/).
Share and Cite
Wang, F.; Li, Q.; Deng, W.; Wang, C.; Han, L. Detection of Anthocyanins in Potatoes Using Micro-Hyperspectral Images Based on Convolutional Neural Networks. Foods 2024, 13, 2096. https://doi.org/10.3390/foods13132096
Wang F, Li Q, Deng W, Wang C, Han L. Detection of Anthocyanins in Potatoes Using Micro-Hyperspectral Images Based on Convolutional Neural Networks. Foods. 2024; 13(13):2096. https://doi.org/10.3390/foods13132096
Chicago/Turabian StyleWang, Fuxiang, Qiying Li, Weigang Deng, Chunguang Wang, and Lei Han. 2024. "Detection of Anthocyanins in Potatoes Using Micro-Hyperspectral Images Based on Convolutional Neural Networks" Foods 13, no. 13: 2096. https://doi.org/10.3390/foods13132096
APA StyleWang, F., Li, Q., Deng, W., Wang, C., & Han, L. (2024). Detection of Anthocyanins in Potatoes Using Micro-Hyperspectral Images Based on Convolutional Neural Networks. Foods, 13(13), 2096. https://doi.org/10.3390/foods13132096