
Effects of Laccase and Transglutaminase on the Physicochemical and Functional Properties of Hybrid Lupin and Whey Protein Powder
 ,
, 
 , , and
Abstract
1. Introduction
2. Materials and Methods
2.1. Materials
2.2. Proximate Analysis of Lupin Flour and Whey Protein Concentrate Powder
2.3. Enzyme Treatment of Lupin and Whey Protein
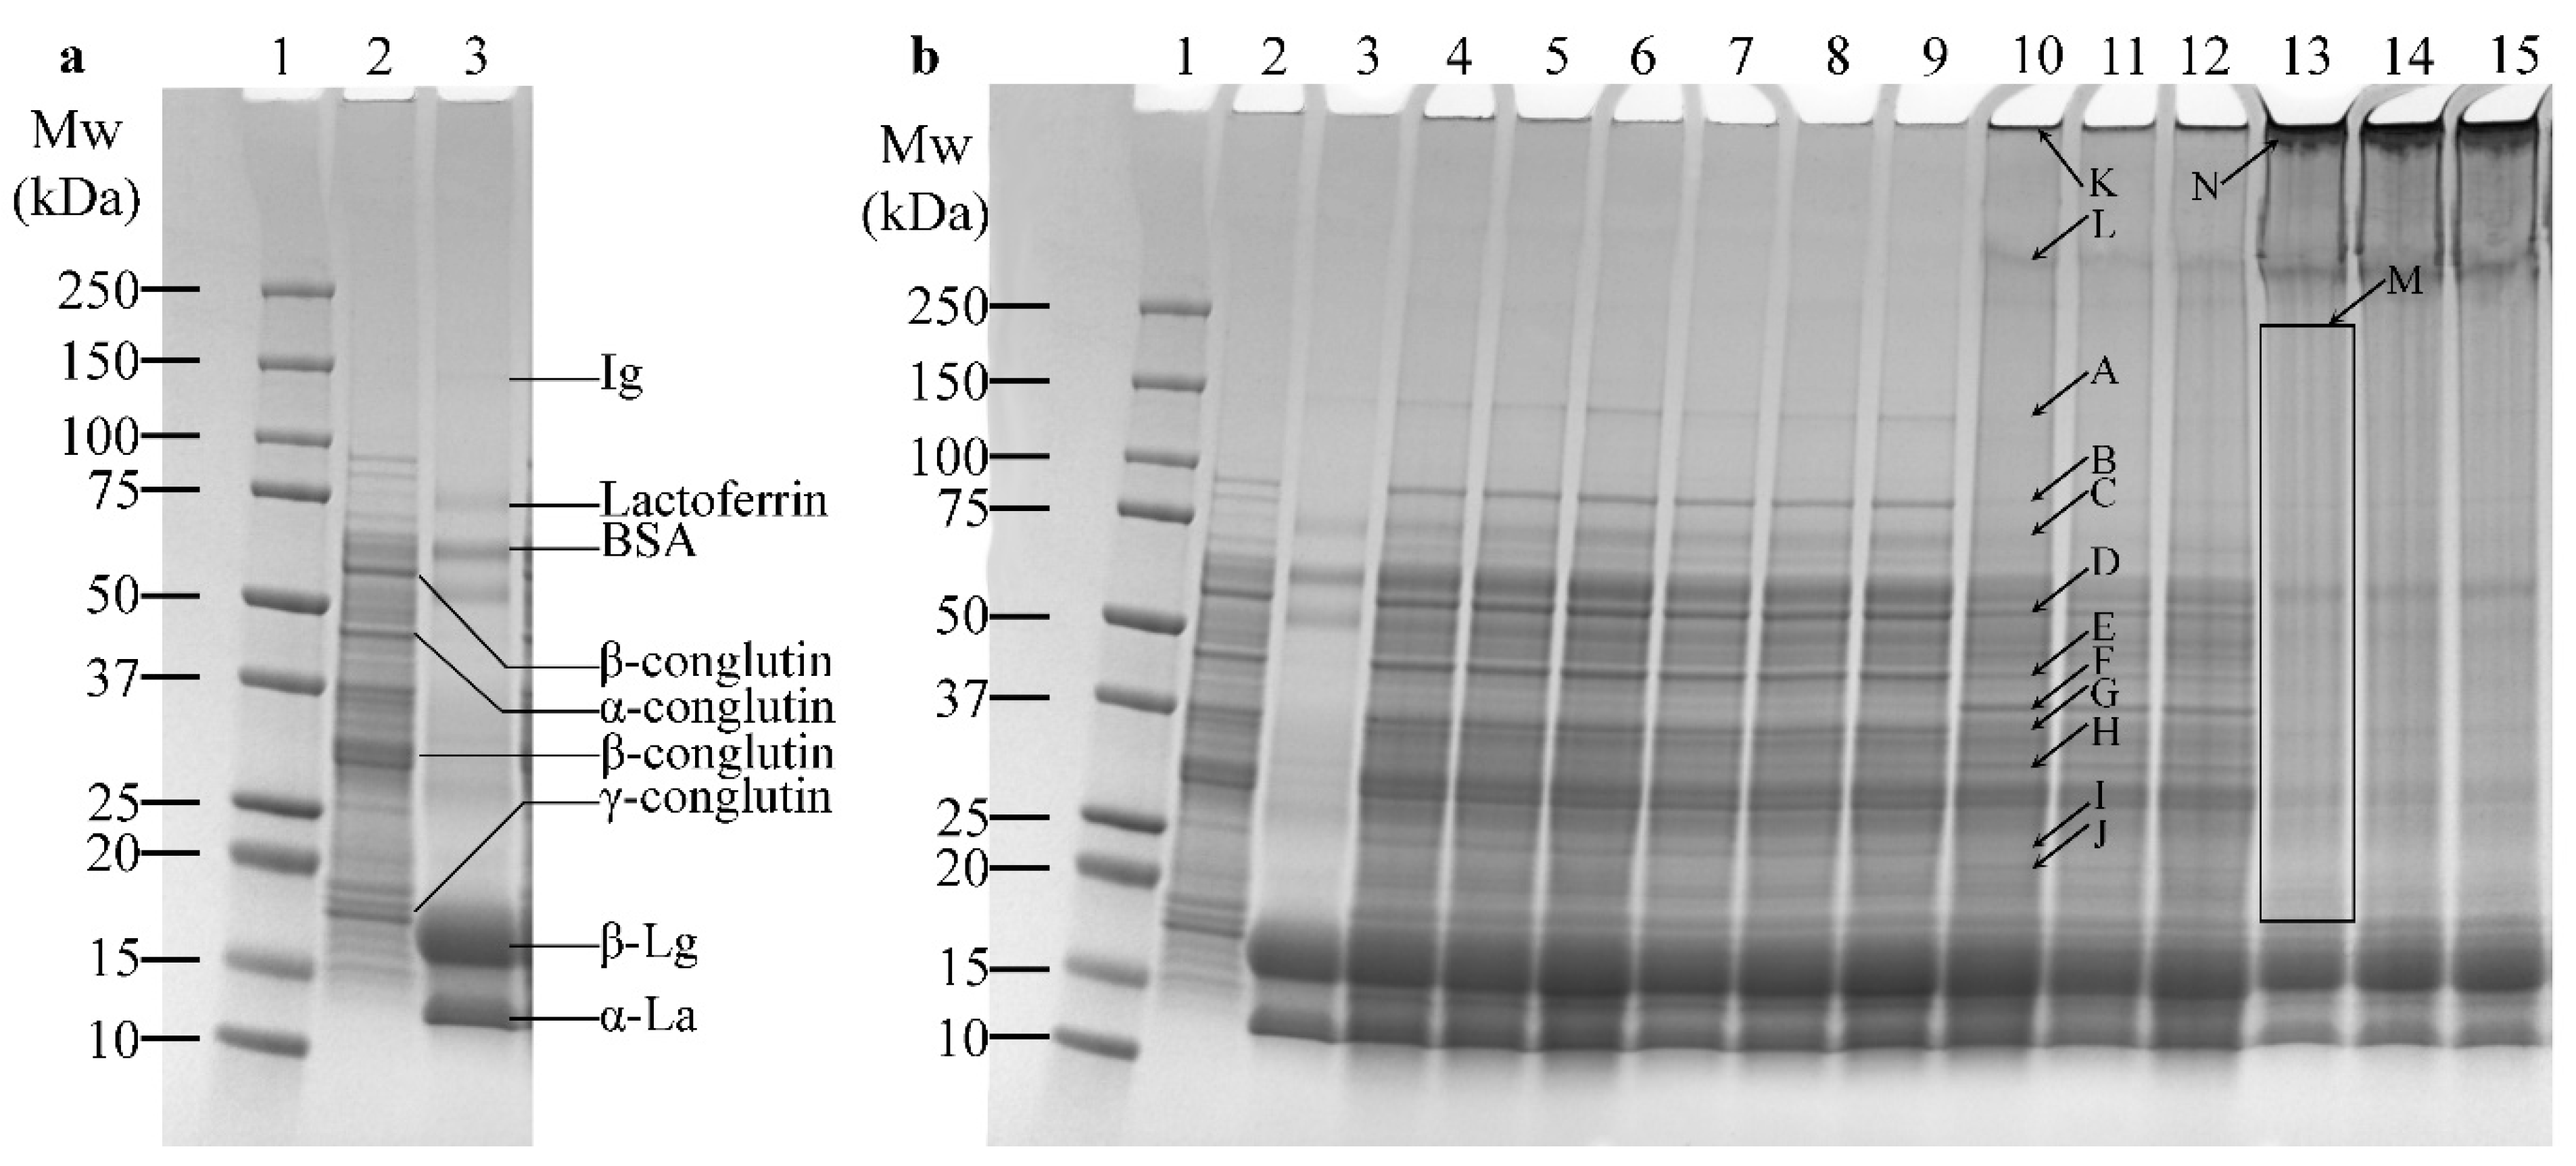
2.4. SDS-PAGE
2.5. Physicochemical Properties
2.5.1. Colour
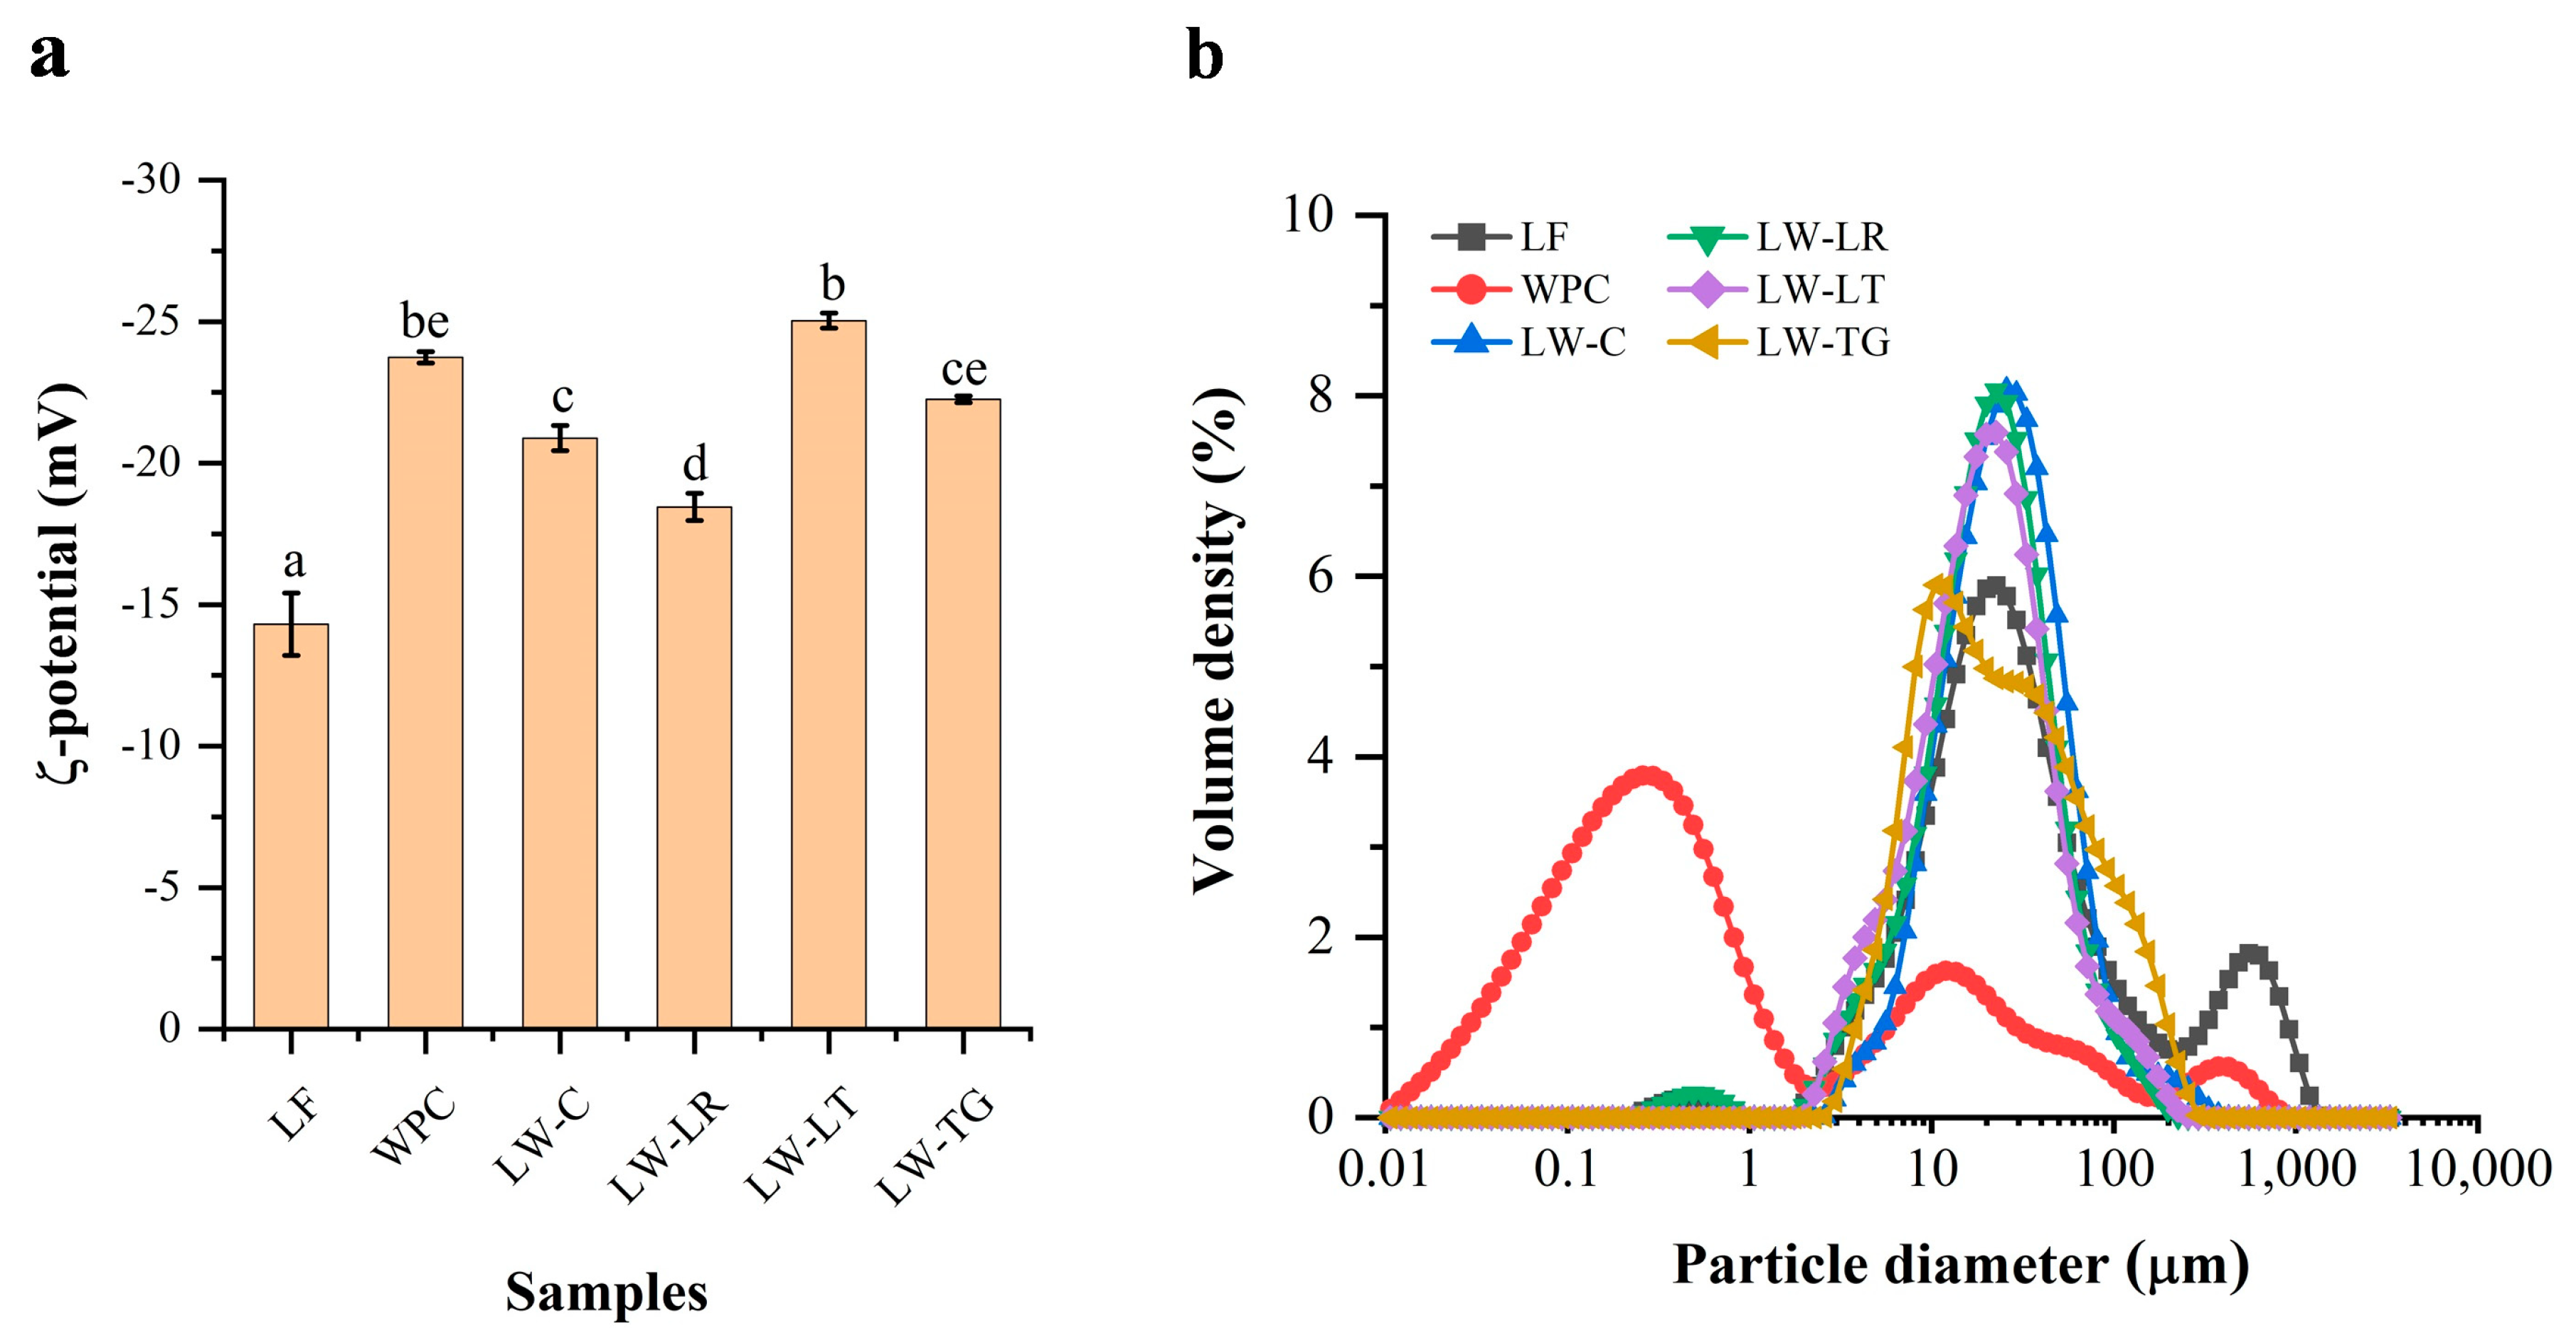
2.5.2. ζ-Potential
2.5.3. Particle Size Distribution
2.5.4. Differential Scanning Calorimetry
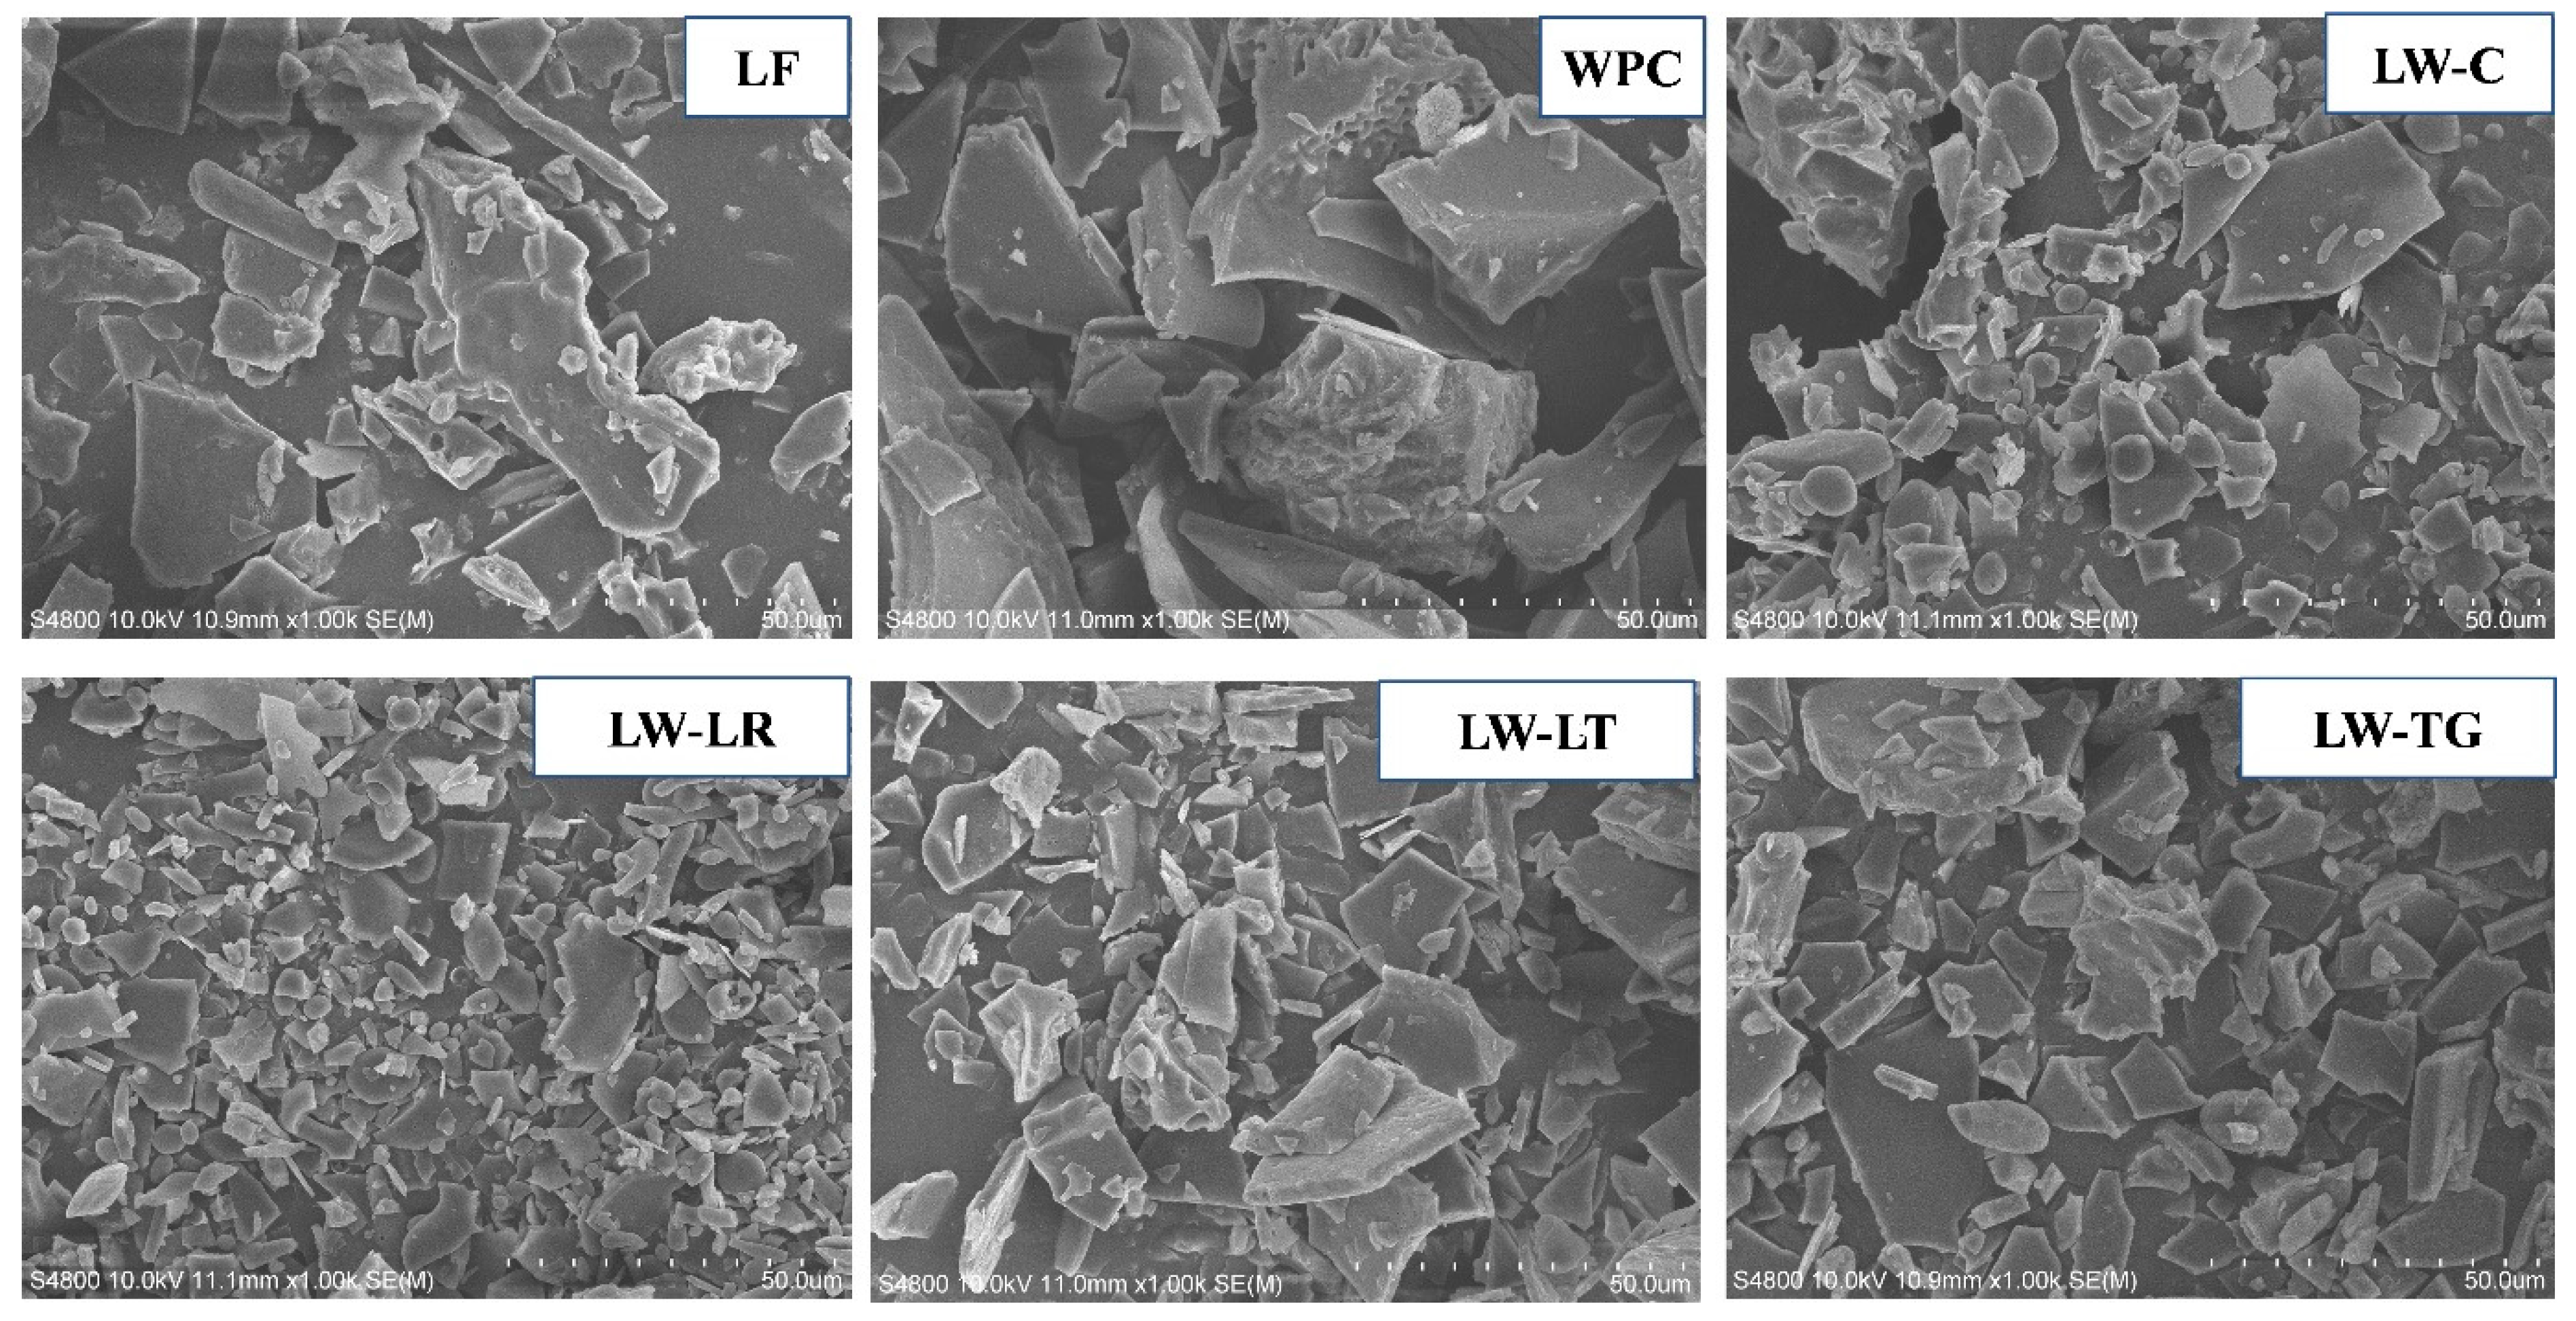
2.5.5. Morphology
2.6. Functional Properties
2.6.1. Protein Solubility
- (i)
- The supernatant was prepared and collected using the method adapted from Boye et al. [20] and Havea [21] with modifications. LF, WPC or LW powdered samples were redissolved in Milli-Q water to make a 1% (w/v) concentration, stirred using a magnetic stirrer (200 rpm) for 30 min at 20 °C, and then centrifuged (900× g, Gyrozen 1580R, Gyrozen, Gimpo, Republic of Korea) for 10 min at 20 °C.
- (ii)
- To extract all proteins from LF, WPC or LW powder for total protein measurement, the sample was firstly suspended in a cocktail containing 8 M urea, 0.1 M Tris-HCl, and 2% DTT, making up a 1% (w/v) concentration [22]. The cocktail solution was then agitated in an orbital shaker (600 rpm, ISLD04HDG, Ohaus, Parsippany-Troy Hills, NJ, USA) at 20 °C for 45 min, followed by centrifugation (1000× g) for 15 min at 10 °C.
2.6.2. Emulsion and Foaming Properties
Sample Preparation
Emulsion Ability and Stability
Foaming Ability and Stability
2.7. Amino Acid Measurement
2.8. Statistical Analysis
3. Results and Discussion
3.1. Proximate Composition of Lupin Flour and Whey Protein Concentrate Powder
3.2. SDS-PAGE
3.3. Physicochemical Properties
3.3.1. Colour
3.3.2. ζ-Potential
3.3.3. Particle Size Distribution
3.3.4. Thermal Properties
3.3.5. Morphology
3.4. Functional Properties
3.4.1. Protein Solubility
3.4.2. Emulsion and Foaming Properties
Emulsion Properties
Foaming Properties
3.5. Amino Acid Content
4. Conclusions
Supplementary Materials
Author Contributions
Funding
Data Availability Statement
Acknowledgments
Conflicts of Interest
References
- Lv, C.; Zhao, G.; Ning, Y. Interactions between plant proteins/enzymes and other food components, and their effects on food quality. Crit. Rev. Food Sci. Nutr. 2017, 57, 1718–1728. [Google Scholar] [CrossRef] [PubMed]
- Ismail, B.P.; Senaratne-Lenagala, L.; Stube, A.; Brackenridge, A. Protein demand: Review of plant and animal proteins used in alternative protein product development and production. Anim. Front. 2020, 10, 53–63. [Google Scholar] [CrossRef] [PubMed]
- Day, L. Proteins from land plants—Potential resources for human nutrition and food security. Trends Food Sci. Technol. 2013, 32, 25–42. [Google Scholar] [CrossRef]
- Alves, A.C.; Tavares, G.M. Mixing animal and plant proteins: Is this a way to improve protein techno-functionalities? Food Hydrocoll. 2019, 97, 105171. [Google Scholar] [CrossRef]
- Heck, T.; Faccio, G.; Richter, M.; Thöny-Meyer, L. Enzyme-catalyzed protein crosslinking. Appl. Microbiol. Biotechnol. 2013, 97, 461–475. [Google Scholar] [CrossRef] [PubMed]
- Isaschar-Ovdat, S.; Fishman, A. Crosslinking of food proteins mediated by oxidative enzymes–a review. Trends Food Sci. Technol. 2018, 72, 134–143. [Google Scholar] [CrossRef]
- Minussi, R.C.; Pastore, G.M.; Durán, N. Potential applications of laccase in the food industry. Trends Food Sci. Technol. 2002, 13, 205–216. [Google Scholar] [CrossRef]
- DeJong, G.; Koppelman, S. Transglutaminase catalyzed reactions: Impact on food applications. J. Food Sci. 2002, 67, 2798–2806. [Google Scholar] [CrossRef]
- Sivaramakrishnan, M.; Shooter, G.K.; Upton, Z.; Croll, T.I. Transglutaminases and receptor tyrosine kinases. Amino Acids 2013, 44, 19–24. [Google Scholar] [CrossRef]
- Lerner, A.; Benzvi, C. Microbial Transglutaminase Is a Very Frequently Used Food Additive and Is a Potential Inducer of Autoimmune/Neurodegenerative Diseases. Toxics 2021, 9, 233. [Google Scholar] [CrossRef]
- Bonny, S.P.F.; Gardner, G.E.; Pethick, D.W.; Hocquette, J.-F. Artificial meat and the future of the meat industry. Anim. Prod. Sci. 2017, 57, 2216–2223. [Google Scholar] [CrossRef]
- Jiang, Z.; Shi, R.; Ma, L.; Munkh-Amgalan, G.; Bilawal, A.; Hou, J.; Tian, B. Microwave irradiation treatment improved the structure, emulsifying properties and cell proliferation of laccase-crosslinked α-lactalbumin. Food Hydrocoll. 2021, 121, 107036. [Google Scholar] [CrossRef]
- Sakai, K.; Sato, Y.; Okada, M.; Yamaguchi, S. Improved functional properties of meat analogs by laccase catalyzed protein and pectin crosslinks. Sci. Rep. 2021, 11, 16631. [Google Scholar] [CrossRef] [PubMed]
- Kim, W.; Wang, Y.; Ye, Q.; Yao, Y.; Selomulya, C. Enzymatic cross-linking of pea and whey proteins to enhance emulsifying and encapsulation properties. Food Bioprod. Process. 2023, 139, 204–215. [Google Scholar] [CrossRef]
- Loi, M.; Glazunova, O.; Fedorova, T.; Logrieco, A.F.; Mulè, G. Fungal Laccases: The Forefront of Enzymes for Sustainability. J. Fungi 2021, 7, 1048. [Google Scholar] [CrossRef] [PubMed]
- AOAC International. Official Methods of Analysis, 21st ed.; AOAC International: Gaithersburg, MD, USA, 2019. [Google Scholar]
- Sato, A.C.K.; Perrechil, F.A.; Costa, A.A.S.; Santana, R.C.; Cunha, R.L. Cross-linking proteins by laccase: Effects on the droplet size and rheology of emulsions stabilized by sodium caseinate. Food Res. Int. 2015, 75, 244–251. [Google Scholar] [CrossRef] [PubMed]
- Le, T.T.; Nielsen, S.D.; Villumsen, N.S.; Kristiansen, G.H.; Nielsen, L.R.; Nielsen, S.B.; Hammershøj, M.; Larsen, L.B. Using proteomics to characterise storage-induced aggregates in acidic whey protein isolate drinks. Int. Dairy J. 2016, 60, 39–46. [Google Scholar] [CrossRef]
- Anandharamakrishnan, C.; Rielly, C.D.; Stapley, A.G.F. Effects of Process Variables on the Denaturation of Whey Proteins during Spray Drying. Dry. Technol. 2007, 25, 799–807. [Google Scholar] [CrossRef]
- Boye, J.I.; Aksay, S.; Roufik, S.; Ribéreau, S.; Mondor, M.; Farnworth, E.; Rajamohamed, S.H. Comparison of the functional properties of pea, chickpea and lentil protein concentrates processed using ultrafiltration and isoelectric precipitation techniques. Food Res. Int. 2010, 43, 537–546. [Google Scholar] [CrossRef]
- Havea, P. Protein interactions in milk protein concentrate powders. Int. Dairy J. 2006, 16, 415–422. [Google Scholar] [CrossRef]
- Tahmasian, A.; Broadbent, J.A.; Juhasz, A.; Nye-Wood, M.; Le, T.T.; Bose, U.; Colgrave, M.L. Evaluation of protein extraction methods for in-depth proteome analysis of narrow-leafed lupin (Lupinus angustifolius) seeds. Food Chem. 2022, 367, 130722. [Google Scholar] [CrossRef] [PubMed]
- Bradford, M.M. A rapid and sensitive method for the quantitation of microgram quantities of protein utilizing the principle of protein-dye binding. Anal. Biochem. 1976, 72, 248–254. [Google Scholar] [CrossRef] [PubMed]
- Ho, T.M.; Zhu, J.; Bansal, N.; Boyce, M.C.; Le, T.T. Effect of pH and heat treatment on physicochemical and functional properties of spray-dried whey protein concentrate powder. Int. Dairy J. 2021, 119, 105063. [Google Scholar] [CrossRef]
- Salazar, C.; Armenta, J.M.; Shulaev, V. An UPLC-ESI-MS/MS Assay Using 6-Aminoquinolyl-N-Hydroxysuccinimidyl Carbamate Derivatization for Targeted Amino Acid Analysis: Application to Screening of Arabidopsis thaliana Mutants. Metabolites 2012, 2, 398–428. [Google Scholar] [CrossRef] [PubMed]
- Abd El-Salam, M.; El-Shibiny, S.; Salem, A. Factors affecting the functional properties of whey protein products: A review. Food Rev. Int. 2009, 25, 251–270. [Google Scholar] [CrossRef]
- Farrag, A. Emulsifying and foaming properties of whey protein concentrates in the presence of some carbohydrates. J. Food Dairy Sci. 2007, 32, 6539–6549. [Google Scholar] [CrossRef]
- Devkota, L.; Kyriakopoulou, K.; Bergia, R.; Dhital, S. Structural and Thermal Characterization of Protein Isolates from Australian Lupin Varieties as Affected by Processing Conditions. Foods 2023, 12, 908. [Google Scholar] [CrossRef]
- Le, T.T. Thermal Denaturation and Aggregation of Whey Proteins. In Encyclopedia of Dairy Sciences, 3rd ed.; McSweeney, P.L.H., McNamara, J.P., Eds.; Academic Press: Cambridge, MA, USA, 2022; pp. 623–628. [Google Scholar] [CrossRef]
- Pazarlıoǧlu, N.K.; Sariişik, M.; Telefoncu, A. Laccase: Production by Trametes versicolor and application to denim washing. Process Biochem. 2005, 40, 1673–1678. [Google Scholar] [CrossRef]
- Dervas, G.; Doxastakis, G.; Hadjisavva-Zinoviadi, S.; Triantafillakos, N. Lupin flour addition to wheat flour doughs and effect on rheological properties. Food Chem. 1999, 66, 67–73. [Google Scholar] [CrossRef]
- McCarthy, K.; Lopetcharat, K.; Drake, M. Milk fat threshold determination and the effect of milk fat content on consumer preference for fluid milk. J. Dairy Sci. 2017, 100, 1702–1711. [Google Scholar] [CrossRef]
- Wei, S.-T.; Ou, L.-C.; Luo, M.R.; Hutchings, J.B. Optimisation of food expectations using product colour and appearance. Food Qual. Prefer. 2012, 23, 49–62. [Google Scholar] [CrossRef]
- Devkota, L.; Kyriakopoulou, K.; Fernandez, D.; Bergia, R.; Dhital, S. Techno-functional and rheological characterization of protein isolates from Australian lupin species as affected by processing conditions. Int. J. Food Sci. Technol. 2023, 59, 774–784. [Google Scholar] [CrossRef]
- Xiong, W.; Wang, Y.; Zhang, C.; Wan, J.; Shah, B.R.; Pei, Y.; Zhou, B.; Li, J.; Li, B. High intensity ultrasound modified ovalbumin: Structure, interface and gelation properties. Ultrason. Sonochemistry 2016, 31, 302–309. [Google Scholar] [CrossRef]
- Wang, W.; Zhong, Q.; Hu, Z. Nanoscale Understanding of Thermal Aggregation of Whey Protein Pretreated by Transglutaminase. J. Agric. Food Chem. 2013, 61, 435–446. [Google Scholar] [CrossRef]
- Zhu, G.; Li, Y.; Xie, L.; Sun, H.; Zheng, Z.; Liu, F. Effects of enzymatic cross-linking combined with ultrasound on the oil adsorption capacity of chickpea protein. Food Chem. 2022, 383, 132641. [Google Scholar] [CrossRef] [PubMed]
- Bader, S.; Bez, J.; Eisner, P. Can protein functionalities be enhanced by high-pressure homogenization?—A study on functional properties of lupin proteins. Procedia Food Sci. 2011, 1, 1359–1366. [Google Scholar] [CrossRef]
- Vogelsang-O’Dwyer, M.; Bez, J.; Petersen, I.L.; Joehnke, M.S.; Detzel, A.; Busch, M.; Krueger, M.; Ispiryan, L.; O’Mahony, J.A.; Arendt, E.K.; et al. Techno-Functional, Nutritional and Environmental Performance of Protein Isolates from Blue Lupin and White Lupin. Foods 2020, 9, 230. [Google Scholar] [CrossRef]
- McClements, D.J. Food Emulsions: Principles, Practices, and Techniques; CRC Press: Boca Raton, FL, USA, 2004. [Google Scholar]
- Fontanari, G.G.; Martins, J.M.; Kobelnik, M.; Pastre, I.A.; Arêas, J.A.G.; Batistuti, J.P.; Fertonani, F.L. Thermal studies on protein isolates of white lupin seeds (Lupinus albus). J. Therm. Anal. Calorim. 2012, 108, 141–148. [Google Scholar] [CrossRef]
- Xu, J.; Mohamed, A.A. Thermal and rheological properties of Lupinus albus flour. J. Am. Oil Chem. Soc. 2003, 80, 763–766. [Google Scholar] [CrossRef]
- Kiosseoglou, A.; Doxastakis, G.; Alevisopoulos, S.; Kasapis, S. Physical characterization of thermally induced networks of lupin protein isolates prepared by isoelectric precipitation and dialysis. Int. J. Food Sci. Technol. 1999, 34, 253–263. [Google Scholar] [CrossRef]
- Gui, Y.; Li, J.; Zhu, Y.; Guo, L. Roles of four enzyme crosslinks on structural, thermal and gel properties of potato proteins. LWT 2020, 123, 109116. [Google Scholar] [CrossRef]
- Anwar, S.H.; Kunz, B. The influence of drying methods on the stabilization of fish oil microcapsules: Comparison of spray granulation, spray drying, and freeze drying. J. Food Eng. 2011, 105, 367–378. [Google Scholar] [CrossRef]
- Wang, H.; Tong, X.; Yuan, Y.; Peng, X.; Zhang, Q.; Zhang, S.; Xie, C.; Zhang, X.; Yan, S.; Xu, J.; et al. Effect of Spray-Drying and Freeze-Drying on the Properties of Soybean Hydrolysates. J. Chem. 2020, 2020, 9201457. [Google Scholar] [CrossRef]
- Nivala, O.; Mäkinen, O.E.; Kruus, K.; Nordlund, E.; Ercili-Cura, D. Structuring colloidal oat and faba bean protein particles via enzymatic modification. Food Chem. 2017, 231, 87–95. [Google Scholar] [CrossRef] [PubMed]
- Schlangen, M.; Raak, N.; Dinani, S.T.; Corredig, M.; van der Goot, A.J. How fractionation procedure of mung bean protein affects transglutaminase crosslinking. Food Hydrocoll. 2023, 145, 109067. [Google Scholar] [CrossRef]
- Wang, Y.; Wang, Y.; Li, K.; Bai, Y.; Li, B.; Xu, W. Effect of high intensity ultrasound on physicochemical, interfacial and gel properties of chickpea protein isolate. LWT 2020, 129, 109563. [Google Scholar] [CrossRef]
- Grasberger, K.; Hammershøj, M.; Corredig, M. Lupin protein-stabilized oil droplets contribute to structuring whey protein emulsion-filled gels. Food Res. Int. 2024, 178, 113987. [Google Scholar] [CrossRef] [PubMed]
- Grasberger, K.; Hammershøj, M.; Corredig, M. Stability and viscoelastic properties of mixed lupin-whey protein at oil-water interfaces depend on mixing sequence. Food Hydrocoll. 2023, 138, 108485. [Google Scholar] [CrossRef]
- Raikos, V.; Neacsu, M.; Russell, W.; Duthie, G. Comparative study of the functional properties of lupin, green pea, fava bean, hemp, and buckwheat flours as affected by pH. Food Sci. Nutr. 2014, 2, 802–810. [Google Scholar] [CrossRef]
- Kumar, M.; Tomar, M.; Potkule, J.; Reetu; Punia, S.; Dhakane-Lad, J.; Singh, S.; Dhumal, S.; Chandra Pradhan, P.; Bhushan, B.; et al. Functional characterization of plant-based protein to determine its quality for food applications. Food Hydrocoll. 2022, 123, 106986. [Google Scholar] [CrossRef]
- Lqari, H.; Vioque, J.; Pedroche, J.; Millán, F. Lupinus angustifolius protein isolates: Chemical composition, functional properties and protein characterization. Food Chem. 2002, 76, 349–356. [Google Scholar] [CrossRef]
- Wouters, A.G.B.; Rombouts, I.; Fierens, E.; Brijs, K.; Blecker, C.; Delcour, J.A.; Murray, B.S. Foaming and air-water interfacial characteristics of solutions containing both gluten hydrolysate and egg white protein. Food Hydrocoll. 2018, 77, 176–186. [Google Scholar] [CrossRef]
- Partanen, R.; Paananen, A.; Forssell, P.; Linder, M.B.; Lille, M.; Buchert, J.; Lantto, R. Effect of transglutaminase-induced cross-linking of sodium caseinate on the properties of equilibrated interfaces and foams. Colloids Surf. A Physicochem. Eng. Asp. 2009, 344, 79–85. [Google Scholar] [CrossRef]
- Alves, A.C.; Martha, L.; Casanova, F.; Tavares, G.M. Structural and foaming properties of whey and soy protein isolates in mixed systems before and after heat treatment. Food Sci. Technol. Int. 2022, 28, 545–553. [Google Scholar] [CrossRef]
- WHO/FAO/UNU Expert Consultation. Protein and Amino Acid Requirements in Human Nutrition; WHO Technical Report Series; World Health Organization: Geneva, Switzerland, 2007; Volume 935, pp. 1–265. [Google Scholar]
- Stadtman, E.R.; Levine, R.L. Free radical-mediated oxidation of free amino acids and amino acid residues in proteins. Amino Acids 2003, 25, 207–218. [Google Scholar] [CrossRef]

| Attributes | LF | WPC |
|---|---|---|
| Moisture (%) | 6.66 ± 0.21 | 6.51 ± 0.05 |
| Ash (%) | 2.56 ± 0.08 | 3.79 ± 0.02 |
| Fat (%) | 5.72 ± 0.06 | 0.81 ± 0.01 |
| Protein (%) | 43.7 ± 0.90 | 65.06 ± 0.49 |
| Carbohydrate (%) | 43.26 ± 0.13 | 23.83 ± 0.51 |
| pH | 5.72 ± 0.01 | 6.16 ± 0.01 |
| Sample | Colour | |||
|---|---|---|---|---|
| L* | a* | b* | Difference ∆E | |
| LF | 83.95 ± 0.66 cd | −0.27 ± 0.08 b | 31.76 ± 1.23 a | - |
| WPC | 85.51 ± 1.43 b | −0.01 ± 0.37 b | 12.49 ± 0.66 d | - |
| LW-C | 87.64 ± 0.40 ab | −1.63 ± 0.28 c | 21.33 ± 0.41 c | 0 a |
| LW-LR | 88.74 ± 0.32 a | −1.56 ± 0.03 c | 19.85 ± 0.72 c | 0.61 ± 0.49 a |
| LW-LT | 82.40 ± 0.62 d | 0.76 ± 0.28 a | 20.95 ± 0.68 c | 9.03 ± 6.3 b |
| LW-TG | 86.20 ± 0.87 b | −1.49 ± 0.15 c | 24.50 ± 0.25 b | 0.52 ± 0.12 a |
| Samples | Particle Size | Protein Denaturation | ||||
|---|---|---|---|---|---|---|
| D[4,3], µm | D[3,2], µm | Onset, °C | Peak, °C | Endpoint, °C | ∆H (J/g) | |
| LF | 111.5 ± 9.2 a | 11.5 ± 0.2 a | 81.5 ± 2.1 a | 83.9 ± 0.2 a | 88.3 ± 0.3 a | 0.15 ± 0.03 a |
| WPC | 42.1 ± 6.1 b | 0.2 ± 0.0 b | 60.6 ± 1.0 b | 73.2 ± 0.1 b | 82.0 ± 1.4 b | 0.76 ± 0.03 b |
| LW-C | 34.1 ± 0.2 b | 18.6 ± 0.1 c | 73.7 ± 1.0 a | 84.5 ± 0.4 a | 90.1 ± 0.3 a | 0.17 ± 0.02 a |
| LW-LR | 31.5 ± 6.1 b | 12.5 ± 3.7 a | 73.4 ± 1.2 a | 83.6 ± 1.6 a | 90.1 ± 2.0 a | 0.23 ± 0.02 a |
| LW-LT | 30.7 ± 4.2 b | 13.5 ± 0.2 ac | 77.7 ± 1.6 c | 84.7 ± 1.3 a | 91.5 ± 2.3 a | 0.23 ± 0.08 a |
| LW-TG | 42.7 ± 4.7 b | 15.9 ± 0.4 a | 78.2 ± 1.3 c | 85.2 ± 2.8 a | 89.5 ± 3.5 a | 0.19 ± 0.03 a |
| Sample | Soluble Protein Content (%) | Emulsion Ability (%) | Emulsion Stability (%) | Foaming Ability (%) | Foaming Stability (%) |
|---|---|---|---|---|---|
| LF | 59.00 ± 5.29 d | 26.66 ± 1.05 c | 97.97 ± 3.52 a | 65.00 ± 0 d | 88.50 ± 0 a |
| WPC | 98.20 ± 0.24 a | 90.30 ± 1.05 a | 99.33 ± 1.15 a | 169.60 ± 5.05 a | 7.37 ± 0.25 d |
| LW-C | 78.50 ± 5.49 bc | 30.30 ± 1.05 b | 82.13 ± 5.5 b | 126.67 ± 2.89 c | 19.73 ± 0.46 bc |
| LW-LR | 91.00 ± 9.75 ab | 26.06 ± 1.05 c | 97.63 ± 4.1 a | 142.50 ± 0 b | 18.10 ± 1.04 c |
| LW-LT | 75.20 ± 5.12 c | 24.24 ± 1.05 c | 100.00 ± 0 a | 140.00 ± 2.50 b | 8.93 ± 0.15 d |
| LW-TG | 73.70 ± 5.85 c | 27.27 ± 1.82 bc | 89.17 ± 6.82 ab | 120.83 ± 3.82 c | 20.63 ± 1.46 b |
| Sample | LF | WPC | LW-C | LW-LR | LW-LT | LW-TG |
|---|---|---|---|---|---|---|
| Alanine | 3.50 ± 0.5 b | 5.91 ± 0.7 a | 5.40 ± 1.1 a | 5.00 ± 0.5 ab | 4.48 ± 0.3 ab | 5.39 ± 0.4 ab |
| Arginine | 8.98 ± 0.9 a | 1.63 ± 0.1 c | 5.72 ± 1.6 b | 4.64 ± 0.4 b | 4.26 ± 0.4 bc | 6.32 ± 1.8 ab |
| Aspartic acid 1 | 11.24 ± 2.0 a | 12.24 ± 1.1 a | 13.13 ± 2.5 a | 12.47 ± 1.5 a | 10.80 ± 0.8 a | 13.21 ± 1.0 a |
| Cystine | 0.26 ± 0.1 c | 0.86 ± 0.1 a | 0.62± 0.2 ab | 0.59 ± 0.1 ab | 0.43 ± 0.1 bc | 0.58 ± 0.1 ab |
| Glutamic acid 2 | 22.50 ± 3.3 a | 18.80 ± 2.0 a | 22.42 ± 3.9 a | 22.95 ± 5.2 a | 18.70 ± 1.1 a | 22.48 ± 2.2 a |
| Glycine | 4.31 ± 0.9 a | 1.94 ± 0.2 c | 3.43 ± 0.7 ab | 3.03 ± 0.2 abc | 2.66 ± 0.1 bc | 3.23 ± 0.3 abc |
| Histidine * | 4.09 ± 0.9 a | 2.55 ± 0.1 a | 3.49 ± 0.8 a | 3.31 ± 0.8 a | 2.65 ± 0.4 a | 3.11 ± 0.4 a |
| Isoleucine * | 3.55 ± 0.5 a | 5.43 ± 0.4 a | 5.03 ± 0.8 a | 4.86 ± 0.5 ab | 4.19 ± 0.2 ab | 5.04 ± 0.5 a |
| Leucine * | 6.63 ± 0.2 c | 10.48 ± 0.5 a | 8.69 ± 0.6 b | 8.83 ± 0.4 b | 9.22 ± 0.5 ab | 9.70 ± 0.4 ab |
| Lysine * | 7.44 ± 1.2 b | 12.14 ± 1.3 a | 11.25 ± 1.8 a | 10.39 ± 0.8 ab | 9.12 ± 0.7 ab | 10.94 ± 1.3 a |
| Methionine * | ND | ND | ND | ND | ND | ND |
| Phenylalanine * | 4.41 ± 0.8 a | 3.60 ± 0.4 a | 4.73 ± 0.9 a | 4.22 ± 0.5 a | 3.42 ± 0.2 a | 4.04 ± 0.6 a |
| Proline | 4.65 ± 0.8 a | 6.78 ± 0.7 a | 6.59 ± 1.2 a | 6.19 ± 0.8 a | 5.31 ± 0.3 a | 6.43 ± 0.6 a |
| Serine | 5.57 ± 0.9 a | 5.55 ± 0.5 a | 6.33 ± 1.3 a | 5.74 ± 0.6 a | 4.96 ± 0.3 a | 6.01 ± 0.7 a |
| Threonine * | 3.87 ± 0.6 c | 7.57 ± 0.8 a | 6.69 ± 1.3 ab | 6.24 ± 0.6 ab | 5.41 ± 0.4 bc | 6.52 ± 0.7 ab |
| Tryptophan * | ND | ND | ND | ND | ND | ND |
| Tyrosine | 3.50 ± 0.8 a | 2.73 ± 0.3 a | 3.58 ± 0.6 a | 3.29 ± 0.5 a | 2.51 ± 0.2 a | 3.12 ± 0.4 a |
| Valine * | 3.42 ± 0.5 b | 5.11 ± 0.5 a | 4.89 ± 0.8 a | 4.59 ± 0.4 ab | 4.02 ± 0.2 ab | 4.74 ± 0.6 ab |
| Total EAA | 33.41 | 46.88 | 44.77 | 42.44 | 38.03 | 44.09 |
| Total non-EAA | 64.51 | 56.44 | 67.22 | 63.9 | 54.11 | 66.77 |
Disclaimer/Publisher’s Note: The statements, opinions and data contained in all publications are solely those of the individual author(s) and contributor(s) and not of MDPI and/or the editor(s). MDPI and/or the editor(s) disclaim responsibility for any injury to people or property resulting from any ideas, methods, instructions or products referred to in the content. |
© 2024 by the authors. Licensee MDPI, Basel, Switzerland. This article is an open access article distributed under the terms and conditions of the Creative Commons Attribution (CC BY) license (https://creativecommons.org/licenses/by/4.0/).
Share and Cite
Santoso, T.; Ho, T.M.; Vinothsankar, G.; Jouppila, K.; Chen, T.; Owens, A.; Lazarjani, M.P.; Farouk, M.M.; Colgrave, M.L.; Otter, D.; et al. Effects of Laccase and Transglutaminase on the Physicochemical and Functional Properties of Hybrid Lupin and Whey Protein Powder. Foods 2024, 13, 2090. https://doi.org/10.3390/foods13132090
Santoso T, Ho TM, Vinothsankar G, Jouppila K, Chen T, Owens A, Lazarjani MP, Farouk MM, Colgrave ML, Otter D, et al. Effects of Laccase and Transglutaminase on the Physicochemical and Functional Properties of Hybrid Lupin and Whey Protein Powder. Foods. 2024; 13(13):2090. https://doi.org/10.3390/foods13132090
Chicago/Turabian StyleSantoso, Teguh, Thao M. Ho, Geerththana Vinothsankar, Kirsi Jouppila, Tony Chen, Adrian Owens, Masoumeh Pourseyed Lazarjani, Mustafa M. Farouk, Michelle L. Colgrave, Don Otter, and et al. 2024. "Effects of Laccase and Transglutaminase on the Physicochemical and Functional Properties of Hybrid Lupin and Whey Protein Powder" Foods 13, no. 13: 2090. https://doi.org/10.3390/foods13132090
APA StyleSantoso, T., Ho, T. M., Vinothsankar, G., Jouppila, K., Chen, T., Owens, A., Lazarjani, M. P., Farouk, M. M., Colgrave, M. L., Otter, D., Kam, R., & Le, T. T. (2024). Effects of Laccase and Transglutaminase on the Physicochemical and Functional Properties of Hybrid Lupin and Whey Protein Powder. Foods, 13(13), 2090. https://doi.org/10.3390/foods13132090