Article

Use of Transcriptomics to Reveal the Joint Immunotoxicity Mechanism Initiated by Difenoconazole and Chlorothalonil in the Human Jurkat T-Cell Line

1
Institute of Quality Standards and Testing Technology for Agro-Products, Chinese Academy of Agricultural Sciences, Beijing 100081, China
2
College of Food and Biological Engineering, Chengdu University, Chengdu 610106, China
*
Author to whom correspondence should be addressed.
These authors contributed equally to this work.
Foods 2024, 13(1), 34; https://doi.org/10.3390/foods13010034 (registering DOI)
Submission received: 14 November 2023 / Revised: 16 December 2023 / Accepted: 19 December 2023 / Published: 21 December 2023
(This article belongs to the Special Issue Food Contaminants: Detection, Toxicity and Safety Risk Assessment)

Abstract

:
It is very important to evaluate the immunotoxicity and molecular mechanisms of pesticides. In this study, difenoconazole and chlorothalonil were evaluated for immunotoxicity by using the human Jurkat T-cell line, and the EC50 were 24.66 and 1.17 mg/L, respectively. The joint exposure of difenoconazole and chlorothalonil showed a synergistic effect at low concentrations (lower than 10.58 mg/L) but an antagonistic effect at high concentrations (higher than 10.58 mg/L). With joint exposure at a concentration of EC10, the proportion of late apoptotic cells was 2.26- and 2.91-fold higher than that with exposure to difenoconazole or chlorothalonil alone, respectively. A transcriptomics analysis indicated that the DEGs for single exposure are associated with immunodeficiency disease. Single exposure to chlorothalonil was mainly involved in cation transportation, extracellular matrix organization, and leukocyte cell adhesion. Single exposure to difenoconazole was mainly involved in nervous system development, muscle contraction, and immune system processes. However, when the joint exposure dose was EC10, the DEGs were mainly involved in the formation of cell structures, but the DEGs were mainly involved in cellular processes and metabolism when the joint exposure dose was EC25. The results indicated that the immunotoxicological mechanisms underlying joint exposure to difenoconazole and chlorothalonil are different under low and high doses.

1. Introduction

The use of pesticides is the most direct, economic, and effective measure to prevent and control pests, fungi, and rodents in modern agricultural production. They can also serve as plant regulators for promoting plant growth or inhibiting weed growth [1]. Without pesticides, the food supply would be insufficient to meet the growth of the world population and the loss of farmland [2]. However, the long-term and continuous spraying of pesticides will make pests resistant; thus, many new pesticides are developed and applied to crops [2], which causes an increasing number of pesticide residues and their degradations to enter the environment and food matrices, accumulate in human tissue, and pose a potential threat to human health [3]. Therefore, it is vital to carry out pesticide toxicity studies and fully understand the toxicity mechanism and endpoint of pesticides because it plays an important role in safety assessment and guiding the application of pesticides.
Currently, pesticide toxicity studies mainly focus on teratogenic effects, oxidative stress, endocrine disruption, neurotoxicity, reproductive toxicity, and cardiotoxicity [4,5,6]. Although in the mid-1970s, the relevant departments of many countries tried to formulate evaluation strategies for immunotoxicity [7], research on the immunotoxicity of pesticides is still insufficient. Substances with immunotoxicity will cause adverse effects to the body, such as decreased immunocompetence, inappropriate immunostimulation, tissue inflammation, and organ damage [8]. The first two effects are specific immunity, and the third is nonspecific immunity. The immune system is the first barrier of the human body to foreign hazards. Generally, a low-dose exposure to pesticides may not induce cytotoxicity but interferes with many kinds of general or immune-specific signaling pathways and alters cell function [8,9,10]. These effects are potential and not obvious, but the dysregulation of the immune system by pesticides may be highly associated with a predisposition to different types of disease because the immune system is responsible for the defense against disease [11]. Therefore, it is very important to evaluate the immunotoxicity and molecular mechanisms of pesticides.
Currently, pesticide risk assessments are mostly based on toxicity evaluations of single chemical agents [12]. However, due to the spraying of multiple pesticides and the accumulation of different food chains, human populations are usually exposed to a combination of two or more different pesticides simultaneously through their foods [13,14]. When humans are exposed to multiple pesticides at the same time, joint toxicity may occur. The joint toxic effects are mainly caused by the physicochemical properties, physiology characteristics, toxic endpoint, and ecological behaviors of the pesticides, including independent effects, potentiating effects, synergistic effects, and antagonistic effects [15]. Even more complicated, these effects coexist in different concentration ranges of the same pesticide combinations [16]. Therefore, studying the possible joint toxicity of different pesticides is of great significance for accurately understanding the risks of pesticide mixtures [12].
Classical toxicological studies are performed by using animal experiments [17]. This approach is costly, time-consuming, and under constant review [18]. Therefore, there is a strong need for a rapid mechanism-based strategy for risk assessment by using cell lines [19]. In this context, toxicogenomics (such as transcriptomics, epigenomics, or metabolomics, etc.) has made a promising contribution to risk assessment in the past two decades [18]. Using the toxicogenomics method, human cell lines are usually chosen as an up-to-date in vitro model of human organs, in connection with phenotypic evaluation and transcriptomics analysis, to unravel potential toxic properties. This strategy could be used to decide whether to terminate or continue animal experiments, matching the need to apply the ‘3Rs’ concept (replacement, reduction, and refinement) [19]. Among the cell lines, the human Jurkat T-cell line is frequently used in immunotoxicity evaluation because of its well-established reliability. Previously, Lee et al. [20] assessed the immunotoxicity of fludioxonil by using the human Jurkat T-cell line, and found that fludioxonil could induce immunotoxicity through apoptosis and cell cycle arrest. Therefore, in the present study, an in vitro model system human Jurkat T-cell line was chosen to assess the immunotoxicity of typical pesticides in leaf vegetables. Two pesticides, difenoconazole and chlorothalonil, were found to have immunotoxicity. Therefore, single and joint immunotoxicity and their mechanisms were evaluated by using the transcriptomics method. To our knowledge, this is the first study to use a human immune cell line to evaluate the joint immunotoxicity of pesticides based on a transcriptomics method.

2. Materials and Methods

2.1. Chemicals and Reagents

All pesticides shown in Table S1 were obtained from Alta Scientific Ltd. (Tianjin, China). A 11,000 mg/L stock solution of the pesticides was prepared in acetone (Merck & Co., Darmstadt, Germany) and maintained at −80 °C. RPMI-1640 medium, penicillin/streptomycin, phosphate-buffered saline (PBS), and fetal bovine serum (FBS) were all obtained from HyClone (Logan, UT, USA). The Cell Counting Kit-8 was obtained from Dojindo (Kumamoto, Japan). The Annexin V-FITC/PI detection kit was obtained from Abbkine (Wuhan, China). The Mycoplasma Stain Kit was obtained from Sigma Aldrich (Saint Louis, MO, USA), the TruSeqTM RNA sample preparation Kit was obtained from Illumina (San Diego, CA, USA), and the PrimeScript RT Reagent Kit was obtained from Beyotime Biotechnology (Shanghai, China). Unless otherwise stated, the other reagents used in this study were of the highest purity available.

2.2. Jurkat Cell Culture

The human T-lymphocyte cell line (Jurkat T cells) was purchased from the American Type Culture Collection (ATCC TIB-152, Manassas, VA, USA). After resuscitation, 2 × 10⁴ cells were inoculated in a 25 cm2 cell culture flask containing 10 mL RPMI-1640 medium, 10% (v/v) heat-inactivated FBS, 100 U/mL penicillin sodium, and 100 μg/mL streptomycin solution. The cells were cultured in a cell culture incubator containing 5% CO2 at 37 °C, maintained in the exponential growth phase by subculture 2–3 d intervals, and then used for subsequent experiments. The absence of mycoplasma was checked routinely using the Mycoplasma Stain Kit [21].

2.3. Immunotoxicity Evaluation of Single Pesticide Exposure

The immunotoxicity of single pesticide exposure was evaluated through cell viability assessment using the Cell Counting Kit-8 (CCK-8) (Dojindo, Kumamoto, Japan) according to the manufacturer’s instructions. Briefly, 100 μL of activated Jurkat T cells was seeded into a 96-well plate (2 × 10⁴ cells/well) and exposed for 36 h to a single pesticide at final concentrations of 0.5, 5, 25, 50, 100, 250, and 500 mg/L. The final dissolvent (acetone) concentration was adjusted to the same concentration and less than 0.1%, which exerted no effect on cell viability [21]. The cells exposed to 0.1% sterile ultrapure water and acetone were used as the blank and control groups, respectively. After exposure, a 10% (v/v) CCK-8 solution was added to the well and re-incubated for 2 h [21]. Absorbance was measured at 450 nm in a ReadMax 500F enzyme-labeled instrument (Shanpu Biotechnology Co., Ltd., Shanghai, China). Cell viability was calculated as Equation (1).
C e l l   v i a b i l i t y = A 1 A 2 A 3 A 2
where A1 is the absorbance of the test group, A2 is the absorbance of the blank group, and A3 is the absorbance of the control group. Concentration–response curves were plotted, and the 50%, 25%, and 10% effective concentration (EC50, EC25, and EC10, respectively) values were then calculated using a sigmoidal dose–response curve equation [22].

2.4. Joint Immunotoxicity Evaluation

The combined effects of difenoconazole and chlorothalonil were predicted according to the description of Chou et al. [23] by using a combination index (CI) model derived from the median effect principle. The cells were exposed to single and mixed pesticides with constant ratio combinations (0.5×, 0.75×, 1×, 1.5×, and 2 × EC50), and the cell viability was measured. The cell viabilities were introduced into CompuSyn software (version 1.0) to calculate the CI. CI < 1, =1, and >1 indicate synergism, additive effect, and antagonism, respectively.

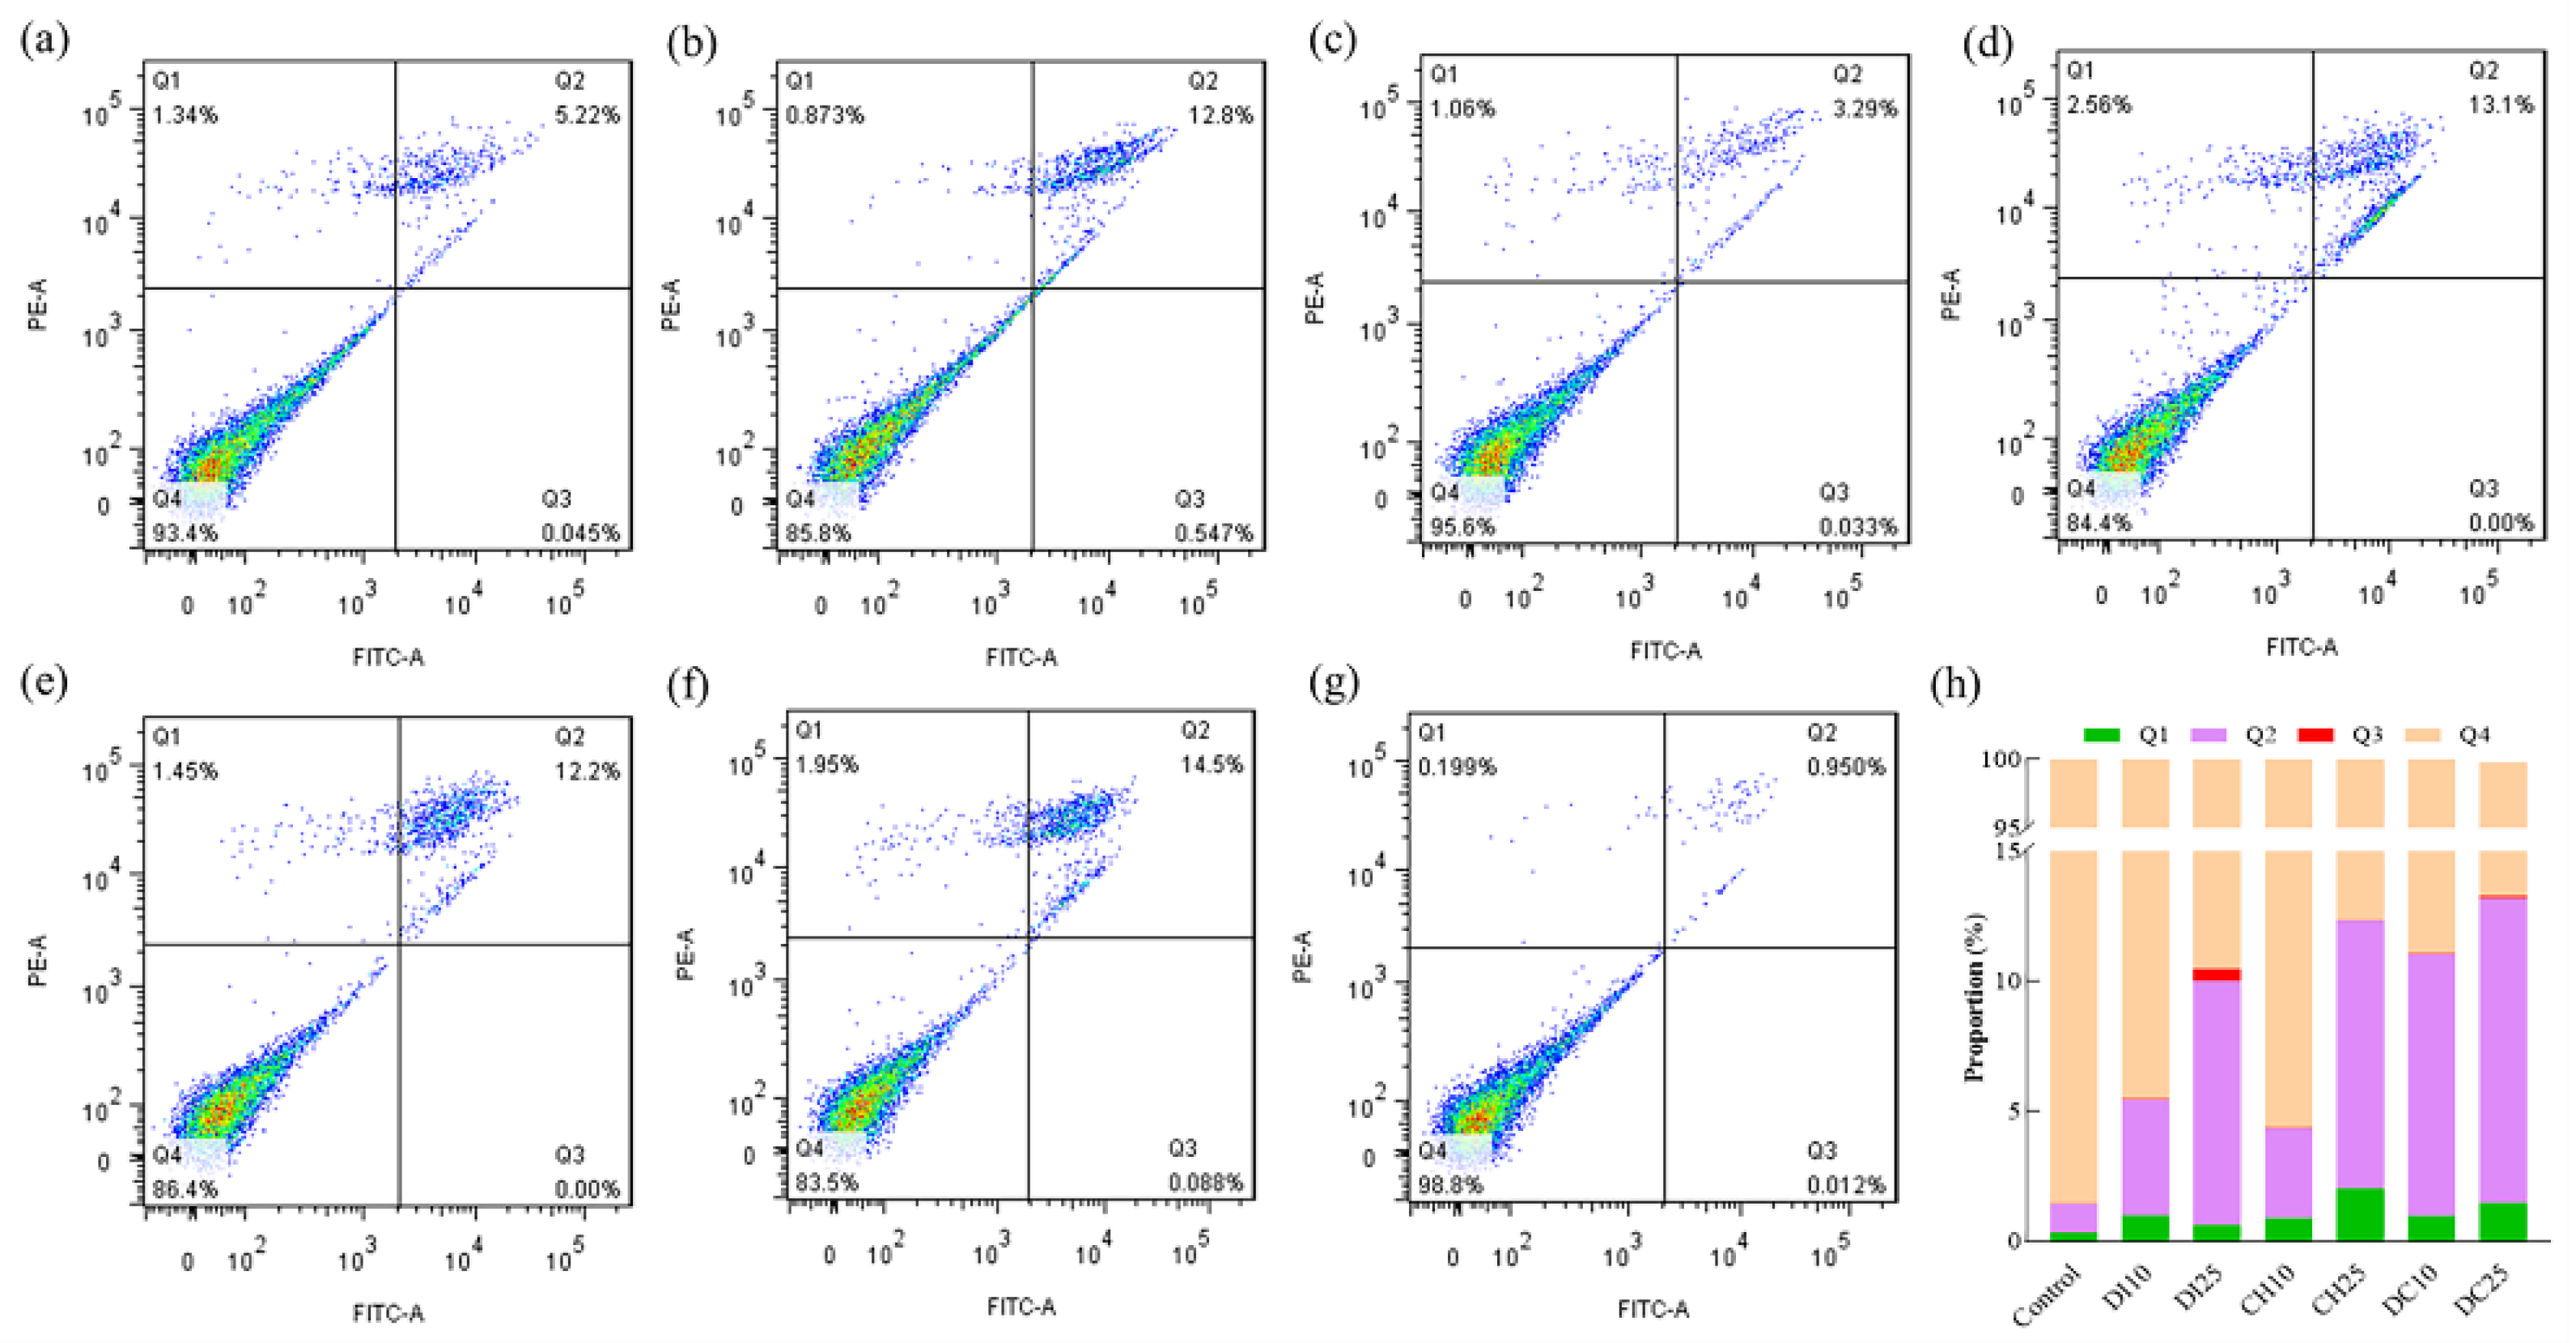
2.5. Cell Apoptosis Analysis

Cell apoptosis was evaluated according to the description of Verschoor et al. [24] by using an Annexin V-FITC/PI detection kit. Four milliliters of Jurkat T cells were seeded into a 6-well plate (2 × 10⁵ cells/mL) and exposed for 36 h to single (difenoconazole or chlorothalonil) or mixed pesticides (difenoconazole and chlorothalonil) at final concentrations of EC50, EC25, and EC10. The cells were collected and washed using PBS buffer to remove the medium, and then they were resuspended in binding buffer and incubated with Annexin V-FITC solution and PI solution at room temperature for 15 min. Apoptotic cells were detected using a MoFlo AstriosEQ flow cytometer (Beckman Coulter, Inc., Brea, CA, USA).

2.6. RNA Extraction and Sequencing

The activated Jurkat T cells were inoculated in a 75 cm2 cell culture flask with 60 mL medium at an initial concentration of 5 × 10⁶ cells/bottle and exposed for 36 h to single or mixed pesticides at final concentrations of EC10 and EC25, respectively. Upon removal of the culture medium after exposure, the cells were disrupted and homogenized in TRIzol® reagent (Thermo Fisher, Waltham, MA, USA), and then RNA was isolated according to the operating manual [21]. Genomic DNA was eliminated using DNase I (TaKaRa, Dalian, China). Then, the RNA quality was evaluated using an RNA 6000 Nano LabChip Kit and a 2100 Bioanalyzer (Agilent Technologies, Santa Clara, CA, USA). The RNA quantity was determined using the NanoDrop ND-2000 (Waltham, MA, USA). Only RNA samples meeting the quality requirements for library construction (OD260/280 = 1.8~2.2, OD260/230 ≥ 2.0, RIN ≥ 6.5, 28S:18S ≥ 1.0, >1 μg) were applied to construct the sequencing library.
The transcription library was prepared according to the operating manual of the TruSeqTM RNA sample preparation kit. The libraries were size-selected for cDNA target fragments of 300 bp on 2% Low Range Ultra Agarose followed by PCR amplification using Phusion DNA polymerase (NEB, Waltham, MA, USA) for 15 PCR cycles [21]. After quantification using TBS-380 (Turner BioSystems, Inc. Sunnyvale, CA, USA), a paired-end RNA sequencing library was obtained by using a Nova Seq 6000 sequencer (2 × 150 bp read length).

2.7. Read Mapping and Differentially Expressed Gene Analysis

The raw paired-end reads were trimmed and quality controlled by SeqPrep (https://github.com/jstjohn/SeqPrep, accessed on 25 January 2022) and Sickle (https://github.com/najoshi/sickle, accessed on 25 January 2022) with default parameters. The clean reads of each sample were sequenced and aligned with the specified reference genome (Homo_sapiens, http://asia.ensembl.org/Homo_sapiens/Info/Index, accessed on 25 January 2022). The mapped reads of the sample were assembled using StringTie (https://ccb.jhu.edu/software/stringtie/index.shtmlt=example, accessed on 25 January 2022) in a reference-based approach [25].
To identify differentially expressed genes (DEGs), the expression level of each transcript was normalized according to the fragments per kilobases per million reads (FPKM). RSEM (http://deweylab.biostat.wisc.edu/rsem/, accessed on 13 March 2022) [26] was applied to quantify gene abundances. Essentially, differential expression analysis was performed using DESeq2 [27], with |log2FC| ≥ 1 and p value ≤ 0.05 regarded to be DEGs. Functional enrichment analysis, including gene ontology (GO, http://www.geneontology.org, accessed on 15 March 2022) and Kyoto Encyclopedia of Genes and Genomes (KEGG, http://www.genome.jp/kegg/, accessed on 15 March 2022) analysis, was performed to identify which DEGs were significantly enriched in GO terms and metabolic pathways [28].

2.8. Quantitative Real-Time PCR (qRT–PCR)

Total RNA from Jurkat T cells without exposure and with single (difenoconazole or chlorothalonil) or joint pesticide (difenoconazole and chlorothalonil) exposure for 36 h was used for qRT–PCR analysis. The glyceraldehyde-3-phosphate dehydrogenase encoded gene GAPDH was used as the reference gene, and the expression values of the genes were normalized on the relative expression of GAPDH. The primers were designed with Sangon Biotech (https://www.sangon.com/, (accessed on 9 August 2023) and are presented in Supplementary Table S2. The total RNA was reverse-transcribed according to the instruction of the PrimeScript RT Reagent Kit (Takara, Osaka, Japan) with gDNA Eraser. The reactions were prepared on a StepOne PlusTM Real-time PCR detection system (ABI, Norwalk, CT, USA), with a total volume of 10 μL reaction: 3 μL of 1:2 diluted template, 1 μL of each primer (5 μM), and 5 μL of 2× Fast SYBR® Green Master Mix (ABI). Baseline, threshold cycles (Ct), and statistical analysis were automatically determined using the StepOne PlusTM Software version 2.3 (ABI), and the 2−ΔΔCT method was applied to analyze the relative gene expression levels [3].

2.9. Statistical Analysis

The transcriptomics analysis was performed in six biologically independent experiments (n = 6), and the other analyses were conducted in three independent experiments (n = 3). The GO enrichment analysis was performed using goatools software (version 0.6.5). R statistical package software (version 1.6.2) was applied for unsupervised principal component analysis (PCA) and hierarchical clustering analysis. Data were recorded as the mean ± SD. All statistical analyses were performed using SPSS version 18.0 software (IBM). The values were compared with one-way ANOVA followed by Duncan’s test. p < 0.05 was considered statistically significant.

3. Results and Discussion

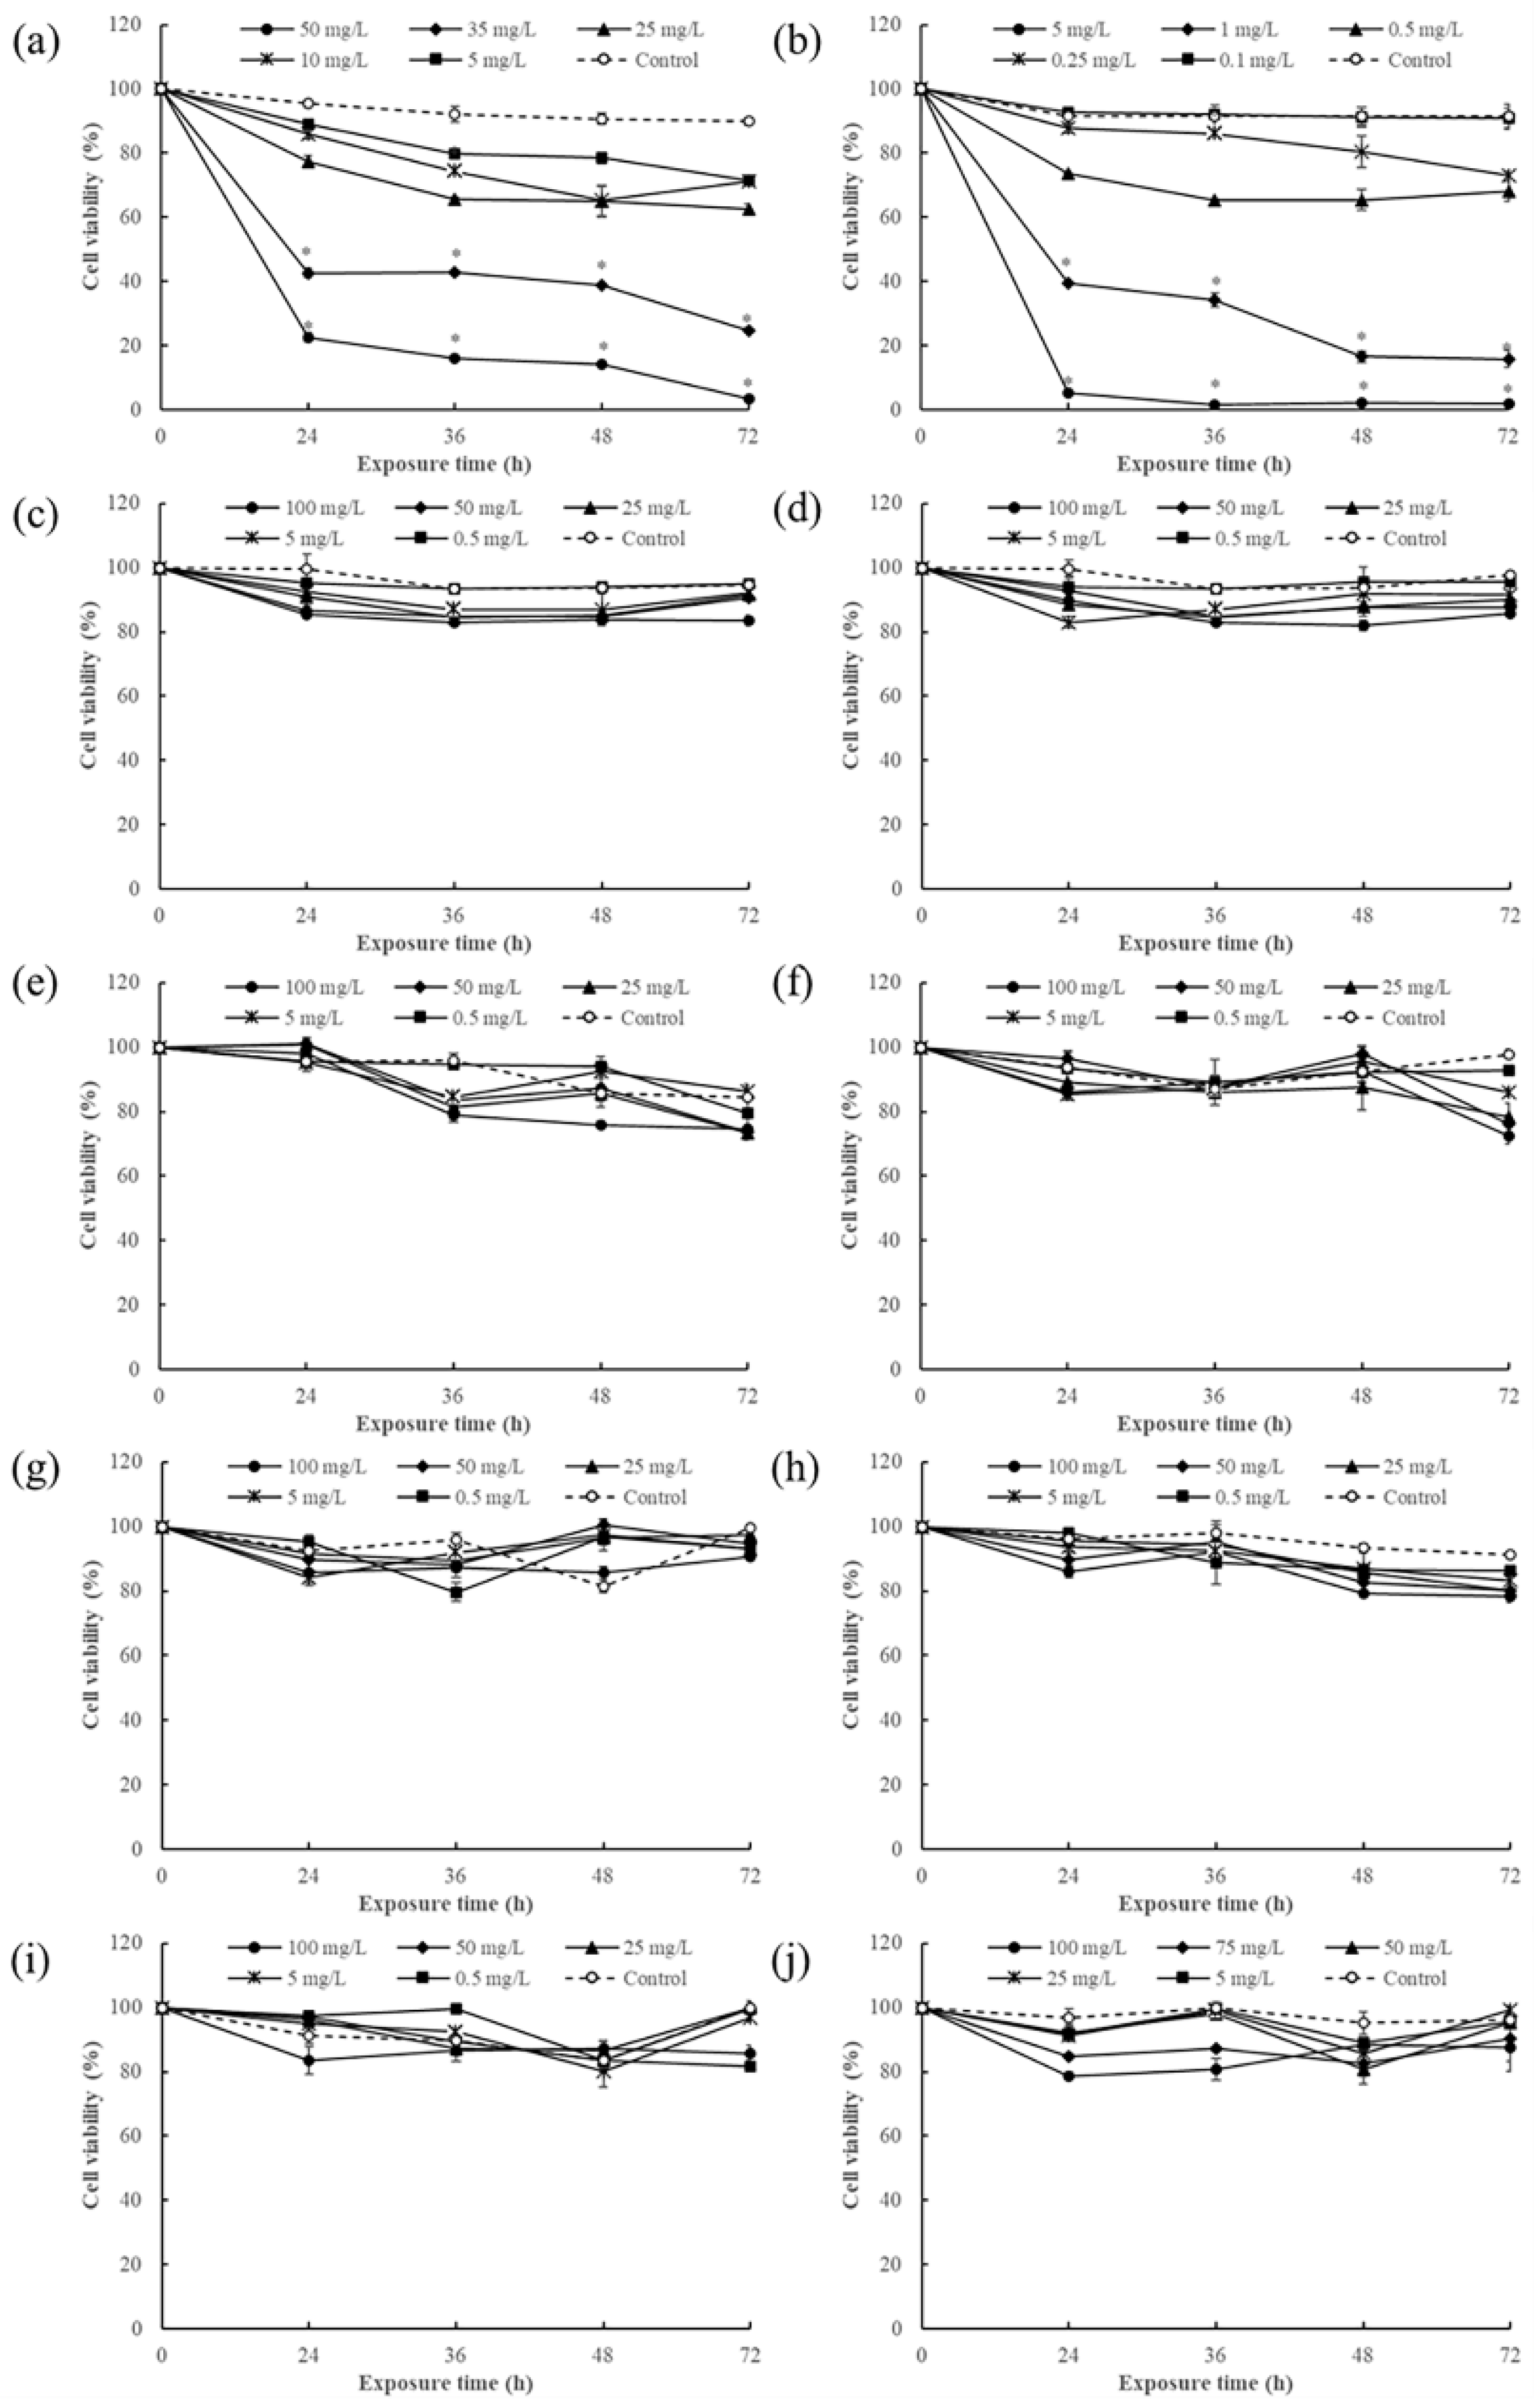
3.1. Immunotoxicity Screening of Pesticides Based on Human Jurkat Cells

Toxicological evaluation has important guiding significance for the scientific application of pesticides during agricultural production and the protection of human health [3]. The immune system is the first line of defense against foreign hazardous chemicals within the human body [21], so immunotoxicity evaluations of pesticide residues are very important for a comprehensive pesticide residue risk assessment. In the present study, the immunotoxicity of nine commonly used pesticides in vegetable farming (difenoconazole, chlorothalonil, bifenthrin, cypermethrin, dimethoate, omethoate, imidacloprid, acetamiprid, and iprodione) and one prohibited but often detected pesticide (chlorpyrifos) were investigated by using human Jurkat cells. As shown in Figure 1, eight pesticides (bifenthrin, cypermethrin, dimethoate, omethoate, imidacloprid, acetamiprid, iprodione, and chlorpyrifos) did not show significant cytotoxicity under exposure concentration and time. However, two pesticides (difenoconazole and chlorothalonil) showed obvious inhibitory effects on Jurkat cell growth in a dose- and time-dependent manner.

3.2. Effect of Single Pesticide Exposure on Cell Viability

As shown in Figure 2a,b, cell activity gradually decreased with increasing concentrations of difenoconazole and chlorothalonil. The 50% effective concentration (EC50) values according to the sigmoidal dose–response curve equation for difenoconazole and chlorothalonil were 24.66 and 1.17 mg/L, respectively (Figure 2c,d), and further verification tests were also consistent with the model calculation results. The cell viabilities for difenoconazole and chlorothalonil under EC50 concentrations were 48.4% and 56.3%, respectively (Figure 2c). A previous study indicated that difenoconazole and chlorothalonil are carcinogens for humans, and they can induce embryonic and developmental toxicity, as well as estrogenic endocrine-disrupting effects for aquatic animals [29]. Liu et al. [30] and Guerreiro et al. [31] pointed out that difenoconazole and chlorothalonil exposure could induce immunotoxicity in carp and marine bivalves. However, few studies have reported that difenoconazole has potential immunotoxicity in humans. According to our results, these two pesticides have potential immunotoxicity to the human body.

3.3. Effects of Combined Exposure to Difenoconazole and Chlorothalonil on Cell Viability

Many studies have pointed out that when humans are simultaneously exposed to some pesticides, the toxicity of pesticides may be enhanced or weakened [15]. Therefore, the combined toxicities of pesticides have gradually received attention in recent years. As shown in Figure 2f, the CI values ranged from 0.47 to 0.96 at low total dose exposures (2.06~9.05 mg/L), which indicated that the combined effect was synergistic at low concentrations. When the combination concentration was increased to 10.58 mg/L, the CI values were higher than 1, indicating that an antagonistic effect existed at high total dose exposures. Different pesticide combinations have different combined toxicities at different concentrations, which has been reported in previous studies [6]. It is generally considered that the combined effects of pesticides may be related to the interactions between pesticides or the target and modes of action [15]. However, why different concentrations of the same pesticide combinations exhibit different combined toxicities needs further exploration.

3.4. Effects of Pesticide Exposure on Cell Apoptosis

As shown in Figure 3, pesticide exposure resulted in a significant increase in cell death and apoptosis compared with the control group. At low exposure concentrations (the EC10 dose), the proportion of late apoptotic cells in the difenoconazole group was slightly higher than that in the chlorothalonil group. However, when the cells were jointly exposed to the two pesticides, the proportion of late apoptotic cells was 2.26- and 2.91-fold higher than that after exposure to difenoconazole or chlorothalonil alone, respectively (Figure 3h). This result indicated that the combined exposure to difenoconazole and chlorothalonil has a synergistic effect on Jurkat T cells, which is consistent with the cell viability assessment results. However, under high exposure concentrations (dose of EC25), the proportion of cell apoptosis significantly increased compared to that of the control and low exposure concentrations. Although the apoptosis rate of the combined exposure group (average of 11.69%) was higher than that of the single exposure group (average of 10.30% and 9.38% for difenoconazole and chlorothalonil, respectively), this difference was not significant (Figure 3h), indicating that the synergistic effect was weakened or even antagonistic, which is also consistent with the cell viability assessment results.

3.5. Transcriptomics Analysis

3.5.1. Overview

The immune system can affect the function of various organs in the human body, so the potential immunotoxicity caused by pesticides should be taken seriously [32]. Presently, there are few studies on the immunotoxicity mechanism of pesticides [21]. Therefore, in the present study, transcriptomics was used to examine the effects of single and joint exposure to difenoconazole and chlorothalonil on the gene expression of Jurkat T cells. As shown in Tables S3 and S4, the OD260/280 and OD260/230 were in the range of 1.91~1.99 and 2.23~2.30, respectively, which indicates good RNA quality. During RNA sequencing, the error rate was less than 0.03%, and the Q30 base was higher than 93%, which suggests that the quality of the sequencing was high enough for further analysis [21].
In total, 16,751 and 16,889 genes were identified under exposure concentrations of EC10 and EC25 (Figure 4a,b), respectively. The PCA results indicated that the identified genes can distinguish samples from different groups (Figure 4c,d). Under an exposure dose of EC10, the chlorothalonil group and joint exposure group are close together, which may be because in the joint exposure group, the toxicity of chlorothalonil dominates. Under an exposure dose of EC25, different samples were divided into characteristic groups by PCA, which indicated that the transcriptomics were different between the groups [33]. To further reveal the immunotoxicity of the pesticides, DEGs (|log2FC| ≥ 1 and p value ≤ 0.05) were identified. As shown in Figure 4e,f and Tables S5–S14, under an exposure dose of EC10, 323, 336, 241, 331, 201, and 278 DEGs were identified in the comparison of Ctr_vs_CH10, Ctr_vs_DI10, Ctr_vs_DC10, CH10_vs_DI10, CH10_vs_DC10, and DI10_vs_DC10, respectively. Under an exposure dose of EC25, the DEGs increased to 1050, 1355, 1301, 2269, 942, and 758 for the comparison of Ctr_vs_CH25, Ctr_vs_DI25, Ctr _vs_DC25, CH25_vs_DC25, and DI25_vs_DC25, respectively.

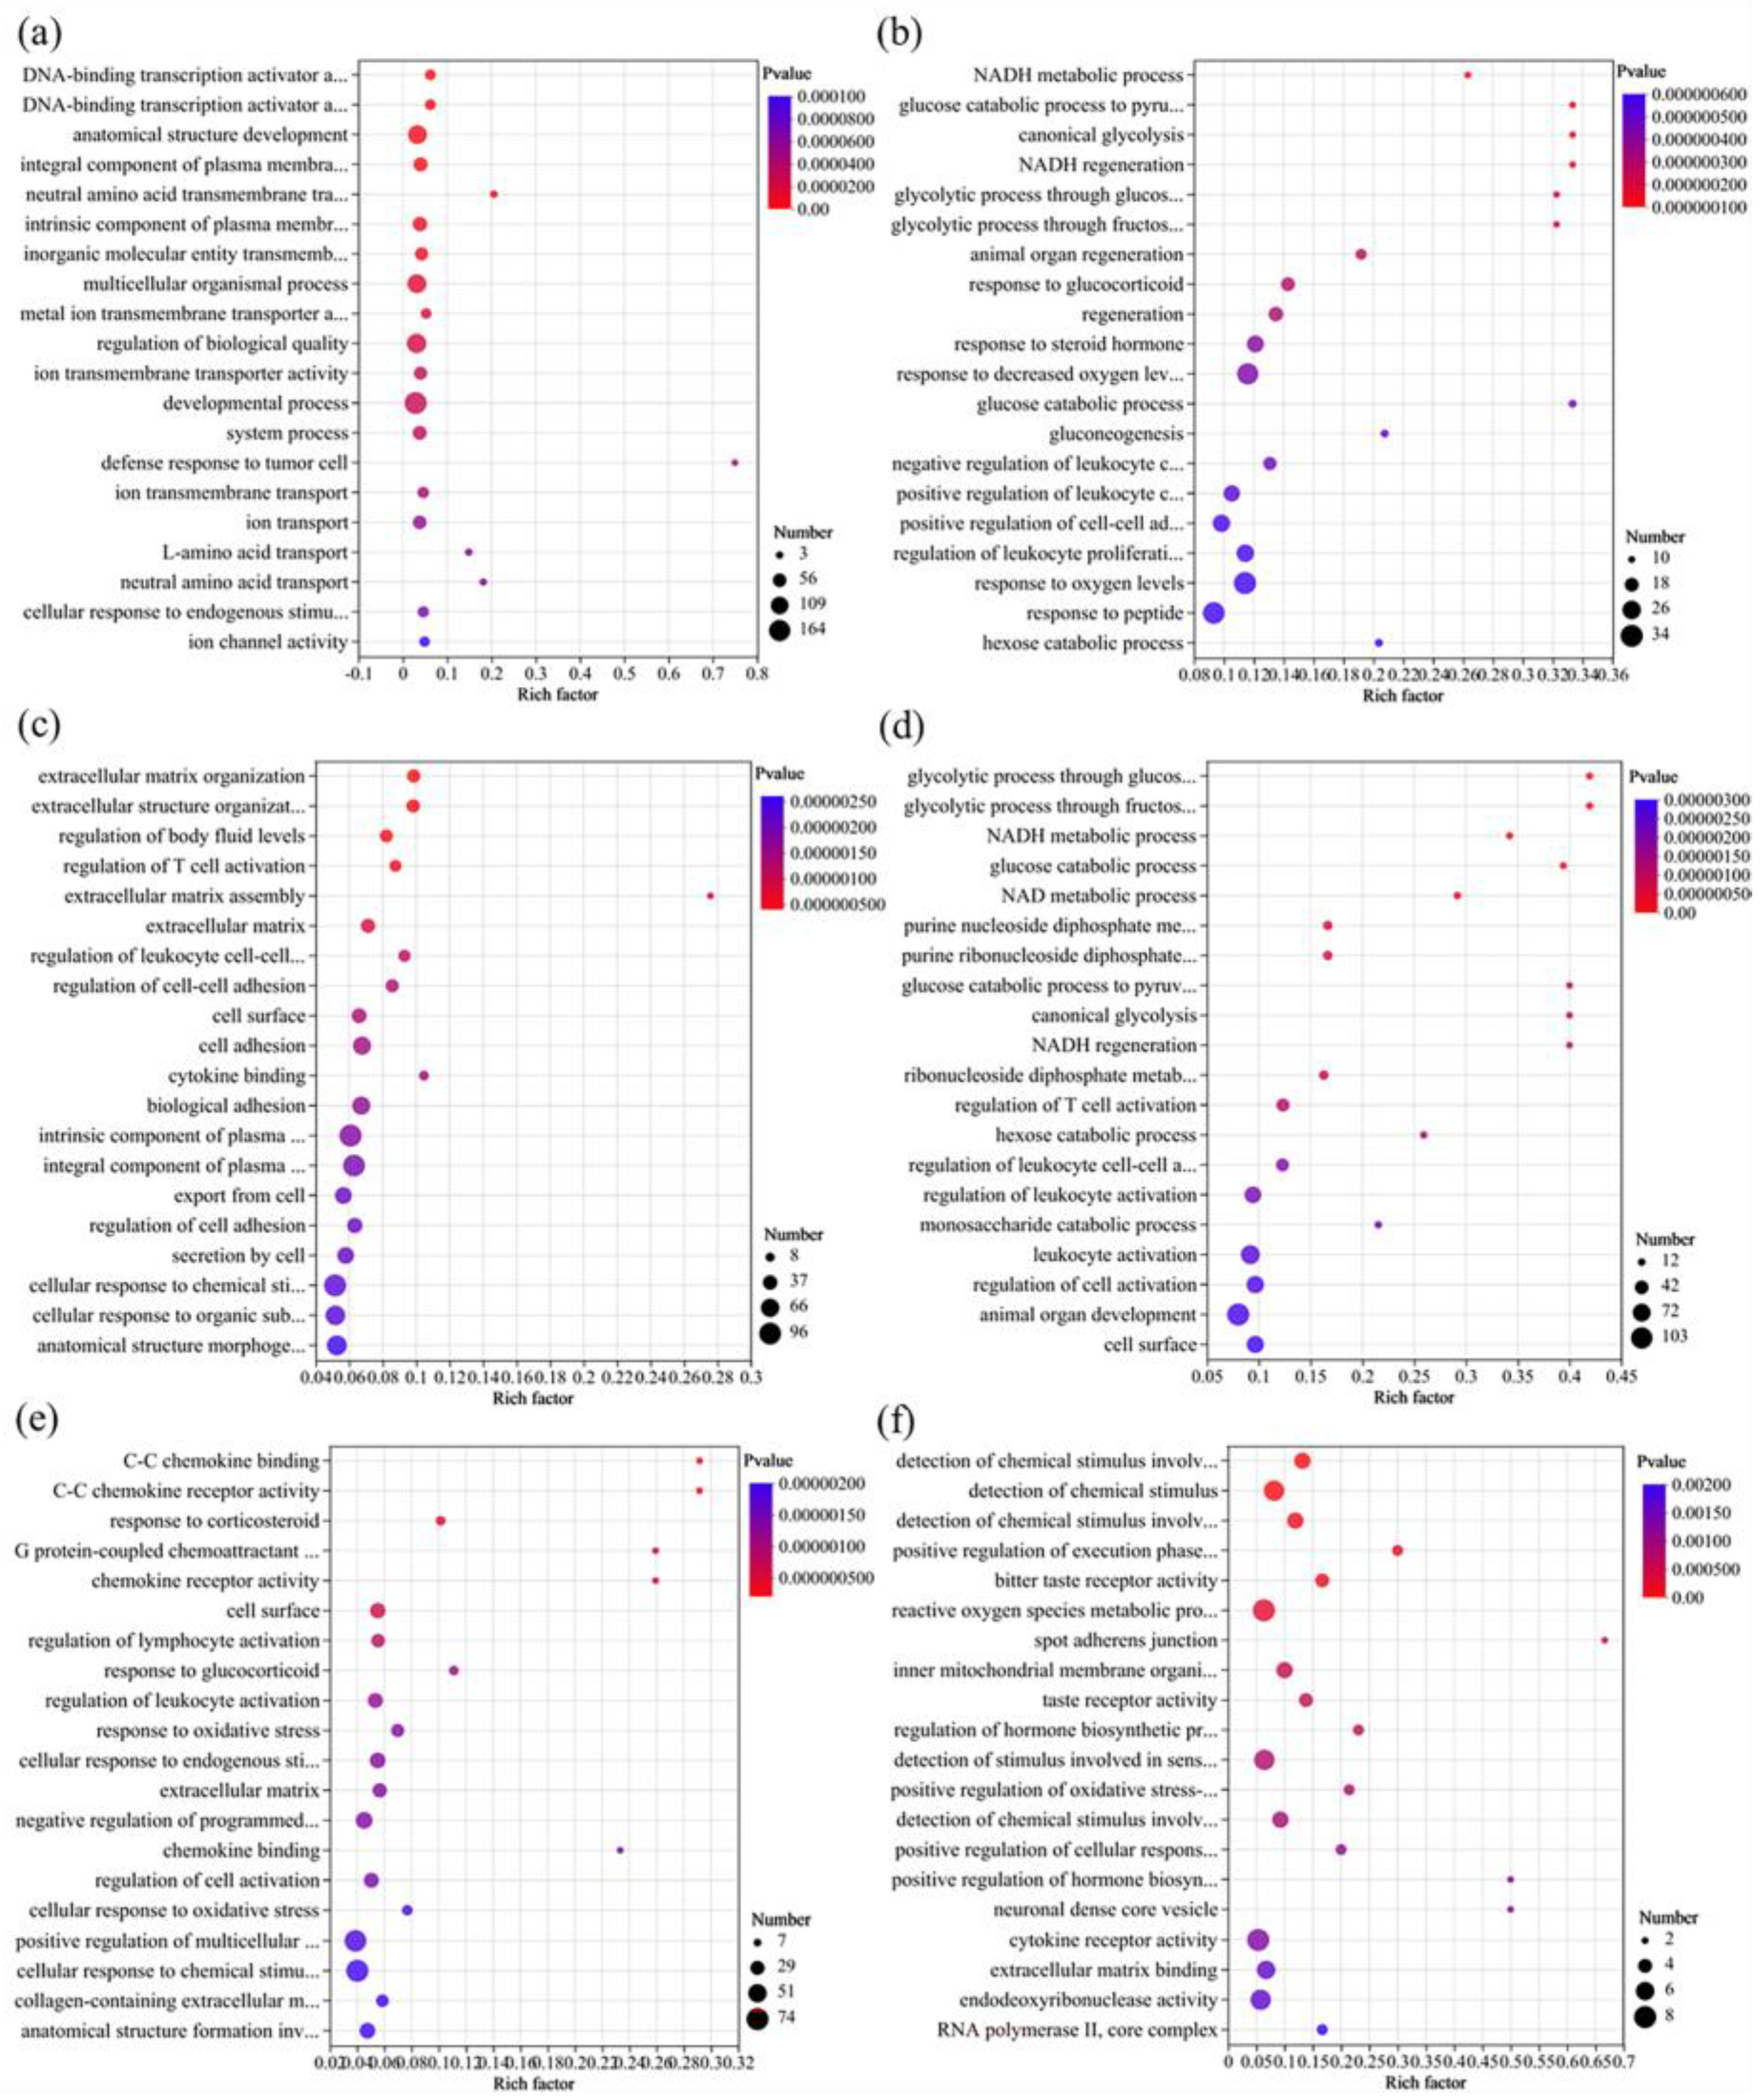
3.5.2. GO Enrichment Analysis of DEGs

As shown in Figure 5 and Table S15, exposure to chlorothalonil mainly caused changes in cell membrane function, especially cation transport, and further affected cell growth and development. Under an exposure dose of EC10, the most significant top five GO terms were cellular response to chemical stimulus (9 DEGs downregulated, 11 DEGs upregulated), homeostatic process (11 DEGs downregulated, 8 DEGs upregulated), cellular response to organic substance (8 DEGs downregulated, 9 DEGs upregulated), transmembrane transporter activity (12 DEGs downregulated, 5 DEGs upregulated), and inorganic molecular entity transmembrane transporter activity (12 DEGs downregulated, 3 DEGs upregulated) (Tables S5 and S15). A previous study also suggested that chlorothalonil exposure could reduce the secretion of colonic epithelial mucus and change the gene transcription of ion transportation [34]. When the exposure dose increased to EC25, the GO term enrichment was similar to that of EC10 (Figure 6a and Table S16), and many genes were enriched in the GO terms of membrane structure and ion transport, such as inorganic molecular entity transmembrane transporter activity, ion transmembrane transporter activity, and ion transmembrane transport. In addition, cell development, such as developmental process, anatomical structure development, and system process, was also significantly affected (Figure 6a), which indicates that an increase in pesticide concentration may cause more gene expression disorders. Notably, eight genes were enriched in the negative regulation of leukocyte cell–cell adhesion (Table S16), three downregulated (FGL2, GNRH1, and IL2RA), and five upregulated (ASS1, CD86, FOXJ1, KLF4, and SMAD7). In addition, three downregulated genes (IL2RA, ICOSLG, and CD24) were enriched in the positive regulation of activated T-cell proliferation (Table S16). Among the DEGs, two key immune regulation genes, cluster of differentiation 24 (CD24, downregulated) and chymotryptic serine proteinase (CMA1, upregulated), were significantly differentially expressed with the same trends in the comparison of Ctr_vs_CH10 and Ctr_vs_CH25. In the human body, CD24 expression could affect cell adhesion, which is closely related to cancer cell migration, invasion, and proliferation [35]. The downregulation may be an important reason that most of the genes (9/13) in the GO term of cell adhesion were downregulated (Table S15). CMA1 is a good immune-related prognostic marker for gastric cancer, and it was upregulated in the high-risk prognosis of gastric cancer [36]. However, CD24 was also downregulated after exposure to difenoconazole, so CMA1 was considered a potential target gene for chlorothalonil exposure.
When the exposure dose was EC10, difenoconazole exposure mainly affected the regulation of cell and nervous system development. A previous study indicated that the exposure of zebrafish to difenoconazole could initiate neurotoxicity [37]. Moreover, muscle contraction (seven downregulated DEGs, one upregulated DEG) and muscle system processes (seven downregulated DEGs, one upregulated DEG) were also significantly affected (Tables S7 and S17). Muscle contraction is closely related to energy metabolism [38]. Therefore, when the exposure dose increased to EC25, the oxygen levels (response to decreased oxygen levels), nicotinamide adenine dinucleotide (NADH) metabolism, and glucose metabolism were affected (Figure 6). In addition, the DEGs were also mainly enriched in membrane construction, cellular metabolism, and signal transduction (Table S18) at an exposure dose of EC25. Notably, the exposure dose of EC10 significantly affected the immune system, especially the regulation of immune system processes (15 DEGs downregulated, 5 DEGs upregulated) and the positive regulation of immune system processes (11 DEGs downregulated, 4 DEGs upregulated) (Tables S7 and S17), but the exposure dose of EC25 significantly affected the immune system (such as the GO of immune system processes and the regulation of immune system processes) and leukocyte activation (such as the GO of leukocyte activation and the regulation of leukocyte activation). Among the immune-related DEGs, six genes (TRIM15, TNFRSF1B, STAP1, SERPINE1, LGALS1, and HMGB1P37) maintained the same regulatory trends at the exposure doses of EC10 and EC25. However, these genes were not significantly differentially expressed under chlorothalonil exposure, so they are potential target genes for difenoconazole exposure.
When the Jurkat T cells were jointly exposed to chlorothalonil and difenoconazole, gene expression changed. The DEGs between the joint exposure group and chlorothalonil exposure group at the dose of EC10 (CH10_vs_DC10) were mainly enriched in the formation of cell structures, such as membrane-enclosed lumen, intracellular organelle lumen, and extracellular structure organization (Figure 5e and Table S21). When the exposure dose increased to EC25, the DEGs were mainly enriched in cellular processes and cellular metabolism (Figure 6e and Table S22). However, compared to difenoconazole, the DEGs of the joint exposure group and difenoconazole exposure group at the dose of EC10 (DI10_vs_DC10) were different. The DEGs were mainly enriched in GO terms of cell metabolism, particularly in amino acid metabolism (Figure 5f and Table S23). When the exposure dose increased to EC25, the DEGs of the joint exposure group and difenoconazole exposure group (DI10_vs_DC10) were mainly related to cell development (such as cell differentiation, mitochondrial inner membrane, and DNA recombination) and cell oxidative stress (such as response to oxidative stress and reactive oxygen species metabolic process) (Figure 6f and Table S24). The above results indicated that the effects of combined exposure are different under low (EC10) and high (EC25) exposure doses, which is consistent with the cytotoxicity results of Section 3.3.

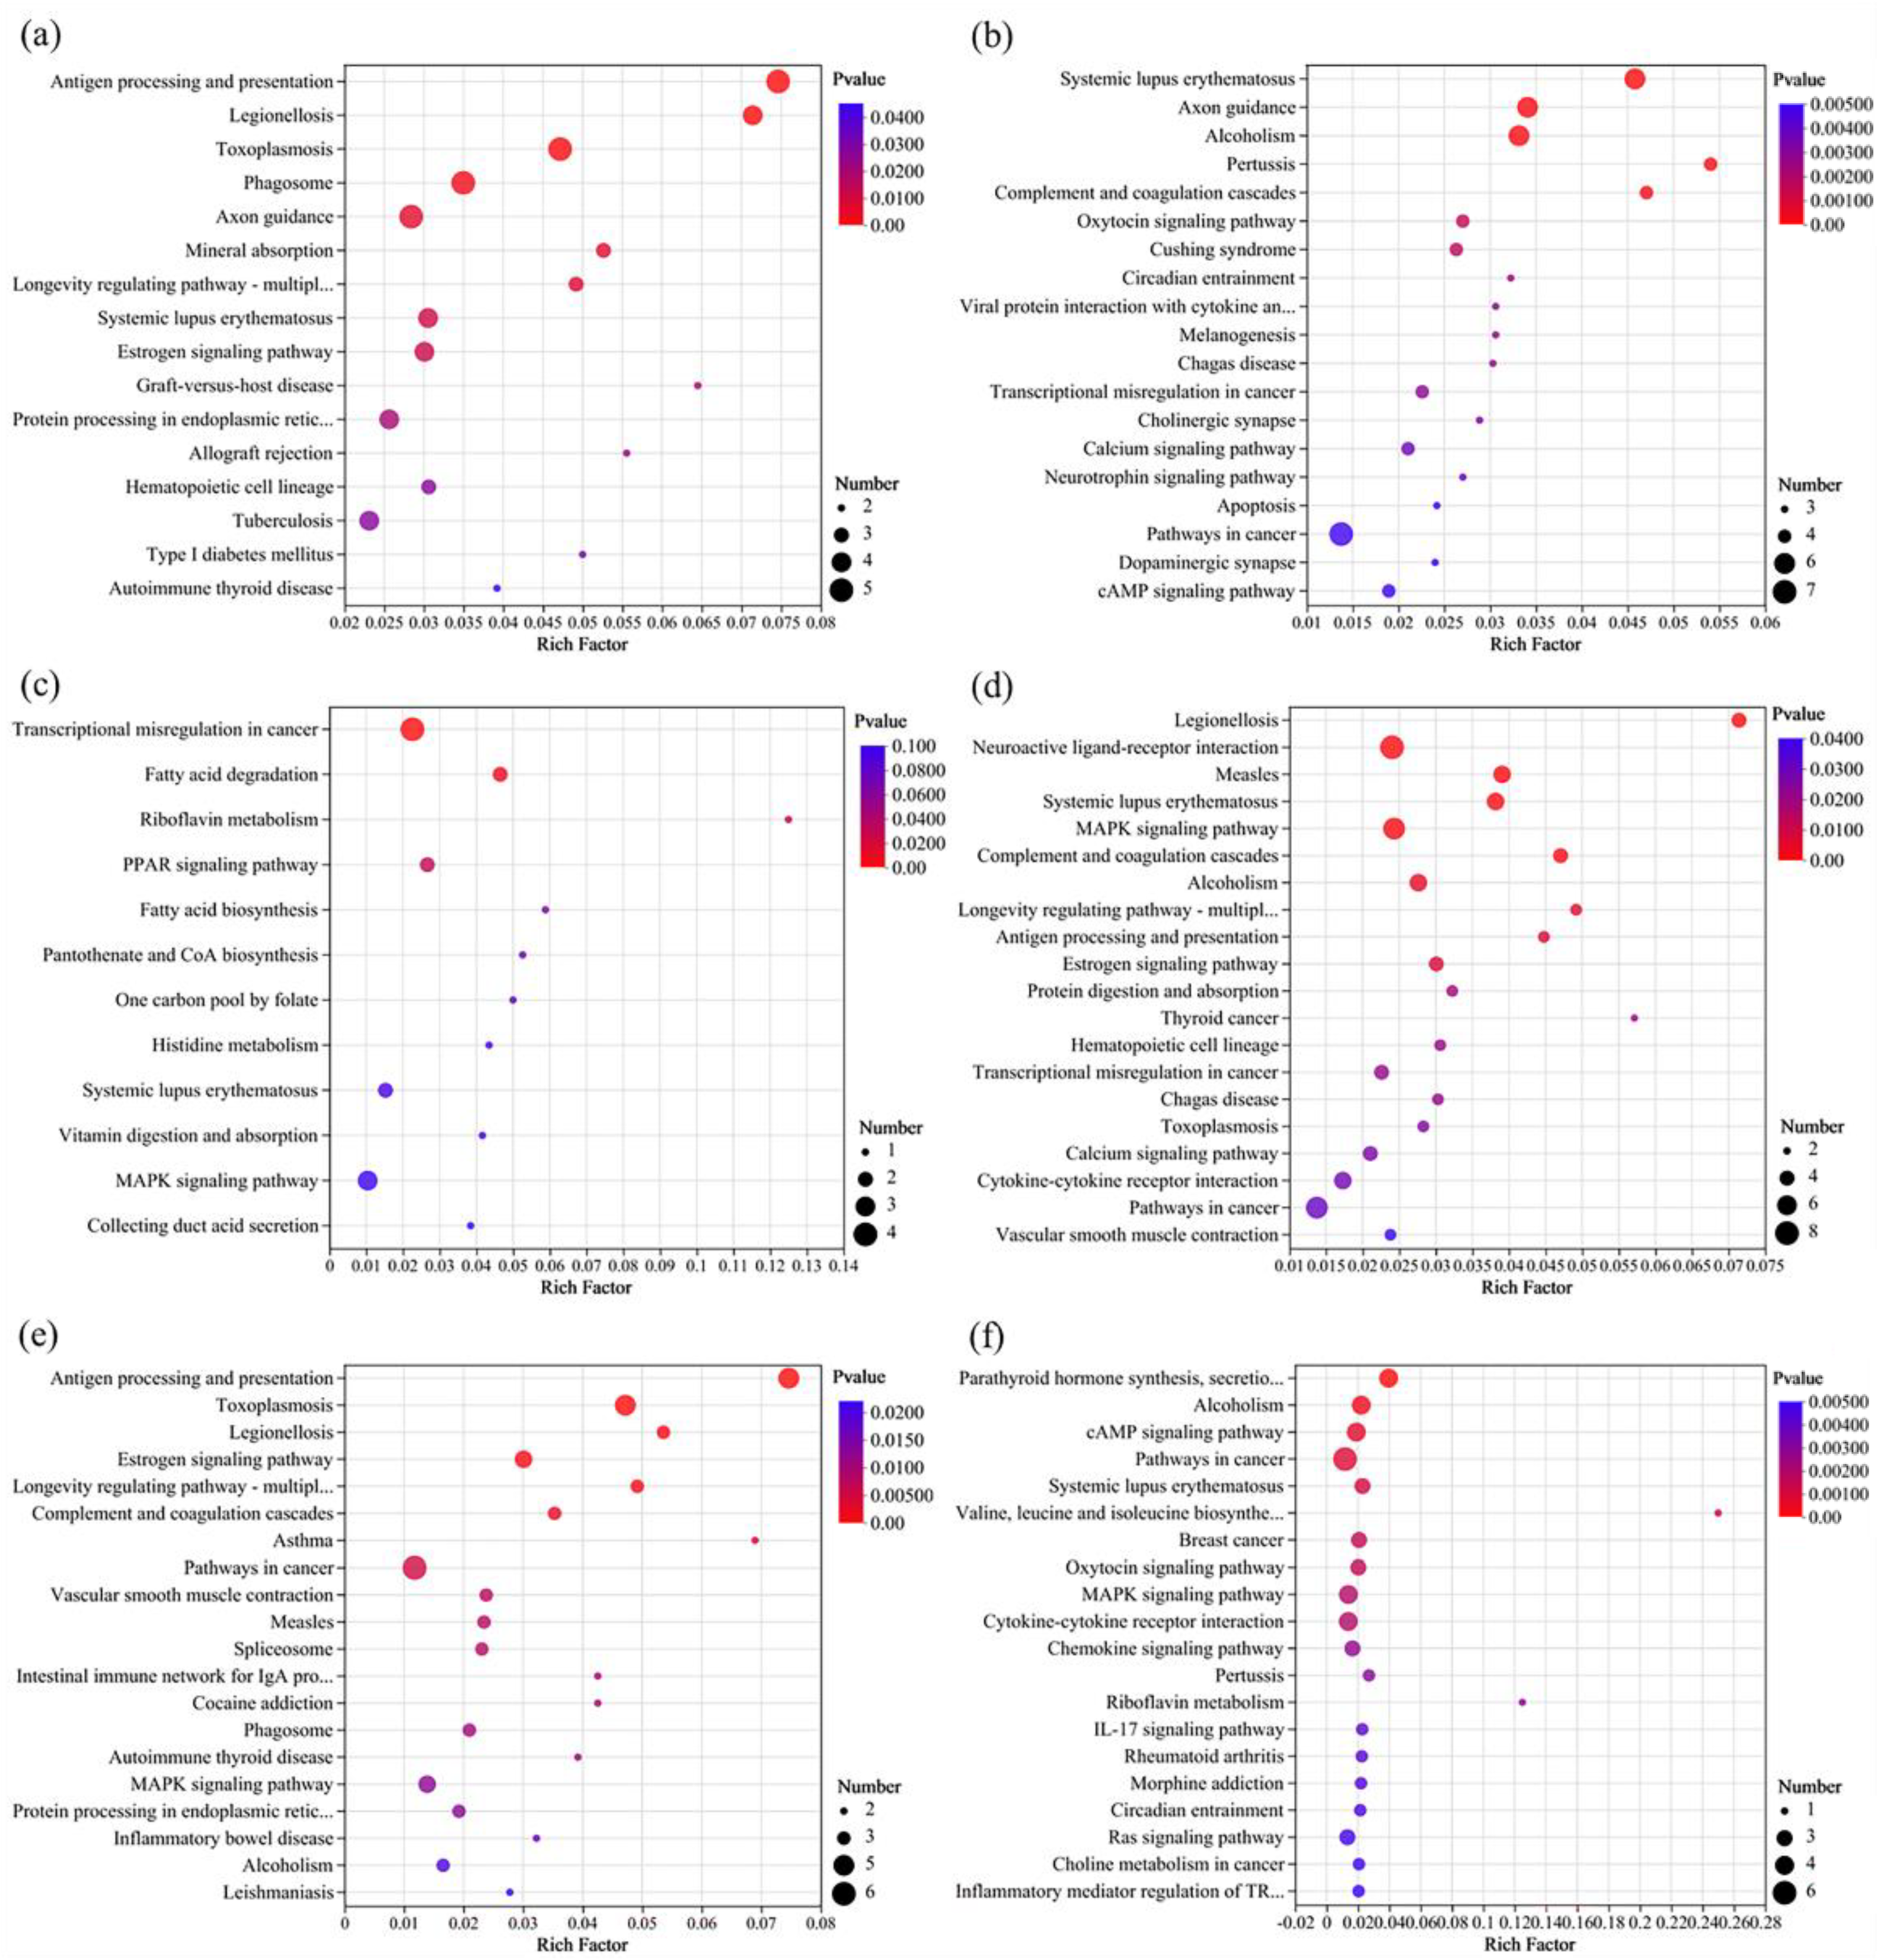
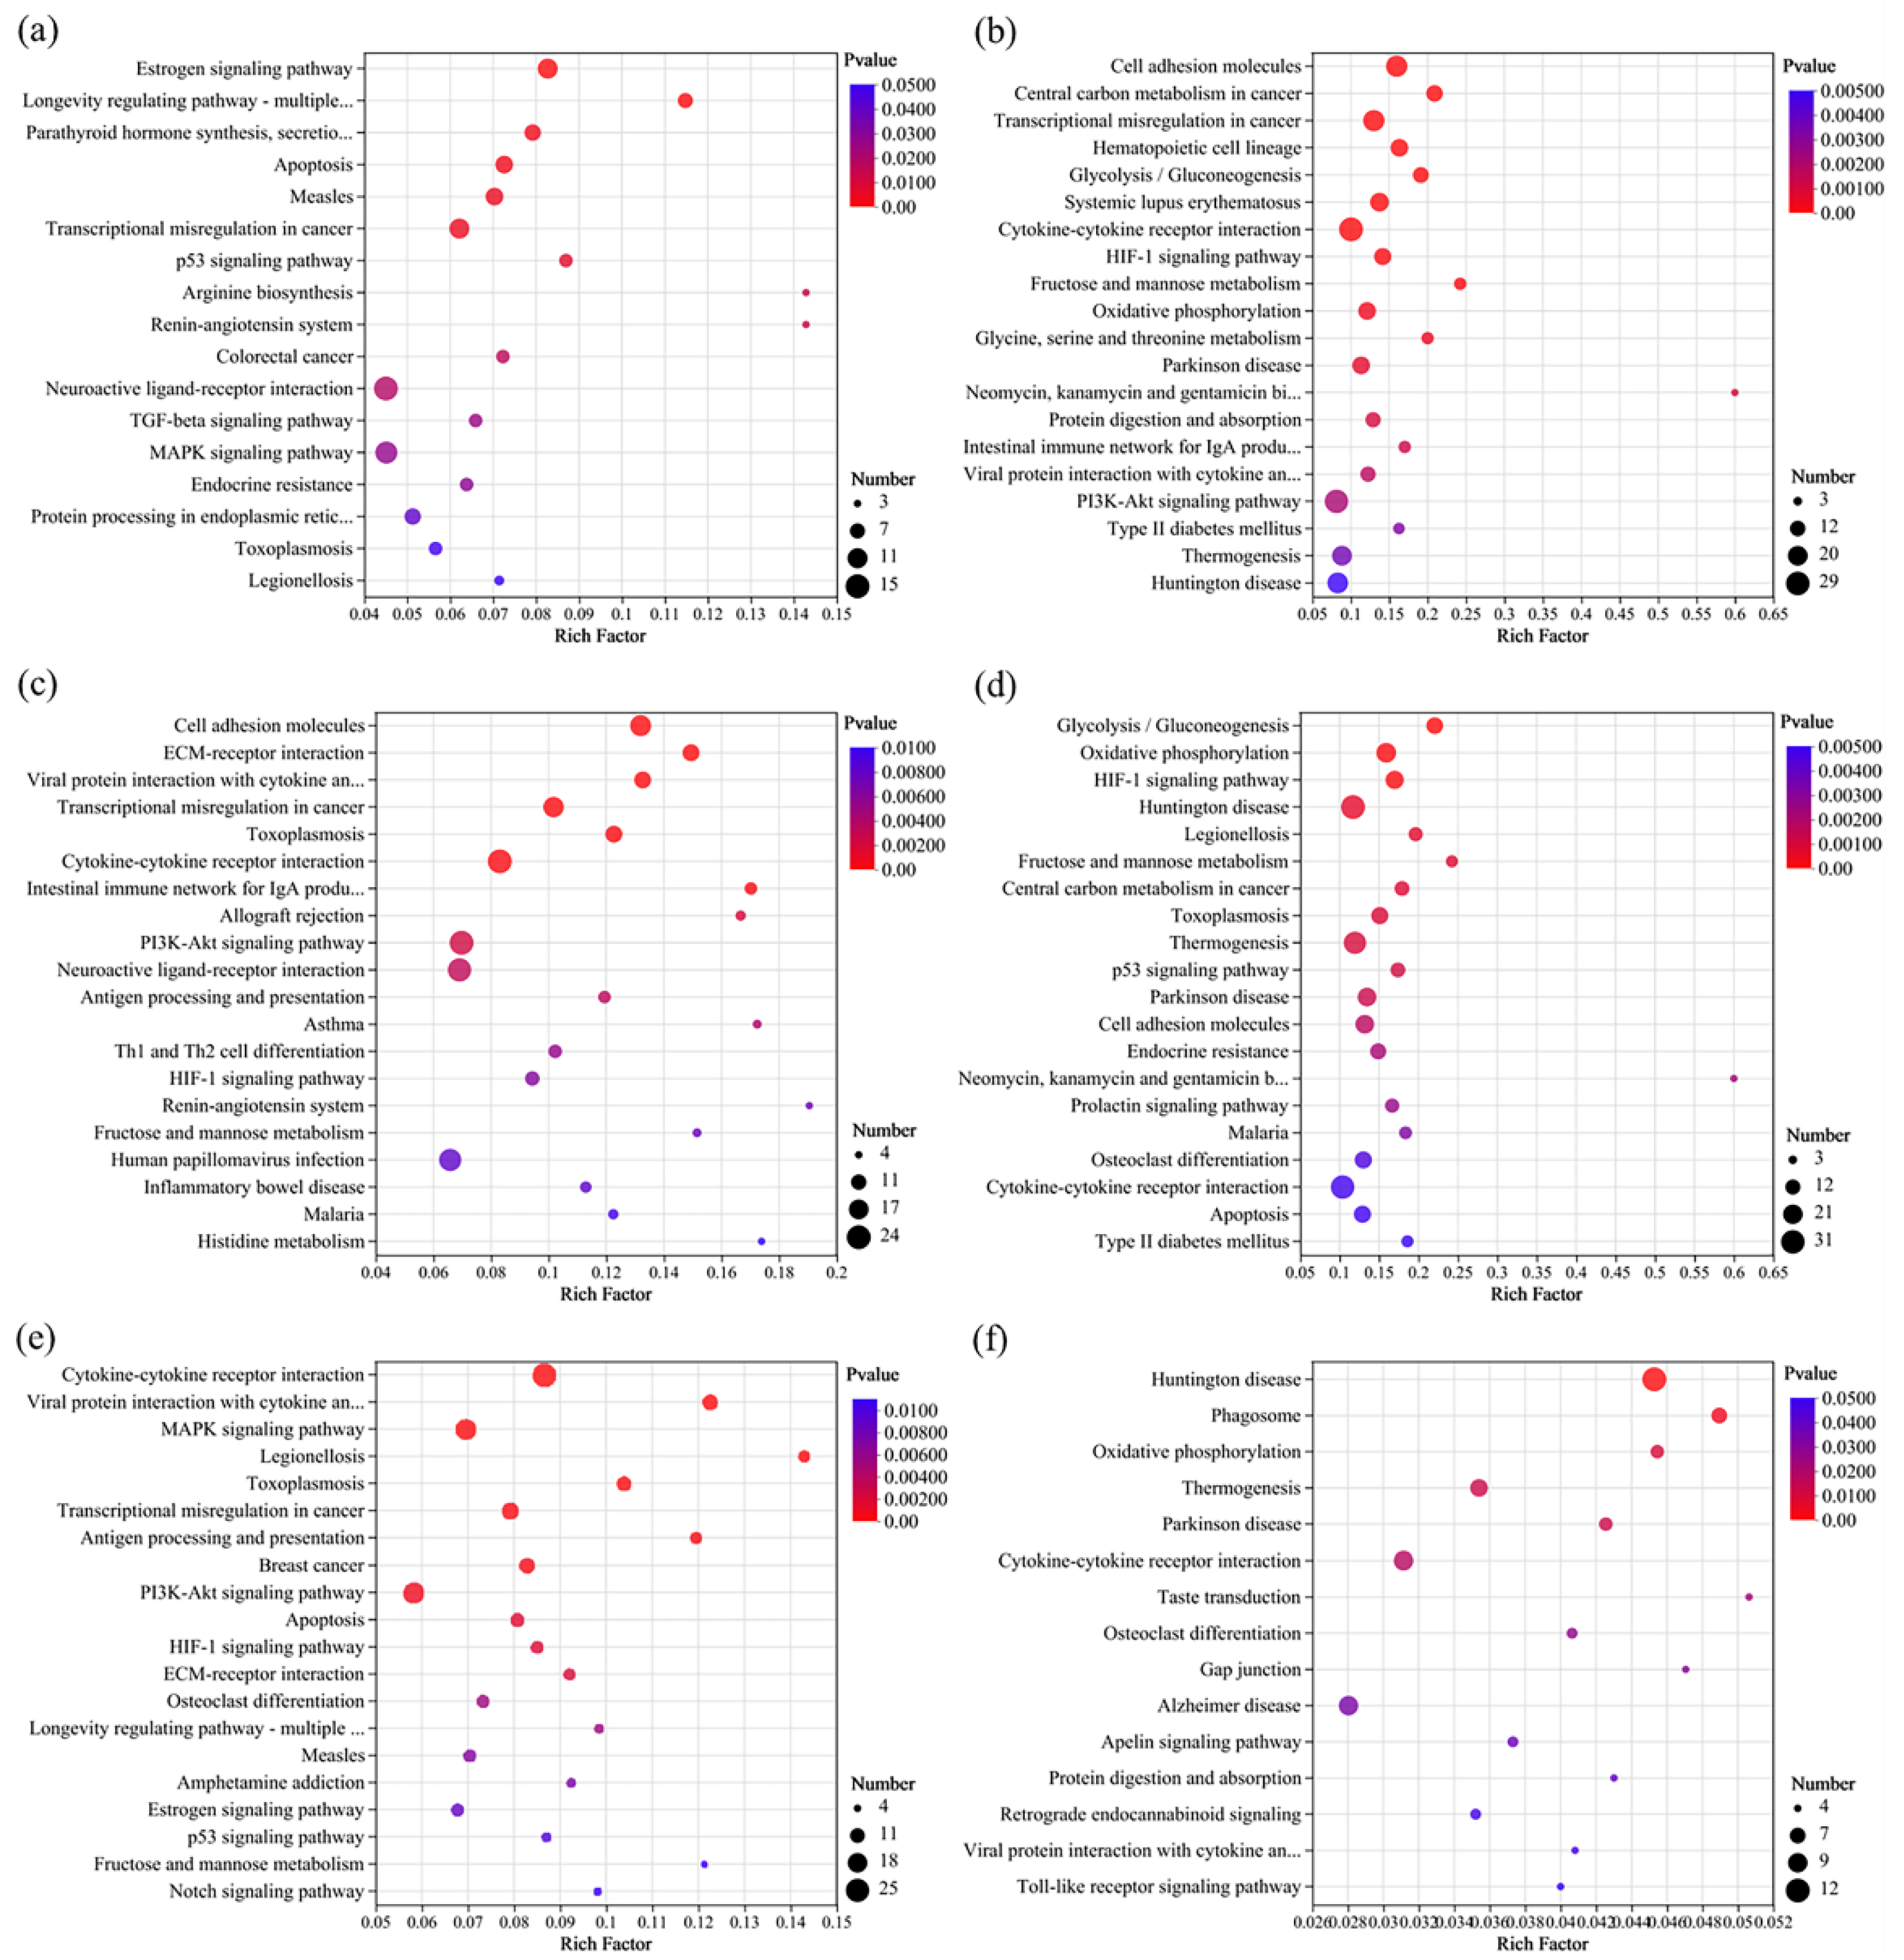
3.5.3. KEGG Enrichment Analysis of DEGs

Compared to the control group, exposure to chlorothalonil (Ctr_vs_CH10 and Ctr_vs_CH25) mainly caused immunodeficiency disease (such as autoimmune thyroid disease and systemic lupus erythematosus) caused by endocrine disorders (endocrine resistance, and parathyroid hormone synthesis, secretion, and action) and signaling pathway disorders (estrogen signaling pathway and TGF-beta signaling pathway) (Figure 7 and Figure 8 and Tables S25 and S26). The endocrine system is considered vitally important in frailty because it has a direct or indirect relationship with the immune system [39]. For example, the secretion of estrogen has a positive effect on women’s health and longevity [40]. In the present study, all genes related to the KEGG of the estrogen signaling pathway (GNAI1, HSPA6, HSPA1A, and HSPA1B) and longevity regulating pathway-multiple species (HSPA6, HSPA1A, and HSPA1B) were upregulated when exposed to chlorothalonil. Heat shock protein family A (ASPA) proteins play important roles in regulating cell functions during carcinogenesis. Previous studies indicated that the upregulation of HSPA6, HSPA1A, and HSPA1B not only promoted the risk of tumorigenesis and nontumor-related diseases but also increased the probability of poor prognosis [41,42]. In addition, exposure to chlorothalonil affected the estrogen signaling pathway, so it is necessary to further study whether chlorothalonil poses a greater risk to females than to males.
As shown in Figure 7 and Figure 8 and Tables S27 and S28, the KEGG enrichment analysis indicated that exposure to difenoconazole (Ctr_vs_DI10 and Ctr_vs_DI25) could also cause immunodeficiency diseases, such as systemic lupus erythematosus and primary immunodeficiency. There were 6 DEGs enriched in systemic lupus erythematosus when the exposure dose was EC10, and the number of DEGs increased to 18 when the exposure dose was EC25. These DEGs mainly refer to histone genes such as H4C1/2/5/8/11/13, H3C8/12/13, H2BC7/17, and H2AC7/14. Notably, there were 4 DEGs enriched in complement and coagulation cascades when the exposure dose was EC10, and the DEGs increased to 10 when the exposure dose was EC25. In particular, two important genes, VWF and SERPINE1, were downregulated in both comparisons of Ctr_vs_DI10 and Ctr_vs_DI25. VWF is a plasma glycoprotein that is crucial for normal platelet thrombosis during hemostasis [43]. SERPINE1 has been proposed as the key indicator for carcinogenesis and poor prognosis, and the downregulation of SERPINE1 may be related to the decrease in neutrophils and macrophages in the human body [44]. In addition, the KEGG pathway analysis indicated that exposure to chlorothalonil or difenoconazole could cause the differential expression of genes related to diabetes. Exposure to chlorothalonil mainly refers to type I diabetes mellitus, but exposure to difenoconazole mainly refers to type II diabetes mellitus, which indicates that there are differences in toxicity mechanisms between these two pesticides.
As shown in Figure 7 and Figure 8 and Tables S29 and S30, the most significant (p value ≤ 0.05) top three KEGG pathways for the Ctr_vs_DC10 comparison were transcriptional misregulation in cancer, fatty acid degradation, and riboflavin metabolism, but for the Ctr_vs_DC25 comparison, the most significant top three KEGG pathways were cell adhesion molecules, ECM-receptor interaction, and viral protein interaction with cytokine and cytokine receptor. Although some DEGs were enriched in the same KEGG pathway at different exposure doses (EC10 and EC25), the DEGs were different. For example, the genes enriched in transcriptional misregulation in cancer, PBX1, H3C10, and H3C2, were significantly differentially expressed in the comparison of Ctr_vs_DC10 but not in the comparison of Ctr_vs_DC25. In addition, the genes TNFRSF13B, CD86, and IL2RB were significantly differentially expressed in the comparison of Ctr_vs_DC25 but not in the comparison of Ctr_vs_DC10. Similar to the cell activity results, the results indicated that joint exposure to low and high doses of chlorothalonil and difenoconazole may have different toxic effects on cells.

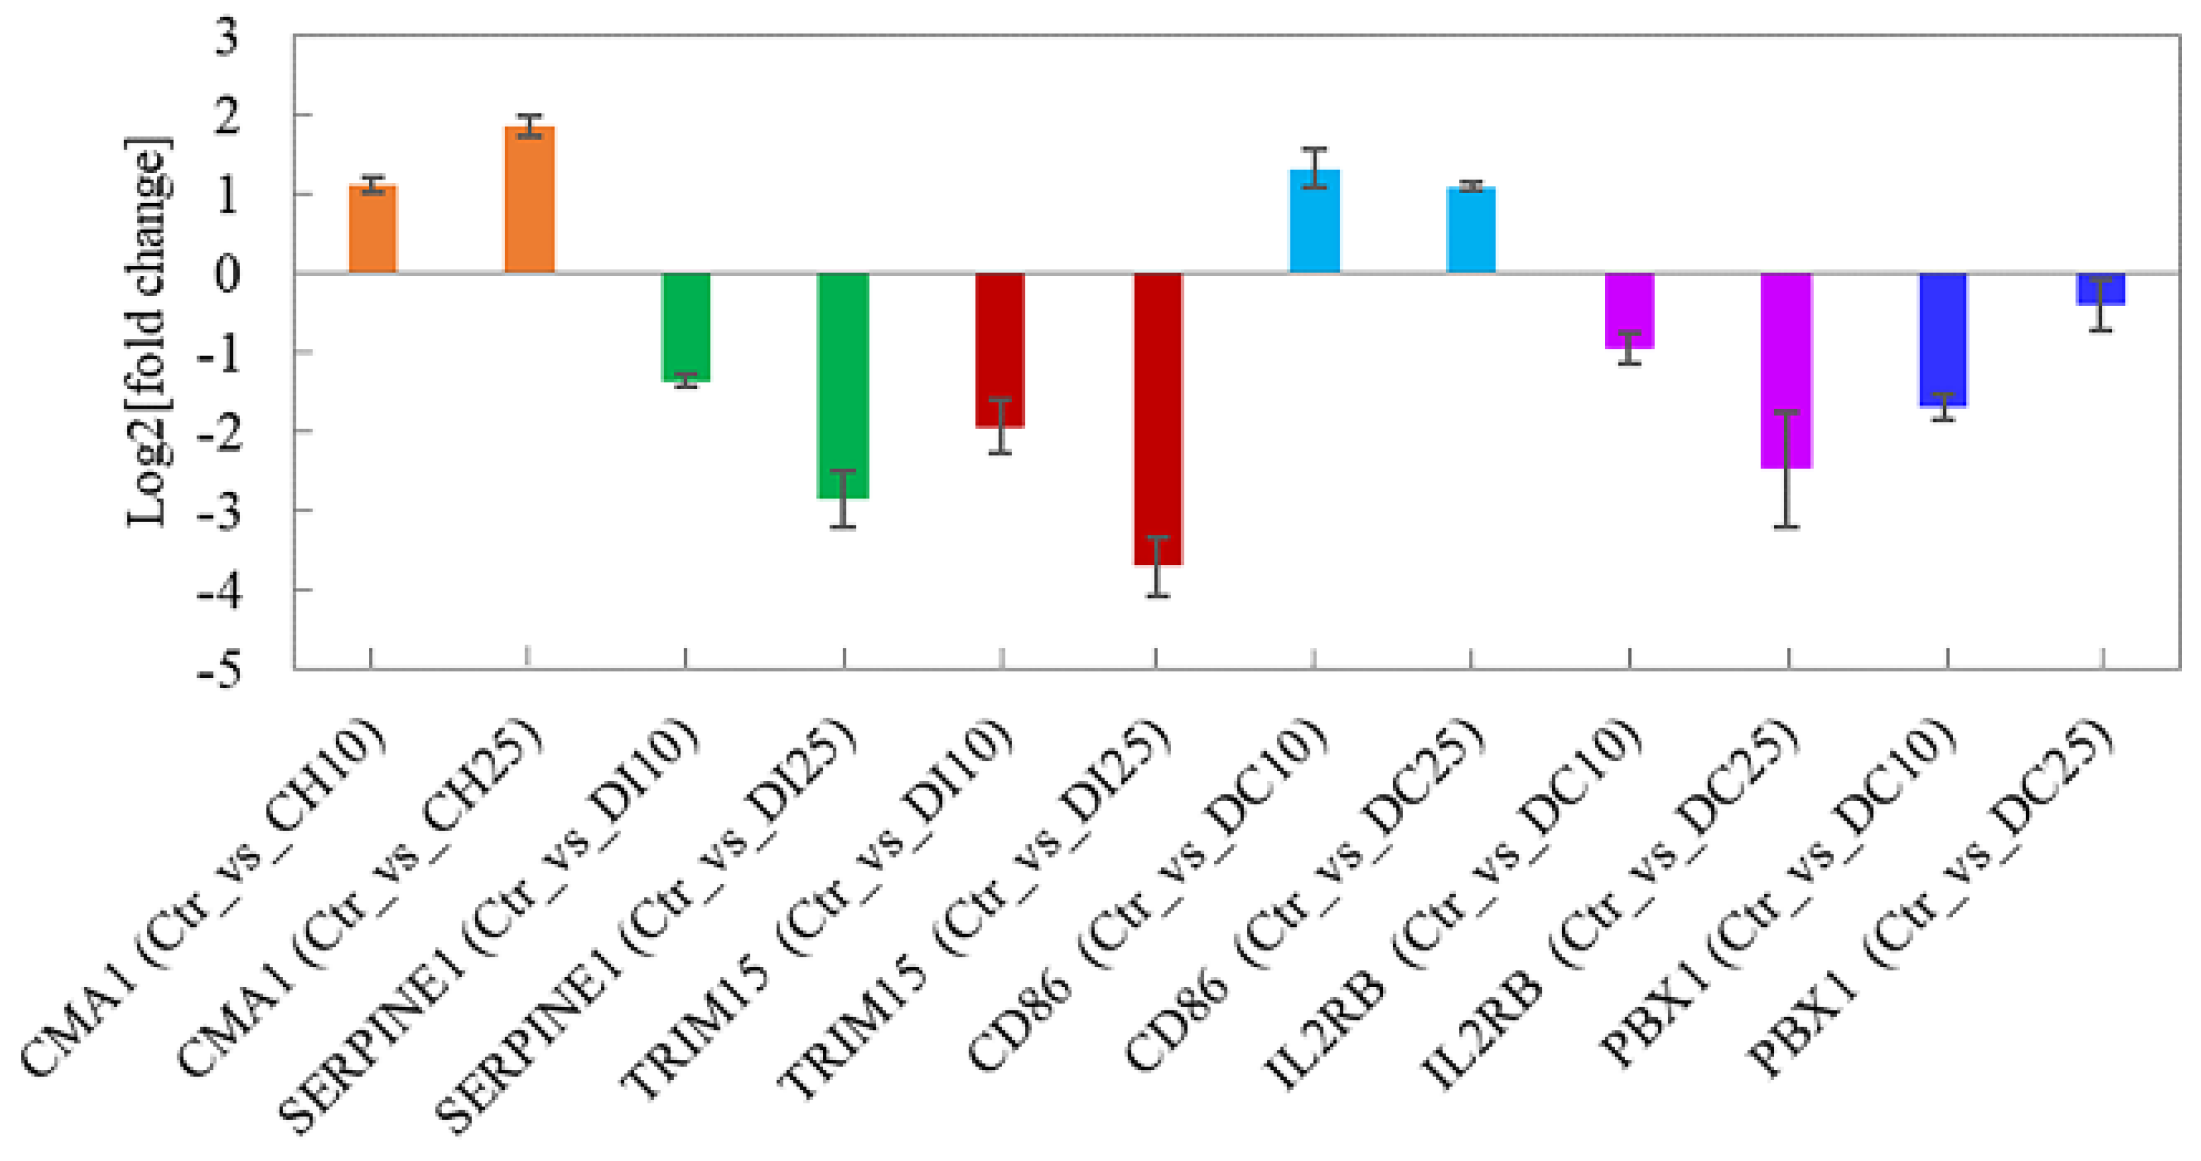
3.6. Quantitative Real-Time PCR Validation

To further validate the transcriptomics results, six differentially expressed genes, CMA1, SERPINE1, TRIM15, CD86, IL2RB, and PBX1, associated with immune regulation [35,36,44,45,46,47] were selected for quantitative real-time PCR validation. As shown in Figure 9, although there were certain differences in fold changes, the differential expression trends of the six genes were consistent with the results of the transcriptomics analysis, which indicated that the transcriptomics results were reliable.

4. Conclusions

In this study, the immunotoxicity of 10 commonly detected pesticides in fruits and vegetables was evaluated by using the human Jurkat T-cell line. Difenoconazole and chlorothalonil showed obvious inhibitory effects on cell growth, and the EC50 values were 24.66 and 1.17 mg/L, respectively. The joint exposure to these two pesticides showed a synergistic effect at low concentrations (total dose lower than 10.58 mg/L) but an antagonistic effect at high concentrations (total dose higher than 10.58 mg/L). The transcriptomics analysis indicated that the DEGs for a single exposure to chlorothalonil mainly affected cation transportation, extracellular matrix organization, and leukocyte cell adhesion. However, exposure to difenoconazole mainly affected nervous system development, muscle contraction, and immune system processes. However, when the joint exposure dose was EC10, the DEGs were mainly involved in the formation of cell structures, but when exposed at EC25, the DEGs were mainly involved in cellular processes and metabolism. Although Jurkat T-cell line models were successfully used to explore the immunotoxicity of different pesticides, and the single and combined immunotoxicological mechanisms of difenoconazole and chlorothalonil were studied, this study did not conduct animal experiments, so the toxicity results cannot be extrapolated to humans. Therefore, further animal experiments are needed to verify the results.

Supplementary Materials

The following supporting information can be downloaded at: https://www.mdpi.com/article/10.3390/foods13010034/s1.

Author Contributions

Conceptualization, Y.-C.L. and Y.-Z.Q.; methodology, S.-Y.L. and F.-B.M.; software, Y.-Y.X. and S.-Y.L.; validation, H.-R.L.; formal analysis, Y.-C.L.; investigation, J.Q.; resources, F.-B.M.; data curation, Y.-Z.Q.; writing—original draft preparation, Y.-C.L. and S.-Y.L.; writing—review and editing, J.Q. and Y.-Z.Q.; visualization, F.-B.M.; supervision, Y.-Z.Q.; project administration, F.-B.M.; funding acquisition, Y.-Z.Q. All authors have read and agreed to the published version of the manuscript.

Funding

This research was funded by the National Key Research and Development Program of China (2018YFC1603000), and the Science and Technology Innovation Program of the Chinese Academy of Agricultural Sciences (CAAS-ASTIP-IQSTAP).

Data Availability Statement

The data presented in this article are available on reasonable request from the corresponding author.

Conflicts of Interest

The authors declare no conflict of interest.

References

  1. Nehra, M.; Dilbaghi, N.; Marrazza, G.; Kaushik, A.; Sonne, C.; Kim, K.H.; Kumar, S. Emerging nanobiotechnology in agriculture for the management of pesticide residues. J. Hazard. Mater. 2021, 401, 123369. [Google Scholar] [CrossRef] [PubMed]
  2. Samsidar, A.; Siddiquee, S.; Shaarani, S.M. A review of extraction, analytical and advanced methods for determination of pesticides in environment and foodstuffs. Trends Food Sci. Technol. 2018, 71, 188–201. [Google Scholar] [CrossRef]
  3. Zhang, W.; Fan, R.; Luo, S.; Ying, L.; Jin, Y.; Li, Y.; Xiong, M.; Yuan, X.; Jia, L.; Chen, Y. Antagonistic effects and mechanisms of carbendazim and chlorpyrifos on the neurobehavior of larval zebrafish. Chemosphere 2022, 293, 133522. [Google Scholar] [CrossRef] [PubMed]
  4. Huang, T.; Jiang, H.; Zhao, Y.; He, J.; Cheng, H.; Martyniuk, C.J. A comprehensive review of 1,2,4-triazole fungicide toxicity in zebrafish (Danio rerio): A mitochondrial and metabolic perspective. Sci. Total Environ. 2022, 809, 151177. [Google Scholar] [CrossRef] [PubMed]
  5. Wang, X.; Qiu, J.; Xu, Y.; Liao, G.; Jia, Q.; Pan, Y.; Wang, T.; Qian, Y. Integrated non-targeted lipidomics and metabolomics analyses for fluctuations of neonicotinoids imidacloprid and acetamiprid on Neuro-2a cells. Environ. Pollut. 2021, 284, 117327. [Google Scholar] [CrossRef] [PubMed]
  6. Wang, T.; Ma, M.; Chen, C.; Yang, X.; Qian, Y. Three widely used pesticides and their mixtures induced cytotoxicity and apoptosis through the ROS-related caspase pathway in HepG2 cells. Food Chem. Toxicol. 2021, 152, 112162. [Google Scholar] [CrossRef] [PubMed]
  7. Dhouib, I.; Jallouli, M.; Annabi, A.; Marzouki, S.; Gharbi, N.; Elfazaa, S.; Lasram, M.M. From immunotoxicity to carcinogenicity: The effects of carbamate pesticides on the immune system. Environ. Sci. Pollut. Res. Int. 2016, 23, 9448–9458. [Google Scholar] [CrossRef]
  8. Corsini, E.; Sokooti, M.; Galli, C.L.; Moretto, A.; Colosio, C. Pesticide induced immunotoxicity in humans: A comprehensive review of the existing evidence. Toxicology 2013, 307, 123–135. [Google Scholar] [CrossRef]
  9. Fukuyama, T.; Tajima, Y.; Ueda, H.; Hayashi, K.; Kosaka, T. Prior exposure to immunosuppressive organophosphorus or organochlorine compounds aggravates the TH1- and TH2-type allergy caused by topical sensitization to 2,4-dinitrochlorobenzene and trimellitic anhydride. J. Immunotoxicol. 2011, 8, 170–182. [Google Scholar] [CrossRef]
  10. Bini Dhouib, I.; Annabi, A.; Jallouli, M.; Marzouki, S.; Gharbi, N.; Elfazaa, S.; Lasram, M.M. Carbamates pesticides induced immunotoxicity and carcinogenicity in human: A review. J. Appl. Biomed. 2016, 14, 85–90. [Google Scholar] [CrossRef]
  11. Lee, G.H.; Choi, K.C. Adverse effects of pesticides on the functions of immune system. Comp. Biochem. Physiol. C Toxicol. Pharmacol. 2020, 235, 108789. [Google Scholar] [CrossRef] [PubMed]
  12. Wei, F.; Wang, D.; Li, H.; You, J. Joint toxicity of imidacloprid and azoxystrobin to Chironomus dilutus at organism, cell, and gene levels. Aquat. Toxicol. 2021, 233, 105783. [Google Scholar] [CrossRef]
  13. Cheng, L.; Lu, Y.; Zhao, Z.; Hoogenboom, R.; Zhang, Q.; Liu, X.; Song, W.; Guan, S.; Song, W.; Rao, Q. Assessing the combined toxicity effects of three neonicotinoid pesticide mixtures on human neuroblastoma SK-N-SH and lepidopteran Sf-9 cells. Food Chem. Toxicol. 2020, 145, 111632. [Google Scholar] [CrossRef] [PubMed]
  14. Benka-Coker, W.; Hoskovec, L.; Severson, R.; Balmes, J.; Wilson, A.; Magzamen, S. The joint effect of ambient air pollution and agricultural pesticide exposures on lung function among children with asthma. Environ. Res. 2020, 190, 109903. [Google Scholar] [CrossRef] [PubMed]
  15. Rizzati, V.; Briand, O.; Guillou, H.; Gamet-Payrastre, L. Effects of pesticide mixtures in human and animal models: An update of the recent literature. Chem. Biol. Interact. 2016, 254, 231–246. [Google Scholar] [CrossRef] [PubMed]
  16. Boobis, A.; Budinsky, R.; Collie, S.; Crofton, K.; Embry, M.; Felter, S.; Hertzberg, R.; Kopp, D.; Mihlan, G.; Mumtaz, M.; et al. Critical analysis of literature on low-dose synergy for use in screening chemical mixtures for risk assessment. Crit. Rev. Toxicol. 2011, 41, 369–383. [Google Scholar] [CrossRef] [PubMed]
  17. Liu, Z.; Huang, R.; Roberts, R.; Tong, W. Toxicogenomics: A 2020 Vision. Trends Pharmacol. Sci. 2019, 40, 92–103. [Google Scholar] [CrossRef]
  18. Schmitz-Spanke, S. Toxicogenomics—What added Value Do These Approaches Provide for Carcinogen Risk Assessment? Environ. Res. 2019, 173, 157–164. [Google Scholar] [CrossRef]
  19. Porreca, I.; D’Angelo, F.; De Franceschi, L.; Matte, A.; Ceccarelli, M.; Iolascon, A.; Zamo, A.; Russo, F.; Ravo, M.; Tarallo, R.; et al. Pesticide toxicogenomics across scales: In vitro transcriptome predicts mechanisms and outcomes of exposure in vivo. Sci. Rep. 2016, 6, 38131. [Google Scholar] [CrossRef]
  20. Lee, G.H.; Hwang, K.A.; Choi, K.C. Effects of fludioxonil on the cell growth and apoptosis in T and B lymphocytes. Biomolecules 2019, 9, 500. [Google Scholar] [CrossRef]
  21. Li, Y.C.; Liu, S.Y.; Meng, F.B.; Xu, S.H.; Qiu, J.; Qian, Y.Z.; Xu, Y.Y.; Li, Y. Comparative transcriptome analysis to investigate the immunotoxicity mechanism triggered by dimethomorph on human Jurkat T cell lines. Foods 2022, 11, 3848. [Google Scholar] [CrossRef] [PubMed]
  22. Zhang, J.K.; Williams, T.D.; Abdallah, M.A.E.; Harrad, S.; Chipman, J.K.; Viant, M.R. Transcriptomic and metabolomic approaches to investigate the molecular responses of human cell lines exposed to the flame retardant hexabromocyclododecane (HBCD). Toxicol. Vitr. 2015, 29, 2116–2123. [Google Scholar] [CrossRef] [PubMed]
  23. Chou, T.C. Theoretical basis, experimental design, and computerized simulation of synergism and antagonism in drug combination studies. Pharmacol. Rev. 2006, 58, 621–681. [Google Scholar] [CrossRef] [PubMed]
  24. Verschoor, C.P.; Lelic, A.; Bramson, J.L.; Bowdish, D.M.E. An introduction to automated flow cytometry gating tools and their implementation. Front. Immunol. 2015, 6, 380. [Google Scholar] [CrossRef] [PubMed]
  25. Pertea, M.; Pertea, G.M.; Antonescu, C.M.; Chang, T.C.; Mendell, J.T.; Salzberg, S.L. StringTie enables improved reconstruction of a transcriptome from RNA-seq reads. Nat. Biotechnol. 2015, 33, 290–295. [Google Scholar] [CrossRef] [PubMed]
  26. Wang, Y.P.; Hu, Z.K.; Ye, N.; Yin, H.F. IsoSplitter: Identification and characterization of alternative splicing sites without a reference genome. RNA 2021, 27, 868–875. [Google Scholar] [CrossRef] [PubMed]
  27. Love, M.I.; Huber, W.; Anders, S. Moderated estimation of fold change and dispersion for RNA-seq data with DESeq2. Genome Biol. 2014, 15, 550. [Google Scholar] [CrossRef]
  28. Anders, S.; Huber, W. Differential expression analysis for sequence count data. Genome Biol. 2010, 11, R106. [Google Scholar] [CrossRef]
  29. Zhang, H.; Qian, M.; Wang, J.; Yang, G.; Weng, Y.; Jin, C.; Li, Y.; Jin, Y. Insights into the effects of difenoconazole on the livers in male mice at the biochemical and transcriptomic levels. J. Hazard. Mater. 2022, 422, 126933. [Google Scholar] [CrossRef]
  30. Liu, F.; Li, X.; Bello, B.K.; Zhang, T.; Yang, H.; Wang, K.; Dong, J. Difenoconazole causes spleen tissue damage and immune dysfunction of carp through oxidative stress and apoptosis. Ecotoxicol. Environ. Saf. 2022, 237, 113563. [Google Scholar] [CrossRef]
  31. da Silveira Guerreiro, A.; Rola, R.C.; Rovani, M.T.; da Costa, S.R.; Sandrini, J.Z. Antifouling biocides: Impairment of bivalve immune system by chlorothalonil. Aquat. Toxicol. 2017, 189, 194–199. [Google Scholar] [CrossRef] [PubMed]
  32. Naasri, S.; Helali, I.; Aouni, M.; Mastouri, M.; Harizi, H. N-acetylcysteine reduced the immunotoxicity effects induced in vitro by azoxystrobin and iprodione fungicides in mice. Environ. Toxicol. 2021, 36, 562–571. [Google Scholar] [CrossRef] [PubMed]
  33. Meng, F.-B.; Zhou, L.; Li, J.-J.; Li, Y.-C.; Wang, M.; Zou, L.-H.; Liu, D.-Y.; Chen, W.-J. The combined effect of protein hydrolysis and Lactobacillus plantarum fermentation on antioxidant activity and metabolomic profiles of quinoa beverage. Food Res. Int. 2022, 157, 111416. [Google Scholar] [CrossRef] [PubMed]
  34. Tao, H.; Wang, J.; Bao, Z.; Jin, Y.; Xiao, Y. Acute chlorothalonil exposure had the potential to influence the intestinal barrier function and micro-environment in mice. Sci. Total Environ. 2023, 894, 165038. [Google Scholar] [CrossRef] [PubMed]
  35. Altevogt, P.; Sammar, M.; Hüser, L.; Kristiansen, G. Novel insights into the function of CD24: A driving force in cancer. Int. J. Cancer 2021, 148, 546–559. [Google Scholar] [CrossRef]
  36. Shi, S.; Ye, S.; Mao, J.; Ru, Y.; Lu, Y.; Wu, X.; Xu, M.; Zhu, T.; Wang, Y.; Chen, Y.; et al. CMA1 is potent prognostic marker and associates with immune infiltration in gastric cancer. Autoimmunity 2020, 53, 210–217. [Google Scholar] [CrossRef]
  37. Yang, Q.; Deng, P.; Xing, D.; Liu, H.; Shi, F.; Hu, L.; Zou, X.; Nie, H.; Zuo, J.; Zhuang, Z.; et al. Developmental Neurotoxicity of Difenoconazole in Zebrafish Embryos. Toxics 2023, 11, 353. [Google Scholar] [CrossRef]
  38. Worthington, C.R.; Elliott, G.F. Muscle contraction: Energy rate equations in relation to efficiency and step-size distance. Int. J. Biol. Macromol. 2003, 32, 149–158. [Google Scholar] [CrossRef]
  39. Clegg, A.; Hassan-Smith, Z. Frailty and the endocrine system. Lancet Diabetes Endocrinol. 2018, 6, 743–752. [Google Scholar] [CrossRef]
  40. Wilkinson, H.N.; Hardman, M.J. The role of estrogen in cutaneous ageing and repair. Maturitas 2017, 103, 60–64. [Google Scholar] [CrossRef]
  41. Guan, Y.; Zhu, X.; Liang, J.; Wei, M.; Huang, S.; Pan, X. Upregulation of HSPA1A/HSPA1B/HSPA7 and downregulation of HSPA9 were related to poor survival in colon cancer. Front. Oncol. 2021, 11, 749673. [Google Scholar] [CrossRef] [PubMed]
  42. Song, B.; Shen, S.; Fu, S.; Fu, J. HSPA6 and its role in cancers and other diseases. Mol. Biol. Rep. 2022, 49, 10565–10577. [Google Scholar] [CrossRef] [PubMed]
  43. Xiang, Y.; Hwa, J. Regulation of VWF expression, and secretion in health and disease. Curr. Opin. Hematol. 2016, 23, 288–293. [Google Scholar] [CrossRef] [PubMed]
  44. Wang, S.; Pang, L.; Liu, Z.; Meng, X. SERPINE1 associated with remodeling of the tumor microenvironment in colon cancer progression: A novel therapeutic target. BMC Cancer 2021, 21, 767. [Google Scholar] [CrossRef]
  45. Uchil, P.D.; Hinz, A.; Siegel, S.; Coenen-Stass, A.; Pertel, T.; Luban, J.; Mothes, W. TRIM protein-mediated regulation of inflammatory and innate immune signaling and its association with antiretroviral activity. J. Virol. 2013, 87, 257–272. [Google Scholar] [CrossRef]
  46. Alderdice, M.; Craig, S.G.; Humphries, M.P.; Gilmore, A.; Johnston, N.; Bingham, V.; Coyle, V.; Senevirathne, S.; Longley, D.B.; Loughrey, M.B.; et al. Evolutionary genetic algorithm identifies IL2RB as a potential predictive biomarker for immune-checkpoint therapy in colorectal cancer. NAR Genom. Bioinform. 2021, 3, lqab016. [Google Scholar] [CrossRef]
  47. Veiga, R.N.; de Oliveira, J.C.; Gradia, D.F. PBX1: A key character of the hallmarks of cancer. J. Mol. Med. 2021, 99, 1667–1680. [Google Scholar] [CrossRef]
Figure 1. Immunotoxicity screening of the pesticides based on the Jurkat T-cell line. (a) Difenoconazole, (b) chlorothalonil, (c) bifenthrin, (d) cypermethrin, (e) dimethoate, (f) omethoate, (g) imidacloprid, (h) acetamiprid, (i) iprodione, and (j) chlorpyrifos.
Foods 13 00034 g001
Figure 2. Effect of single and joint exposure to pesticides on Jurkat T-cell viability. (a,b) Jurkat cells exposed for 36 h to difenoconazole and chlorothalonil, respectively; (c,d) nonlinear curve fitting results of different effective concentrations (ECs) using the results of (a,b), respectively; (e) effects of joint exposure to difenoconazole and chlorothalonil on Jurkat T-cell viability; (f) combination index (CI) plot for the joint exposure to difenoconazole and chlorothalonil in Jurkat T cells. Dif: difenoconazole, Ch: chlorothalonil, Di+Ch: joint exposure to difenoconazole and chlorothalonil. Values with different superscripted lowercase letters of the same color bars in (a,b,e) are significantly different (p < 0.05).
Foods 13 00034 g002
Figure 3. Single and joint exposure to difenoconazole and chlorothalonil induced apoptosis in Jurkat T cells. (a) EC10 of difenoconazole, (b) EC25 of difenoconazole, (c) EC10 of chlorothalonil, (d) EC25 of chlorothalonil, (e) joint exposure dose of EC10, (f) joint exposure dose of EC25, (g) control, and (h) statistics of the apoptosis data of two independent experiments. Q1, Q2, Q3, and Q4 of the flow cytometry graph indicate dead cells, late apoptotic cells, early apoptotic cells, and normal cells, respectively. CH10 and CH25 indicate that the chlorothalonil exposure doses were EC10 and EC25, respectively; DI10 and DI25 indicate that the difenoconazole exposure doses were EC10 and EC25, respectively; and DC10 and DC25 indicate a joint exposure to difenoconazole and chlorothalonil at doses of EC10 and EC25, respectively.
Foods 13 00034 g003
Figure 4. Statistical overview of the transcriptomics data. (a,b) Venn diagram of the significantly differentially expressed genes; (c,d) principal component analysis (PCA) of the significantly differentially expressed genes; (e,f) statistics of the significantly differentially expressed genes for each comparison. CH10 and CH25 indicate that the chlorothalonil exposure doses were EC10 and EC25, respectively; DI10 and DI25 indicate that the difenoconazole exposure doses were EC10 and EC25, respectively; and DC10 and DC25 indicate a joint exposure to difenoconazole and chlorothalonil at doses of EC10 and EC25, respectively; Ctr: Control.
Foods 13 00034 g004
Figure 5. Gene ontology enrichment analysis of the significantly differentially expressed genes at single and joint exposure doses of EC10. (a) Ctr_vs_CH10, (b) Ctr_vs_DI10, (c) Ctr_vs_DC10, (d) CH10_vs_DI10, (e) CH10_vs_DC10, and (f) DI10_vs_DC10. CH10 and CH25 indicate that the chlorothalonil exposure doses were EC10 and EC25, respectively; DI10 and DI25 indicate that the difenoconazole exposure doses were EC10 and EC25, respectively; and DC10 and DC25 indicate a joint exposure to difenoconazole and chlorothalonil at doses of EC10 and EC25, respectively; Ctr: Control.
Foods 13 00034 g005
Figure 6. Gene ontology enrichment analysis of the significantly differentially expressed genes at single and joint exposure doses of EC25. (a) Ctr_vs_CH25, (b) Ctr_vs_DI25, (c) Ctr_vs_DC25, (d) CH25_vs_DI25, (e) CH25_vs_DC25, and (f) DI25_vs_DC25.
Foods 13 00034 g006
Figure 7. KEGG enrichment analysis of the significantly differentially expressed genes at single and joint exposure doses of EC10. (a) Ctr_vs_CH10, (b) Ctr_vs_DI10, (c) Ctr_vs_DC10, (d) CH10_vs_DI10, (e) CH10_vs_DC10, and (f) DI10_vs_DC10.
Foods 13 00034 g007
Figure 8. KEGG enrichment analysis of the significantly differentially expressed genes at single and joint exposure doses of EC25. (a) Ctr_vs_CH25, (b) Ctr_vs_DI25, (c) Ctr_vs_DC25, (d) CH25_vs_DI25, (e) CH25_vs_DC25, and (f) DI25_vs_DC25.
Foods 13 00034 g008
Figure 9. Quantitative real-time PCR results for the selected genes. Data are expressed as the mean ± SD from two independent experiments.
Foods 13 00034 g009
Disclaimer/Publisher’s Note: The statements, opinions and data contained in all publications are solely those of the individual author(s) and contributor(s) and not of MDPI and/or the editor(s). MDPI and/or the editor(s) disclaim responsibility for any injury to people or property resulting from any ideas, methods, instructions or products referred to in the content.

