

Towards a Standardized Approach for the Geographical Traceability of Plant Foods Using Inductively Coupled Plasma Mass Spectrometry (ICP-MS) and Principal Component Analysis (PCA)

 , ,
, ,  , and
, and
Abstract
1. Introduction

| Plant-Based Food Matrix | Elements | Range (mg.kg−1) | Ref |
|---|---|---|---|
| F: Peppers, tomato N: Wheat, corn, rice T: Potatoes, carrots | Micro: As, Pb, Cu, Cd, Zn, Sn, Hg | F: 0.002–1.896 N: <0.001–9.327 T: <0.001–2.37 | [27] |
| F: golden berry (Physalis peruviana), palm (Euterpe edulis), acai (Euterpe precatoria) N: Brazil nut (Bertholletia excels) | Macro: 44Ca, 39K, 24Mg, 31P Micro: 59Co, 65Cu, 60Ni, 85Rb | Macro: F: 57.9–22,382 N: 544–26,180 Micro: F: 0.024–24 N: 1.1–191 | [39] |
| N: Brown and white rice in South Korea | Macro: Al, Ba, Ca, Fe, K, Mg, P, S, Micro: As, Cd, Co, Cr, Cu, Mn, Ni, Pb, Sb, Se, Zn | Macro: 0.367–2103 Micro: 4 × 10⁻⁴-26 | [40] |
| F: Black Pepper | Macro: K, Ca, Mg, Fe, Ba Micro: Mn, Cr, Ni, Ti, Cu, Se, Mo, Co, Sr, Pb, Pt, Sb, Y | Macro: 12.13–2774 Micro: 0.04–99.89 | [1] |
| N: Cocoa | Macro: Na, Ba, Fe, Mg, Al Micro: Cr, La, Ce, Mo, Cs, Ga, Ti, Y, Cu, Cd, Mn, Ni, As, Pb, V, Co, Rb, Zn, Sr, | Macro: 5.4–3200 Micro: 0.01–25 | [41] |
| N: Peanuts (Arachis hypogaea L.) | Macro: 11B, 23Na, 54Fe, 56Fe Micro: 59Co, 52Cr, 53Cr, 58Ni, 60Ni, 61Ni, 62Ni, 82Se, 63Cu, 65Cu, 98Mo, 66Zn | Macro: 16.9–7440 Micro: 0.0206–28.3 | [42] |
| F: Tomato (Lycopersicon esculentum) | Macro: Al, Ba, Fe, Micro: Cd, Co, Cr, Cu, Hg, Mn, Ni, Se, Sn, Sr, V, Zn | Macro: <0.025–57.8 Micro: <0.008–29.5 | [43] |
| N: Wheat, millet, corn, soybean | Macro: Li, K, Mg, Ca, Fe Micro: Zn, Mn, Cu, Mo, Se | Macro: 0.012–2285 Micro: 0.0–15.11 | [44] |
| N: Rice | Macro: 23Na, 25Mg, 44Ca, 56Fe, Micro: 65Cu, 66Zn, 75As, 111Cd, 55Mn, | Macro: 0.049–28 Micro: 0.02–9.4 | [45] |
| N: Cocoa | Micro: Cd, Sb, Pb, As, Cr, Se, V | 0.026–1.315 | [46] |
| F: Passion (Passiflora edulis), star anise (Illicium verum) | Micro: 75As, 112Cd, 59Co, 53Cr, 65Cu, 55Mn, 60Ni, 208Pb, 88Sr, 51V, 64Zn | 0.034–276 | [47] |
| F: Cape gooseberry (Physalis peruviana L.) | Micro: Co, Cu, Se | 0.03–6.7 | [48] |
| V: Tea | Macro: Fe, K, Br, Ca Micro: Cu, Cr, Si | Macro: 86–6785 Micro: 2–124 | [49] |
| T: Alpinia oxyphylla and Morinda officinalis | Macro: Mg, K, Ca, Na, Fe, Al, Ba, Micro: Zn, Mn, Cu, Mo, Cr, Ni, As, Se, Cd, Hg, Tl, Pb, V | Macro: 26.18–24,890 Micro: 0.66–186 | [50] |
| F: Capsicum annuum, C. chinense and C. frutescens | Macro: Mg, P, K, Ca, B, Fe, Micro: Cu, Zn Mn, | Macro: 30–75,600 Micro: 2–185 | [51] |
| N: Pea (Pisum sativum L., cv. Bohun) | Micro: Cd, Cu, Pb, Zn | 3.3–425 | [52] |
| F: Black, green olive | Macro: Mg, Fe Micro: Cr, Co, Ni, Cu, Zn, Sn, Cd, Pb | Macro: 7.08–79.28 Micro: 0.06–39.06 | [53] |
| F: Blueberry, Strawberry | Macro: 11B, 23Na, 24Mg, 27Al, 31P, 39K, 43Ca, 57Fe Micro: 53Cr, 55Mn, 60Ni, 63Cu, 66Zn, 72Ge, 75As, 82Se, 111Cd, 208Pb | Macro: 1.54–5960 Micro: 0.0057–142 | [54] |
| N: Macadamia, lotus, pistachios, sunflower, pine, almond, walnut, chestnut, hazelnut, cashew, ginkgo | Macro: Li, Ba Micro: Cr, Mn, Co, Cu, Zn, As, Se, Rb, Sr, Mo, Cd, Cs, Pb, Th, U | Macro: 0.01–4.5 Micro: 0.0004–40 | [55] |
| N: Rice (Oryza sativa L.) | Micro: Zn, Cd, Sb, Pb, As | N.A | [56] |
| V: Safflower (Carthamus tinctorius L.) | Macro: Al, Ca, Fe, Mg Micro: As, Cd, Cu, Hg, Pb, Co, Cr, Mn, Mo, Ni, P, Se, Sr, V, Zn | Macro: 565–12,484 Micro: 0.046–108.43 | [57] |
| V: Sunflower (Helianthus annuus) | Macro: Ca, Fe, K, P, S Micro: Cd, Ce, Cr, Cu, La, Mn, Ni, Zn | Macro: 1000–35,800 Micro: 1.01–80 | [58] |
| N: Rice, wheat T: Panax V: Celery, astragalus, spirulina, garlic | Macro: K, Na, Ba, Ca, Mg, P, Micro: 59Co, 133Cs, 63Cu, 95Mo, 60Ni, 208Pb, 85Rb, 232Th, 238U, 45Sc, 89Y, 140Ce, 163Dy, 166Er, 153Eu, 157Gd, 165Ho, 139La, 175Lu, 146Nd, 141Pr, 147Sm, 159Tb, 169Tm, 172Yb, 9Be, 209Bi, | Macro: N: 50–250 T: 44–1050 V: 5.8–1300 Micro: N: 0.0002–0.85 T: 0.00028–0.36 V: 0.00012.4–0.213 | [59] |
| N: Soybean | Micro: Cu, Zn | N.A | [60] |
| N: Rice in southern Brazil | Macro: Fe, Mg Micro: As, Cd, Co, Cu, Mn, Ni, Se, Zn | Macro: 15.56–94 Micro: 0.00045–0.5 | [61] |
| V: Tea | Macro: Fe, Al Micro: Pb, As, Cd, Cu, Zn, Se Mo, Cr | Macro: 1510–3100 Micro: 0.034–197 | [62] |
| F: Pepper, tomato, aubergine, apricot, peach, plum, olive, grape, prune, zucchini N: Pea, hazelnut, walnut T: Potato, turnip V: Lettuce, chicory, endive, cabbage, fennel | Micro: Co, Cr, Cu, Mn, Mo, Ni, Sr, Tl, U, V, Zn | F: 3 × 10⁻⁴– 5.5 N: 2 × 10⁻⁴–21 T: 9 × 10⁻⁴–5.34 V: 1,2 × 10⁻⁴–3.82 | [63] |
| F: Tomato V: Artichoke | Micro: 75As, 60Ni, 202Hg, 51V, 208Pb, 111Cd, 63Cu, 52Cr | F: 3 × 10⁻⁶–1.934 V: 3 × 10⁻⁶–2.378 | [64] |
| N: Maize T: Potato, radish V: Cabbage, pakchoi, scallion, garlic, lettuce, parsley, tine peas, spinach | Micro: Cd, Cr, Cu, Pb, Zn | N: 0.8–12.9 T: 1.1–64.8 V: 0.3–90.4 | [65] |
| F: Hot pepper N: Rice, bean T: Carrot, radish, potato V: Cabbage, H. houttuyniae, celery, garlic stem | Micro: Hg, Pb, Cd, Mn, Se | F: 0.00013–0.0426 N: 0.00001–0.0308 T: 0.00004–0.0122 V: 0.00102–0.646 | [66] |
| F: Banana, mango N: Maize T: Cassava V: Amaranthus tricolour | Micro: Zn, Cu, Co, Ni, As, Cd, Cr, Pb, Mn | F: 0.0–7.14 N: 0.0–16.3 T: 0.0–15.4 V: 0.0–25 | [67] |
2. Methods
2.1. Multielement and Accuracy Analysis
2.1.1. Multielement Analysis
- The elements not recommended for ICP-MS are B, Si, Cl, Ca, Br, Hg, P, S, Zr, Nb, Tc, I, Hf, Ta, W, and Os.
- The elements that cannot measured by ICP-MS are H, He, C, N, O, F, Ne, Ar, Kr, Xe, Pm, Po, At, Rn, Fr, Ra, Ac, Pa, Np, Pu, Am, Cm, Bk, Cf, Es, Fm, Md, No, Lr, Rf, Db, Sg, Bh, Hs, Mt, Ds, Rg, Cn, Nh, Fl, Mc, Lv, Ts, and Og.
2.1.2. Sample Preparation
2.2. PCA Tools
3. Discussion
3.1. Applications of ICP-MS Combined with PCA for Determining the Origin of Agricultural Products
3.2. The Necessity of Standardization for Geographical Traceability Methods
3.2.1. Current Related Standard
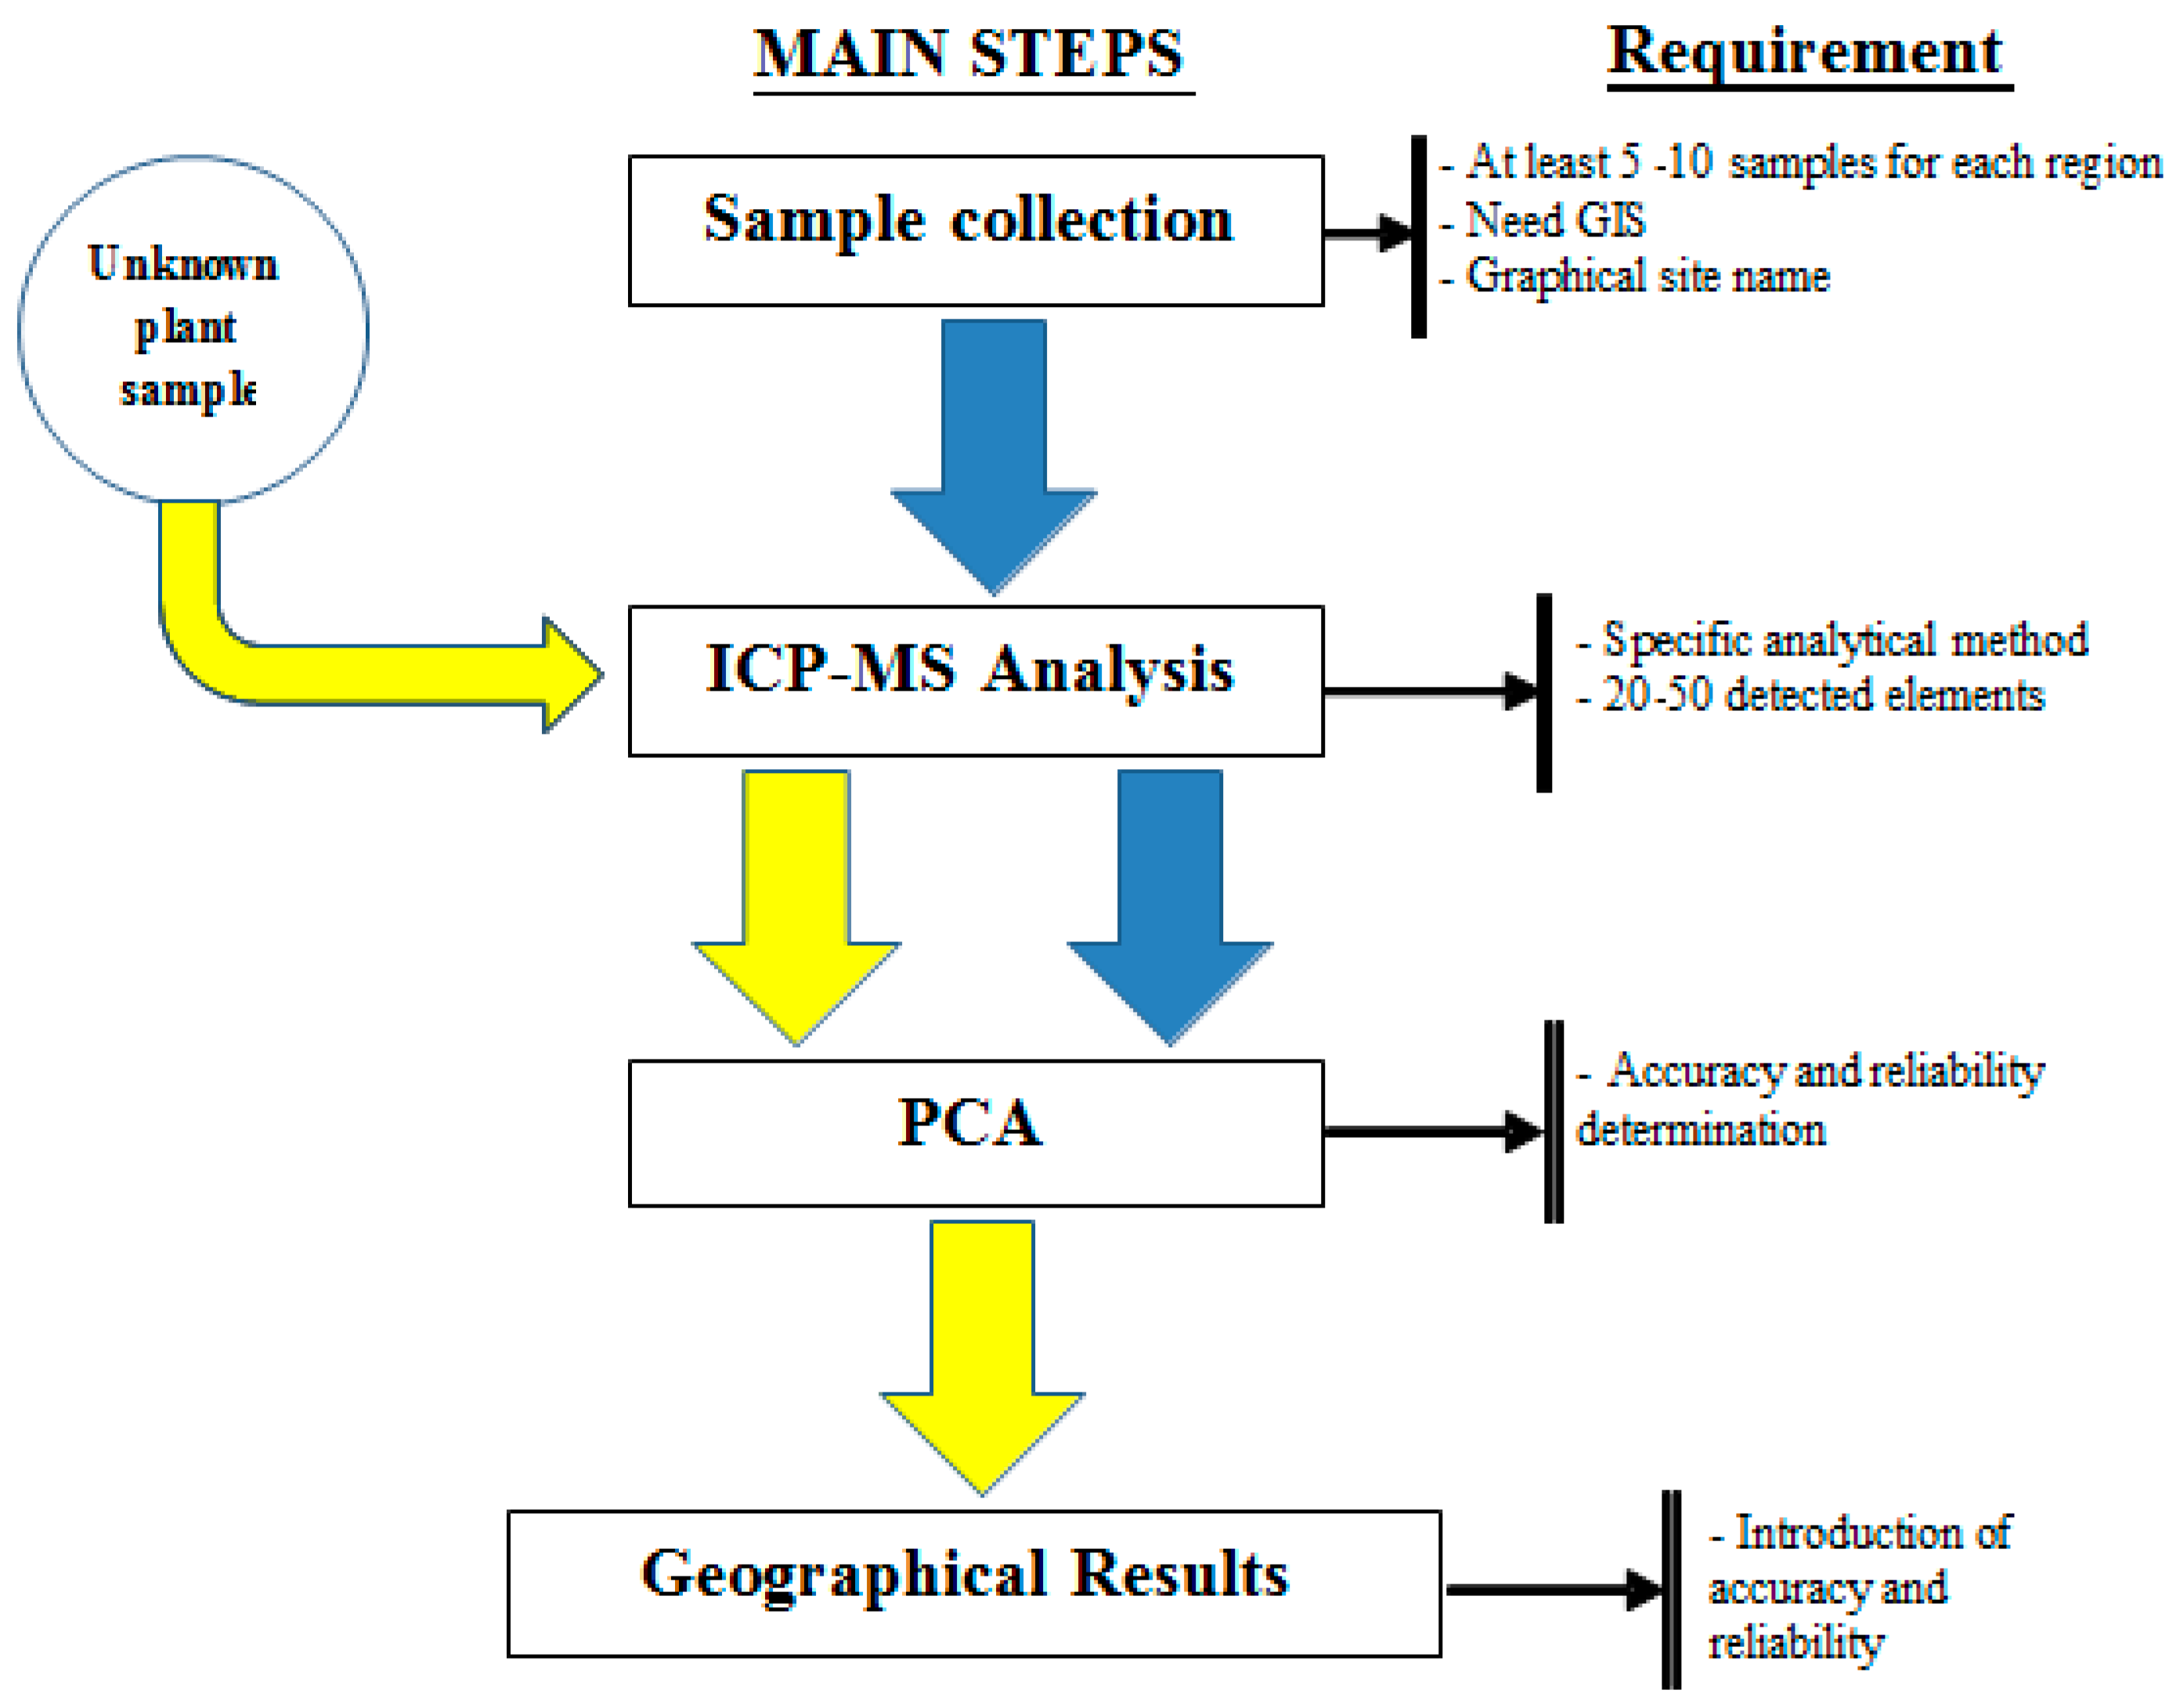
3.2.2. Main Steps of the Proposed Standard Method
- Step 1—Sample Collection: the received samples must ensure relevant information about the variable, geographical details, and coordinates. The collection of samples should include at least 5 or 10 samples per geographical region.
- Step 2—Sample Analysis includes two methods: sample preparation and analysis. These methods are built depending on the equipment of each laboratory. However, it is necessary to ensure the analysis of at least 20 elements on the ICP-MS equipment. When building the standard, it is necessary to specify which elements and parameters of the method are included.
- Step 3—Input data into PCA: it is necessary to set parameters for the PCA software. The PCA method needs to determine accuracy and reliability.
4. Conclusions
Author Contributions
Funding
Data Availability Statement
Conflicts of Interest
References
- Houk, R.S.; Fassel, V.A.; Flesch, G.D.; Svec, H.J.; Gray, A.L.; Taylor, C.E. Inductively coupled argon plasma as an ion source for mass spectrometric determination of trace elements. Anal. Chem. 1980, 52, 2283–2289. [Google Scholar] [CrossRef]
- Cubadda, F. Chapter 19: Inductively coupled plasma mass spectrometry. In Food Toxicant Analysis–Techniques, Strategies and Developments; Elsevier: Amsterdam, The Netherlands, 2007; pp. 697–751. [Google Scholar] [CrossRef]
- Chan, Q.; Caruso, J.A. Chapter 14: Plasma-based gas chromatography detectors. Gas Chromatogr. 2012, 355–373. [Google Scholar] [CrossRef]
- Ammann, A.A. Inductively coupled plasma mass spectrometry (ICP MS): A versatile tool. J. Mass Spectrom. 2007, 42, 419–427. [Google Scholar] [CrossRef] [PubMed]
- Duane, M.; Facchetti, S. On-site environmental water analyses by ICP-MS. Sci. Total. Environ. 1995, 172, 133–144. [Google Scholar] [CrossRef]
- Cubadda, F. Inductively coupled plasma-mass spectrometry for the determination of elements and elemental species in food: A review. J. AOAC Int. 2004, 87, 173–204. [Google Scholar] [CrossRef]
- Kim, J.S.; Hwang, I.M.; Lee, G.H.; Park, Y.M.; Choi, J.Y.; Jamila, N.; Khan, N.; Kim, K.S. Geographical origin authentication of pork using multi-element and multivariate data analyses. Meat Sci. 2017, 123, 13–20. [Google Scholar] [CrossRef] [PubMed]
- Qi, J.; Li, Y.; Zhang, C.; Wang, C.; Wang, J.; Guo, W.; Wang, S. Geographic origin discrimination of pork from different Chinese regions using mineral elements analysis assisted by machine learning techniques. Food Chem. 2020, 337, 127779. [Google Scholar] [CrossRef] [PubMed]
- Fernandes, E.A.D.N.; Sarriés, G.A.; Bacchi, M.A.; Mazola, Y.T.; Gonzaga, C.L.; Sarriés, S.R. Trace elements and machine learning for Brazilian beef traceability. Food Chem. 2020, 333, 127462. [Google Scholar] [CrossRef] [PubMed]
- Gerber, N.; Brogioli, R.; Hattendorf, B.; Scheeder, M.; Wenk, C.; Günther, D. Variability of selected trace elements of different meat cuts determined by ICP-MS and DRC-ICPMS. Animal 2009, 3, 166–172. [Google Scholar] [CrossRef]
- Ogbomida, E.T.; Nakayama, S.M.; Bortey-Sam, N.; Oroszlany, B.; Tongo, I.; Enuneku, A.A.; Ozekeke, O.; Ainerua, M.O.; Fasipe, I.P.; Ezemonye, L.I.; et al. Accumulation patterns and risk assessment of metals and metalloid in muscle and offal of free-range chickens, cattle and goat in Benin City, Nigeria. Ecotoxicol. Environ. Saf. 2018, 151, 98–108. [Google Scholar] [CrossRef]
- Li, S.-W.; He, Y.; Zhao, H.-J.; Wang, Y.; Liu, J.-J.; Shao, Y.-Z.; Li, J.-L.; Sun, X.; Zhang, L.-N.; Xing, M.-W. Assessment of 28 trace elements and 17 amino acid levels in muscular tissues of broiler chicken (Gallus gallus) suffering from arsenic trioxide. Ecotoxicol. Environ. Saf. 2017, 144, 430–437. [Google Scholar] [CrossRef] [PubMed]
- Bajaj, A.O.; Parker, R.; Farnsworth, C.; Law, C.; Johnson-Davis, K.L. Method validation of multi-element panel in whole blood by inductively coupled plasma mass spectrometry (ICP-MS). J. Mass Spectrom. Adv. Clin. Lab 2023, 27, 33–39. [Google Scholar] [CrossRef] [PubMed]
- Wang, Q.; Liu, H.; Zhao, S.; Qie, M.; Bai, Y.; Zhang, J.; Guo, J.; Zhao, Y. Discrimination of mutton from different sources (regions, feeding patterns and species) by mineral elements in Inner Mongolia, China. Meat Sci. 2021, 174, 108415. [Google Scholar] [CrossRef] [PubMed]
- Sun, S.; Guo, B.; Wei, Y.; Fan, M. Multi-element analysis for determining the geographical origin of mutton from different regions of China. Food Chem. 2011, 124, 1151–1156. [Google Scholar] [CrossRef]
- Giannenas, I.; Nisianakis, P.; Gavriil, A.; Kontopidis, G.; Kyriazakis, I. Trace mineral content of conventional, organic and courtyard eggs analysed by inductively coupled plasma mass spectrometry (ICP-MS). Food Chem. 2009, 114, 706–711. [Google Scholar] [CrossRef]
- Mi, S.; Shang, K.; Zhang, C.-H.; Fan, Y.-Q. Characterization and discrimination of selected chicken eggs in China’s retail market based on multi-element and lipidomics analysis. Food Res. Int. 2019, 126, 108668. [Google Scholar] [CrossRef] [PubMed]
- Lee, J.; Park, Y.-S.; Lee, H.-J.; Koo, Y.E. Microwave-assisted digestion method using diluted nitric acid and hydrogen peroxide for the determination of major and minor elements in milk samples by ICP-OES and ICP-MS. Food Chem. 2021, 373, 131483. [Google Scholar] [CrossRef] [PubMed]
- Hoffman, T.; Jaćimović, R.; Bay, L.J.; Griboff, J.; Jagodic, M.; Monferrán, M.; Ogrinc, N.; Podkolzin, I.; Wunderlin, D.; Almirall, J. Development of a method for the elemental analysis of milk powders using laser ablation-inductively coupled plasma-mass spectrometry (LA-ICP-MS) and its potential use in geographic sourcing. Talanta 2018, 186, 670–677. [Google Scholar] [CrossRef]
- Pinto, F.R.; Duarte, A.M.; Silva, F.; Barroso, S.; Mendes, S.; Pinto, E.; Almeida, A.; Sequeira, V.; Vieira, A.R.; Gordo, L.S.; et al. Annual variations in the mineral element content of five fish species from the Portuguese coast. Food Res. Int. 2022, 158, 111482. [Google Scholar] [CrossRef]
- Varrà, M.O.; Husáková, L.; Patočka, J.; Ghidini, S.; Zanardi, E. Multi-element signature of cuttlefish and its potential for the discrimination of different geographical provenances and traceability. Food Chem. 2021, 356, 129687. [Google Scholar] [CrossRef]
- Ricardo, F.; Mamede, R.; Bispo, R.; Santos, A.; da Silva, E.F.; Patinha, C.; Calado, R. Cost-efficiency improvement of bivalves shells preparation when tracing their geographic origin through ICP-MS analysis of elemental fingerprints. Food Control 2020, 118, 107383. [Google Scholar] [CrossRef]
- Qin, L.-Y.; Zhang, R.-C.; Liang, Y.-D.; Wu, L.-C.; Zhang, Y.-J.; Mu, Z.-L.; Deng, P.; Yang, L.-L.; Zhou, Z.; Yu, Z.-P. Concentrations and health risks of heavy metals in five major marketed marine bivalves from three coastal cities in Guangxi, China. Ecotoxicol. Environ. Saf. 2021, 223, 112562. [Google Scholar] [CrossRef] [PubMed]
- Dang, T.T.; Vo, T.A.; Duong, M.T.; Pham, T.M.; Van Nguyen, Q.; Nguyen, T.Q.; Bui, M.Q.; Syrbu, N.N.; Van Do, M. Heavy metals in cultured oysters (Saccostrea glomerata) and clams (Meretrix lyrata) from the northern coastal area of Vietnam. Mar. Pollut. Bull. 2022, 184, 114140. [Google Scholar] [CrossRef]
- Vilhena, M.P.; Costa, M.L.; Berrêdo, J.F.; Paiva, R.S.; Souza, C.C. Chemical elements in pearl oysters (Paxyodon ponderosus), phytoplankton and estuarine sediments from eastern Amazon (Northern Brazil): Bioaccumulation factors and trophic transfer factors. J. South Am. Earth Sci. 2016, 67, 1–10. [Google Scholar] [CrossRef]
- Zhou, Q.; Liu, L.; Liu, N.; He, B.; Hu, L.; Wang, L. Determination and characterization of metal nanoparticles in clams and oysters. Ecotoxicol. Environ. Saf. 2020, 198, 110670. [Google Scholar] [CrossRef]
- Nardi, E.P.; Evangelista, F.S.; Tormen, L.; Saint´pierre, T.D.; Curtius, A.J.; de Souza, S.S.; Barbosa, F. The use of inductively coupled plasma mass spectrometry (ICP-MS) for the determination of toxic and essential elements in different types of food samples. Food Chem. 2009, 112, 727–732. [Google Scholar] [CrossRef]
- Toaldo, I.M.; Fogolari, O.; Pimentel, G.C.; de Gois, J.S.; Borges, D.L.; Caliari, V.; Bordignon-Luiz, M. Effect of grape seeds on the polyphenol bioactive content and elemental composition by ICP-MS of grape juices from Vitis labrusca L. LWT 2013, 53, 1–8. [Google Scholar] [CrossRef]
- Llorent-Martínez, E.J.; de Cordova, M.L.F.; Ruiz-Medina, A.; Ortega-Barrales, P. Analysis of 20 trace and minor elements in soy and dairy yogurts by ICP-MS. Microchem. J. 2012, 102, 23–27. [Google Scholar] [CrossRef]
- Yenisoy-Karakaş, S. Estimation of uncertainties of the method to determine the concentrations of Cd, Cu, Fe, Pb, Sn and Zn in tomato paste samples analysed by high resolution ICP-MS. Food Chem. 2012, 132, 1555–1561. [Google Scholar] [CrossRef]
- Tuzen, M.; Soylak, M. Evaluation of trace element contents in canned foods marketed from Turkey. Food Chem. 2007, 102, 1089–1095. [Google Scholar] [CrossRef]
- Nguyen, T.Q.; Tran-Lam, T.-T.; Nguyen, H.Q.; Dao, Y.H.; Le, G.T. Assessment of organic and inorganic arsenic species in Sengcu rice from terraced paddies and commercial rice from lowland paddies in Vietnam. J. Cereal Sci. 2021, 102, 103346. [Google Scholar] [CrossRef]
- Bui, M.Q.; Quan, T.C.; Nguyen, Q.T.; Tran-Lam, T.-T.; Dao, Y.H. Geographical origin traceability of Sengcu rice using elemental markers and multivariate analysis. Food Addit. Contam. Part B 2022, 15, 177–190. [Google Scholar] [CrossRef] [PubMed]
- Tran-Lam, T.-T.; Bui, M.Q.; Nguyen, H.Q.; Dao, Y.H.; Le, G.T. A combination of chromatography with tandem mass spectrometry systems (UPLC-MS/MS and GC-MS/MS), Modified QuEChERS extraction and mixed-mode SPE clean-up method for the analysis of 656 pesticide residues in rice. Foods 2021, 10, 2455. [Google Scholar] [CrossRef]
- Thi, K.-O.N.; Do, H.-G.; Duong, N.-T.; Nguyen, T.D.; Nguyen, Q.-T. Geographical discrimination of Curcuma longa L. in Vietnam based on LC-HRMS metabolomics. Nat. Prod. Commun. 2021, 16, 1–10. [Google Scholar] [CrossRef]
- Ariyama, K.; Yasui, A. The determination technique of the geographic origin of welsh onions by mineral composition and perspectives for the future. Jpn. Agric. Res. Q. JARQ 2006, 40, 333–339. [Google Scholar] [CrossRef]
- Luykx, D.M.; van Ruth, S.M. An overview of analytical methods for determining the geographical origin of food products. Food Chem. 2008, 107, 897–911. [Google Scholar] [CrossRef]
- Mazarakioti, E.C.; Zotos, A.; Thomatou, A.-A.; Kontogeorgos, A.; Patakas, A.; Ladavos, A. Inductively coupled plasma-mass spectrometry (ICP-MS), a useful tool in authenticity of agricultural products’ and foods’ origin. Foods 2022, 11, 3705. [Google Scholar] [CrossRef]
- Moreda-Piñeiro, J.; Sánchez-Piñero, J.; Mañana-López, A.; Turnes-Carou, I.; Alonso-Rodríguez, E.; López-Mahía, P.; Muniategui-Lorenzo, S. Multi-element determinations in foods from Amazon region by ICP-MS after enzymatic hydrolysis assisted by pressurisation and microwave energy. Microchem. J. 2018, 137, 402–409. [Google Scholar] [CrossRef]
- Lee, J.; Park, Y.-S.; Lee, D.Y. Fast and green microwave-assisted digestion with diluted nitric acid and hydrogen peroxide and subsequent determination of elemental composition in brown and white rice by ICP-MS and ICP-OES. LWT 2023, 173, 114351. [Google Scholar] [CrossRef]
- Acierno, V.; de Jonge, L.; van Ruth, S. Sniffing out cocoa bean traits that persist in chocolates by PTR-MS, ICP-MS and IR-MS. Food Res. Int. 2020, 133, 109212. [Google Scholar] [CrossRef] [PubMed]
- Chung, I.-M.; Kim, J.-K.; Lee, J.-K.; Kim, S.-H. Discrimination of geographical origin of rice (Oryza sativa L.) by multielement analysis using inductively coupled plasma atomic emission spectroscopy and multivariate analysis. J. Cereal Sci. 2015, 65, 252–259. [Google Scholar] [CrossRef]
- Kim-Yen, P.T.; Graeme, C.W.; Lee, N.A. Inductively coupled plasma-mass spectrometry (ICP-MS) and -optical emission spectroscopy (ICP–OES) for determination of essential minerals in closed acid digestates of peanuts (Arachis hypogaea L.). Food. Chem. 2012, 134, 453–460. [Google Scholar]
- Bressy, F.C.; Brito, G.B.; Barbosa, I.S.; Teixeira, L.S.G.; Korn, M.G.A. Determination of trace element concentrations in tomato samples at different stages of maturation by ICP OES and ICP-MS following microwave-assisted digestion. Microchem. J. 2013, 109, 145–149. [Google Scholar] [CrossRef]
- Ferreira, N.; Henriques, B.; Viana, T.; Carvalho, L.; Tavares, D.; Pinto, J.; Jacinto, J.; Colónia, J.; Pereira, E. Validation of a methodology to quantify macro, micro, and potentially toxic elements in food matrices. Food Chem. 2023, 404, 134669. [Google Scholar] [CrossRef]
- Dico, G.M.L.; Galvano, F.; Dugo, G.; D’Ascenzi, C.; Macaluso, A.; Vella, A.; Giangrosso, G.; Cammilleri, G.; Ferrantelli, V. Toxic metal levels in cocoa powder and chocolate by ICP-MS method after microwave-assisted digestion. Food Chem. 2018, 245, 1163–1168. [Google Scholar] [CrossRef] [PubMed]
- Nunes, M.A.; Voss, M.; Corazza, G.; Flores, E.M.; Dressler, V.L. External calibration strategy for trace element quantification in botanical samples by LA-ICP-MS using filter paper. Anal. Chim. Acta 2016, 905, 51–57. [Google Scholar] [CrossRef]
- Wojcieszek, J.; Ruzik, L. Operationally defined species characterization and bioaccessibility evaluation of cobalt, copper and selenium in Cape gooseberry (Physalis peruviana L.) by SEC-ICP MS. J. Trace Elem. Med. Biol. 2016, 34, 15–21. [Google Scholar] [CrossRef] [PubMed]
- Gondal, M.; Habibullah, Y.; Baig, U.; Oloore, L. Direct spectral analysis of tea samples using 266 nm UV pulsed laser-induced breakdown spectroscopy and cross validation of LIBS results with ICP-MS. Talanta 2016, 152, 341–352. [Google Scholar] [CrossRef]
- Zhao, X.; Wei, J.; Shu, X.; Kong, W.; Yang, M. Multi-elements determination in medical and edible Alpinia oxyphylla and Morinda officinalis and their decoctions by ICP-MS. Chemosphere 2016, 164, 430–435. [Google Scholar] [CrossRef] [PubMed]
- Ahmad, I.; Rawoof, A.; Dubey, M.; Ramchiary, N. ICP-MS based analysis of mineral elements composition during fruit development in Capsicum germplasm. J. Food Compos. Anal. 2021, 101, 103977. [Google Scholar] [CrossRef]
- Hanć, A.; Malecka, A.; Kutrowska, A.; Bagniewska-Zadworna, A.; Tomaszewska, B.; Barałkiewicz, D. Direct analysis of elemental biodistribution in pea seedlings by LA-ICP-MS, EDX and confocal microscopy: Imaging and quantification. Microchem. J. 2016, 128, 305–311. [Google Scholar] [CrossRef]
- Şahan, Y.; Basoglu, F.; Gücer, S. ICP-MS analysis of a series of metals (Namely: Mg, Cr, Co, Ni, Fe, Cu, Zn, Sn, Cd and Pb) in black and green olive samples from Bursa, Turkey. Food Chem. 2007, 105, 395–399. [Google Scholar] [CrossRef]
- Zhang, H.; Wang, Z.-Y.; Yang, X.; Zhao, H.-T.; Zhang, Y.-C.; Dong, A.-J.; Jing, J.; Wang, J. Determination of free amino acids and 18 elements in freeze-dried strawberry and blueberry fruit using an Amino Acid Analyzer and ICP-MS with micro-wave digestion. Food Chem. 2014, 147, 189–194. [Google Scholar] [CrossRef]
- Yin, L.L.; Tian, Q.; Shao, X.Z.; Kong, X.Y.; Ji, Y.Q. Determination of trace elements in edible nuts in the Beijing market by ICP-M. Biomed. Environ. Sci. 2015, 28, 449–454. [Google Scholar] [CrossRef] [PubMed]
- Basnet, P.; Amarasiriwardena, D.; Wu, F.; Fu, Z.; Zhang, T. Investigation of tissue level distribution of functional groups and associated trace metals in rice seeds (Oryza sativa L.) using FTIR and LA-ICP-MS. Microchem. J. 2016, 127, 152–159. [Google Scholar] [CrossRef]
- Jia, L.-H.; Li, Y.; Li, Y.-Z. Determination of wholesome elements and heavy metals in safflower (Carthamus tinctorius L.) from Xinjiang and Henan by ICP-MS/ICP-AES. J. Pharm. Anal. 2011, 1, 100–103. [Google Scholar] [CrossRef] [PubMed]
- von Wuthenau, K.; Segelke, T.; Müller, M.-S.; Behlok, H.; Fischer, M. Food authentication of almonds (Prunus dulcis mill). Origin analysis with inductively coupled plasma mass spectrometry (ICP-MS) and chemometrics. Food Control 2021, 134, 108689. [Google Scholar] [CrossRef]
- Zhang, N.; Li, Z.; Zheng, J.; Yang, X.; Shen, K.; Zhou, T.; Zhang, Y. Multielemental analysis of botanical samples by ICP-OES and ICP-MS with focused infrared lightwave ashing for sample preparation. Microchem. J. 2017, 134, 68–77. [Google Scholar] [CrossRef]
- Yip, Y.-C.; Chan, K.-K.; Cheung, P.-Y.; Poon, K.-W.; Sham, W.-C. Analysis of non-fat soybean powder for the mass fractions of three elements: Copper and zinc by isotope dilution ICP-MS and calcium by ICP-AES. Food Chem. 2008, 112, 1065–1071. [Google Scholar] [CrossRef]
- Monteiro, L.R.; Lange, C.N.; Freire, B.M.; Pedron, T.; da Silva, J.J.C.; de Magalhães, A.M.; Pegoraro, C.; Busanello, C.; Batista, B.L. Inter- and intra-variability in the mineral content of rice varieties grown in various microclimatic regions of southern Brazil. J. Food Compos. Anal. 2020, 92, 103535. [Google Scholar] [CrossRef]
- Novotnik, B.; Zuliani, T.; Ščančar, J.; Milačič, R. Content of trace elements and chromium speciation in Neem powder and tea infusions. J. Trace Elem. Med. Biol. 2015, 31, 98–106. [Google Scholar] [CrossRef] [PubMed]
- Esposito, M.; De Roma, A.; Cavallo, S.; Miedico, O.; Chiaravalle, E.; Soprano, V.; Baldi, L.; Gallo, P. Trace elements in vegetables and fruits cultivated in Southern Italy. J. Food Compos. Anal. 2019, 84, 103302. [Google Scholar] [CrossRef]
- Salvo, A.; La Torre, G.L.; Mangano, V.; Casale, K.E.; Bartolomeo, G.; Santini, A.; Granata, T.; Dugo, G. Toxic inorganic pollutants in foods from agricultural producing areas of Southern Italy: Level and risk assessment. Ecotoxicol. Environ. Saf. 2018, 148, 114–124. [Google Scholar] [CrossRef]
- Wang, Y.; Wang, R.; Fan, L.; Chen, T.; Bai, Y.; Yu, Q.; Liu, Y. Assessment of multiple exposure to chemical elements and health risks among residents near Huodehong lead-zinc mining area in Yunnan, Southwest China. Chemosphere 2017, 174, 613–627. [Google Scholar] [CrossRef] [PubMed]
- Wang, X.; Li, Y.-F.; Li, B.; Dong, Z.; Qu, L.; Gao, Y.; Chai, Z.; Chen, C. Multielemental contents of foodstuffs from the Wanshan (China) mercury mining area and the potential health risks. Appl. Geochem. 2011, 26, 182–187. [Google Scholar] [CrossRef]
- Mwesigye, A.R.; Young, S.D.; Bailey, E.H.; Tumwebaze, S.B. Population exposure to trace elements in the Kilembe copper mine area, Western Uganda: A pilot study. Sci. Total. Environ. 2016, 573, 366–375. [Google Scholar] [CrossRef]
- Le, V.N.; Nguyen, Q.T.; Nguyen, T.D.; Nguyen, N.T.; Janda, T.; Szalai, G.; Le, T.G. The potential health risks and environmental pollution associated with the application of plant growth regulators in vegetable production in several suburban areas of Hanoi, Vietnam. Biol. Futur. 2020, 71, 323–331. [Google Scholar] [CrossRef]
- Le, V.N.; Nguyen, Q.T.; Nguyen, N.T.; Janda, T.; Szalai, G.; Nguyen, T.D.; Le, T.G. Foliage apllied gibberelic acid influences growth, nutrient contents and quality of lettuces (Lactuca sativa L.). J. Anim. Plant Sci. 2021, 31, 374. [Google Scholar] [CrossRef]
- Le, T.M.; Pham, P.T.; Nguyen, T.Q.; Bui, M.Q.; Nguyen, H.Q.; Vu, N.D.; Kannan, K.; Tran, T.M. A survey of parabens in aquatic environments in Hanoi, Vietnam and its implications for human exposure and ecological risk. Environ. Sci. Pollut. Res. 2022, 29, 46767–46777. [Google Scholar] [CrossRef]
- Meemken, E.-M.; Barrett, C.B.; Michelson, H.C.; Qaim, M.; Reardon, T.; Sellare, J. Sustainability standards in global agrifood supply chains. Nat. Food 2021, 2, 758–765. [Google Scholar] [CrossRef]
- Henson, S.; Jaffee, S. Standards and Agro-Food Exports from Developing Countries: Rebalancing the Debate; World Bank Publications: Washington, DC, USA, 2004. [Google Scholar] [CrossRef]
- Cartone, A.; Postiglione, P. Principal component analysis for geographical data: The role of spatial effects in the definition of composite indicators. Spat. Econ. Anal. 2020, 16, 126–147. [Google Scholar] [CrossRef]
- Nasr, E.G.; Epova, E.N.; de Diego, A.; Souissi, R.; Hammami, M.; Abderrazak, H.; Donard, O.F.X. Trace elements analysis of Tunisian and European extra virgin olive oils by ICP-MS and chemometrics for geographical discrimination. Foods 2021, 11, 82. [Google Scholar] [CrossRef] [PubMed]
- Drivelos, S.A.; Georgiou, C.A. Multi-element and multi-isotope-ratio analysis to determine the geographical origin of foods in the European Union. TrAC Trends Anal. Chem. 2012, 40, 38–51. [Google Scholar] [CrossRef]
- Rossmann, A. Determination of stable isotope ratios in food analysis. Food Rev. Int. 2001, 17, 347–381. [Google Scholar] [CrossRef]
- Aceto, M.; Bonello, F.; Musso, D.; Tsolakis, C.; Cassino, C.; Osella, D. Wine traceability with rare earth elements. Beverages 2018, 4, 23. [Google Scholar] [CrossRef]
- da Silva, I.J.; Lavorante, A.F.; Paim, A.P.; da Silva, M.J. Microwave-assisted digestion employing diluted nitric acid for mineral determination in rice by ICP OES. Food Chem. 2020, 319, 126435. [Google Scholar] [CrossRef] [PubMed]
- Karamizadeh, S.; Abdullah, S.M.; Manaf, A.A.; Zamani, M.; Hooman, A. An overview of principal component analysis. J. Signal Inf. Process 2013, 04, 173–175. [Google Scholar] [CrossRef]
- Jolliffe, I.T.; Cadima, J. Principal component analysis: A review and recent developments. Philos. Trans. R. Soc. A Math. Phys. Eng. Sci. 2016, 374, 20150202. [Google Scholar] [CrossRef]
- Jolliffe, I.T. Principal component analysis. In Springer Series in Statistics, 2nd ed.; Springer: New York, NY, USA, 2002; pp. 150–166. [Google Scholar] [CrossRef]
- Vidal, N.P.; Manful, C.F.; Pham, T.H.; Stewart, P.; Keough, D.; Thomas, R. The use of XLSTAT in conducting principal component analysis (PCA) when evaluating the relationships between sensory and quality attributes in grilled foods. Methodsx 2020, 7, 100835. [Google Scholar] [CrossRef]
- Morandat, F.; Hill, B.; Osvald, L.; Vitek, J. Evaluating the design of the R language: Objects and functions for data analysis. In Proceedings of the 26th European conference on Object-Oriented Programming, Beijing, China, 11–16 June 2012; pp. 104–131. [Google Scholar] [CrossRef]
- Bryman, A.; Cramer, D. Quantitative Data Analysis with Minitab: A Guide to Social Scientists; Routledge: London, UK, 1996; ISBN 0-415-12323-2. [Google Scholar] [CrossRef]
- Ballabio, D. A MATLAB toolbox for principal component analysis and unsupervised exploration of data structure. Chemom. Intell. Lab. Syst. 2015, 149, 1–9. [Google Scholar] [CrossRef]
- Hary, G. Parametric & Nonparametric Data Analysis for Social Research: IBM SPSS; LAP Academic Publishing: Sunnyvale, CA, USA, 2019; ISBN 978-6200118721. [Google Scholar]
- Guo, N.; Wu, Q.; Shi, C.; Shu, R. Geographical discrimination of Cyclocarya paliurus tea for origin traceability based on multielement analysis by ICP-OES and chemometrics multivariate. Chin. Herb. Med. 2023, 15, 63–68. [Google Scholar] [CrossRef]
- Hall, M.; Frank, E.; Holmes, G.; Pfahringer, B.; Reutemann, P.; Witten, I.H. The WEKA data mining software: An update. SIGKDD Explor. Newsl. 2009, 11, 10–18. [Google Scholar] [CrossRef]
- Wu, Z.; Li, D.; Meng, J.; Wang, H. Introduction to SIMCA-P and its application. In Handbook of Partial Least Squares; Vinzi, V.E., Chin, W., Henseler, J., Wang, H., Eds.; Springer Handbooks of Computational Statistics; Springer: Berlin/Heidelberg, Germany, 2010. [Google Scholar] [CrossRef]
- Geana, I.; Iordache, A.; Ionete, R.; Marinescu, A.; Ranca, A.; Culea, M. Geographical origin identification of Romanian wines by ICP-MS elemental analysis. Food Chem. 2013, 138, 1125–1134. [Google Scholar] [CrossRef] [PubMed]
- Šelih, V.S.; Šala, M.; Drgan, V. Multi-element analysis of wines by ICP-MS and ICP-OES and their classification according to geographical origin in Slovenia. Food Chem. 2014, 153, 414–423. [Google Scholar] [CrossRef]
- Monahan, F.J.; Schmidt, O.; Moloney, A.P. Meat provenance: Authentication of geographical origin and dietary background of meat. Meat Sci. 2018, 144, 2–14. [Google Scholar] [CrossRef] [PubMed]
- Barbosa, I.D.S.; Brito, G.B.; dos Santos, G.L.; Santos, L.N.; Teixeira, L.S.; Araujo, R.G.; Korn, M.G.A. Multivariate data analysis of trace elements in bivalve molluscs: Characterization and food safety evaluation. Food Chem. 2019, 273, 64–70. [Google Scholar] [CrossRef]
- Liu, X.; Xue, C.; Wang, Y.; Li, Z.; Xue, Y.; Xu, J. The classification of sea cucumber (Apostichopus japonicus) according to region of origin using multi-element analysis and pattern recognition techniques. Food Control 2011, 23, 522–527. [Google Scholar] [CrossRef]
- Papapetros, S.; Louppis, A.; Kosma, I.; Kontakos, S.; Badeka, A.; Kontominas, M.G. Characterization and differentiation of botanical and geographical origin of selected popular sweet cherry cultivars grown in Greece. J. Food Compos. Anal. 2018, 72, 48–56. [Google Scholar] [CrossRef]
- Papapetros, S.; Louppis, A.; Kosma, I.; Kontakos, S.; Badeka, A.; Papastephanou, C.; Kontominas, M.G. Physicochemical, spectroscopic and chromatographic analyses in combination with chemometrics for the discrimination of four sweet cherry cultivars grown in Northern Greece. Foods 2019, 8, 442. [Google Scholar] [CrossRef]
- Debbarma, N.; Manivannan, S.; Muddarsu, V.R.; Umadevi, P.; Upadhyay, S. Ionome signatures discriminates the geographical origin of jackfruits (Artocarpus heterophyllus Lam.). Food Chem. 2020, 339, 127896. [Google Scholar] [CrossRef]
- Nadia, D. Identification of the Geographical Origin of Jackfruit (Artocarpus heterophyllus Lam.) through Multielemental Fingerprinting Using ICP. PhD Thesisof School of Life Sciences, Sikkim University, Gangtok, India, 2018. [Google Scholar]
- Gaiad, J.E.; Hidalgo, M.J.; Villafañe, R.N.; Marchevsky, E.J.; Pellerano, R.G. Tracing the geographical origin of Argentinean lemon juices based on trace element profiles using advanced chemometric techniques. Microchem. J. 2016, 129, 243–248. [Google Scholar] [CrossRef]
- Potortì, A.G.; Di Bella, G.; Mottese, A.F.; Bua, G.D.; Fede, M.R.; Sabatino, G.; Salvo, A.; Somma, R.; Dugo, G.; Turco, V.L. Traceability of Protected Geographical Indication (PGI) Interdonato lemon pulps by chemometric analysis of the mineral composition. J. Food Compos. Anal. 2018, 69, 122–128. [Google Scholar] [CrossRef]
- Coelho, I.; Matos, A.S.; Teixeira, R.; Nascimento, A.; Bordado, J.; Donard, O.; Castanheira, I. Combining multielement analysis and chemometrics to trace the geographical origin of Rocha pear. J. Food Compos. Anal. 2019, 77, 1–8. [Google Scholar] [CrossRef]
- Louppis, A.P.; Constantinou, M.S.; Kontominas, M.G.; Blando, F.; Stamatakos, G. Geographical and botanical differentiation of Mediterranean prickly pear using specific chemical markers. J. Food Compos. Anal. 2023, 119, 105219. [Google Scholar] [CrossRef]
- Amorello, D.; Orecchio, S.; Pace, A.; Barreca, S. Discrimination of almonds (Prunus dulcis) geographical origin by minerals and fatty acids profiling. Nat. Prod. Res. 2015, 30, 2107–2110. [Google Scholar] [CrossRef]
- Wang, F.; Zhao, H.; Yu, C.; Tang, J.; Wu, W.; Yang, Q. Determination of the geographical origin of maize (Zea mays L.) using mineral element fingerprints. J. Sci. Food Agric. 2019, 100, 1294–1300. [Google Scholar] [CrossRef]
- Bagas, C.K.; Scadding, R.L.; Scadding, C.J.; Watling, R.J.; Roberts, W.; Ovenden, S.P. Trace isotope analysis of Ricinus communis seed core for provenance determination by laser ablation-ICP-MS. Forensic Sci. Int. 2017, 270, 46–54. [Google Scholar] [CrossRef] [PubMed]
- Chen, M.; Fu, L.; Li, D.; Zuo, F.; Qian, L. Mineral element fingerprints verified the geographical origin of years and quantities of rice. J. Food Compos. Anal. 2022, 114, 104803. [Google Scholar] [CrossRef]
- Li, G.; Nunes, L.; Wang, Y.; Williams, P.N.; Zheng, M.; Zhang, Q.; Zhu, Y. Profiling the ionome of rice and its use in discriminating geographical origins at the regional scale, China. J. Environ. Sci. 2013, 25, 144–154. [Google Scholar] [CrossRef]
- Maione, C.; Batista, B.L.; Campiglia, A.D.; Jr, F.B.; Barbosa, R.M. Classification of geographic origin of rice by data mining and inductively coupled plasma mass spectrometry. Comput. Electron. Agric. 2016, 121, 101–107. [Google Scholar] [CrossRef]
- Cheajesadagul, P.; Arnaudguilhem, C.; Shiowatana, J.; Siripinyanond, A.; Szpunar, J. Discrimination of geographical origin of rice based on multi-element fingerprinting by high resolution inductively coupled plasma mass spectrometry. Food Chem. 2013, 141, 3504–3509. [Google Scholar] [CrossRef]
- Liu, Z.; Zhang, W.; Zhang, Y.; Chen, T.; Shao, S.; Zhou, L.; Yuan, Y.; Xie, T.; Rogers, K.M. Assuring food safety and traceability of polished rice from different production regions in China and Southeast Asia using chemometric models. Food Control 2019, 99, 1–10. [Google Scholar] [CrossRef]
- Barnet, L.S.; Yamashita, G.H.; Anzanello, M.J.; Pozebon, D. Determination of the most informative chemical elements for discrimination of rice samples according to the producing region. Food Chem. 2023, 402, 134208. [Google Scholar] [CrossRef]
- Xia, M.-C.; Du, Y.; Zhang, S.; Feng, J.; Luo, K. Differences in multielement concentrations in rice (Oryza sativa L.) between longevity and non-longevity areas in China and their relations with lifespan indicators. Food Res. Int. 2022, 162, 112056. [Google Scholar] [CrossRef] [PubMed]
- Chung, I.-M.; Kim, J.-K.; Lee, K.-J.; Park, S.-K.; Lee, J.-H.; Son, N.-Y.; Jin, Y.-I.; Kim, S.-H. Geographic authentication of Asian rice (Oryza sativa L.) using multi-elemental and stable isotopic data combined with multivariate analysis. Food Chem. 2018, 240, 840–849. [Google Scholar] [CrossRef] [PubMed]
- Wang, Y.; Yuan, X.; Liu, L.; Ma, J.; Fan, S.; Zhang, Y.; Li, Q. Multielement principal component analysis and origin traceability of rice based on ICP-MS/MS. J. Food Qual. 2021, 2021, 5536241. [Google Scholar] [CrossRef]
- Arif, M.; Chilvers, G.; Day, S.; Naveed, S.; Woolfe, M.; Rodionova, O.; Pomerantsev, A.; Kracht, O.; Brodie, C.; Mihailova, A.; et al. Differentiating Pakistani long-grain rice grown inside and outside the accepted Basmati Himalayan geographical region using a ‘one-class’ multi-element chemometric model. Food Control 2020, 123, 107827. [Google Scholar] [CrossRef]
- Qian, L.; Zhang, C.; Zuo, F.; Zheng, L.; Li, D.; Zhang, A.; Zhang, D. Effects of fertilizers and pesticides on the mineral elements used for the geographical origin traceability of rice. J. Food Compos. Anal. 2019, 83, 103276. [Google Scholar] [CrossRef]
- Hika, W.A.; Atlabachew, M.; Amare, M. Geographical origin discrimination of Ethiopian sesame seeds by elemental analysis and chemometric tools. Food Chem. X 2023, 17, 100545. [Google Scholar] [CrossRef]
- Choi, Y.H.; Hong, C.K.; Kim, M.; Jung, S.O.; Park, J.; Oh, Y.H.; Kwon, J.-H. Multivariate analysis to discriminate the origin of sesame seeds by multi-element analysis inductively coupled plasma-mass spectrometry. Food Sci. Biotechnol. 2017, 26, 375–379. [Google Scholar] [CrossRef]
- Lu, B.X.; Ma, N.; Wang, X.; Zhang, D.J. Tracing the geographical origin of soybeans based on inductively coupled plasma mass spectrometry (ICP-MS) analysis of mineral elements. Food. Sci. 2019, 39, 288–294. [Google Scholar] [CrossRef]
- Nguyen-Quang, T.; Bui-Quang, M.; Truong-Ngoc, M. Rapid identification of geographical origin of commercial soybean marketed in Vietnam by ICP-MS. J. Anal. Methods Chem. 2021, 2021, 5583860. [Google Scholar] [CrossRef]
- Zhao, H.; Guo, B.; Wei, Y.; Zhang, B. Multi-element composition of wheat grain and provenance soil and their potentialities as fingerprints of geographical origin. J. Cereal Sci. 2013, 57, 391–397. [Google Scholar] [CrossRef]
- Liu, H.; Wei, Y.; Zhang, Y.; Wei, S.; Zhang, S.; Guo, B. The effectiveness of multi-element fingerprints for identifying the geographical origin of wheat. Int. J. Food Sci. Technol. 2017, 52, 1018–1025. [Google Scholar] [CrossRef]
- Opatić, A.M.; Nečemer, M.; Budič, B.; Lojen, S. Stable isotope analysis of major bioelements, multi-element profiling, and discriminant analysis for geographical origins of organically grown potato. J. Food Compos. Anal. 2018, 71, 17–24. [Google Scholar] [CrossRef]
- Di Giacomo, F.; Del Signore, A.; Giaccio, M. Determining the geographic origin of potatoes using mineral and trace element content. J. Agric. Food Chem. 2007, 55, 860–866. [Google Scholar] [CrossRef]
- Richter, B.; Gurk, S.; Wagner, D.; Bockmayr, M.; Fischer, M. Food authentication: Multi-elemental analysis of white asparagus for provenance discrimination. Food Chem. 2019, 286, 475–482. [Google Scholar] [CrossRef]
- Kwon, Y.-K.; Bong, Y.-S.; Lee, K.-S.; Hwang, G.-S. An integrated analysis for determining the geographical origin of medicinal herbs using ICP-AES/ICP-MS and 1H NMR analysis. Food Chem. 2014, 161, 168–175. [Google Scholar] [CrossRef] [PubMed]
- Yeon-Sik, B.; Byeong-Yeol, S.; Mukesh, K.G.; Chang-Soon, J.; Hyun, J.A.; Kwang-Sik, L. Discrimination of the geographic origin of cabbages. Food. Control. 2013, 30, 626–630. Available online: https://www.academia.edu/5870450/Discrimination_of_the_geographic_origin_of_cabbages (accessed on 1 March 2023).
- Bong, Y.-S.; Shin, W.-J.; Gautam, M.K.; Jeong, Y.-J.; Lee, A.-R.; Jang, C.-S.; Lim, Y.-P.; Chung, G.-S.; Lee, K.-S. Determining the geographical origin of Chinese cabbages using multielement composition and strontium isotope ratio analyses. Food Chem. 2012, 135, 2666–2674. [Google Scholar] [CrossRef]
- Chen, L.-P.; Zhu, H.-Y.; Li, Y.-F.; Zhang, Y.; Zhang, W.; Yang, L.-C.; Yin, H.; Dong, C.-Y.; Wang, Y. Combining multielement analysis and chemometrics to trace the geographical origin of Thelephora ganbajun. J. Food Compos. Anal. 2020, 96, 103699. [Google Scholar] [CrossRef]
- Segelke, T.; von Wuthenau, K.; Neitzke, G.; Müller, M.-S.; Fischer, M. Food authentication: Species and origin determination of truffles (Tuber spp.) by inductively coupled plasma mass spectrometry and chemometrics. J. Agric. Food Chem. 2020, 68, 14374–14385. [Google Scholar] [CrossRef] [PubMed]
- Nguyen-Quang, T.; Do-Hoang, G.; Truong-Ngoc, M. Multielement analysis of pakchoi (Brassica rapa L. ssp. chinensis) by ICP-MS and their classification according to different small geographical origins. J. Anal. Methods Chem. 2021, 2021, 8860852. [Google Scholar] [CrossRef] [PubMed]
- Johnson, J.L.; Adkins, D.; Chauvin, S. A review of the quality indicators of rigor in qualitative research. Am. J. Pharm. Educ. 2019, 84, 7120. [Google Scholar] [CrossRef] [PubMed]
- Islam, S.; Cullen, J.M. Food traceability: A generic theoretical framework. Food Control 2021, 123, 107848. [Google Scholar] [CrossRef]
- Wadood, S.A.; Nie, J.; Li, C.; Rogers, K.M.; Khan, A.; Khan, W.A.; Qamar, A.; Zhang, Y.; Yuwei, Y. Rice authentication: An overview of different analytical techniques combined with multivariate analysis. J. Food Compos. Anal. 2022, 112, 104677. [Google Scholar] [CrossRef]
- Kelly, S.; Heaton, K.; Hoogewerff, J. Tracing the geographical origin of food: The application of multi-element and multi-isotope analysis. Trends Food Sci. Technol. 2005, 16, 555–567. [Google Scholar] [CrossRef]
- Potortì, A.G.; Mottese, A.F.; Fede, M.R.; Sabatino, G.; Dugo, G.; Turco, V.L.; Costa, R.; Caridi, F.; Di Bella, M.; Di Bella, G. Multielement and chemometric analysis for the traceability of the Pachino Protected Geographical Indication (PGI) cherry tomatoes. Food Chem. 2022, 386, 132746. [Google Scholar] [CrossRef]


| massElement | 7Li | 9Be | 23Na | 24Mg | 27Al | 28Si | 39K | 40Ca | 45Sc |
| Abundance (%) | 92.4 | 100 | 100 | 78.99 | 100 | 92.23 | 93.26 | 96.94 | 100 |
| massElement | 48Ti | 51V | 52Cr | 55Mn | 56Fe | 58Ni | 59Co | 63Cu | 64Zn |
| Abundance (%) | 73.72 | 99.75 | 83.79 | 100 | 91.75 | 68.08 | 100 | 69.17 | 48.63 |
| massElement | 75As | 80Se | 88Sr | 95Mo | 105Pd | 107Ag | 111Cd | 118Sn | 121Sb |
| Abundance (%) | 100 | 49.61 | 82.58 | 15.92 | 22.33 | 51.84 | 12.80 | 24.22 | 57.21 |
| massElement | 138Ba | 182W | 185Re | 195Pt | 201Hg | 205Tl | 208Pb | 209Bi | 232Th |
| Abundance (%) | 71.70 | 26.50 | 37.40 | 33.83 | 13.18 | 70.48 | 52.4 | 100 | 100 |
| Software | Description | Feature | Ref |
|---|---|---|---|
| XLSTAT Version 2023 5.1.1407.0 United States | A popular data analysis add-on for Microsoft Excel, known for its flexibility and powerful statistical tools. It offers a wide range of features and functions, including PCA, which can be used for geographical origin determination. With XLSTAT, users can easily analyze, customize, and share their results within the familiar Microsoft Excel interface. | User-friendly interface that makes it easy for non-experts to use. Some of its features include descriptive statistics, hypothesis testing, ANOVA, regression analysis, time series analysis, data visualization, and machine learning. It also offers advanced statistical tools such as principal component analysis (PCA), partial least squares regression (PLS), and discriminant analysis. XLSTAT offers a wide range of customizable and interactive charts, including scatter plots, line charts, bar charts, histograms, box plots, and more. The charts are designed to be easy to interpret and can be modified to fit specific needs. | [82] |
| R 4.3.0 France | A free, open-source programming language for statistical computing and graphics which was developed at Bell Laboratories. It is widely used by researchers and analysts in various fields such as economics, finance, biology, and social sciences. R provides a wide range of statistical and graphical techniques, including linear and nonlinear modeling, statistical tests, time-series analysis, and data visualization. Additionally, R has a large and active community of users who contribute to the development of packages and resources that extend the functionality of the language. Due to its flexibility, power, and cost-effectiveness, R has become a popular choice for data analysis and research. | PCA uses functions such as princomp and prcomp. While princomp uses covariance matrix decomposition, prcomp uses singular value decomposition, which often provides better numerical accuracy. Moreover, R offers a vast array of packages that can be used to implement PCA, such as ade4, vegan, ExPosition, dimRed, and FactoMineR, among others. These packages provide additional functionalities beyond the basic PCA function, such as biplots, scree plots, and visualization of the results, which are useful for interpreting and communicating the analysis outcomes. Additionally, R has a user-friendly interface and a large community of users who share their scripts and offer support for beginners. | [83] |
| Minitab 21.1.0 United States | A statistical software package developed for quality improvement and statistical analysis. It provides a wide range of tools for data analysis, including graphical tools, statistical tests, and regression analysis. Minitab also supports statistical process control, the design of experiments, and Six Sigma methodologies. With its user-friendly interface and extensive documentation, Minitab is a popular choice for quality professionals and data analysts. | A wide range of features, including statistical analysis, data visualization, and predictive analytics. It offers a user-friendly interface with easy-to-use tools for data analysis and quality improvement. Minitab also has built-in templates for various industries, including manufacturing, healthcare, and finance. Some of its popular features include descriptive statistics, hypothesis testing, regression analysis, and design of experiments. Additionally, Minitab can be used to create interactive graphs and charts to help visualize and present data in a clear and concise manner. Minitab has some limitations, such as:
| [84] |
| Matlab R2022a United States | A high-performance language for technical computing and data analysis. It is widely used in academia, industry, and research for developing algorithms, analyzing and visualizing data, and building models. Matlab is one of MathWorks products. | Matlab has several functions and tools for performing PCA, such as princomp and PCA. These functions can perform PCA on matrices, including missing data and scaled variables. Matlab also allows for the customization of PCA outputs and visualization of the results. Other features of Matlab for PCA analysis include:
| [85] |
| SPSS Statistics Version 26 United States | SPSS (Statistical Package for the Social Sciences) is, a IBM product, widely used statistical software in various fields, such as psychology, marketing, healthcare, and education. It has a broad range of statistical analysis options, making it a versatile tool for data analysis. Additionally, SPSS allows for data cleaning, data transformation, and data management, which are essential steps in the data analysis process. With SPSS, users can conduct various multivariate techniques, including principal component analysis, factor analysis, cluster analysis, and discriminant analysis, among others. The software is regularly updated to incorporate the latest statistical techniques and methods, making it a reliable and up-to-date tool for data analysis. | SPSS offers a variety of features for data analysis, including statistical analysis, data mining, and predictive analytics. Some of its key features related to PCA include the ability to perform principal component analysis to identify underlying structure in the data and reduce its dimensionality, the option to perform factor analysis to identify latent variables underlying observed variables, and the ability to generate graphical output to visualize the results. SPSS also offers a user-friendly interface, making it accessible to non-technical users, as well as a range of advanced statistical techniques for more experienced users. Additionally, SPSS allows users to automate analysis and reporting, making it a time-efficient option for large datasets. | [86,87] |
| Weka 3.8.3 New Zealand | A collection of machine learning algorithms for data mining tasks was developed at University of Waikato. It is open-source software written in Java. Weka includes tools for data pre-processing, classification, regression, clustering, association rules, and visualization. It provides a graphical user interface for exploring data and running machine learning algorithms, as well as a command-line interface for batch processing and integration with other software systems. Weka is widely used in both academia and industry for research, education, and practical applications in areas such as bioinformatics, text mining, image analysis, and more. | Weka has a built-in PCA algorithm that can perform principal component analysis on data sets. It allows users to select the number of principal components to be extracted and provides options for normalization and centering of the data. Weka also provides visualizations of the data, including scatter plots and parallel coordinate plots, to aid in understanding the results of the PCA analysis. Additionally, Weka’s PCA algorithm can be used in combination with other machine learning algorithms available in the software for tasks such as classification and clustering. Weka provides several visualization tools for exploring and interpreting the results of PCA, including scatter plots, biplots, and correlation matrices. These charts can help users to better understand the relationships between variables and identify patterns in the data. Additionally, Weka supports the export of charts and graphs to various formats, such as PNG and PDF, for easy sharing and presentation of results. | [88] |
| SIMCA 17.0 Germany | SIMCA (Soft Independent Modeling of Class Analogy) is a multivariate data analysis software developed by Umetrics AB that is widely used for classification and predictive modeling in various industries. It uses PCA to reduce the dimensionality of data and identify relevant variables for modeling. SIMCA is particularly popular in the pharmaceutical, chemical, and food industries for quality control and process optimization purposes. | SIMCA is a powerful tool for multivariate data analysis, including PCA. It offers a user-friendly interface and intuitive data visualization tools, such as scatter plots and score plots, to help users understand their data. Additionally, SIMCA has a range of advanced features for outlier detection and model validation. These capabilities make it a valuable tool for analyzing large datasets and identifying patterns in complex data structures. | [89] |
| Plant | Region (Country) | No. Sample/Region | No. Element | Ref. |
|---|---|---|---|---|
| Fruit type: | ||||
| Cherry | Regina, Kordia, Mpakirtzeika, Skeena (Greece) | 78/4 | 25 | [95] |
| Ferrovia, Canada Giant, Lapins, Germersdorfer (Edessa and neighbouring Kozani region, Greece) | 56/4 | 25 | [96] | |
| Jackfruits | North 24 Parganas, Nadia, West Tripura, Khowai, Panruti, Varkala, South Sikkim (India) | 70/7 | 24 | [97] |
| Nadia, North 24 Parganas and South Sikkim (India) | 70/3 | 24 | [98] | |
| Lemon | Tucumán, Jujuy, Corrientes (Argentina) | 74/3 | 25 | [99] |
| Sicily (Italy), Çukurova (Turkey) | 40/2 | 32 | [100] | |
| Pear | 10 locations in Fundão (Portugal) | 150/10 | 24 | [101] |
| Italy, Spain, Greece, Cyprus | 74/4 | 19 | [102] | |
| Nut type: | ||||
| Almonds | Australia, Italy, Iran, Morocco, Spain, United States of America | 250/6 | 58 | [58] |
| Sicily, Spain and California | 21/3 | 7 | [103] | |
| Maize | Jilin, Gansu, Shandong (China) | 90/3 | 25 | [104] |
| Ricinus communis | Brisbane, Far North Qld, West Qld, South Sydney, West Sydney, Newcastle, North Coast NSW, North Adelaide, South Adelaide, East Adelaide, South Coast Adelaide, North Perth, East Perth, Fremantle, Inner East Melbourne, West Melbourne, East Melbourne, Swan Hill (Australia) | 68/18 | 92 | [105] |
| Rice | Jiansanjiang, Wuchang, Chahayang (Heilongjiang, China) | 237/3 | 33 | [106] |
| Fuzhou, Longyan, Nanping, Ningde, Putian, Quanzhou, Sanming, Xiamen, Zhangzhou (China) | 206/9 | 13 | [107] | |
| Goiás, Rio Grande do Sul (Brazil) | 31/2 | 20 | [108] | |
| Italy, Turkey | 40/2 | 21 | [109] | |
| Suwon (Korea), Shanghai (China), Los Banos (Philippines) | 27/3 | 25 | [42] | |
| Heilongjiang, Jinlin, Zhejiang, Jiangsu, Hunan, Guizhou (China) | 39/6 | 25 | [110] | |
| Campanha, Central, Fronteira Oeste, Planície Costeira Interna, Sul | 640/5 | 26 | [111] | |
| Fengshan, Donglan, Bama, Rugao, Yangdong, Jiaoling, Sanshui, Huaiji, Guangning, Sihui, Songtao, Qianxi, Fuquan, Tongren, Kaili, Guang’an, Nanchong, Mianyang, Chengdu, Luzhou, Changshou, Tieling, Dandong, Suihua, Baicheng, Huinan, Xinxiang, Xinyang (China) | 84/28 | 27 | [112] | |
| Wuchang, Qiqihar, Jiamusi (China) | 194/3 | 16 | [57] | |
| Cambodia, Japan, Korea, Philippines, Thailand | 59/5 | 29 | [113] | |
| Anhui, Guangxi, Guangdong, Jilin, Heilongjiang, Inner Mongolia (China) | 18/6 | 30 | [114] | |
| Gujranwala, Gujrat, Narowal, Wazirabad, Chiniot, Okara, Bahawalpur, Bahawalnagar, Faisalabad, Sahiwal, Jhang, Lodhran (Pakistan) | 64/12 | 35 | [115] | |
| Jansanjiang, Wuchang, Chahayang (China) | 92/3 | 52 | [116] | |
| Sesame | Gondar, Humera, Wollega (Ethiopia) | 93/3 | 12 | [117] |
| Korean, Chỉnese and Indian | 123/3 | 15 | [118] | |
| Soybean | Bei’an, Nenjiang, Heihe, Heilongjiang (China) | 42/4 | 24 | [119] |
| Ha Giang, Hanoi, Dong Nai (Vietnam); Ontario, Manitoba (Canada); Iowa, Illinois (United States); Mato, Grosso (Brazil) | 38/9 | 40 | [120] | |
| Wheat | Hebei, Henan (China) | 61/2 | 22 | [121] |
| Hebei, Henan, and Shanxi provinces (China) | 270/3 | 13 | [122] | |
| Tuber type: | ||||
| Potato (grown) | Alpine, Dinaric, Mediterranean, Pannonian (Slovenia) | 36/4 | 25 | [123] |
| Abruzzo, Lazio, Molise, Puglia, Emilia Romagna, and Veneto (Italia) | 30/6 | 10 | [124] | |
| Vegetable type: | ||||
| Asparagus | Poland, Greece, Spain, Peru, China, Germany, Netherlands | 319/7 | 36 | [125] |
| Shandong, Hebei, Lianing (China) | 22/3 | 15 | [126] | |
| Cabbages | Dandong, Yantai, Zhangjiakou, Qingzhou, Pingdu, Hangzhou, Shanghai (China); Gyeonggi, North Chungcheong, South Chungcheong, Gangwon, North Gyeongsang, South Gyeongsang, South Jeonla (Korea) | 363/14 | 22 | [127] |
| Gangwon, North Gyeongsang, South Gyeongsang, South Jeonla, and South Chungcheong (Korea) and Qingzhou, Pingdu, Yantai, Dandong, and Zhangjiakou (China) | 160/10 | 19 | [128] | |
| Mushroom | Chu Xiong, Da Li, Yu Xi (China) | 40/3 | 13 | [129] |
| Bulgaria, Romania, Croatia, Hungary, Iran, Slovenia, Italy, Spain, Australia, and China | 64/10 | 45 | [130] | |
| Pakchoi | Tien Phong, Thanh Da, Linh Nam, Thanh Xuan, Van Duc, Van Noi (Vietnam) | 60/6 | 42 | [131] |
Disclaimer/Publisher’s Note: The statements, opinions and data contained in all publications are solely those of the individual author(s) and contributor(s) and not of MDPI and/or the editor(s). MDPI and/or the editor(s) disclaim responsibility for any injury to people or property resulting from any ideas, methods, instructions or products referred to in the content. |
© 2023 by the authors. Licensee MDPI, Basel, Switzerland. This article is an open access article distributed under the terms and conditions of the Creative Commons Attribution (CC BY) license (https://creativecommons.org/licenses/by/4.0/).
Share and Cite
Nguyen, Q.T.; Nguyen, T.T.; Le, V.N.; Nguyen, N.T.; Truong, N.M.; Hoang, M.T.; Pham, T.P.T.; Bui, Q.M. Towards a Standardized Approach for the Geographical Traceability of Plant Foods Using Inductively Coupled Plasma Mass Spectrometry (ICP-MS) and Principal Component Analysis (PCA). Foods 2023, 12, 1848. https://doi.org/10.3390/foods12091848
Nguyen QT, Nguyen TT, Le VN, Nguyen NT, Truong NM, Hoang MT, Pham TPT, Bui QM. Towards a Standardized Approach for the Geographical Traceability of Plant Foods Using Inductively Coupled Plasma Mass Spectrometry (ICP-MS) and Principal Component Analysis (PCA). Foods. 2023; 12(9):1848. https://doi.org/10.3390/foods12091848
Chicago/Turabian StyleNguyen, Quang Trung, Thanh Thao Nguyen, Van Nhan Le, Ngoc Tung Nguyen, Ngoc Minh Truong, Minh Tao Hoang, Thi Phuong Thao Pham, and Quang Minh Bui. 2023. "Towards a Standardized Approach for the Geographical Traceability of Plant Foods Using Inductively Coupled Plasma Mass Spectrometry (ICP-MS) and Principal Component Analysis (PCA)" Foods 12, no. 9: 1848. https://doi.org/10.3390/foods12091848
APA StyleNguyen, Q. T., Nguyen, T. T., Le, V. N., Nguyen, N. T., Truong, N. M., Hoang, M. T., Pham, T. P. T., & Bui, Q. M. (2023). Towards a Standardized Approach for the Geographical Traceability of Plant Foods Using Inductively Coupled Plasma Mass Spectrometry (ICP-MS) and Principal Component Analysis (PCA). Foods, 12(9), 1848. https://doi.org/10.3390/foods12091848