
Choline and Fish Oil Can Improve Memory of Mice through Increasing Brain DHA Level
 , ,
, ,
Abstract
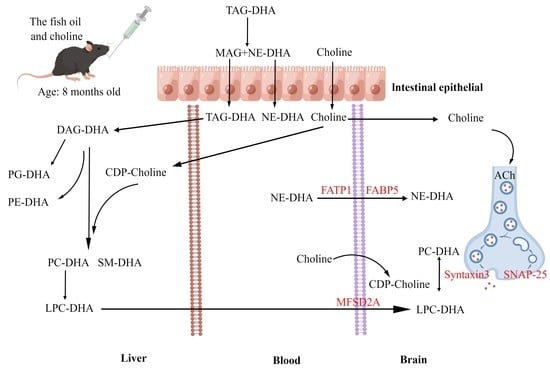
1. Introduction
2. Materials and Methods
2.1. Materials
2.2. Composition of F, C, and FC
2.3. Animals and Experimental Design
2.4. Sample Collections
2.5. Water Maze Test
2.6. Step-through Passive Avoidance Test
2.7. Targeted Lipidomic Analysis
2.8. qRT-PCR Analysis
2.9. Western Blot Analysis
2.10. Determination of ChAT Activity and ACh Content in the Brain
2.11. Immunocytofluorescence and Immunohistochemistry
2.12. Statistical Analysis
3. Results
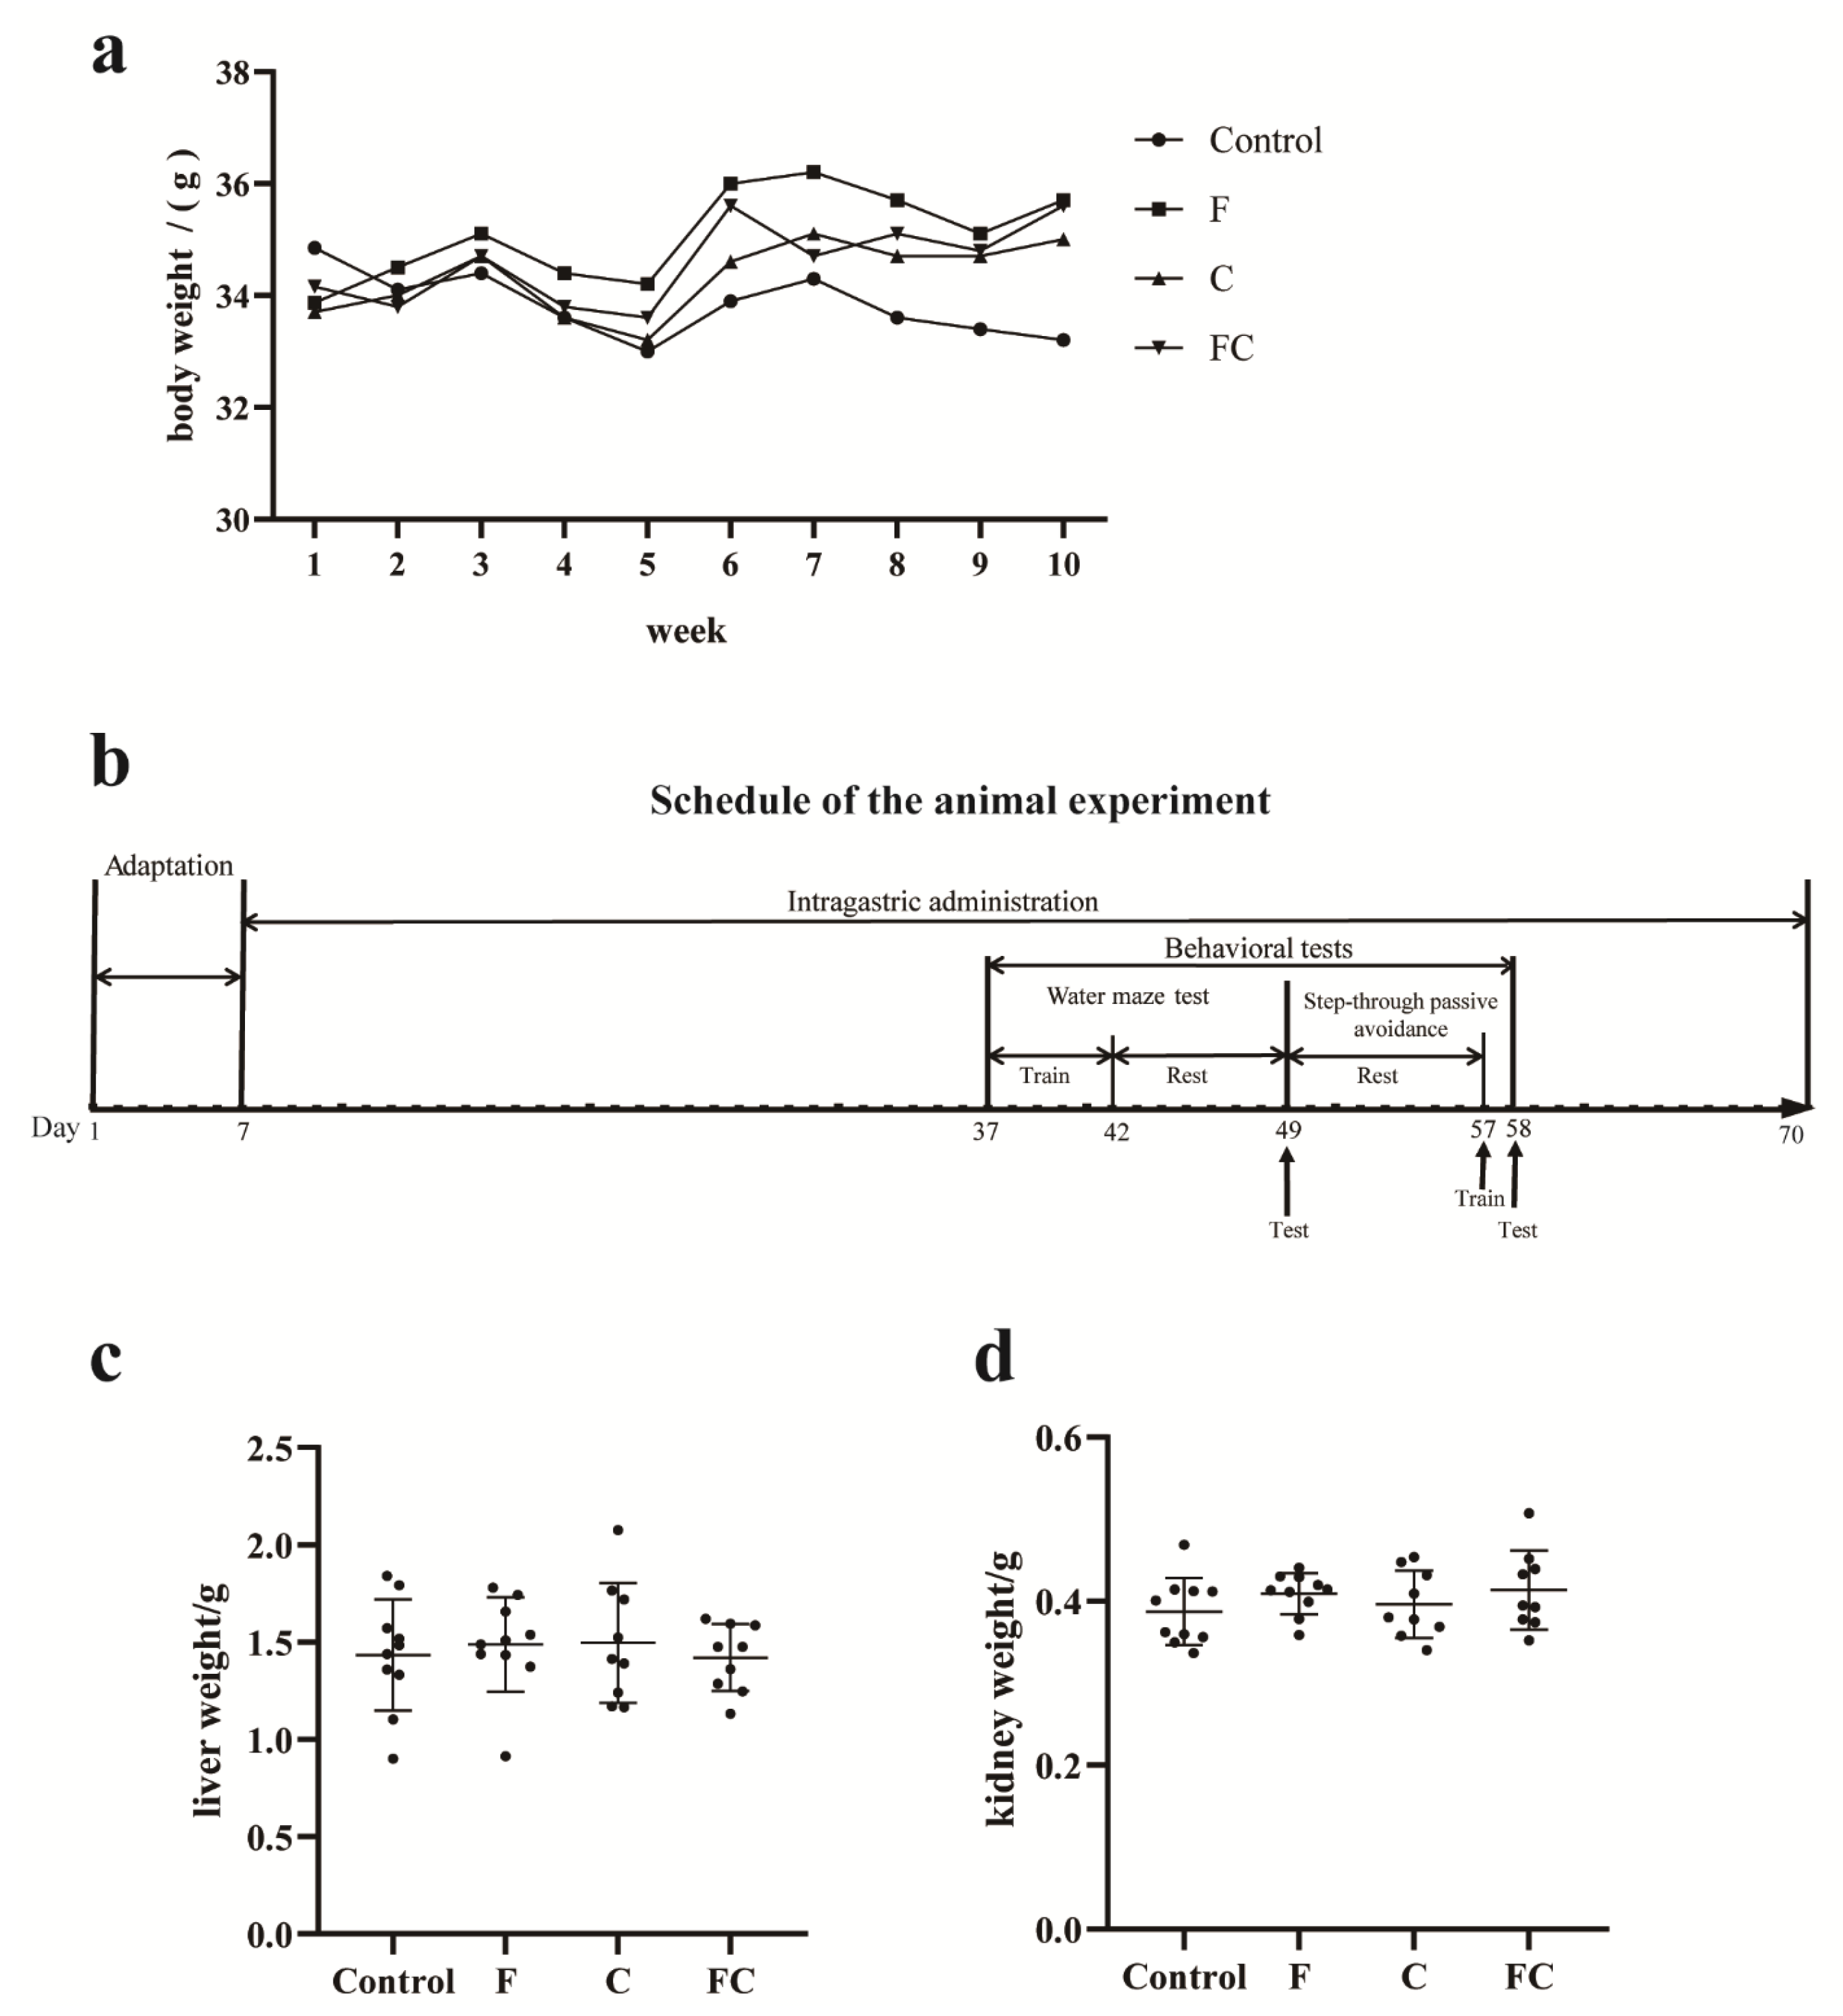
3.1. Effects of F, C, and FC on Mouse Body Weight, Liver, and Kidney Weight
3.2. Effect of F, C, and FC on Improving Memory in Mice
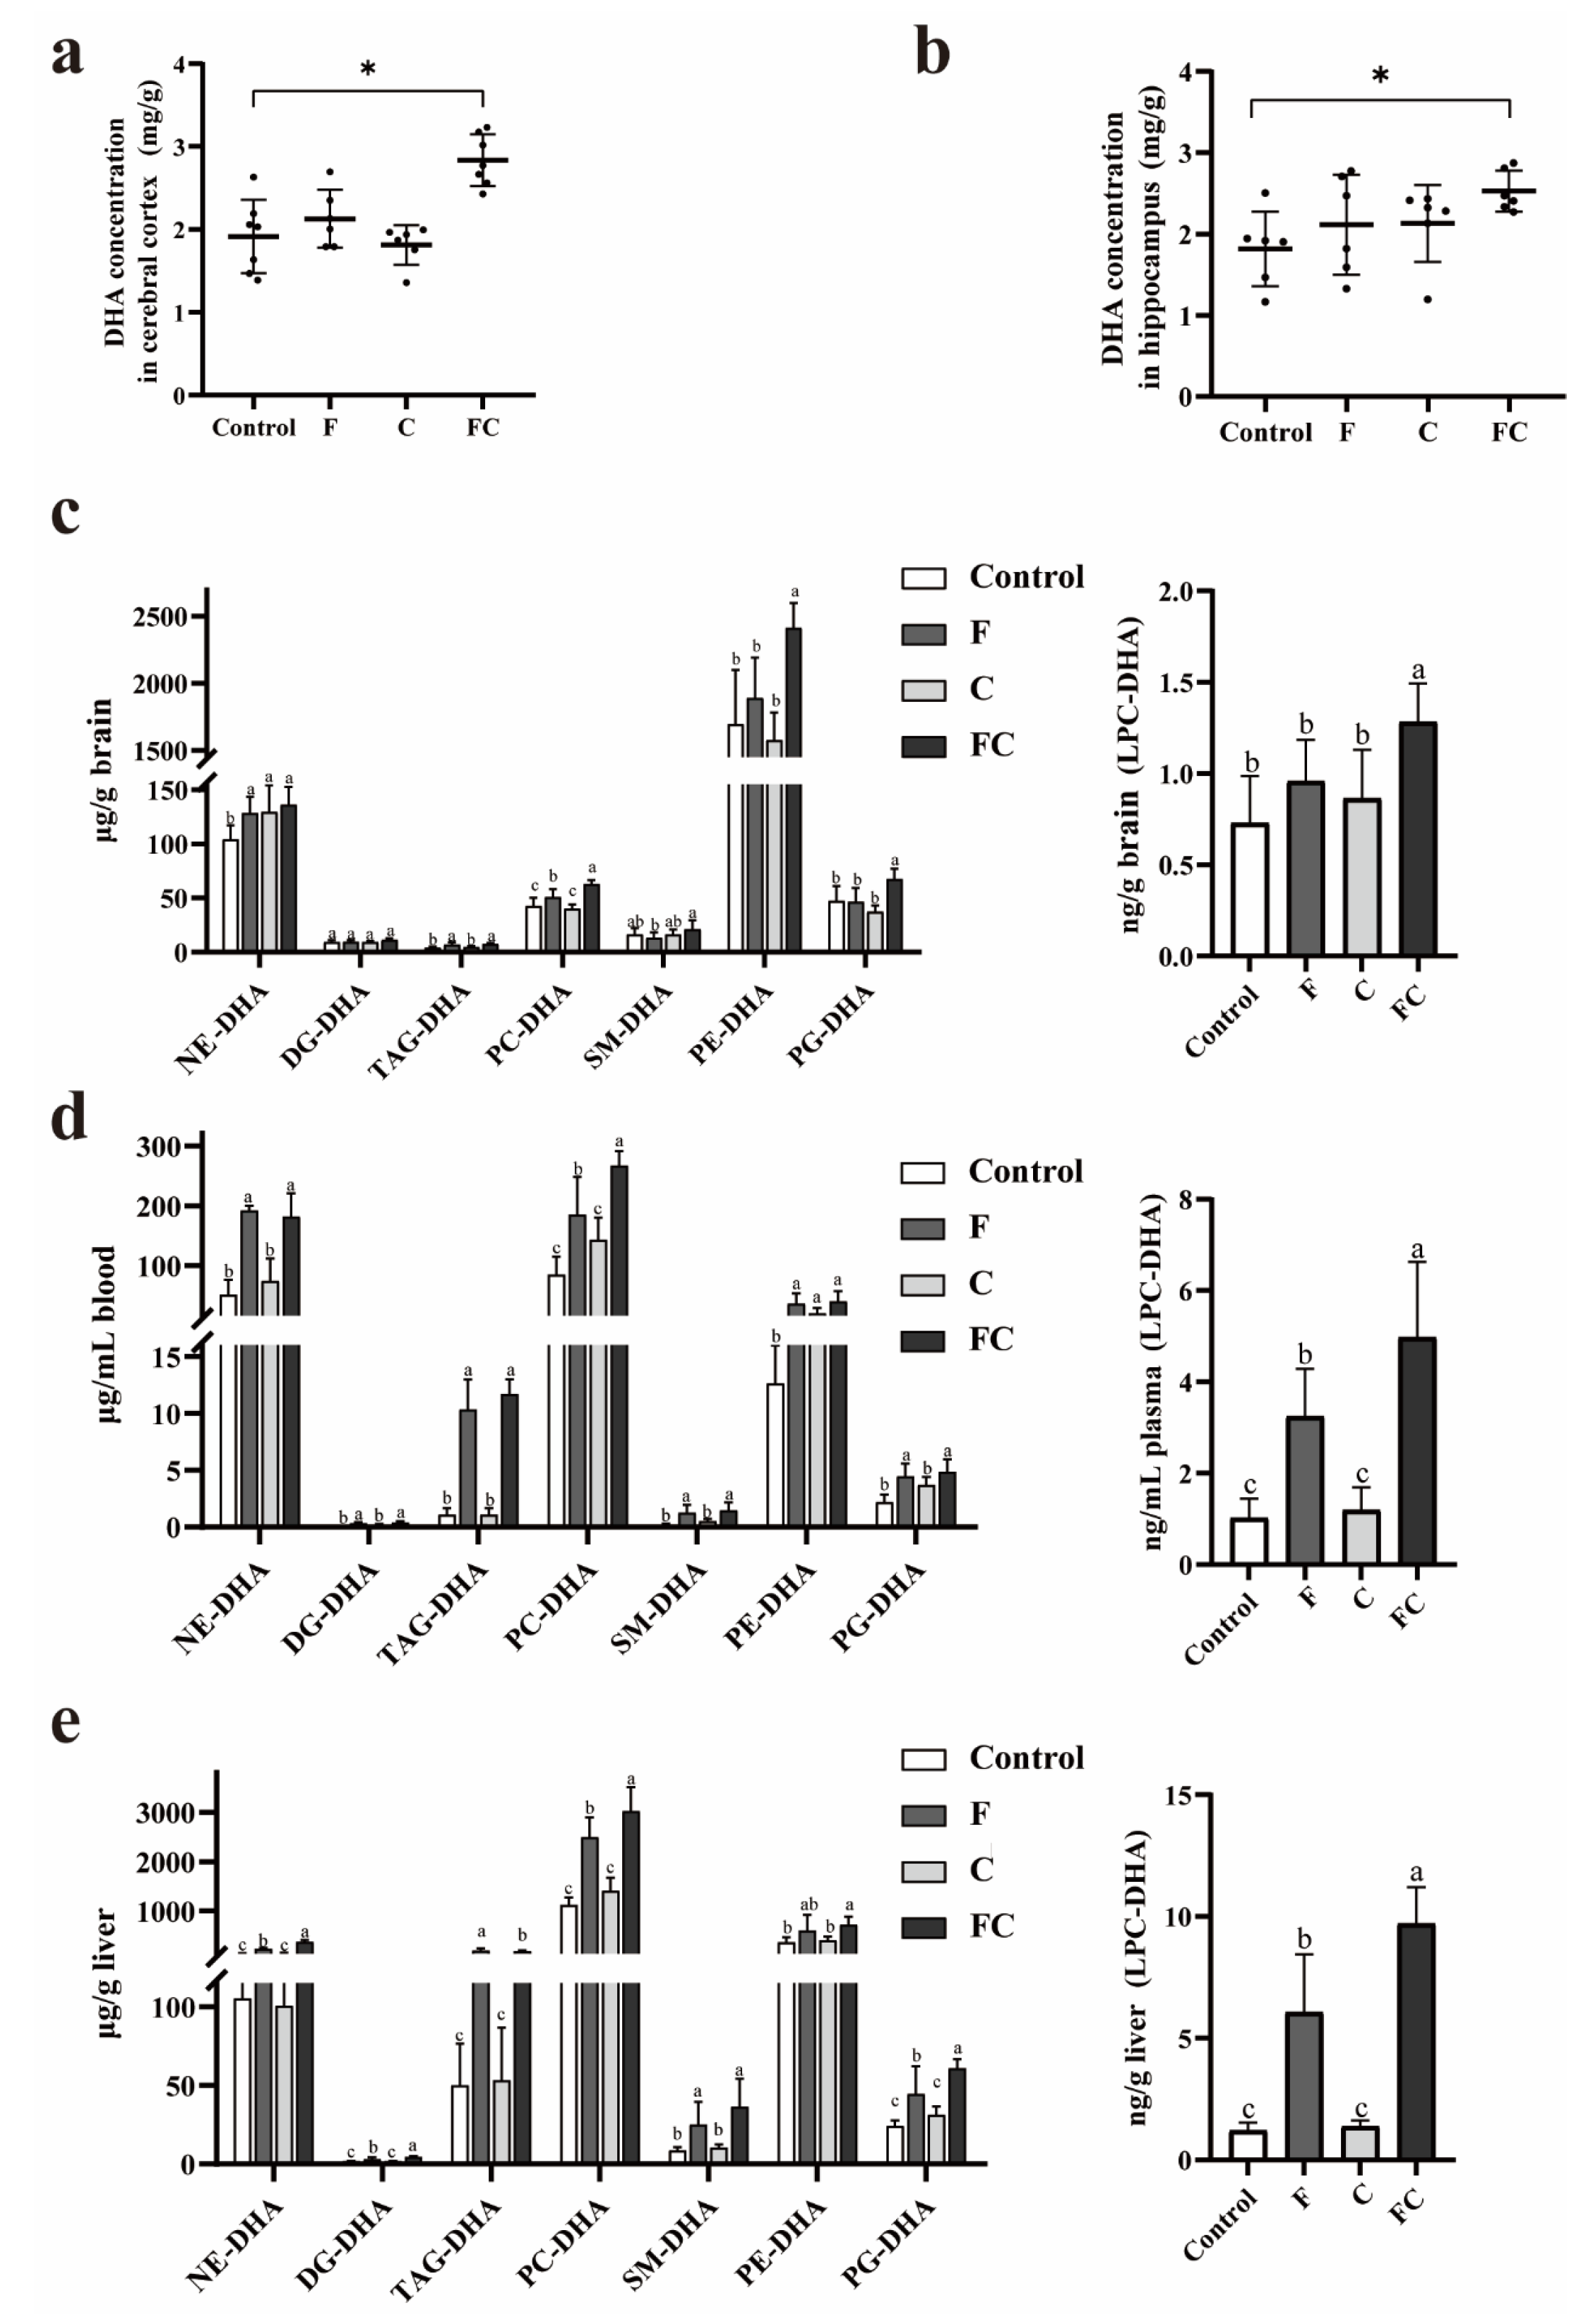
3.3. Effects of F, C, and FC on DHA Content in Mouse Brain
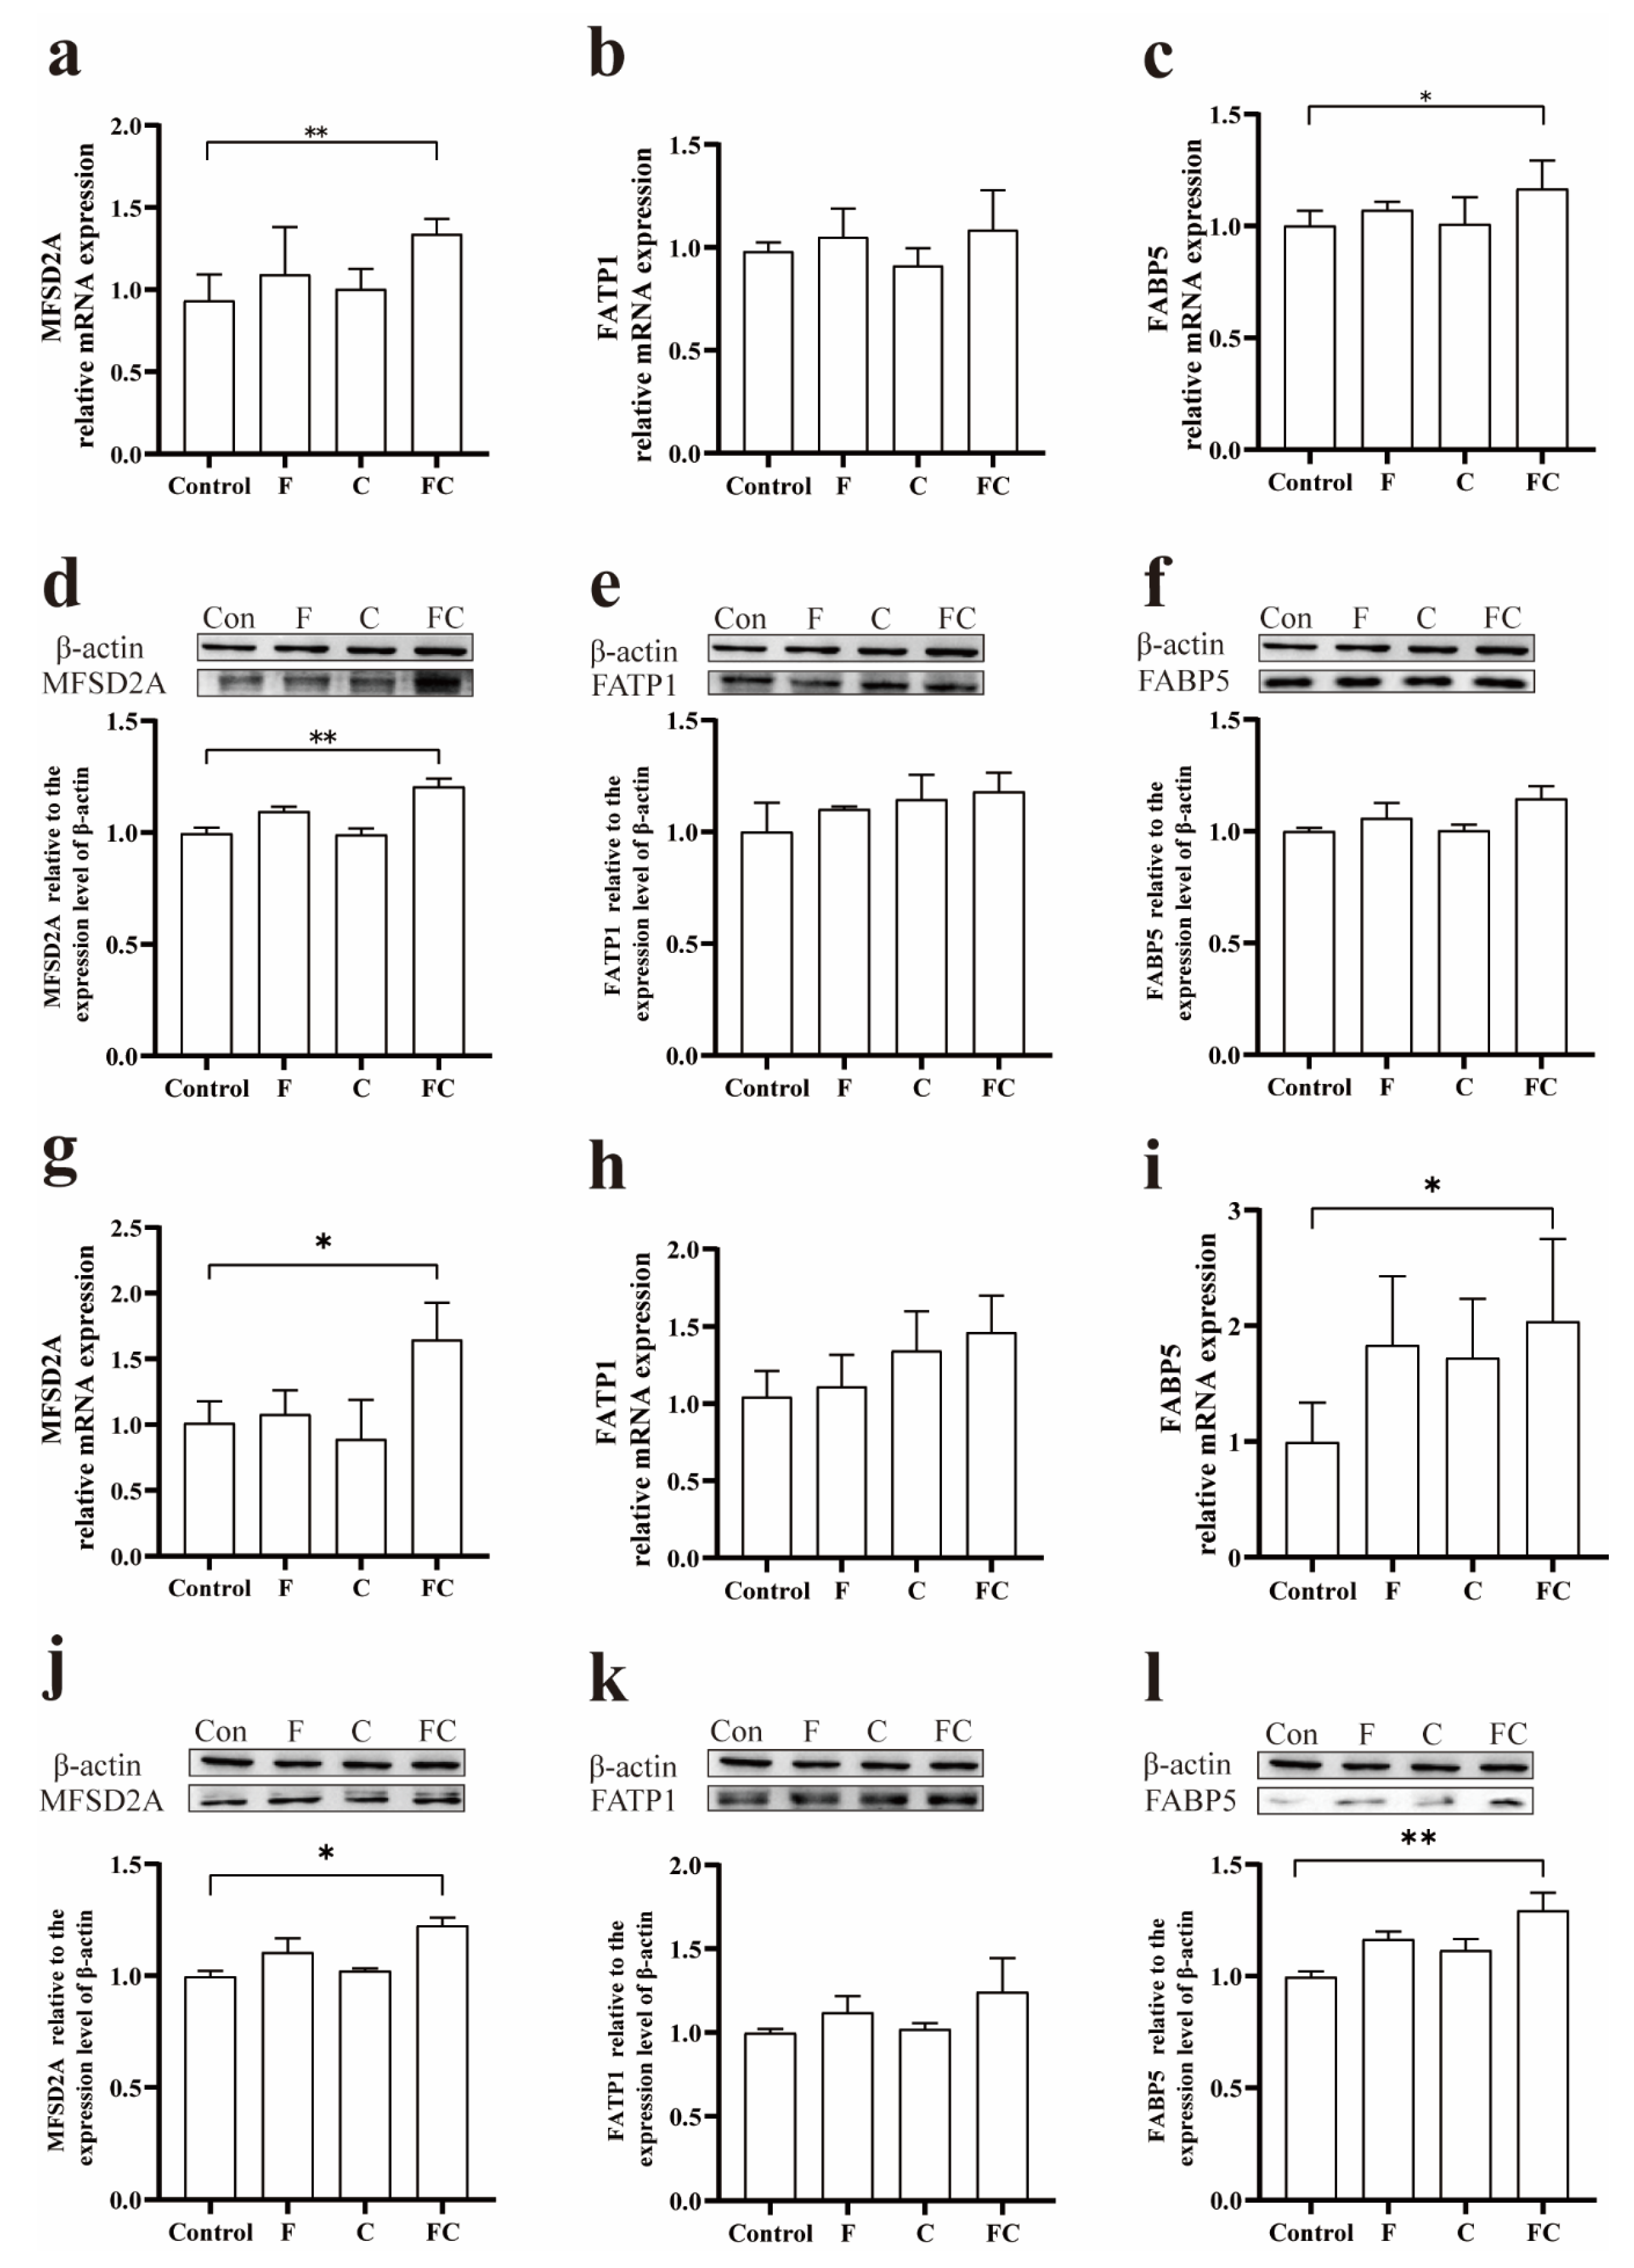
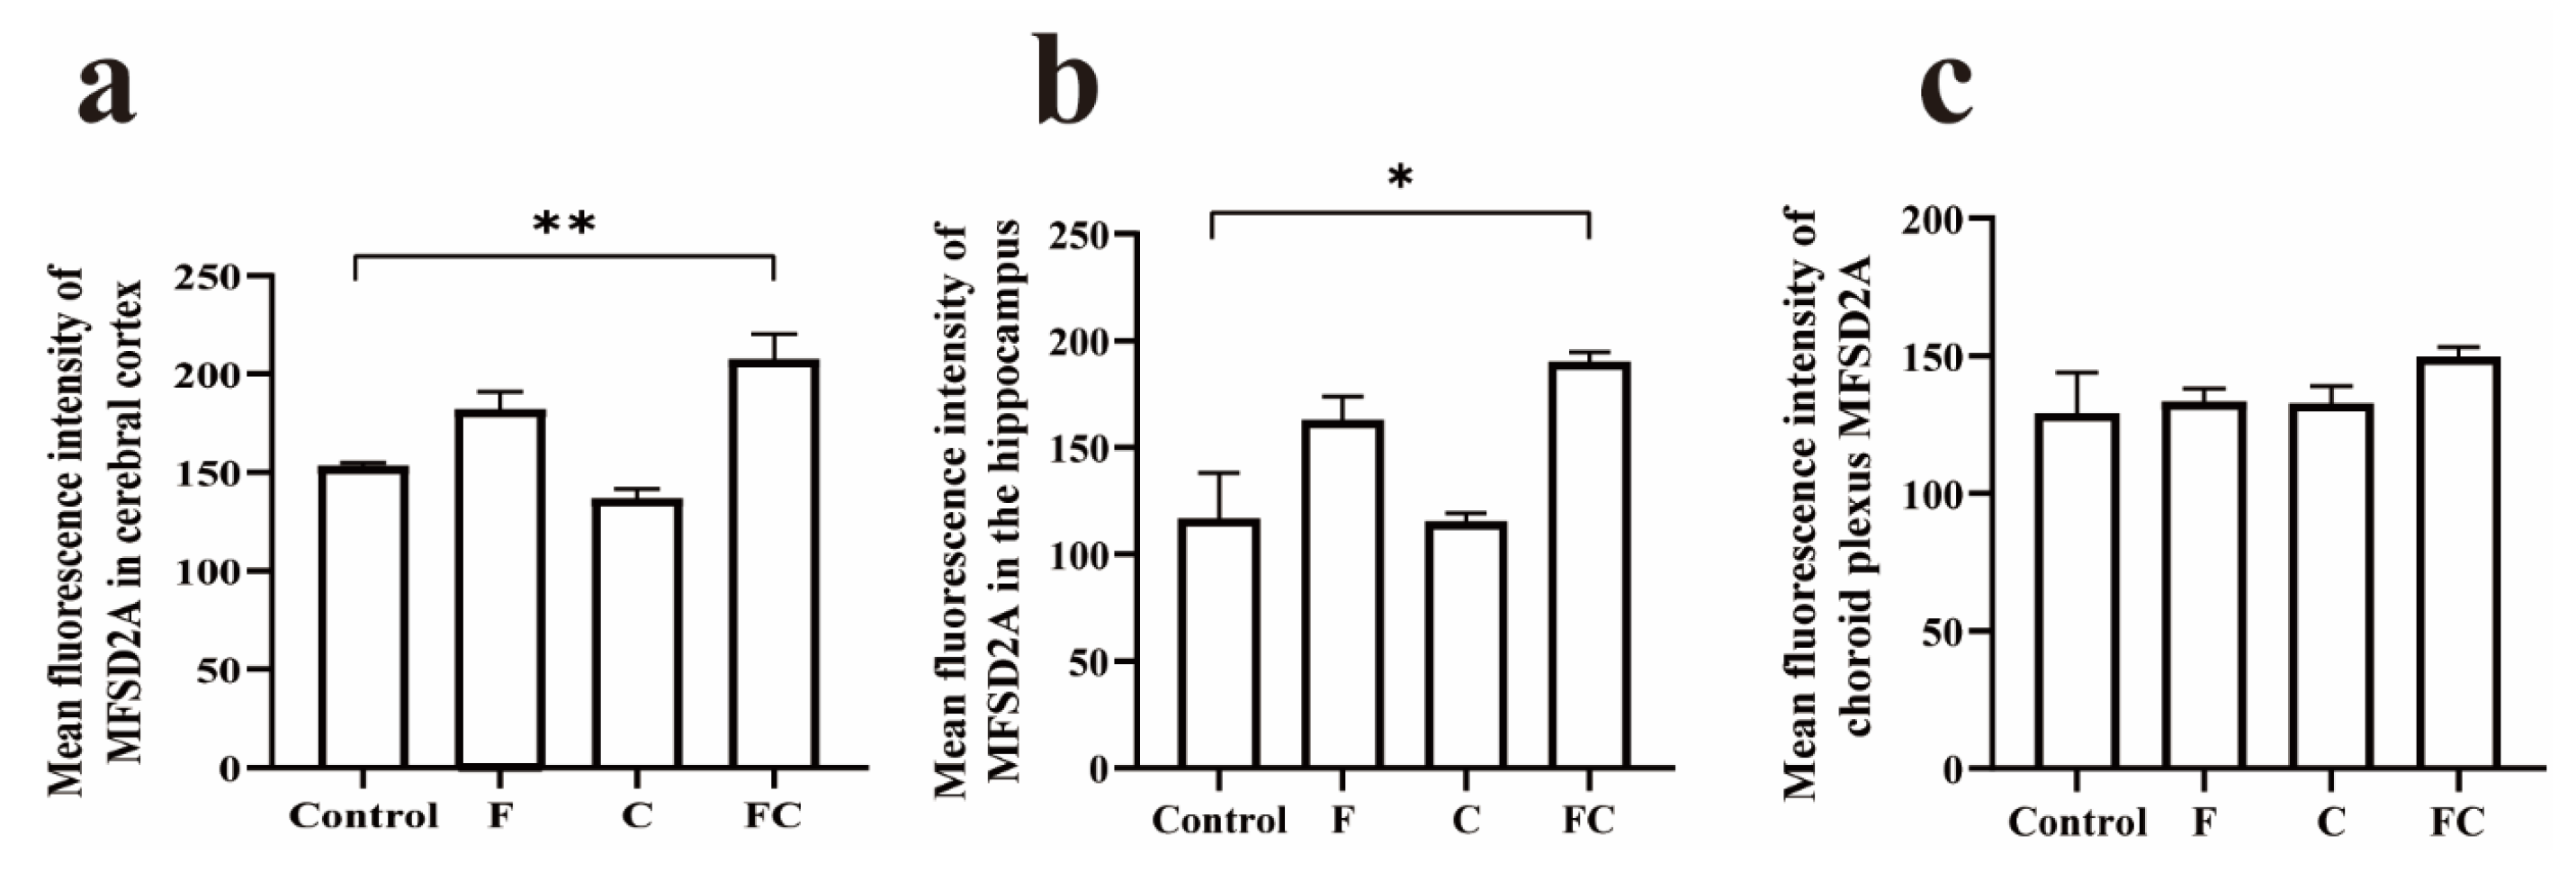
3.4. Effects of F, C, and FC on Fatty Acid Transporters in Mouse Brain
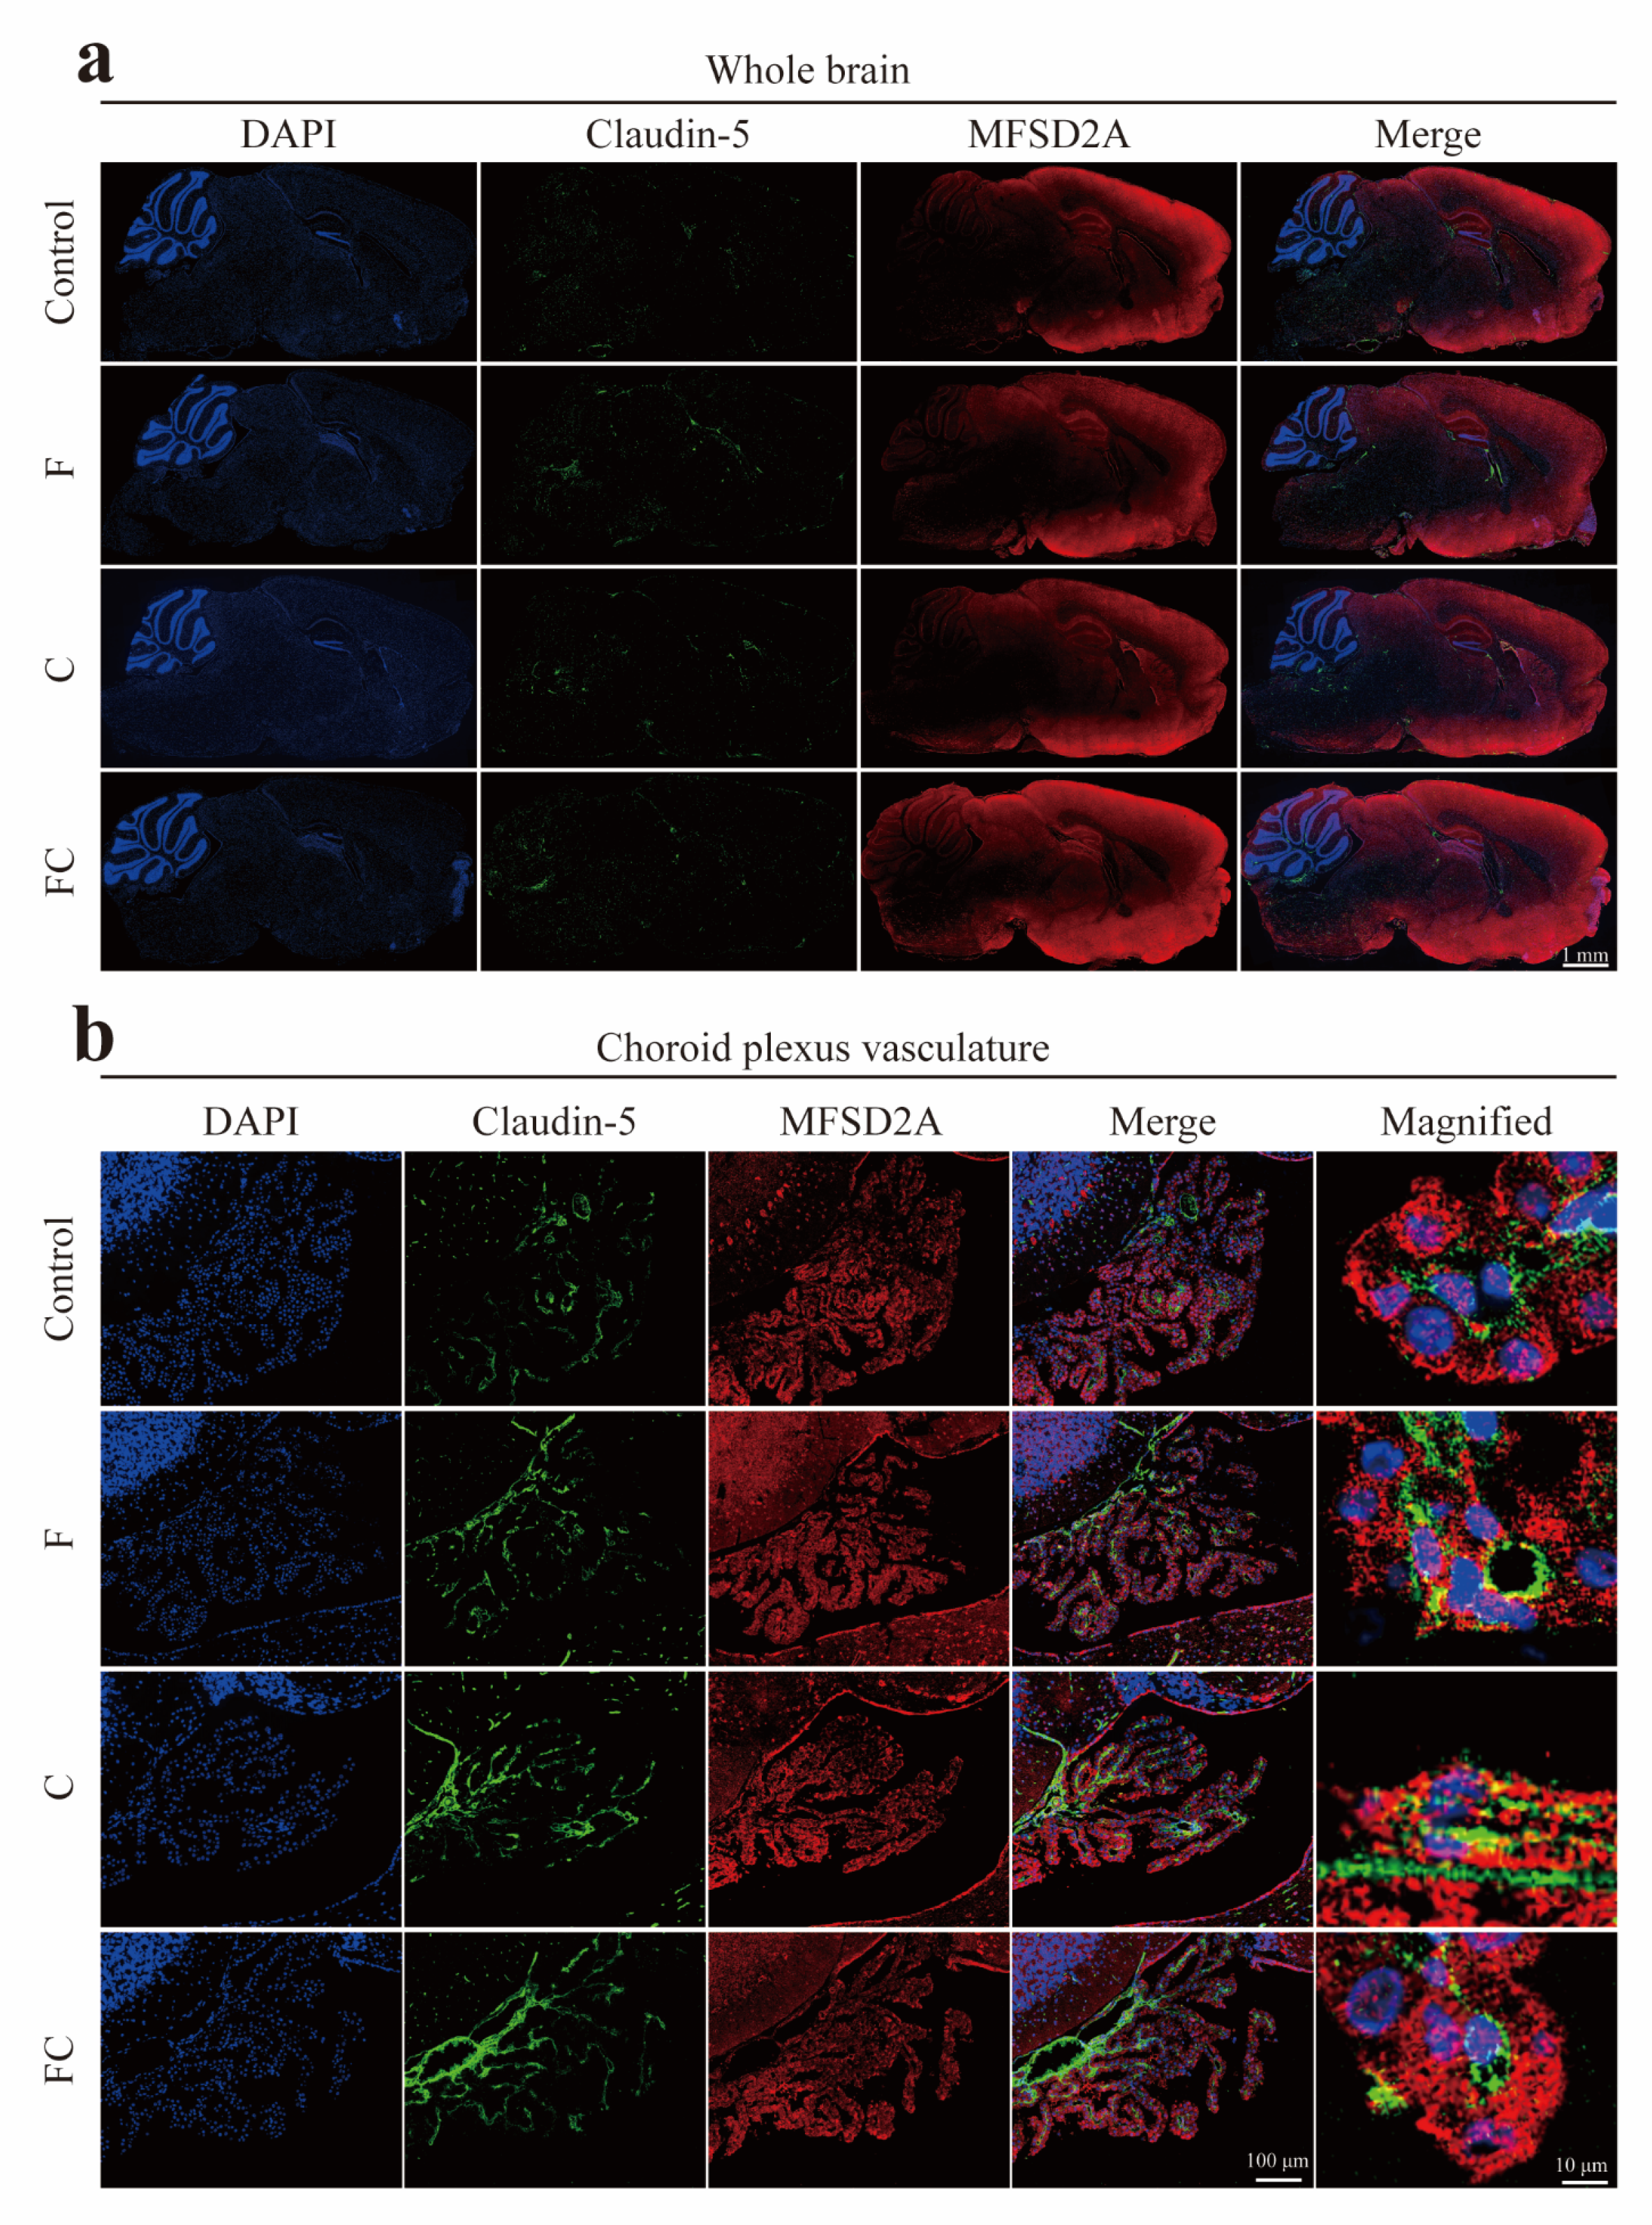
3.5. Immunofluorescence Double Staining to Detect the Positive Expression and Localization of MFSD2A in the Brain
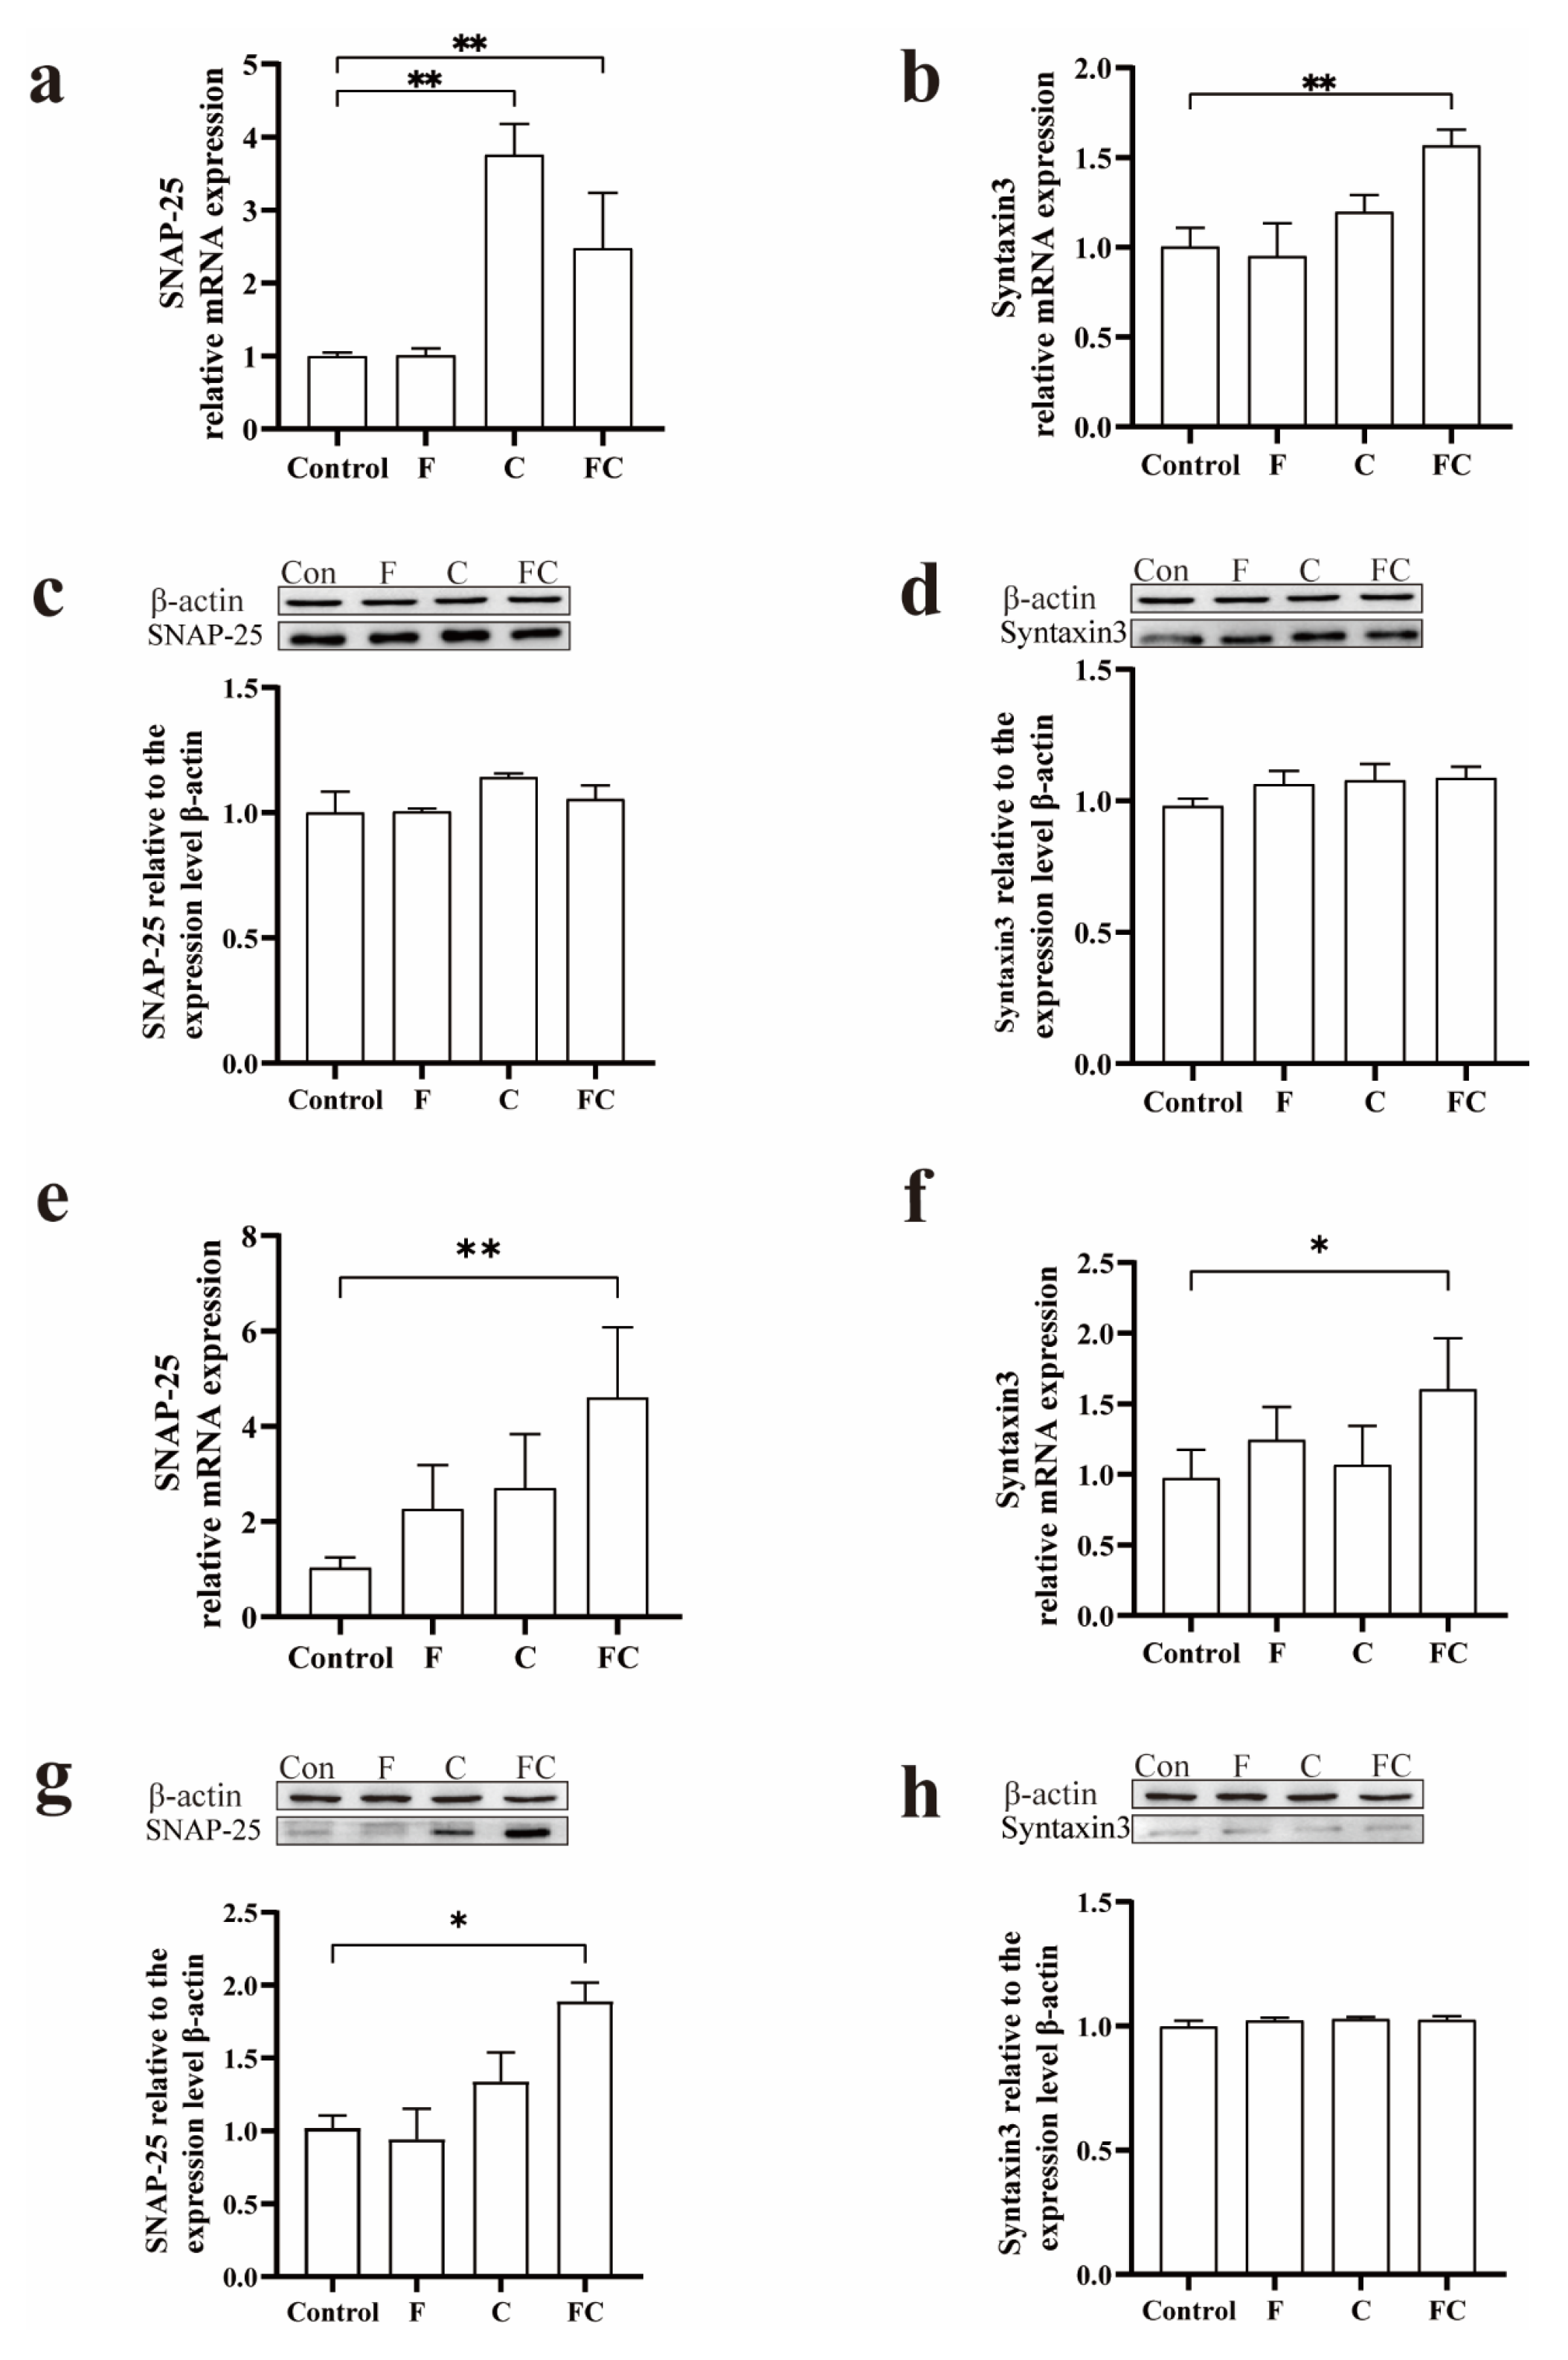
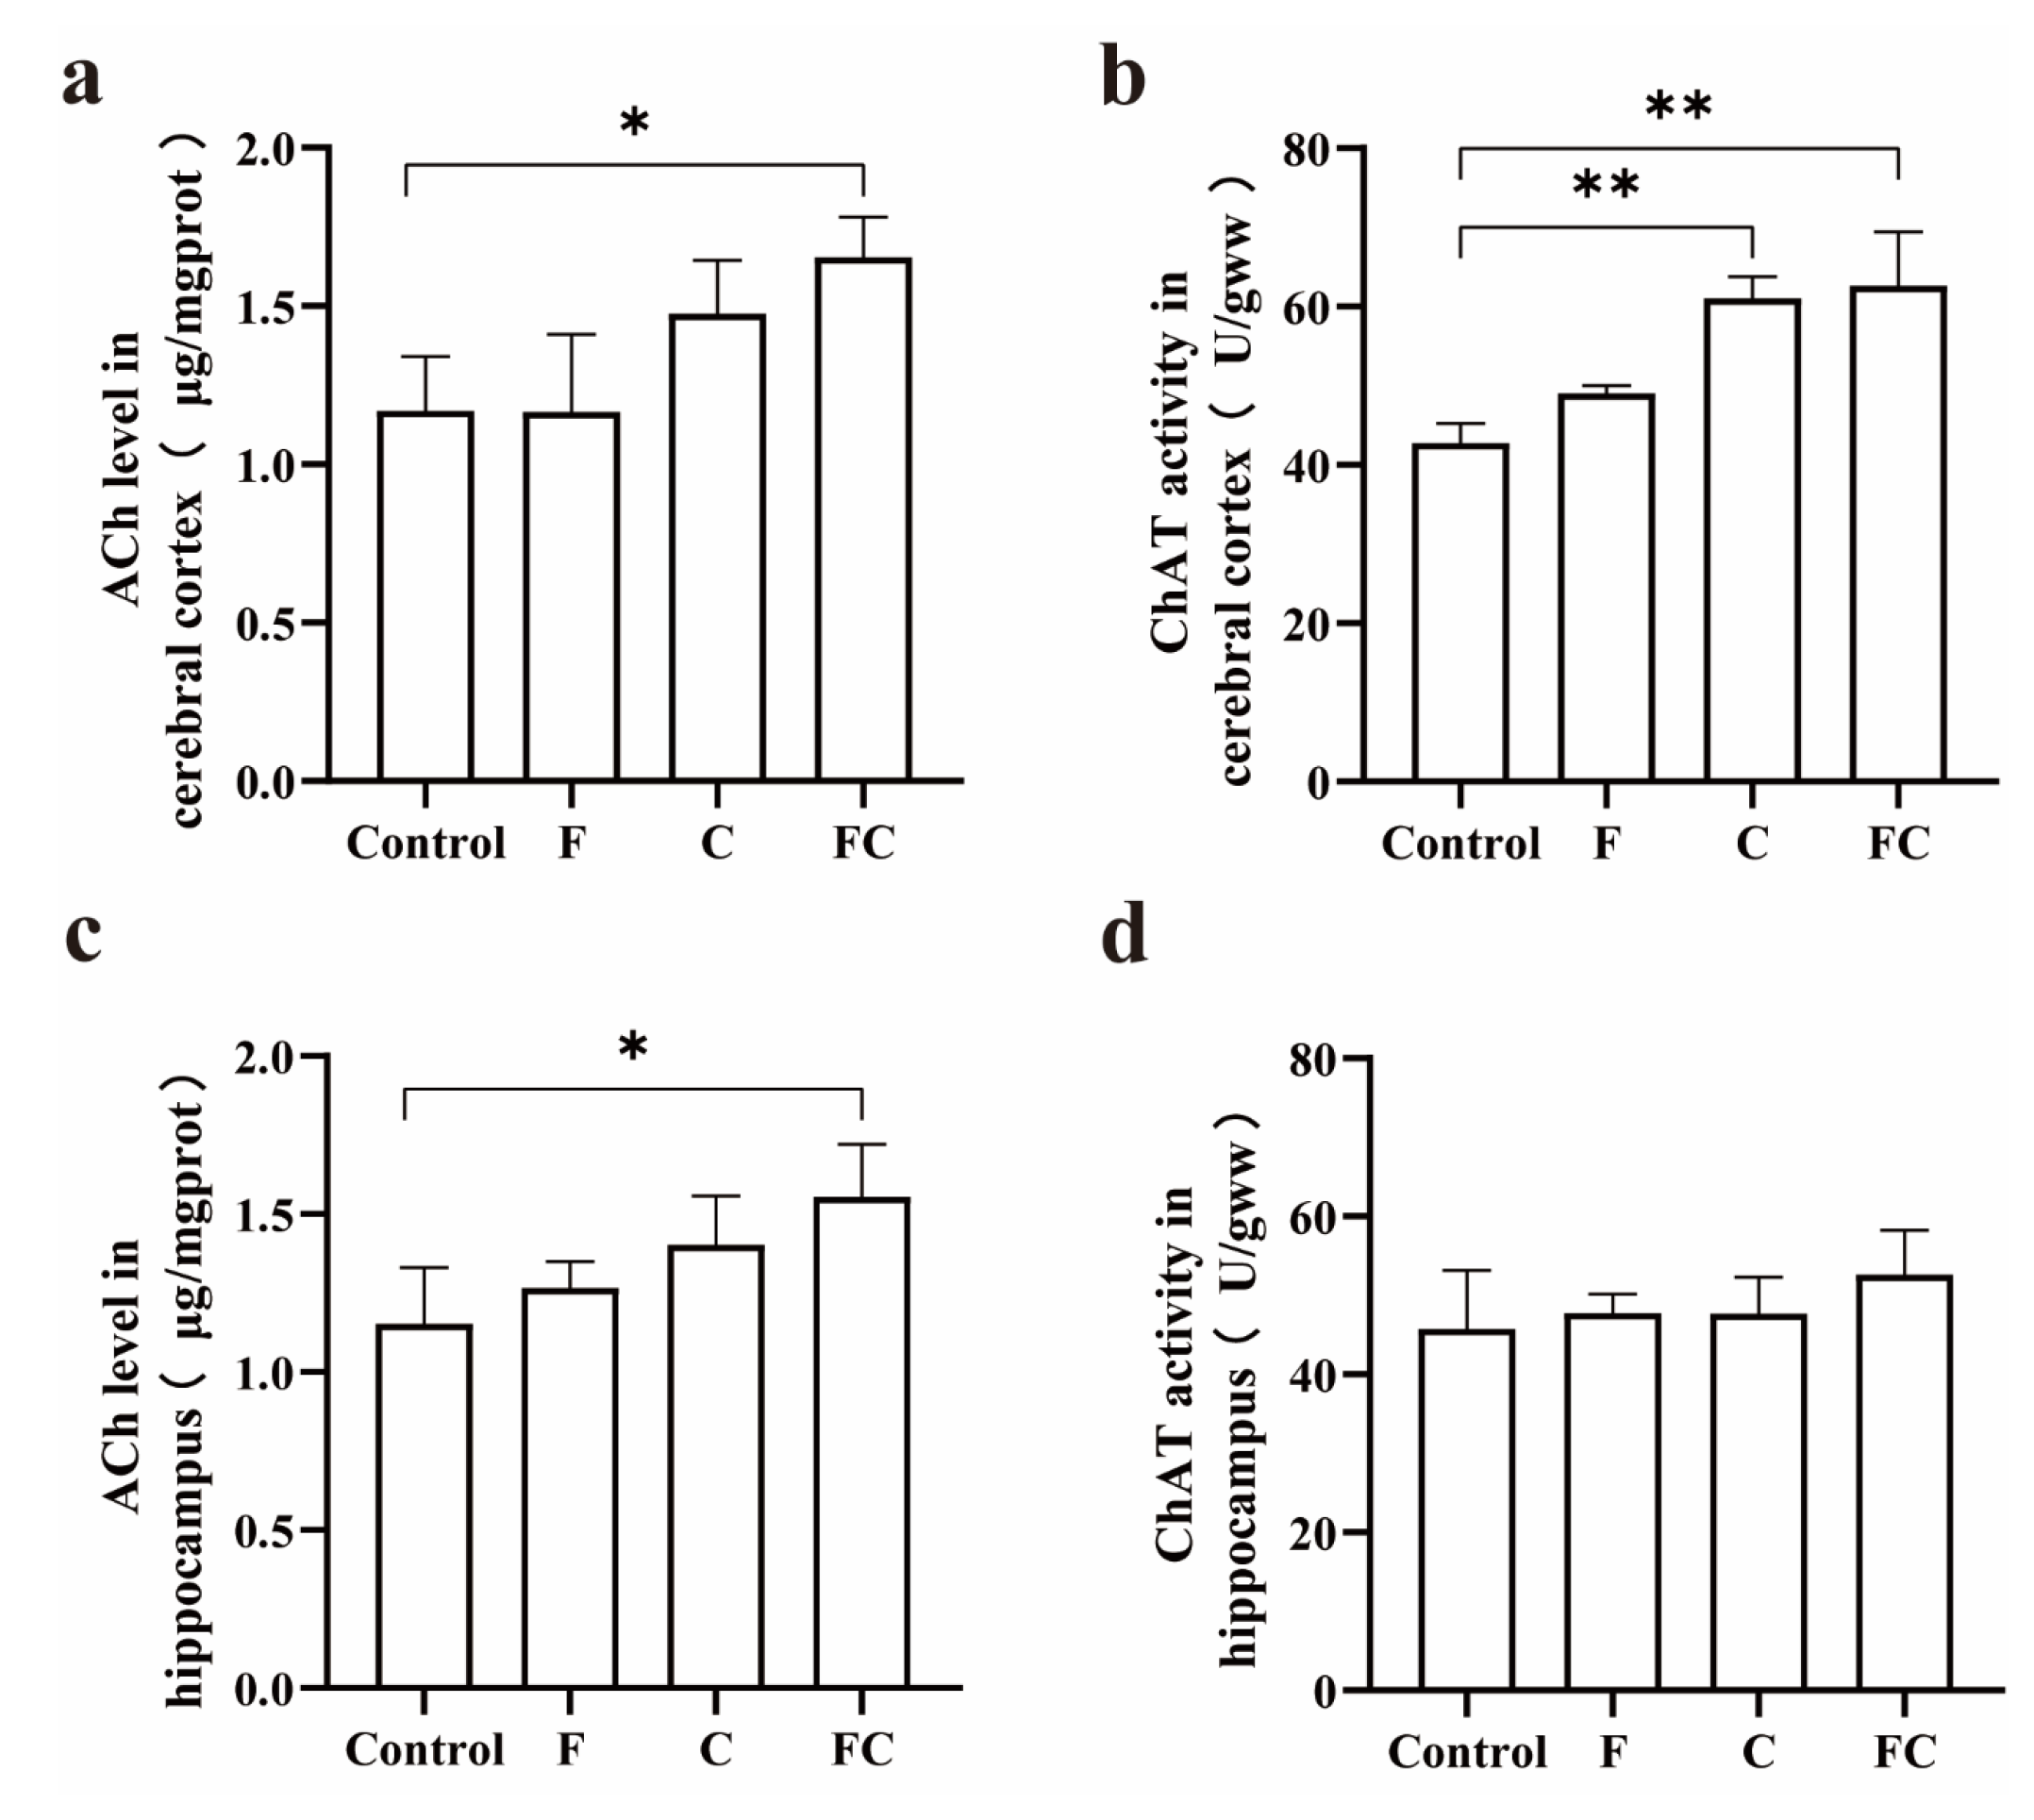
3.6. Effects of F, C, and FC on Cholinergic Neuron System in Mouse Brain
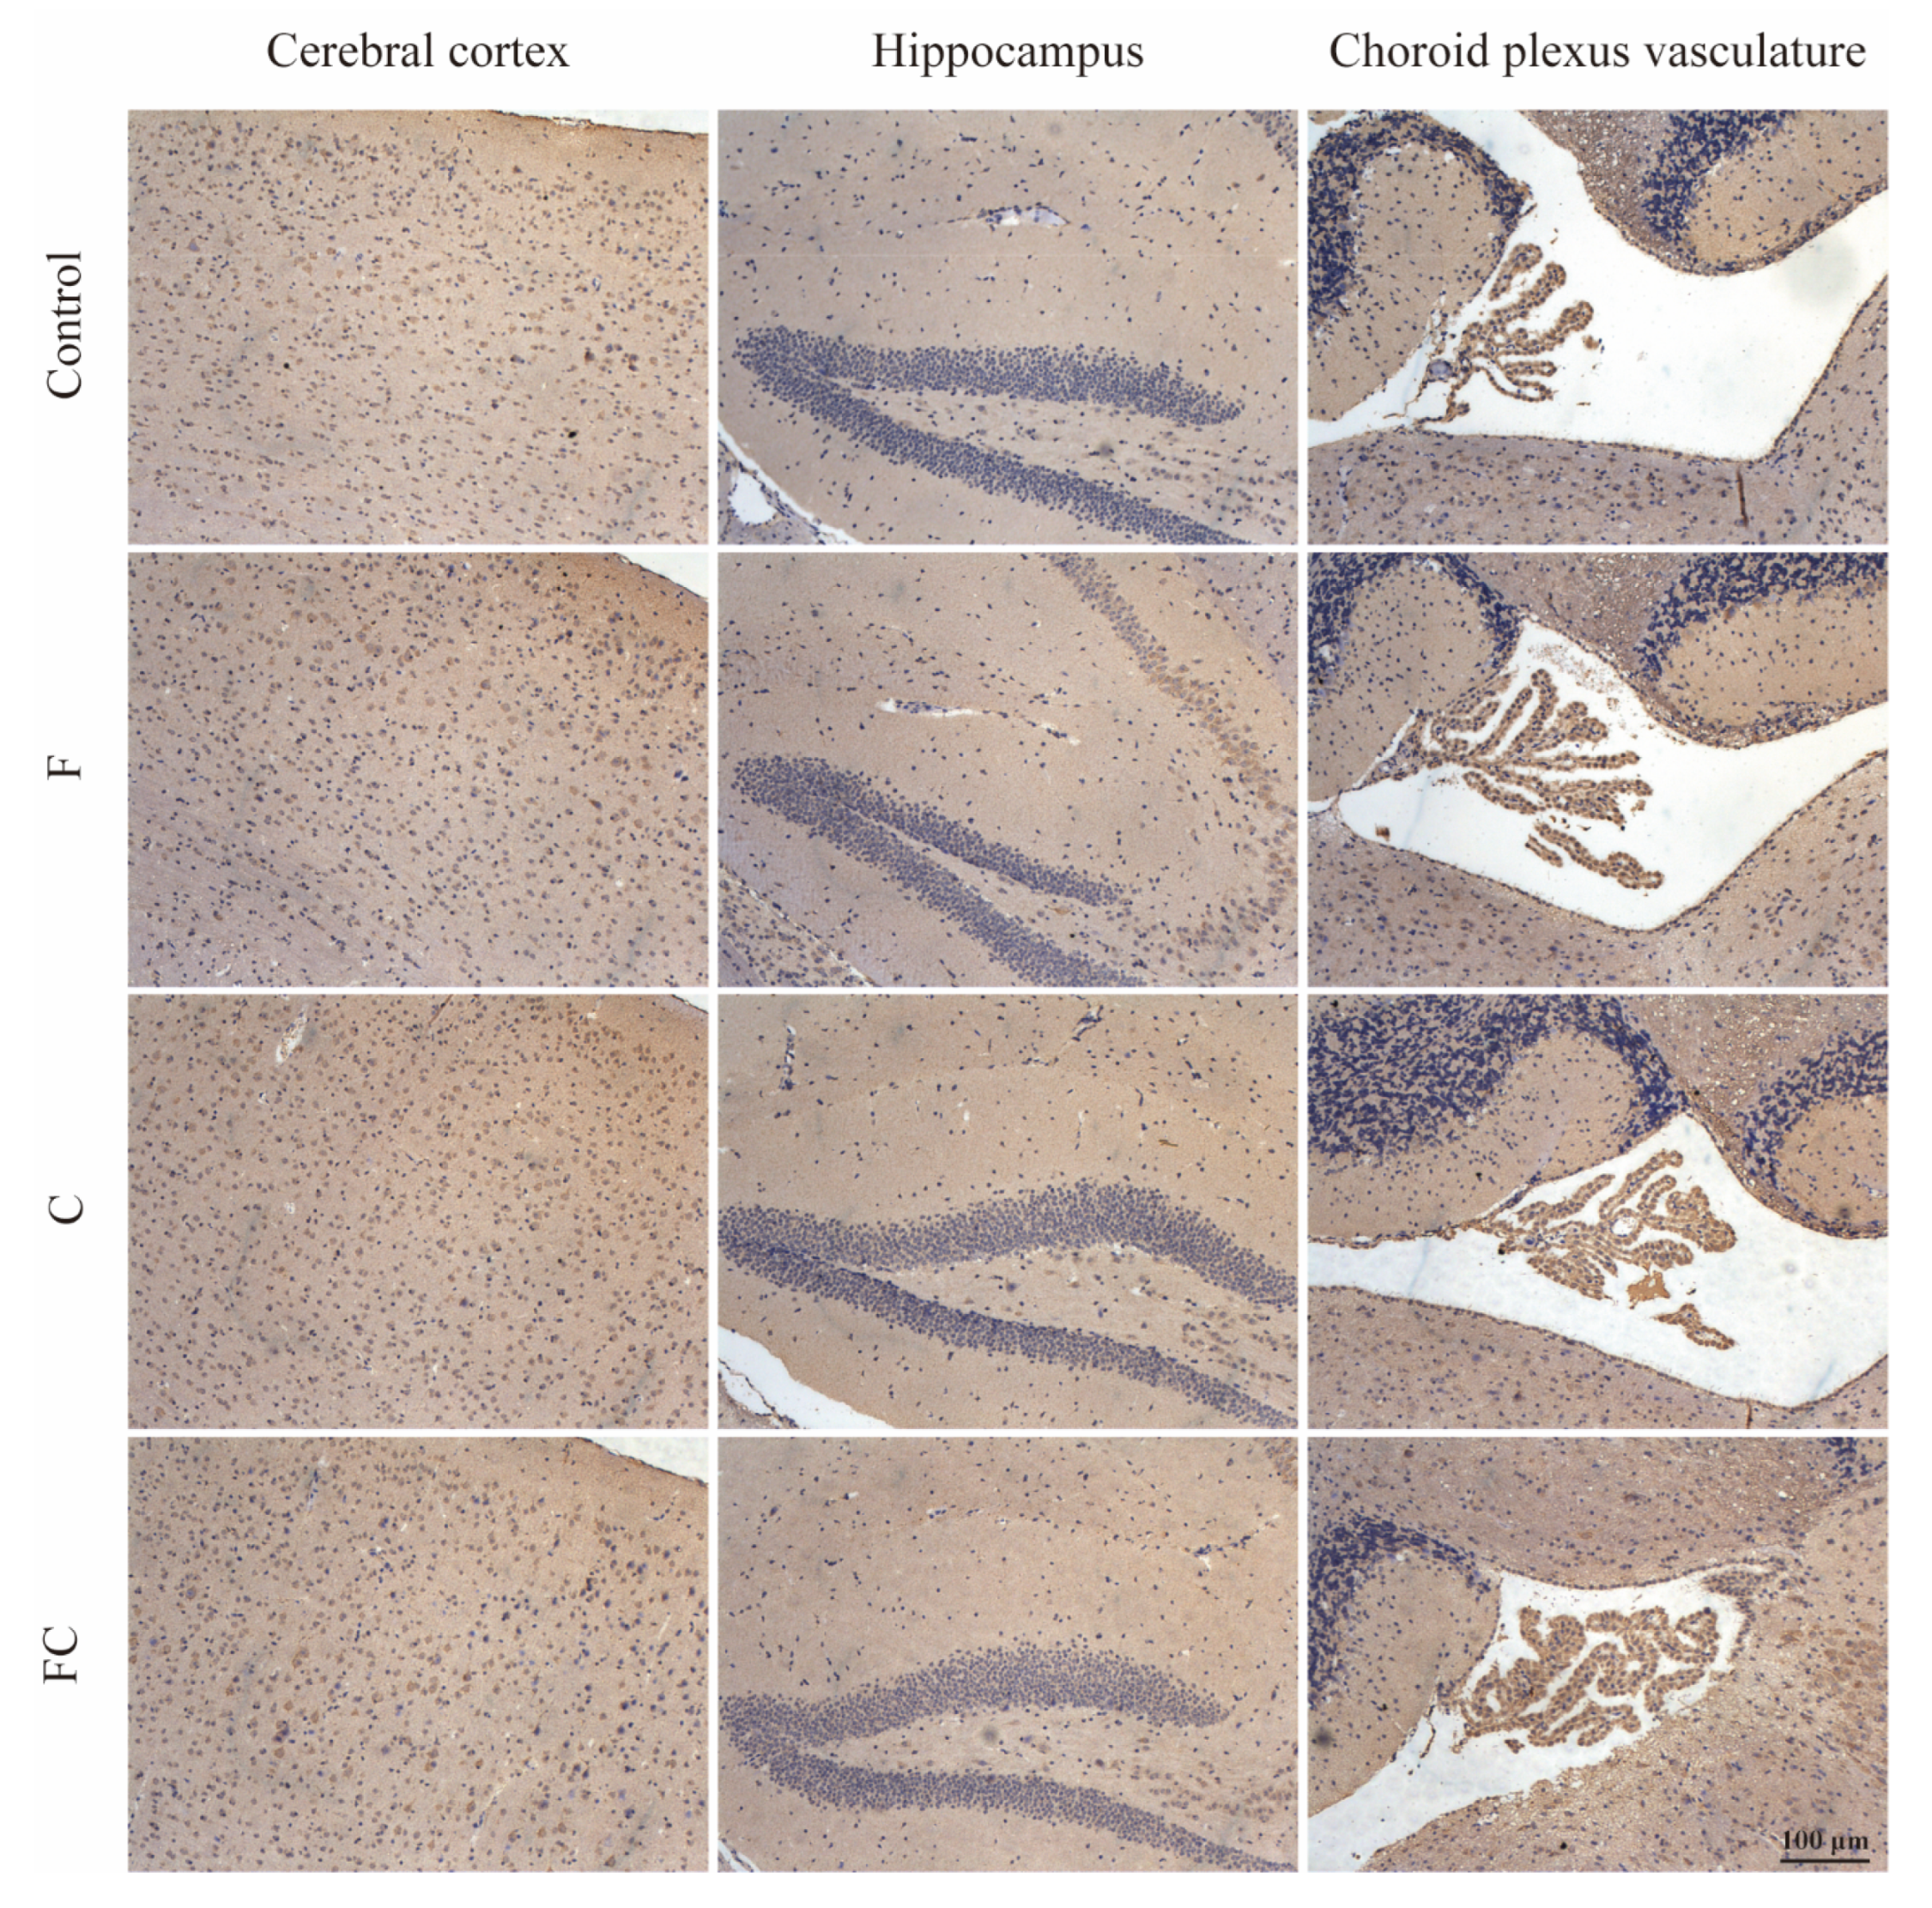
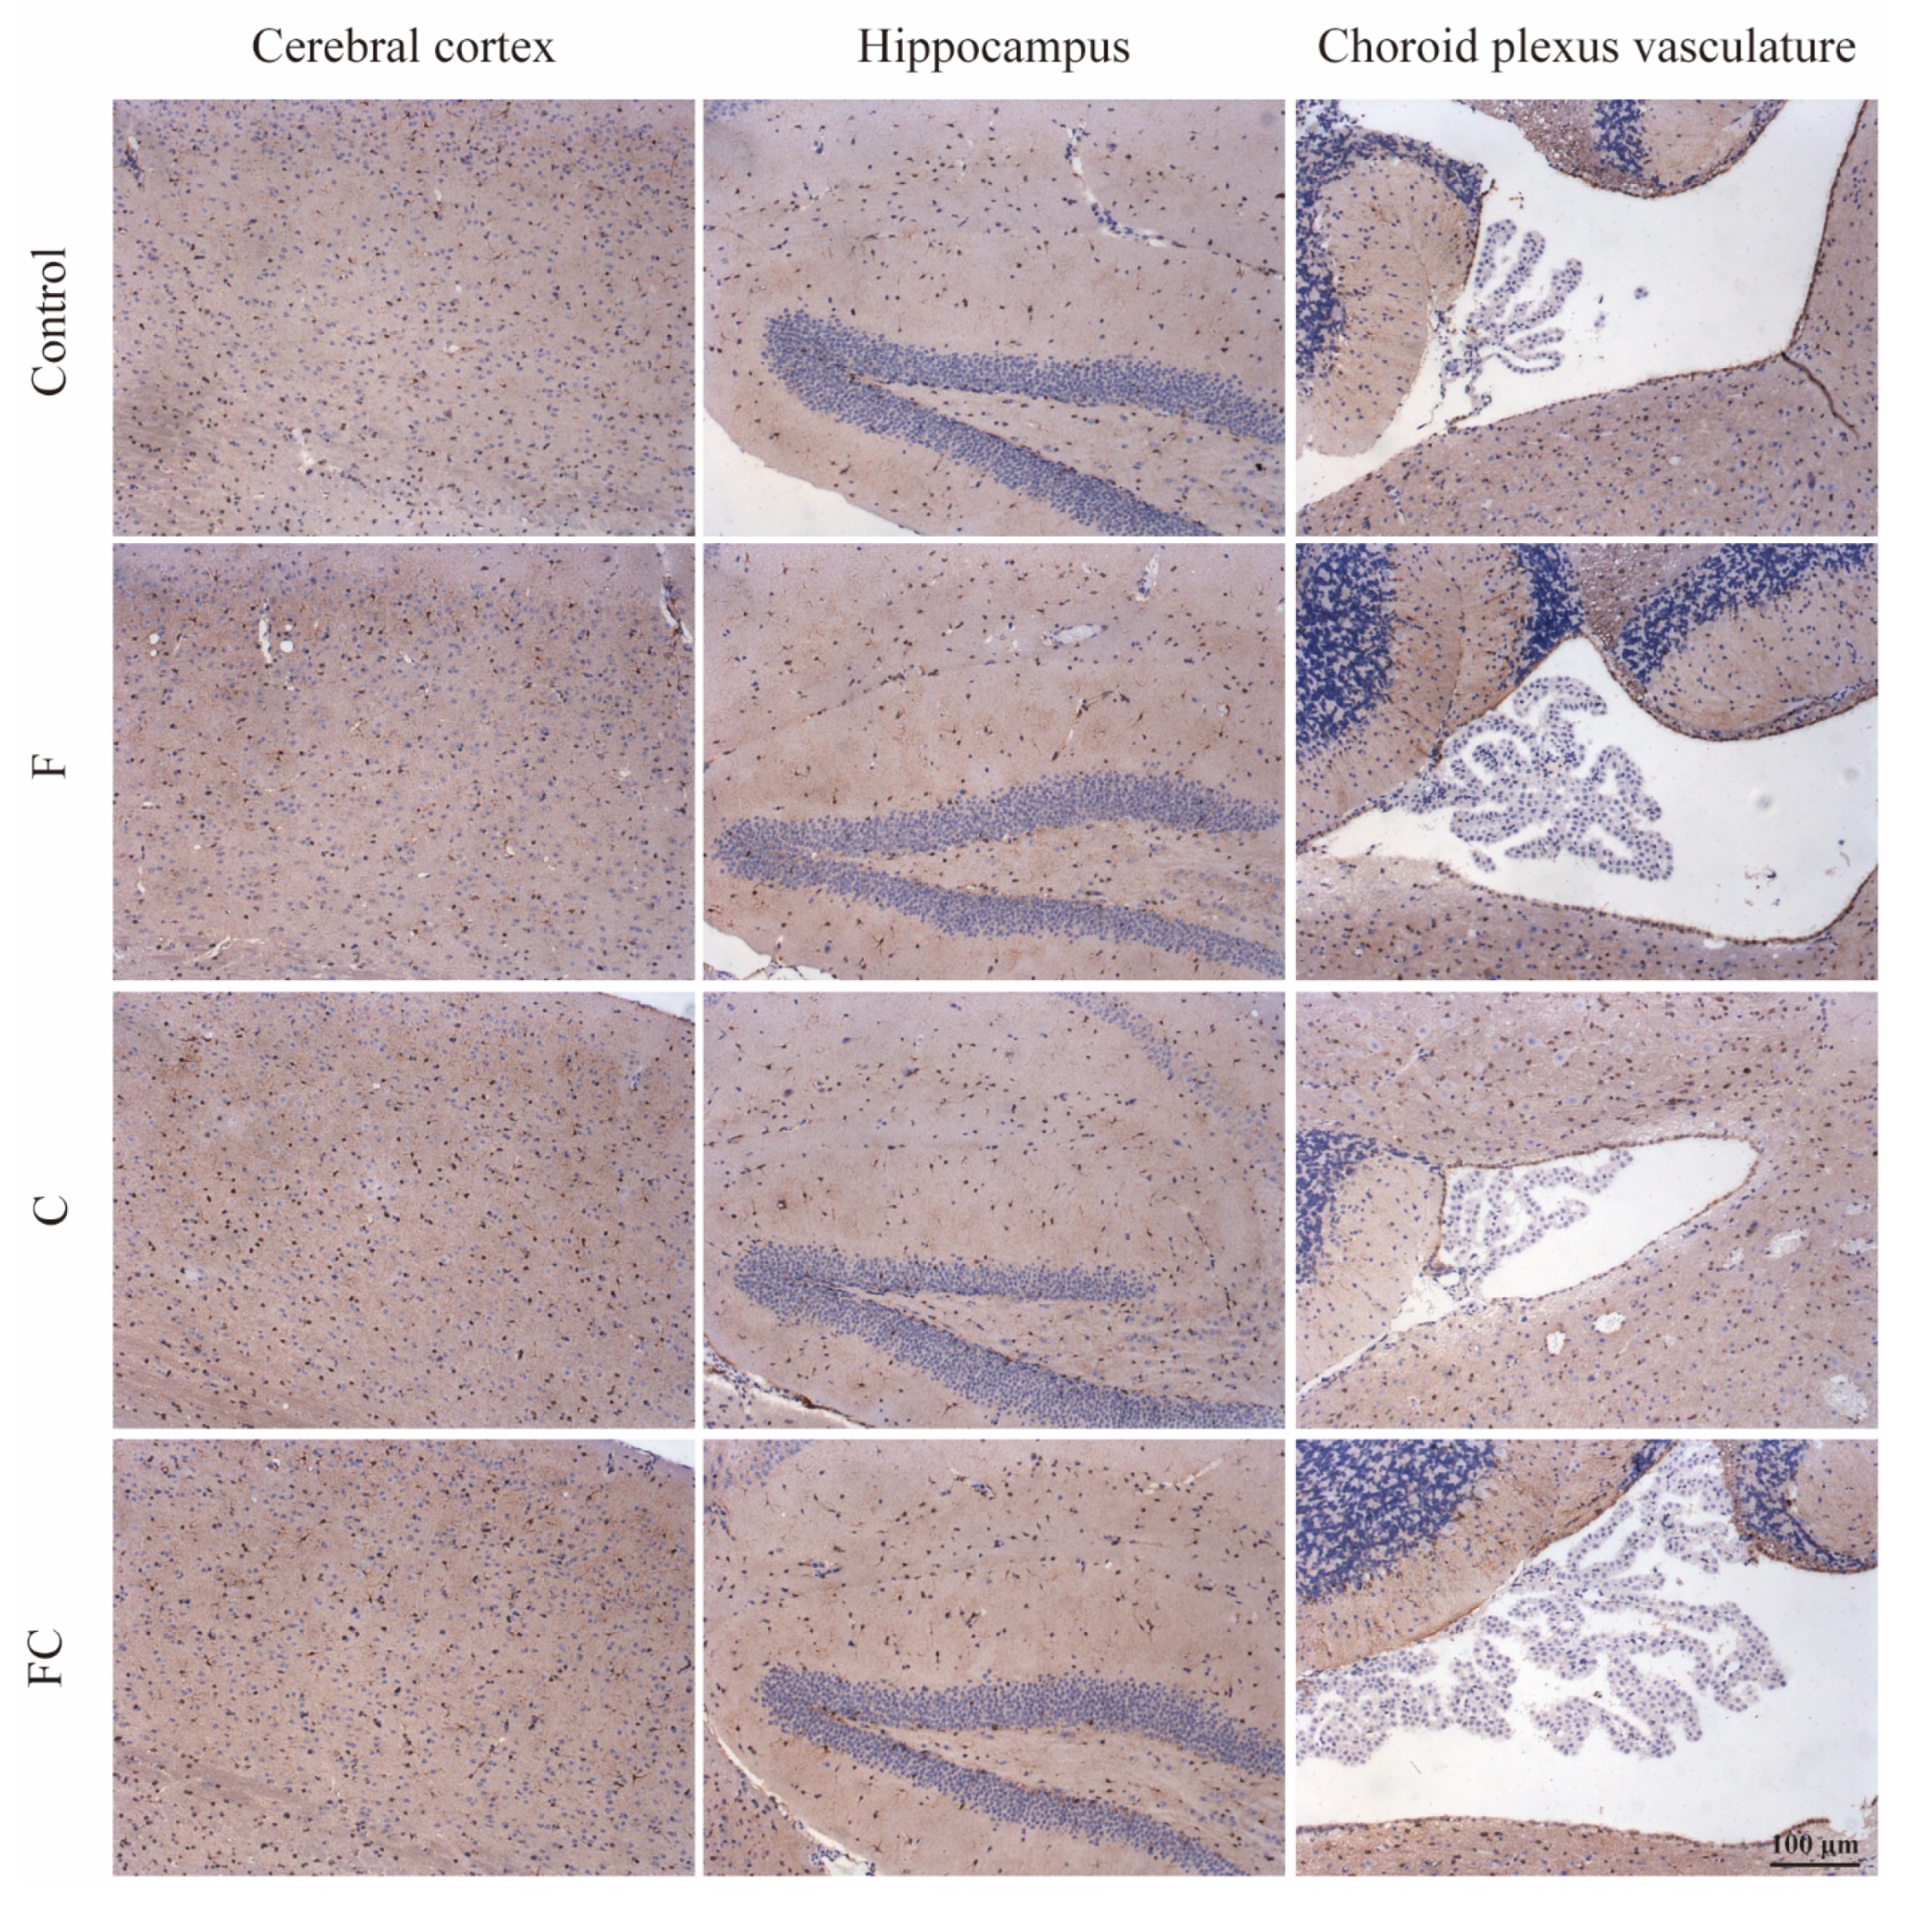
3.7. Immunohistochemical Detection of the Positive Expression of FATP1 and FABP5 in the Brain
4. Discussion
5. Conclusions
Author Contributions
Funding
Institutional Review Board Statement
Informed Consent Statement
Data Availability Statement
Conflicts of Interest
References
- Robertson, R.C.; Seira, O.C.; Murphy, K.; Moloney, G.M.; Cryan, J.F.; Dinan, T.G.; Paul, R.R.; Stanton, C. Omega-3 polyunsaturated fatty acids critically regulate behaviour and gut microbiota development in adolescence and adulthood. Brain Behav. Immun. 2017, 59, 21–37. [Google Scholar] [CrossRef] [PubMed]
- Jin, J.; Jin, Q.; Wang, X.; Akoh, C.C. High Sn-2 Docosahexaenoic Acid Lipids for Brain Benefits, and Their Enzymatic Syntheses: A Review. Engineering 2020, 6, 424–431. [Google Scholar] [CrossRef]
- Cardoso, C.; Afonso, C.; Bandarra, N.M. Dietary DHA and health: Cognitive function ageing. Nutr. Res. Rev. 2016, 29, 281–294. [Google Scholar] [CrossRef] [PubMed]
- Rapoport, S.I.; Ramadan, E.; Basselin, M. Docosahexaenoic acid (DHA) incorporation into the brain from plasma, as an in vivo biomarker of brain DHA metabolism and neurotransmission. Prostaglandins Other Lipid Mediat. 2011, 96, 109–113. [Google Scholar] [CrossRef]
- Daiello, L.A.; Gongvatana, A.; Dunsiger, S.; Cohen, R.A.; Ott, B.R. Association of fish oil supplement use with preservation of brain volume and cognitive function. Alzheimer’s Dement. 2015, 11, 226–235. [Google Scholar] [CrossRef]
- Saifullah, A.; Watkins, B.A.; Saha, C.; Li, Y.; Moe, S.M.; Friedman, A.N. Oral fish oil supplementation raises blood omega-3 levels and lowers C-reactive protein in haemodialysis patients—A pilot study. Nephrol. Dial. Transplant. 2007, 22, 3561–3567. [Google Scholar] [CrossRef]
- Chen, C.T.; Kitson, A.P.; Hopperton, K.E.; Domenichiello, A.F.; Trépanier, M.; Lin, L.E.; Ermini, L.; Post, M.; Thies, F.; Bazinet, R.P. Plasma non-esterified docosahexaenoic acid is the major pool supplying the brain. Sci. Rep. 2015, 5, 15791. [Google Scholar] [CrossRef]
- Pélerin, H.; Jouin, M.; Lallemand, M.; Alessandri, J.; Cunnane, S.C.; Langelier, B.; Guesnet, P. Gene expression of fatty acid transport and binding proteins in the blood–brain barrier and the cerebral cortex of the rat: Differences across development and with different DHA brain status. Prostaglandins Leukot. Essent. Fat. Acids 2014, 91, 213–220. [Google Scholar] [CrossRef]
- Lacombe, R.J.S.; Chouinard-Watkins, R.; Bazinet, R.P. Brain docosahexaenoic acid uptake and metabolism. Mol. Aspects Med. 2018, 64, 109–134. [Google Scholar] [CrossRef]
- Chouinard-Watkins, R.; Lacombe, R.; Bazinet, R.P. Mechanisms regulating brain docosahexaenoic acid uptake: What is the recent evidence? Curr. Opin. Clin. Nutr. 2018, 21, 71–77. [Google Scholar] [CrossRef]
- Berger, J.H.; Charron, M.J.; Silver, D.L. Major facilitator superfamily domain-containing protein 2a (MFSD2A) has roles in body growth, motor function, and lipid metabolism. PLoS ONE 2012, 7, e50629. [Google Scholar] [CrossRef] [PubMed]
- Nguyen, L.N.; Ma, D.; Shui, G.; Wong, P.; Cazenave-Gassiot, A.; Zhang, X.; Wenk, M.R.; Goh, E.L.K.; Silver, D.L. Mfsd2a is a transporter for the essential omega-3 fatty acid docosahexaenoic acid. Nature 2014, 509, 503–506. [Google Scholar] [CrossRef] [PubMed]
- Kaur, G.; Begg, D.P.; Barr, D.; Garg, M.; Cameron-Smith, D.; Sinclair, A.J. Short-term docosapentaenoic acid (22:5 n-3) supplementation increases tissue docosapentaenoic acid, DHA and EPA concentrations in rats. Br. J. Nutr. 2010, 103, 32–37. [Google Scholar] [CrossRef] [PubMed]
- Lin, Y.H.; Shah, S.; Salem, N.J. Altered essential fatty acid metabolism and composition in rat liver, plasma, heart and brain after microalgal DHA addition to the diet. J. Nutr. Biochem. 2011, 22, 758–765. [Google Scholar] [CrossRef]
- Sugasini, D.; Yalagala, P.C.R.; Goggin, A.; Tai, L.M.; Subbaiah, P.V. Enrichment of brain docosahexaenoic acid (DHA) is highly dependent upon the molecular carrier of dietary DHA: Lysophosphatidylcholine is more efficient than either phosphatidylcholine or triacylglycerol. J. Nutr. Biochem. 2019, 74, 108231. [Google Scholar] [CrossRef]
- Sugasini, D.; Thomas, R.; Yalagala, P.; Tai, L.M.; Subbaiah, P.V. Dietary docosahexaenoic acid (DHA) as lysophosphatidylcholine, but not as free acid, enriches brain DHA and improves memory in adult mice. Sci. Rep. 2017, 7, 11263. [Google Scholar] [CrossRef]
- Rodrigues, P.O.; Martins, S.V.; Lopes, P.A.; Ramos, C.; Migueis, S.; Alfaia, C.M.; Pinto, R.M.; Rolo, E.A.; Bispo, P.; Batista, I.; et al. Influence of feeding graded levels of canned sardines on the inflammatory markers and tissue fatty acid composition of Wistar rats. Br. J. Nutr. 2014, 112, 309–319. [Google Scholar] [CrossRef]
- Zeisel, S.H. Choline: Critical role during fetal development and dietary requirements in adults. Annu. Rev. Nutr. 2006, 26, 229–250. [Google Scholar] [CrossRef]
- Tabassum, S.; Haider, S.; Ahmad, S.; Madiha, S.; Parveen, T. Chronic choline supplementation improves cognitive and motor performance via modulating oxidative and neurochemical status in rats. Pharmacol. Biochem. Behav. 2017, 159, 90–99. [Google Scholar] [CrossRef]
- Wang, Z.; Tang, W.H.; Buffa, J.A.; Fu, X.; Britt, E.B.; Koeth, R.A.; Levison, B.S.; Fan, Y.; Wu, Y.; Hazen, S.L. Prognostic value of choline and betaine depends on intestinal microbiota-generated metabolite trimethylamine-N-oxide. Eur. Heart J. 2014, 35, 904–910. [Google Scholar] [CrossRef]
- Blusztajn, J.K.; Slack, B.E.; Mellott, T.J. Neuroprotective Actions of Dietary Choline. Nutrients 2017, 9, 815. [Google Scholar] [CrossRef] [PubMed]
- Kresge, N.; Simoni, R.D.; Hill, R.L. The Kennedy Pathway for Phospholipid Synthesis: The Work of Eugene Kennedy. J. Biol. Chem. 2005, 280, e22–e24. [Google Scholar] [CrossRef]
- Da Costa, K.; Sanders, L.M.; Fischer, L.M.; Zeisel, S.H. Docosahexaenoic acid in plasma phosphatidylcholine may be a potential marker for in vivo phosphatidylethanolamine N-methyltransferase activity in humans. Am. J. Clin. Nutr. 2011, 93, 968–974. [Google Scholar] [CrossRef] [PubMed]
- West, A.A.; Yan, J.; Jiang, X.; Perry, C.A.; Innis, S.M.; Caudill, M.A. Choline intake influences phosphatidylcholine DHA enrichment in nonpregnant women but not in pregnant women in the third trimester. Am. J. Clin. Nutr. 2013, 97, 718–727. [Google Scholar] [CrossRef]
- Kratsios, P.; Stolfi, A.; Levine, M.; Hobert, O. Coordinated regulation of cholinergic motor neuron traits through a conserved terminal selector gene. Nat. Neurosci. 2012, 15, 205–214. [Google Scholar] [CrossRef]
- Shi, S.; Ma, K.; Bin, N.; Harada, H.; Xie, X.; Huang, M.; Liu, H.; Lee, S.; Wang, X.F.; Adachi, R.; et al. Syntaxin-3 is dispensable for basal neurotransmission and synaptic plasticity in postsynaptic hippocampal CA1 neurons. Sci. Rep. 2020, 10, 709. [Google Scholar] [CrossRef]
- Wu, D.; Xu, X.; Sun, N.; Li, D.; Zhu, B.; Lin, S. AGLPM and QMDDQ peptides exert a synergistic action on memory improvement against scopolamine-induced amnesiac mice. Food Funct. 2020, 11, 10925–10935. [Google Scholar] [CrossRef]
- Xuan, Q.; Hu, C.; Yu, D.; Wang, L.; Zhou, Y.; Zhao, X.; Li, Q.; Hou, X.; Xu, G. Development of a High Coverage Pseudotargeted Lipidomics Method Based on Ultra-High Performance Liquid Chromatography-Mass Spectrometry. Anal. Chem. 2018, 12, 7608–7616. [Google Scholar] [CrossRef]
- Micale, V.; Cristino, L.; Tamburella, A.; Petrosino, S.; Leggio, G.M.; Di Marzo, V.; Drago, F. Enhanced cognitive performance of dopamine D3 receptor “knock-out” mice in the step-through passive-avoidance test: Assessing the role of the endocannabinoid/endovanilloid systems. Pharmacol. Res. 2010, 61, 531–536. [Google Scholar] [CrossRef]
- Ebrahimi-Ghiri, M.; Rostampour, M.; Jamshidi-Mehr, M.; Nasehi, M.; Zarrindast, M. Role of CA1 GABA A and GABA B receptors on learning deficit induced by D-AP5 in passive avoidance step-through task. Brain Res. 2018, 1678, 164. [Google Scholar] [CrossRef]
- Yalagala, P.C.R.; Sugasini, D.; Zaldua, S.B.; Tai, L.M.; Subbaiah, P.V. Lipase Treatment of Dietary Krill Oil, but Not Fish Oil, Enables Enrichment of Brain Eicosapentaenoic Acid and Docosahexaenoic Acid. Mol. Nutr. Food Res. 2020, 64, 2000059. [Google Scholar] [CrossRef]
- Bernhard, W.; Böckmann, K.; Maas, C.; Mathes, M.; Hövelmann, J.; Shunova, A.; Hund, V.; Schleicher, E.; Poets, C.F.; Franz, A.R. Combined choline and DHA supplementation: A randomized controlled trial. Eur. J. Nutr. 2020, 59, 729–739. [Google Scholar] [CrossRef]
- Pan, Y.; Morris, E.R.; Scanlon, M.J.; Marriott, P.J.; Porter, C.J.H.; Nicolazzo, J.A. Dietary docosahexaenoic acid supplementation enhances expression of fatty acid-binding protein 5 at the blood-brain barrier and brain docosahexaenoic acid levels. J. Neurochem. 2018, 146, 186–197. [Google Scholar] [CrossRef]
- Zhang, W.; Chen, R.; Yang, T.; Xu, N.; Chen, J.; Gao, Y.; Stetler, R.A. Fatty acid transporting proteins: Roles in brain development, aging, and stroke. Prostaglandins Leukot. Essent. Fat. Acids 2018, 136, 35–45. [Google Scholar] [CrossRef]
- Sandoval, K.E.; Wooten, J.S.; Harris, M.P.; Schaller, M.L.; Umbaugh, D.S.; Witt, K.A. Mfsd2a and Glut1 Brain Nutrient Transporters Expression Increase with 32-Week Low and High Lard Compared with Fish-Oil Dietary Treatment in C57Bl/6 Mice. Curr. Dev. Nutr. 2018, 2, y65. [Google Scholar] [CrossRef]
- Mansvelder, H.D.; Verhoog, M.B.; Goriounova, N.A. Synaptic plasticity in human cortical circuits: Cellular mechanisms of learning and memory in the human brain? Curr. Opin. Neurobiol. 2019, 54, 186–193. [Google Scholar] [CrossRef]
- van Wijk, N.; Broersen, L.M.; de Wilde, M.C.; Hageman, R.J.J.; Groenendijk, M.; Sijben, J.W.C.; Kamphuis, P.J.G.H. Targeting Synaptic Dysfunction in Alzheimer’s Disease by Administering a Specific Nutrient Combination. J. Alzheimer’s Dis. 2013, 38, 459–479. [Google Scholar] [CrossRef]
- Pa, J.J.; Berry, A.S.A.S.; Compagnone, M.M.; Boccanfuso, J.J.; Greenhouse, I.I.; Rubens, M.T.M.T.; Johnson, J.K.J.K.; Gazzaley, A.A. Cholinergic enhancement of functional networks in older adults with MCI. Ann. Neurol. 2013, 73, 762–773. [Google Scholar] [CrossRef]
- Alten, B.; Zhou, Q.; Shin, O.; Esquivies, L.; Lin, P.; White, K.I.; Sun, R.; Chung, W.K.; Monteggia, L.M.; Brunger, A.T.; et al. Role of Aberrant Spontaneous Neurotransmission in SNAP25-Associated Encephalopathies. Neuron 2021, 109, 59–72. [Google Scholar] [CrossRef]
- Soo Hoo, L.; Banna, C.D.; Radeke, C.M.; Sharma, N.; Albertolle, M.E.; Low, S.H.; Weimbs, T.; Vandenberg, C.A. The SNARE Protein Syntaxin 3 Confers Specificity for Polarized Axonal Trafficking in Neurons. PLoS ONE 2016, 11, e163671. [Google Scholar] [CrossRef]
- Zhou, Q.; Zhou, P.; Wang, A.L.; Wu, D.; Zhao, M.; Südhof, T.C.; Brunger, A.T. The primed SNARE–complexin–synaptotagmin complex for neuronal exocytosis. Nature 2017, 548, 420–425. [Google Scholar] [CrossRef] [PubMed]
- Mazelova, J.; Ransom, N.; Astuto-Gribble, L.; Wilson, M.C.; Deretic, D. Syntaxin 3 and SNAP-25 pairing, regulated by omega-3 docosahexaenoic acid, controls the delivery of rhodopsin for the biogenesis of cilia-derived sensory organelles, the rod outer segments. J. Cell Sci. 2009, 122, 2003–2013. [Google Scholar] [CrossRef] [PubMed]
- Darios, F.; Davletov, B. Omega-3 and omega-6 fatty acids stimulate cell membrane expansion by acting on syntaxin 3. Nature 2006, 440, 813–817. [Google Scholar] [CrossRef] [PubMed]
- Kooi, E.J.; Prins, M.; Bajic, N.; Belien, J.A.; Gerritsen, W.H.; van Horssen, J.; Aronica, E.; van Dam, A.M.; Hoozemans, J.J.; Francis, P.T.; et al. Cholinergic imbalance in the multiple sclerosis hippocampus. Acta Neuropathol. 2011, 122, 313–322. [Google Scholar] [CrossRef]
- Picciotto, M.R.; Higley, M.J.; Mineur, Y.S. Acetylcholine as a Neuromodulator: Cholinergic Signaling Shapes Nervous System Function and Behavior. Neuron 2012, 76, 116–129. [Google Scholar] [CrossRef] [PubMed]


| Ingredient | gm% | Kcal% |
|---|---|---|
| Casein | 200 | 800 |
| L-Cystine | 3 | 12 |
| Corn starch | 425.75 | 1674 |
| Maltodextrin 10 | 132 | 528 |
| Sucrose | 100 | 400 |
| Cellulose, BW200 | 50 | 0 |
| Palm stearin | 50 | 450 |
| Mineral Mix S10022G | 35 | 0 |
| Vitamin Mix V10037 | 3 | 40 |
| Choline bitartrate | 1.25 | 0 |
| Total | 1000 | 3904 |
| Protein | 20 | 20.8 |
| Carbohydrate | 66 | 67.7 |
| Fat | 5 | 11.5 |
| Total | 100 |
| Raw Material | Functional Ingredients | Content (%) |
|---|---|---|
| Fish oil ① | DHA/EPA | 52.1%/13.8% |
| Fish oil ② | DHA/EPA | 60.5%/7.56% |
| Choline bitartrate | Choline | 47.40% |
| Groups | Feeding Dose a |
|---|---|
| Control | 0.5% carboxymethyl starch solution |
| Fish oil | 0.415 g/kg |
| Choline | 0.14 g/kg |
| Fish oil and choline | 0.555 g/kg |
| Gene | Sequence (5′ to 3′) |
|---|---|
| MFSD2A | (F) AGAAGCAGCAACTGTCCATTT |
| (R) CTCGGCCCACAAAAAGGATAAT | |
| FATP1 | (F) CGCTTTCTGCGTATCGTCTG |
| (R) GATGCACGGGATCGTGTCT | |
| FABP5 | (F) TGAAAGAGCTAGGAGTAGGACTG |
| (R) CTCTCGGTTTTGACCGTGATG | |
| Syntaxin3 | (F) CTTGATGTACCGGACGCATTC |
| (R) ACACTGTCACAATCTGCTCAG | |
| SNAP-25 | (F) CAACTGGAACGCATTGAGGAA |
| (R) GGCCACTACTCCATCCTGATTAT | |
| β-actin | (F) GGCTGTATTCCCCTCCATCG |
| (R) CCAGTTGGTAACAATGCCATGT |
| Groups | Train (s) | Test (s) | ||
|---|---|---|---|---|
| Total Time | Total Number of Errors | Time | Number of Errors in 2 Min | |
| Control | 335.70 ± 118.03 a | 24.20 ± 5.69 b | 84.30 ± 38.49 a | 6.10 ± 3.22 b |
| Fish oil | 301.46 ± 77.91 a | 20.33 ± 4.09 b | 77.10 ± 40.15 a | 3.70 ± 2.26 a |
| Choline | 300.55 ± 85.95 a | 20.78 ± 4.66 b | 82.33 ± 41.72 a | 3.00 ± 1.22 a |
| Fish oil and choline | 296.45 ± 60.44 a | 15.14 ± 3.76 a | 70.11 ± 40.56 a | 2.63 ± 2.13 a |
| Groups | Train (s) | Test (s) | ||||
|---|---|---|---|---|---|---|
| Latency | Number of Errors | Latency | Number of Errors | Latency | Number of Errors | |
| Control | 165.35 ± 74.76 a | 1.50 ± 0.71 a | 141.57 ± 81.48 ab | 1.80 ± 0.92 a | 160.26 ± 70.37 a | 3.10 ± 0.32 b |
| Fish oil | 75.80 ± 84.31 a | 2.00 ± 0.81 a | 193.24 ± 101.79 ab | 1.60 ± 0.70 a | 218.88 ± 95.78 a | 1.90 ± 1.67 a |
| Choline | 115.94 ± 83.14 a | 1.78 ± 0.67 a | 107.92 ± 109.0 a | 1.67 ± 0.50 a | 174.40 ± 102.44 a | 2.44 ± 1.42 a |
| Fish oil and choline | 85.34 ± 62.13 a | 1.89 ± 0.60 a | 232.34 ± 86.72 b | 0.89 ± 0.60 b | 208.97 ± 104.96 a | 1.67 ± 1.58 a |
Disclaimer/Publisher’s Note: The statements, opinions and data contained in all publications are solely those of the individual author(s) and contributor(s) and not of MDPI and/or the editor(s). MDPI and/or the editor(s) disclaim responsibility for any injury to people or property resulting from any ideas, methods, instructions or products referred to in the content. |
© 2023 by the authors. Licensee MDPI, Basel, Switzerland. This article is an open access article distributed under the terms and conditions of the Creative Commons Attribution (CC BY) license (https://creativecommons.org/licenses/by/4.0/).
Share and Cite
Li, J.; Jian, Y.; Liu, R.; Zhao, X.; Mao, J.; Wei, W.; Jiang, C.; Zhang, L.; Wang, Y.; Zhou, P. Choline and Fish Oil Can Improve Memory of Mice through Increasing Brain DHA Level. Foods 2023, 12, 1799. https://doi.org/10.3390/foods12091799
Li J, Jian Y, Liu R, Zhao X, Mao J, Wei W, Jiang C, Zhang L, Wang Y, Zhou P. Choline and Fish Oil Can Improve Memory of Mice through Increasing Brain DHA Level. Foods. 2023; 12(9):1799. https://doi.org/10.3390/foods12091799
Chicago/Turabian StyleLi, Jin, Yaqiong Jian, Ruonan Liu, Xianfeng Zhao, Jiangyi Mao, Wei Wei, Chenyu Jiang, Lina Zhang, Yi Wang, and Peng Zhou. 2023. "Choline and Fish Oil Can Improve Memory of Mice through Increasing Brain DHA Level" Foods 12, no. 9: 1799. https://doi.org/10.3390/foods12091799
APA StyleLi, J., Jian, Y., Liu, R., Zhao, X., Mao, J., Wei, W., Jiang, C., Zhang, L., Wang, Y., & Zhou, P. (2023). Choline and Fish Oil Can Improve Memory of Mice through Increasing Brain DHA Level. Foods, 12(9), 1799. https://doi.org/10.3390/foods12091799