
Leafy Vegetable Nitrite and Nitrate Content: Potential Health Effects

 , ,
, ,
Abstract
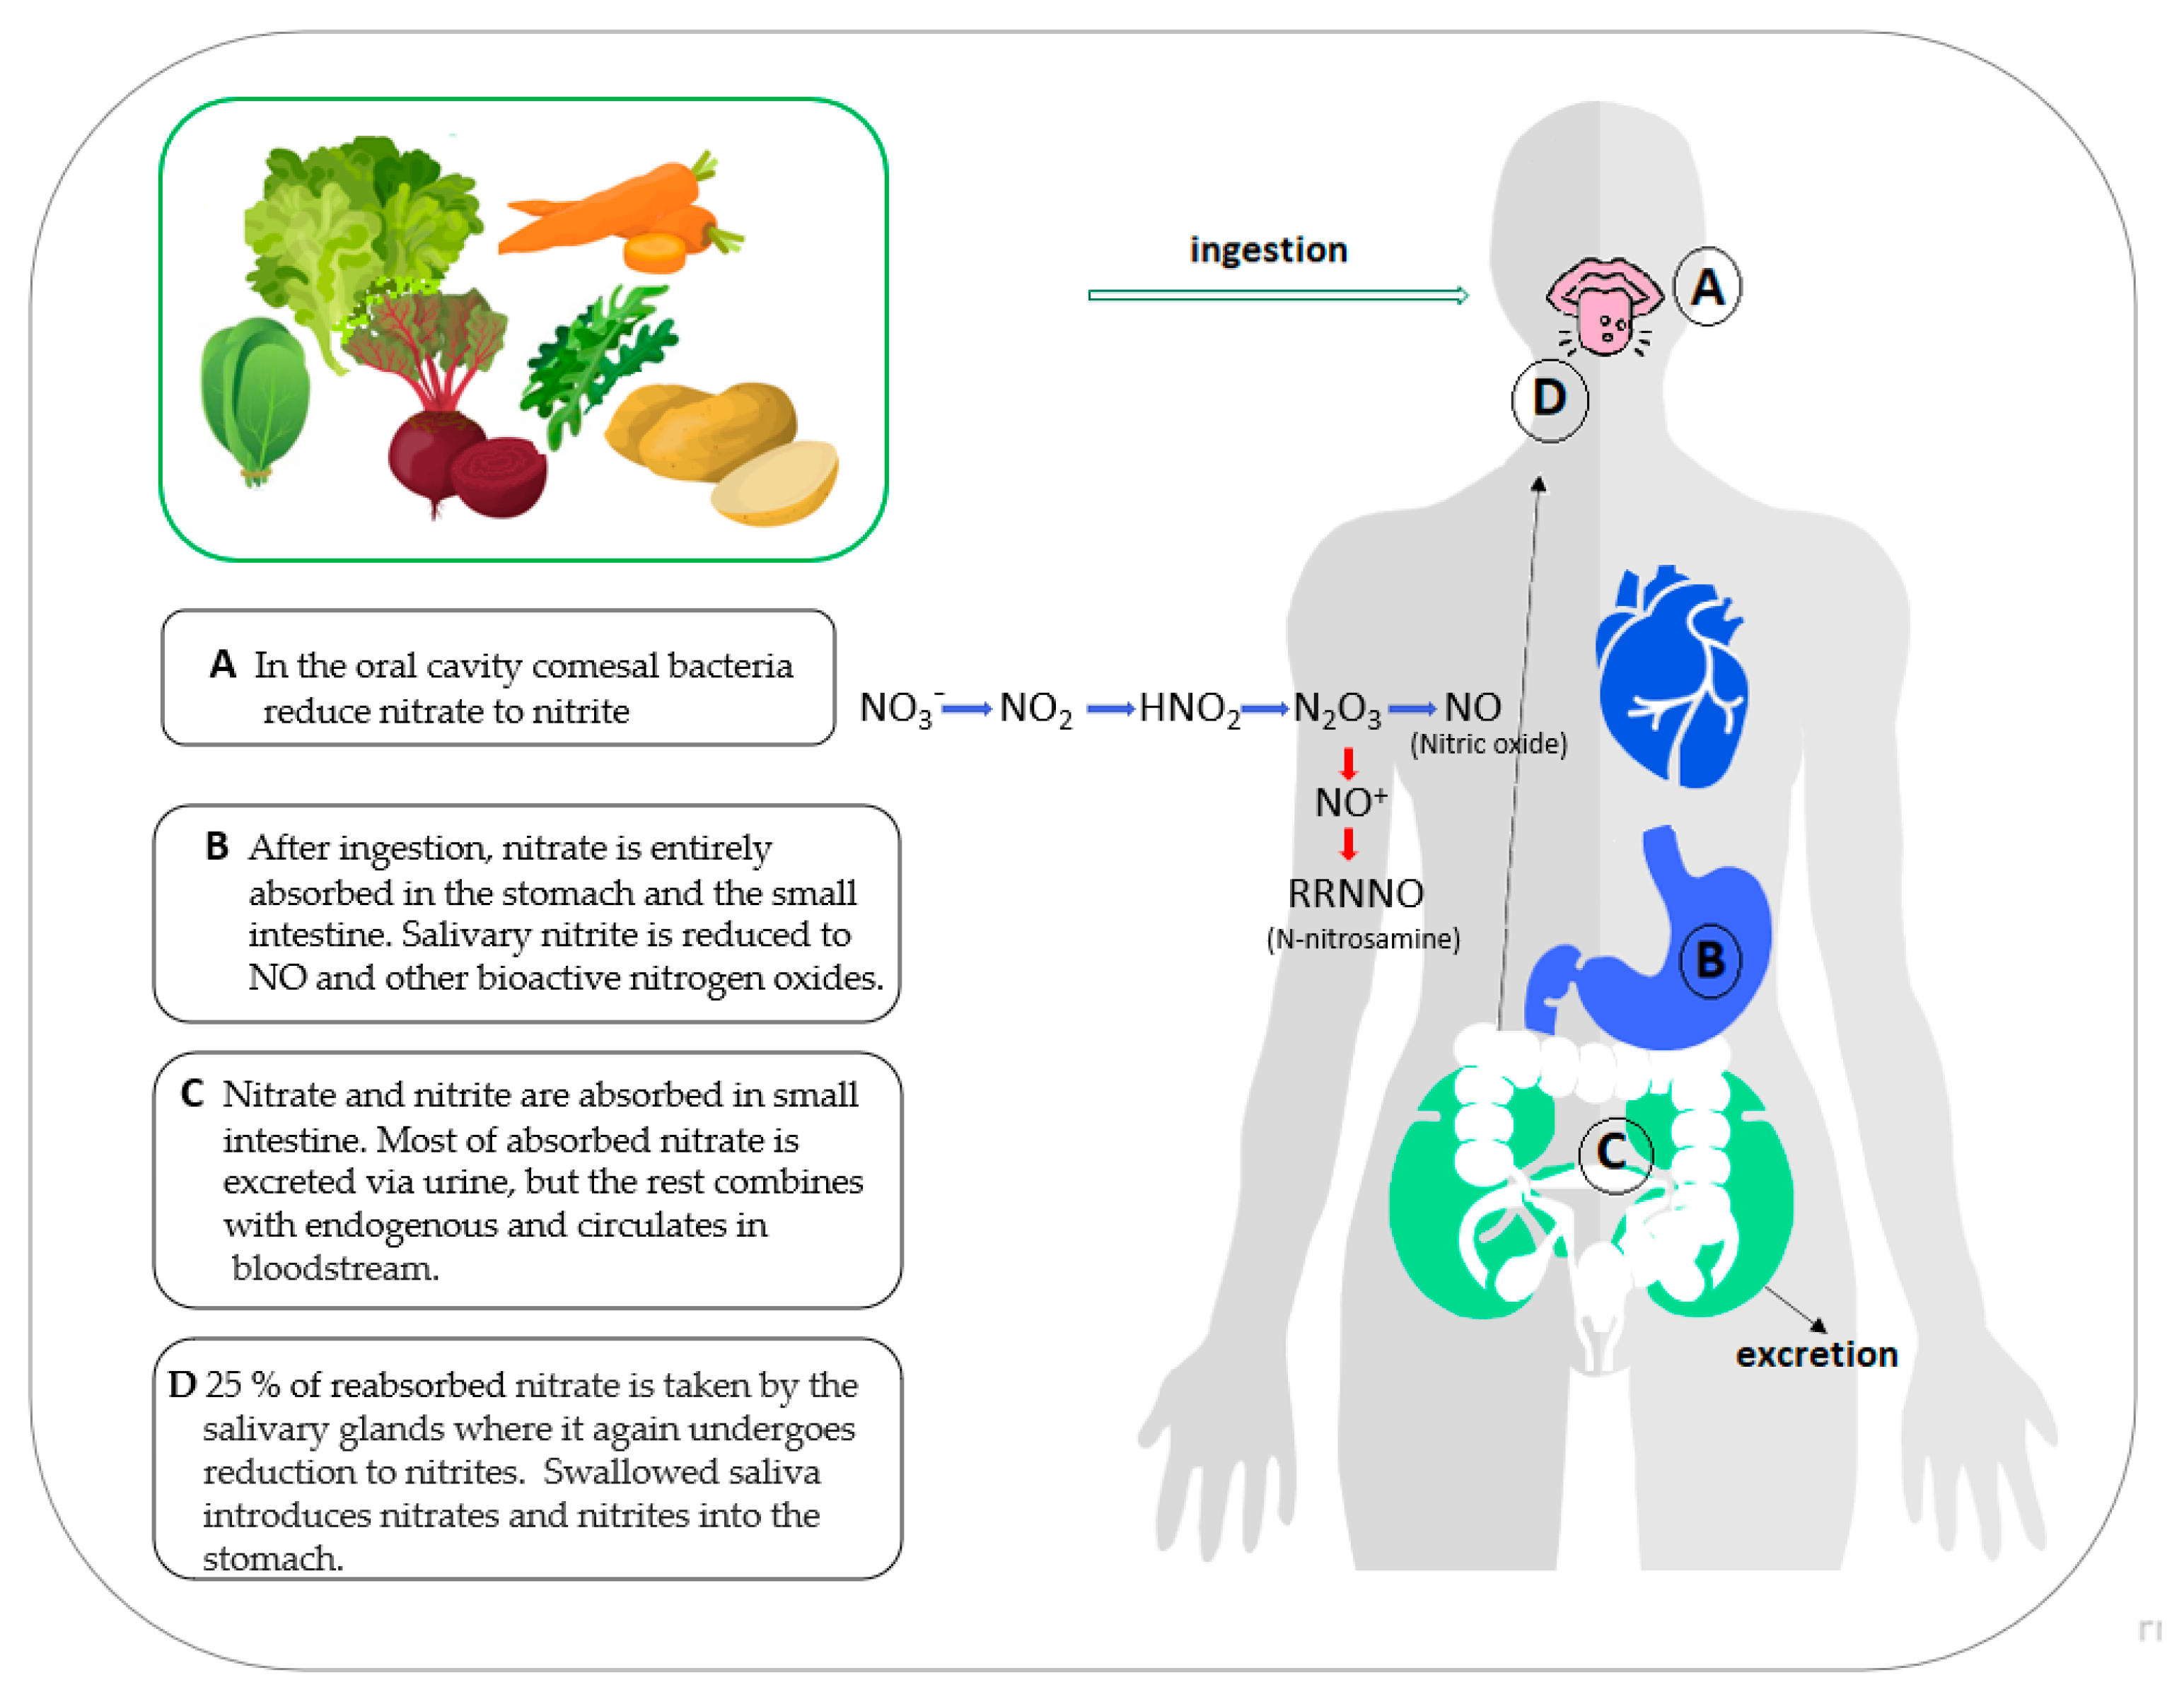
1. Introduction
2. Materials and Methods
2.1. Samples
2.2. Chemicals and Working Standard Solutions
2.3. Sample Preparation
2.4. Method
2.5. Statistical Analysis
3. Results and Discussion
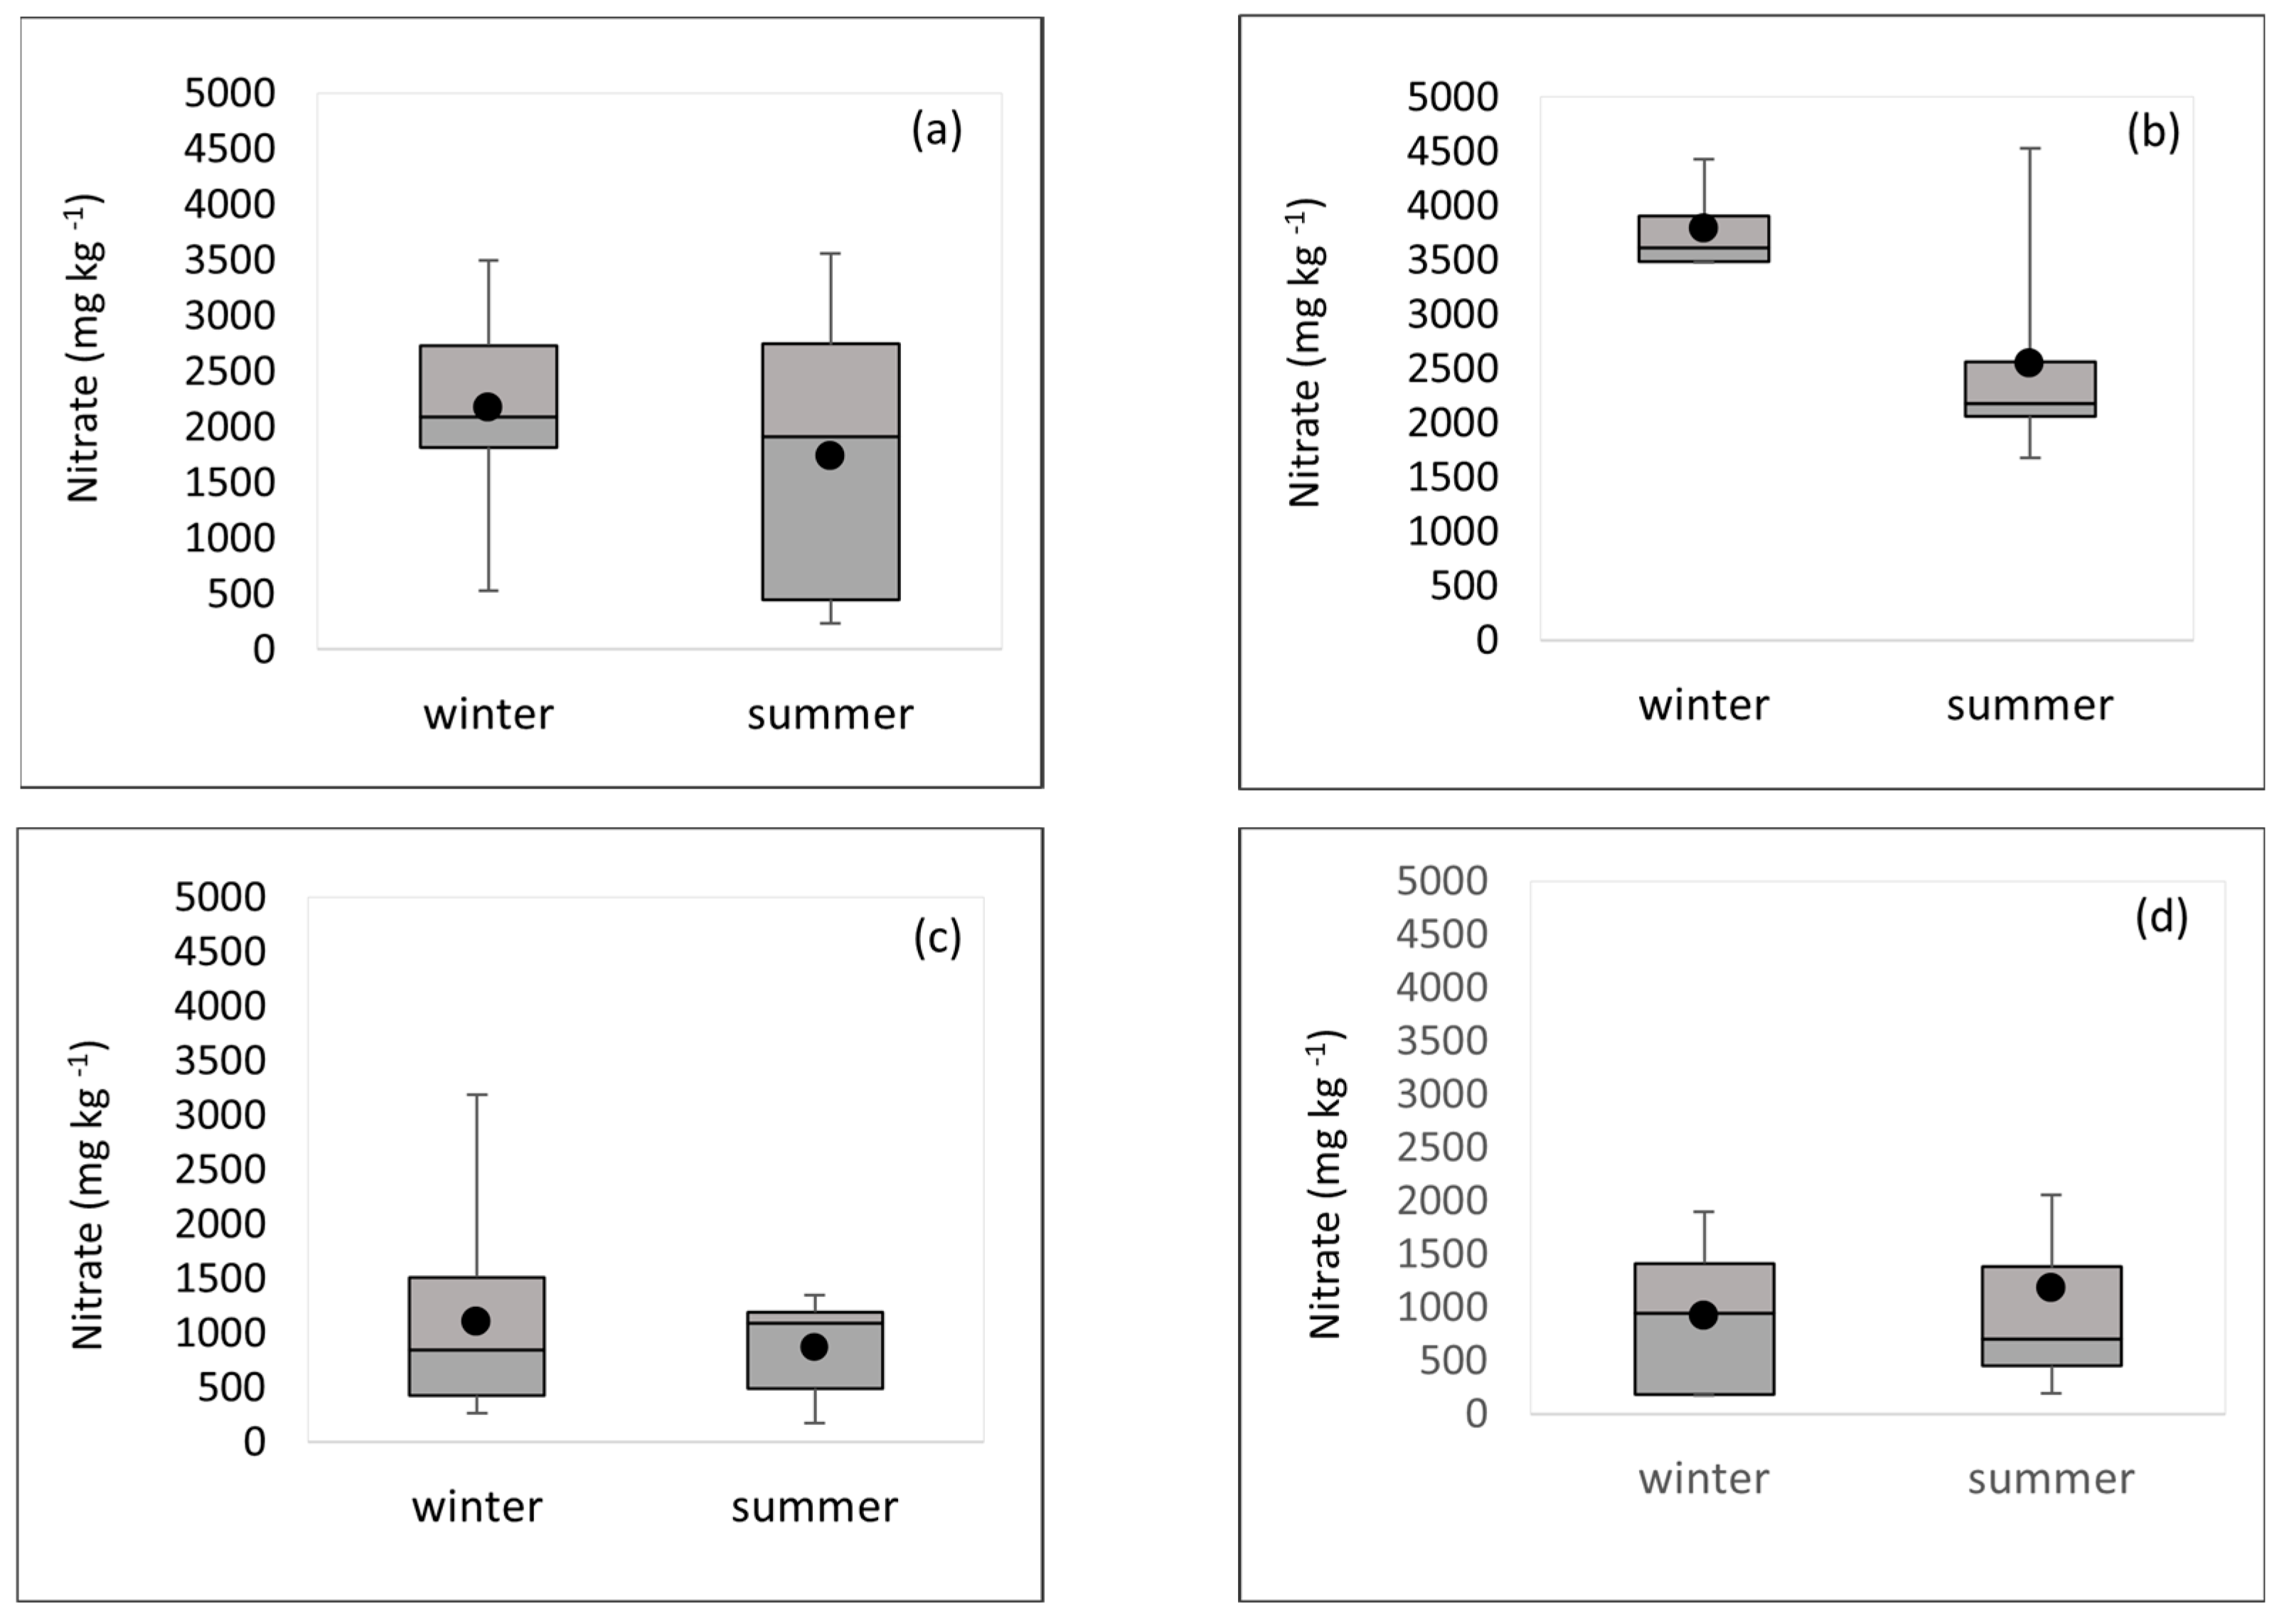
3.1. Nitrate Results
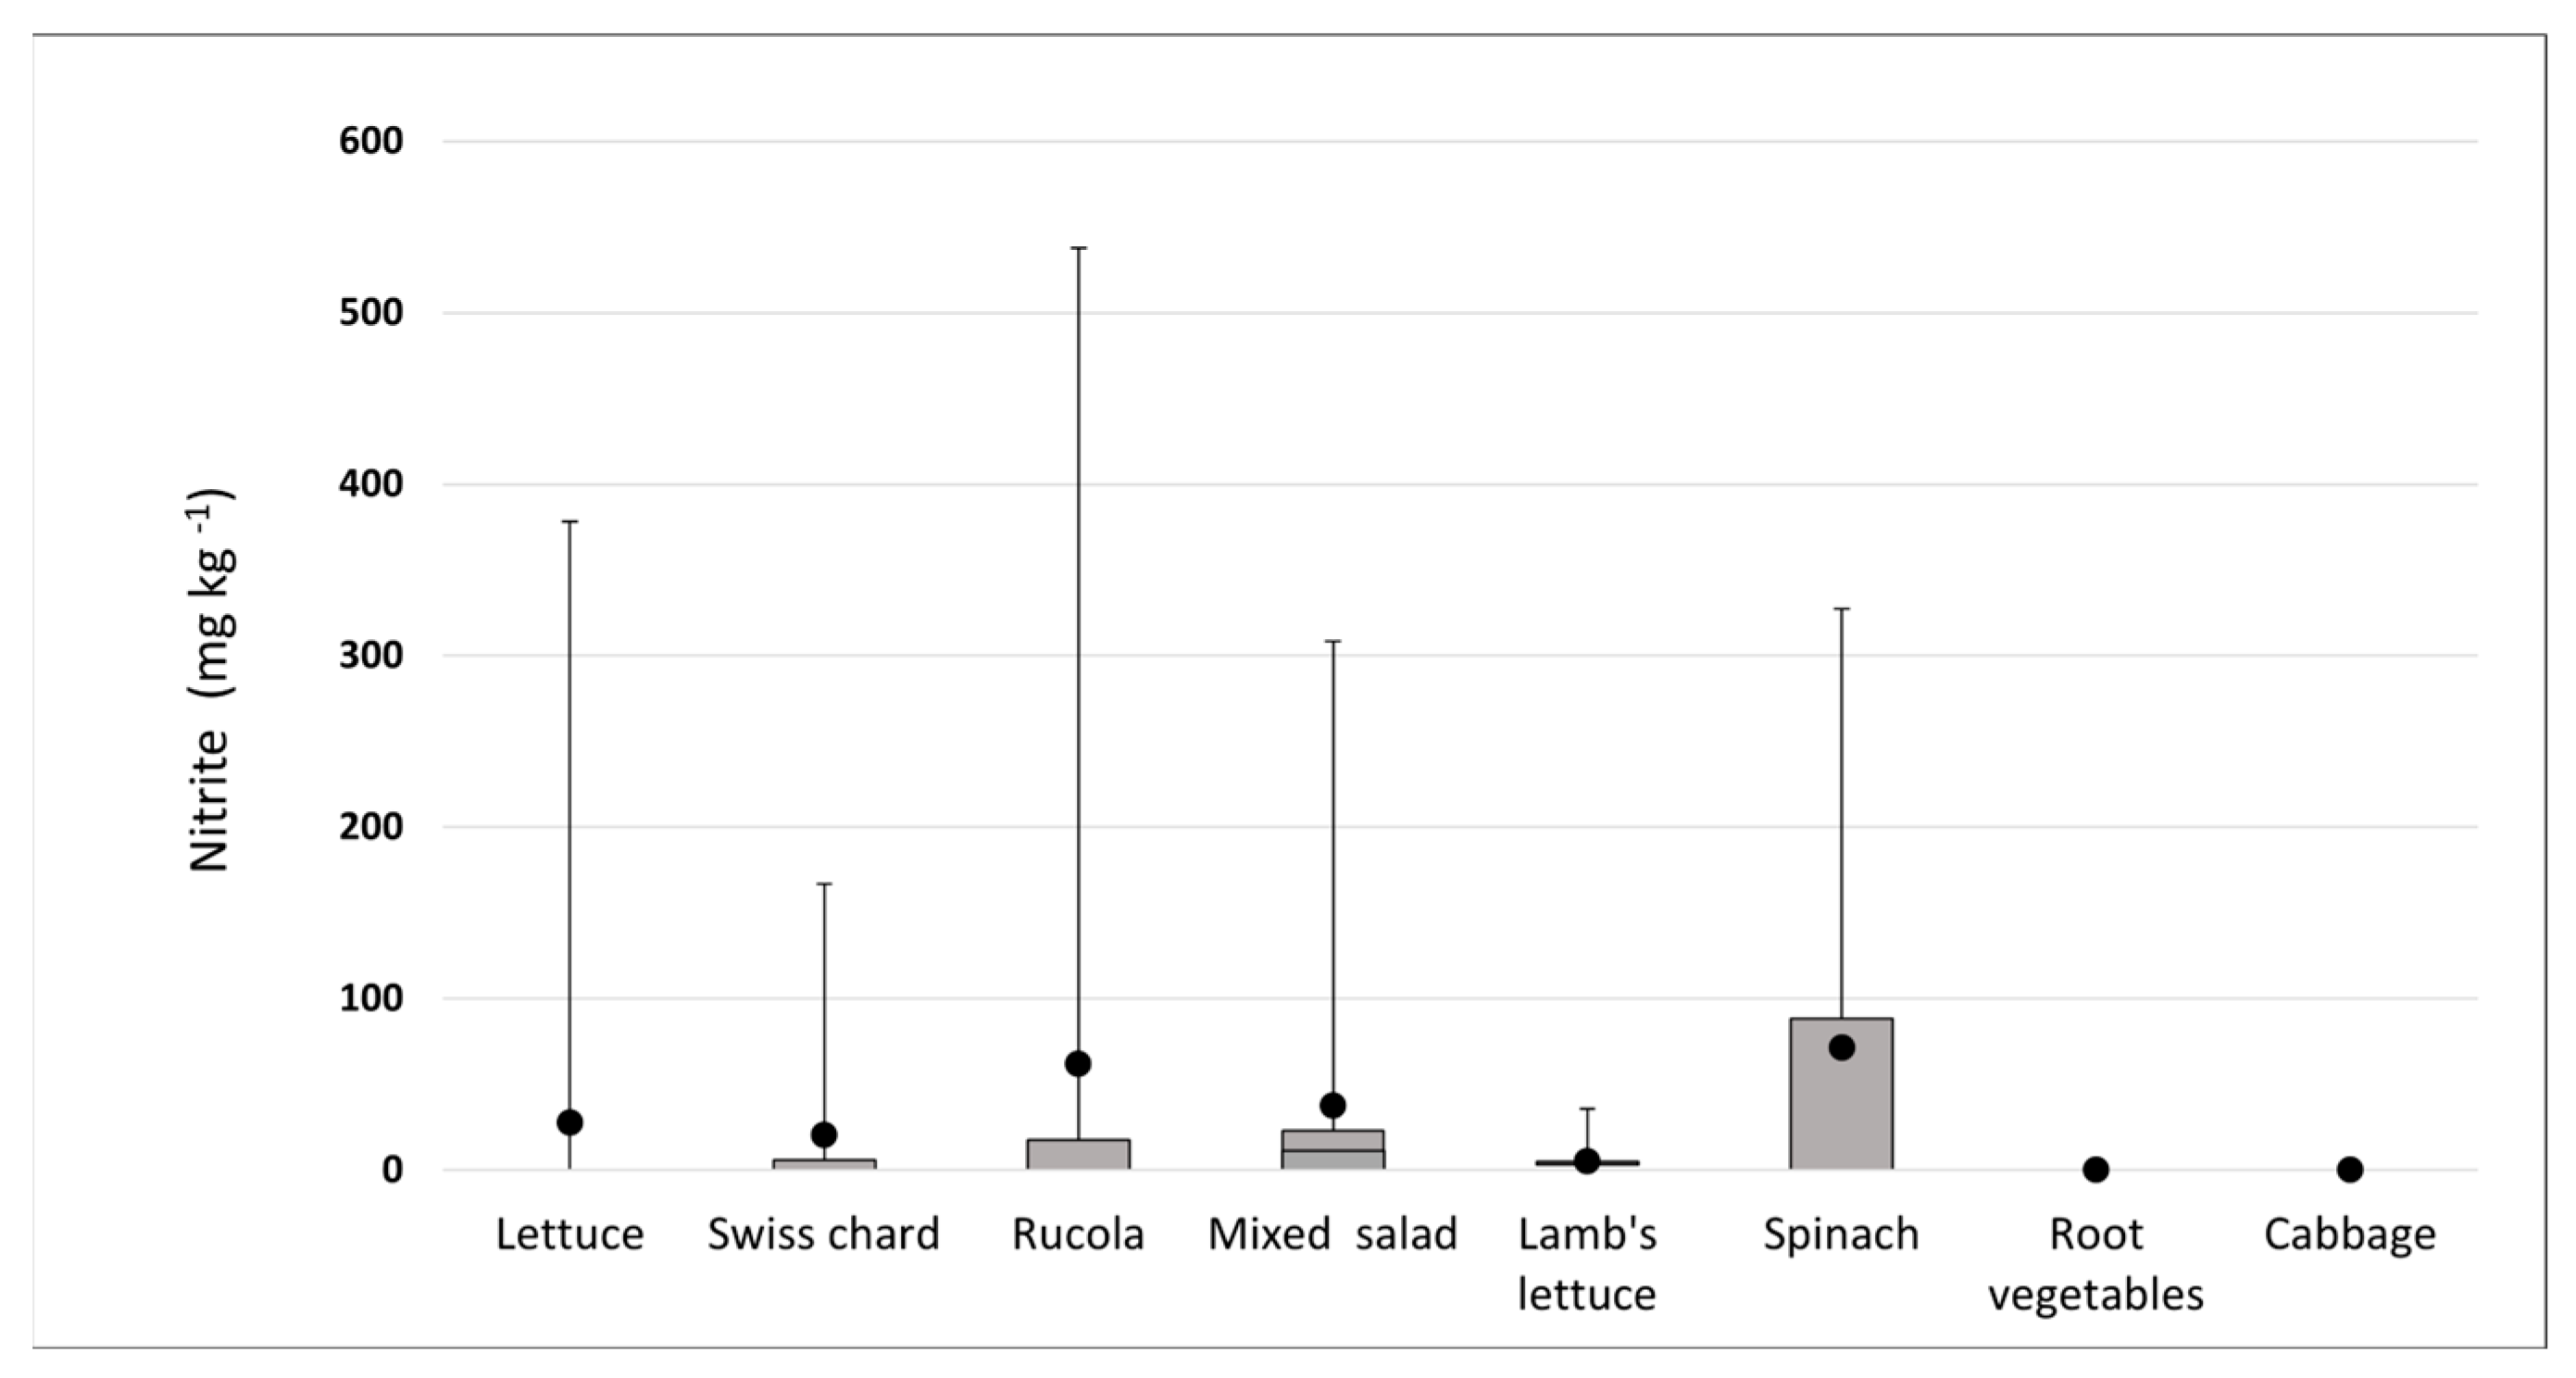
3.2. Nitrite Results
4. Conclusions
Author Contributions
Funding
Data Availability Statement
Acknowledgments
Conflicts of Interest
References
- Pennington, J.A.T.; Fisher, R.A. Food component profiles for fruit and vegetable subgroups. J. Food Compost. Anal. 2010, 23, 411–418. [Google Scholar] [CrossRef]
- Septembre-Malaterre, A.; Remize, R.; Poucheret, P. Fruits and vegetables, as a source of nutritional compounds and phytochemicals: Changes in bioactive compounds during lactic fermentation. Food Res. Int. 2018, 104, 86–99. [Google Scholar] [CrossRef] [PubMed]
- Nöthlings, U.; Schulze, M.B.; Weikert, C.; Boeing, H.; van der Schouw, I.T.; Bamia, C.; Benetou, V.; Lagiou, P.; Krogh, V.; Beulens, J.W.J.; et al. Intake of Vegetables, Legumes, and Fruit, and Risk for All-Cause, Cardiovascular, and Cancer Mortality in a European Diabetic Population. J. Nutr. 2008, 138, 775–781. [Google Scholar] [CrossRef] [PubMed]
- Tuttolomondo, A.; Casuccio, A.; Buttà, C.; Pecoraro, R.; Di Raimondo, D.; Della Corte, V.; Arnao, V.; Clemente, G.; Maida, C.; Simonetta, I.; et al. Mediterranean Diet in patients with acute ischemic stroke: Relationships between Mediterranean Diet score, diagnostic subtype, and stroke severity index. Atherosclerosis 2015, 243, 260–267. [Google Scholar] [CrossRef] [PubMed]
- Conversa, G.; Elia, A. Growth, Critical N Concentration and Crop N Demand in Butterhead and Crisphead Lettuce Grown under Mediterranean Conditions. Agronomy 2019, 9, 681. [Google Scholar] [CrossRef]
- Bai, X.; Jiang, Y.; Miao, H.; Xue, S.; Chen, Z.; Zhou, J. Intensive vegetable production results in high nitrate accumulation in deep soil profiles in China. Environ. Pollut. 2021, 287, 117598. [Google Scholar] [CrossRef] [PubMed]
- Hirel, B.; Tétu, T.; Lea, P.J.; Dubois, F. Improving Nitrogen Use Efficiency in Crops for Sustainable Agriculture. Sustainability 2011, 3, 1452–1485. [Google Scholar] [CrossRef]
- Andrews, M. The partitioning of nitrate assimilation between root and shoot of higher plants. Plant Cell Environ. 1998, 9, 511–519. [Google Scholar]
- Noguero, M.; Lacombe, B. Transporters Involved in Root Nitrate Uptake and Sensing by Arabidopsis. Front. Plant Sci. 2016, 7, 1391. [Google Scholar] [CrossRef]
- Santamaria, P. Nitrate in vegetables: Toxicity, content, intake and EC regulation. J. Sci. Food Agric. 2006, 86, 10–17. [Google Scholar] [CrossRef]
- Lundberg, J.O.; Weitzberg, E.; Cole, J.A.; Benjamin, N. Nitrate, bacteria and human health. Nat. Rev. Microbiol. 2004, 2, 594. [Google Scholar] [CrossRef]
- van Velzena, A.G.; Sipsb, A.J.A.M.; Schothorst, R.C.; Lambersa, A.C.; Meulenbelt, J. The oral bioavailability of nitrate from nitrate-rich vegetables in humans. Toxicol. Lett. 2008, 181, 171–181. [Google Scholar] [CrossRef] [PubMed]
- Stephan, B.C.M.; Harrison, S.L.; Keage, H.A.D.; Babateen, A.; Robinson, L.; Siervo, M. Cardiovascular Disease, the Nitric Oxide Pathway and Risk of Cognitive Impairment and Dementia. Curr. Cardiol. Rep. 2017, 19, 87. [Google Scholar] [CrossRef] [PubMed]
- Ma, L.; Hu, L.; Feng, X.; Wang, S. Nitrate and Nitrite in Health and Disease. Aging Dis. 2018, 9, 938–945. [Google Scholar] [CrossRef] [PubMed]
- Mirmiran, P.; Bahadoran, Z.; Ghasemi, A.; Azizi, F. The Association of Dietary L-Arginine Intake and Serum Nitric Oxide Metabolites in Adults: A Population-Based Study. Nutrients 2016, 8, 311. [Google Scholar] [CrossRef]
- Wells, B.J.; Mainous, A.G., III; Everett, C. Association between dietary arginine and C-reactive protein. Nutrition 2005, 21, 125–130. [Google Scholar] [CrossRef]
- Bondonno, C.P.; Croft, K.D.; Hodgson, J.M. Dietary nitrate, nitric oxide and cardiovascular health. Crit. Rev. Food Sci. Nutr. 2016, 56, 2036–2052. [Google Scholar] [CrossRef]
- Bondonno, C.P.; Dalgaard, F.; Blekkenhorst, L.C.; Murray, K.; Lewis, J.R.; Croft, K.D.; Kyrø, C.; Torp-Pedersen, C.; Gislason, G.; Tjønneland, A.; et al. Vegetable nitrate intake, blood pressure and incident cardiovascular disease: Danish Diet, Cancer, and Health Study. Eur. J. Epidemiol. 2021, 36, 813–825. [Google Scholar] [CrossRef]
- Weitzberg, E.; Lundberg, J.O. Novel Aspects of Dietary Nitrate and Human Health. Annu. Rev. Nutr. 2013, 33, 129–159. [Google Scholar] [CrossRef]
- Working Group on the Evaluation of Carcinogenic Risks to Humans. Ingested Nitrate and Nitrite, and Cyanobacterial. Peptide Toxins. In IARC Monographs on the Evaluation of Carcinogenic Risks to Humans; International Agency for Research on Cancer: Lyon, France, 2010; Volume 94, p. 448. [Google Scholar]
- European Food Safety Authority. Opinion of the Scientific Panel on Contaminants in the Food chain on a request from the European Commission to perform a scientific risk assessment on nitrate in vegetables. EFSA J. 2008, 689, 1–79. [Google Scholar] [CrossRef]
- FAO. Fruit and Vegetables—Your Dietary Essentials. The International Year of Fruits and Vegetables; 2021 Backgroundpaper; FAO: Rome, Italy, 2020. [Google Scholar] [CrossRef]
- Leenders, M.; Sluijs, I.; Ros, M.M.; Boshuizen, H.C.; Siersema, P.D.; Ferrari, P.; Weikert, C.; Tjønneland, A.; Olsen, A.; Boutron-Ruault, M.C.; et al. Fruit and Vegetable Consumption and Mortality. Am. J. Epidemiol. 2013, 178, 590–602. [Google Scholar] [CrossRef]
- Boffetta, P.; Couto, E.; Wichmann, J.; Ferrari, P.; Trichopoulos, D.; Bas Bueno-de-Mesquita, H.; van Duijnhoven, F.J.B.; Büchner, F.L.; Key, T.; Boeing, H.; et al. Fruit and Vegetable Intake and Overall Cancer Risk in the European Prospective Investigation Into Cancer and Nutrition (EPIC). J. Natl. Cancer Inst. 2010, 102, 529–537. [Google Scholar] [CrossRef]
- European Commission. Reports of the Scientific Committee for Food (Thirty-Eighth Series)—Opinions of the Scientific Committee for Food on: Nitrates and Nitrite; European Commission Directorate-General Industry: Brussels, Belgium, 1997; Available online: https://ec.europa.eu/food/system/files/2020-12/sci-com_scf_reports_38.pdf (accessed on 28 February 2023).
- European Food Safety Authority. Scientific Opinion on the re-evaluation of sodium nitrate (E 251) and potassium nitrate (E252) as food additives. EFSA J. 2017, 15, 4787. [Google Scholar] [CrossRef]
- European Commission. Commission Regulation (EU) No 1258/2011 of 2 December 2011 amending Regulation (EC) No 1881/2006 as regards maximum levels for nitrates in foodstuffs. Off. J. Eur. Union 2011, L320, 15–17. [Google Scholar]
- EUROSTAT. Online Publications: Agriculture Statistical Publications. 2023. Available online: https://ec.europa.eu/eurostat/statistics-explained/index.php?title=Online_publications (accessed on 26 March 2023).
- Gugić, J. Production and consumption of fertilizers in Croatia. Agroecon. Croat. 2014, 1, 32–39. [Google Scholar]
- Brkić, D.; Bošnir, J.; Bevardi, M.; Bošković, A.G.; Miloš, S.; Lasić, D.; Krivohlavek, A.; Racz, A.; Ćuić, A.M.; Trstenjak, N.U. Nitrate in leafy green vegetables and estimated intake. Afr. J. Tradit. Complem. 2017, 14, 31–41. [Google Scholar] [CrossRef]
- Najdenkoska, A. Development of HPLC method for analysis of nitrite and nitrate in vegetable. JAFES 2016, 67, 33–39. [Google Scholar]
- Iammarino, M.; Di Taranto, A.; Cristino, M. Monitoring of nitrites and nitrates levels in leafy vegetables (spinach and lettuce):A contribution to risk assessment. J. Sci. Food Agric. 2014, 94, 773–778. [Google Scholar] [CrossRef]
- Iammarino, M.; Berardi, G.; Vita, V.; Elia, A.; Conversa, G. Determination of Nitrate and Nitrite in Swiss Chard (Beta vulgaris L. subsp. vulgaris) and Wild Rocket (Diplotaxis tenuifolia (L.) DC.) and Food Safety Evaluations. Foods 2022, 11, 2571. [Google Scholar] [CrossRef]
- De Martin, S.; Restani, P. Determination of nitrates by a novel ion chromatographic method: Occurrence in leafy vegetables (organic and conventional) and exposure assessment for Italian consumers. Food Addit. Contam. 2003, 20, 787–792. [Google Scholar] [CrossRef]
- Sušin, J.; Kmecl, V.; Gregorčić, A. A survey of nitrate and nitrite content of fruit and vegetables grown in Slovenia during 1996–2002. Food Addit. Contam. 2006, 23, 385–390. [Google Scholar] [CrossRef] [PubMed]
- Kmecl, V.; Knap, T.; Žnidarčič, D. Evaluation of the nitrate and nitrite content of vegetables commonly grown in Slovenia. Ital. J. Agron. 2017, 12, 79–84. [Google Scholar] [CrossRef]
- University of Zagreb, Faculty of Agriculture. The Impact of Agriculture on the Pollution of Surface and Groundwater in Croatia. 2014, pp. 63–68. Available online: https://voda.hr/sites/default/files/2021-10/utjecaj_poljoprivrede_na_oneciscenje_povrsinskih_i_podzemnih_voda_u_republici_hrvatskoj.pdf (accessed on 27 March 2023).
- Santamaria, P.; Elia, A.; Serio, F.; Todaro, E. A survey of nitrate and oxalate content in retail fresh vegetables. J. Sci. Food Agric. 1999, 79, 1882–1888. [Google Scholar] [CrossRef]
- Missoni, S. Nutritional Habits of Croatian Island Populations—Recent Insights. Coll. Antropol. 2012, 36, 1139–1142. [Google Scholar]
- Sahay, R.D.; Couch, S.C.; Missoni, S.; Sujoldžić, A.; Novokmet, N.; Duraković, Z.; Rao, M.B.; Musić Milanović, S.; Vuletić, S.; Deka, R.; et al. Dietary Patterns in Adults from an Adriatic Island of Croatia and Their Associations with Metabolic Syndrome and Its Components. Coll. Antropol. 2013, 37, 335–342. [Google Scholar]
- Menard, C.; Heraud, F.; Volatier, J.L.; Leblanc, J.C. Assessment of dietary exposure of nitrate and nitrite in France. Food Addit. Contam. Part A 2008, 25, 971–988. [Google Scholar] [CrossRef]
- Wu, S.; Liu, Y.; Cui, X.; Zhang, Q.; Wang, Y.; Cao, L.; Luo, X.; Xiong, J.; Ruan, R. Assessment of Potential Nitrite Safety Risk of Leafy Vegetables after Domestic Cooking. Foods 2021, 10, 2953. [Google Scholar] [CrossRef]
- Salehzadeh, H.; Maleki, A.; Rezaee, R.; Shahmoradi, B.; Ponnet, K. The nitrate content of fresh and cooked vegetables and their health-related risks. PLoS ONE 2020, 15, e0227551. [Google Scholar] [CrossRef]
- Dias, J.S. Nutritional Quality and Effect on Disease Prevention of Vegetables. Food Nutr. Sci. 2019, 10, 369–402. [Google Scholar] [CrossRef]
- Kyriacou, M.C.; Soteriou, G.A.; Colla, G.; Rouphael, Y. The occurrence of nitrate and nitrite in Mediterranean fresh salad and its modulation by preharvest practices and postharvest conditions. Food Chem. 2019, 285, 468–477. [Google Scholar] [CrossRef]
- European Food Safety Authority. Statement on possible public health risks for infants and young children from the presence of nitrates in leafy vegetables. EFSA J. 2010, 8, 1935. [Google Scholar] [CrossRef]
- Gutierrez, A.J.; Rubio, C.; Caballero, J.M.; Hardisson, A. Nitrites. In Encyclopedia of Toxicology, 3rd ed.; Wexler, P., Ed.; Elsevier: Amsterdam, The Netherlands, 2014; pp. 532–535. ISBN 978-0-12-386455-0. [Google Scholar]
- Habermeyer, M.; Roth, A.; Guth, S.; Diel, P.; Engel, K.H.; Epe, B.; Fürst, P.; Heinz, V.; Humpf, H.U.; Joost, H.G.; et al. Nitrate and nitrite in the diet: How to assess their benefit and risk for human health. Mol. Nutr. Food Res. 2014, 59, 106–128. [Google Scholar] [CrossRef] [PubMed]
- Srour, B.; Chazelas, E.; Druesne-Pecollo, N.; Esseddik, V.; Szabo de Edelenyi, F.; Agaesse, C.; De Sa, A.; Lutchia, R.; Debras, C.; Sellem, L.; et al. Dietary exposure to nitrites and nitrates in association with type 2 diabetes risk: Results from the NutriNet-Sante´ population-based cohort study. PLoS Med. 2023, 20, e1004149. [Google Scholar] [CrossRef] [PubMed]
- Seyyedsalehi, M.S.; Mohebbi, E.; Tourang, F.; Sasanfar, B.; Boffetta, P.; Zendehdel, K. Association of Dietary Nitrate Nitrite, and N-Nitroso Compounds Intake and Gastrointestinal Cancers: A Systematic Review and Meta-Analysis. Toxics 2023, 11, 190. [Google Scholar] [CrossRef] [PubMed]


 ); minimum (
 ); and interquartile range (with median (□).
); minimum (); and interquartile range (with median (□).
); and interquartile range (with median (□).
); minimum (); and interquartile range (with median (□).

 ); minimum (
 ); and interquartile range with median (□).
); minimum (); and interquartile range with median (□).
); and interquartile range with median (□).
); minimum (); and interquartile range with median (□).

| Sample | No. of Samples | Mean ± SD (mg kg−1) | Median (mg kg−1) | Concentration Range (mg kg−1) | Maximum Levels (mg kg−1) (Regulation 1258/2011) | |
|---|---|---|---|---|---|---|
| Harvested 1.10.–30.3. | Harvested 1.04.–30.9. | |||||
| Lettuce | 21 | 1035.3 ± 732.6 | 1020.1 | 169.7–3184.2 | 5000 (UC) 4000 (OA) | 4000 (UC) 3000 (OA) |
| Swiss chard | 17 | 1913.6 ± 1126.6 | 2055.4 | 233.4–3558.4 | - | |
| Rucola | 10 | 3041.4 ± 974.7 | 3073.2 | 1674.8–4526.3 | 7000 | 6000 |
| Mixed salad | 11 | 548.0 ± 269.1 | 199.2 | 54.6–952.6 | - | |
| Lamb’s lettuce | 7 | 1086.5 ± 703.5 | 1273.8 | 36.1–2175.5 | - | |
| Spinach | 8 | 1056.5 ± 742.0 | 976.8 | 168.5–2350.9 | 3500 | |
| Root vegetables | 15 | 178.8 ± 396.4 | 32.2 | <LOQ–1534.8 | - | |
| Cabbage | 7 | 533.6 ± 406.0 | 484.1 | 13.5–1040.1 | - | |
| Total | 96 | |||||
| Sample | Number of Samples | Mean ± SD (mg kg−1) | Median (mg kg−1) | Concentration Range (mg kg−1) | Concentration Range in Samples > LOQ (mg kg−1) |
|---|---|---|---|---|---|
| Lettuce | 21 | 27.7 ± 81.9 | 0.0 | <LOQ—378.1 | 21.1–378.1 |
| Swiss chard | 17 | 20.7 ± 43.0 | 0.0 | <LOQ—167.0 | 4.1–167.0 |
| Rucola | 10 | 61.9 ± 159.6 | 0.0 | <LOQ—537.9 | 2.7–537.9 |
| Mixed salad | 11 | 37.5 ± 86.5 | 11.3 | <LOQ—308.6 | 11.3–308.6 |
| Lamb’s lettuce | 7 | 5.1 ± 11.2 | 0.0 | <LOQ—32.5 | 3.3–32.5 |
| Spinach | 8 | 71.6 ± 115.0 | 0.0 | <LOQ—327.1 | 53.6–327.1 |
| Root vegetables | 15 | 0.0 | 0.0 | <LOQ | 0 |
| Cabbage | 7 | 0.0 | 0.0 | <LOQ | 0 |
| Total | 96 |
| No. of Samples with NO2 above the LOQ | % | Samples with Nitrite Concentrations above the LOQ (1 mg kg−1) | ||||||||
|---|---|---|---|---|---|---|---|---|---|---|
| mg kg−1 | 1 | 2 | 3 | 4 | 5 | 6 | 7 | |||
| Lettuce | 5 | 23.8 | nitrate nitrite | 764.0 | 262 | 747.7 | 1157.6 | 3184.2 | ||
| 98.9 | 55.9 | 378.1 | 28.4 | 21.1 | ||||||
| Swiss chard | 7 | 41.2 | nitrate | 2408.3 | 3055.9 | 242.4 | 233.4 | 2661.3 | 3558.4 | 1571.0 |
| nitrite | 30.4 | 57.6 | 167.0 | 6.1 | 80.4 | 5.8 | 4.1 | |||
| Rucola | 4 | 40.0 | nitrate | 4427.6 | 2046.6 | 2262.4 | 4526.3 | |||
| nitrite | 22.9 | 55.2 | 537.9 | 2.7 | ||||||
| Mixed salads | 6 | 54.5 | nitrate | 653.8 | 952.6 | 54.6 | 577.9 | 908.2 | 882.3 | |
| nitrite | 31.6 | 14.7 | 308.6 | 11.3 | 16.6 | 29.3 | ||||
| Lamb’s lettuce | 2 | 28.6 | nitrate | 1647.6 | 1382.9 | |||||
| nitrite | 3.3 | 32.5 | ||||||||
| Spinach | 3 | 37.5 | nitrate | 2350.9 | 489.8 | 1006.2 | ||||
| nitrite | 192.0 | 327.1 | 53.6 | |||||||
Disclaimer/Publisher’s Note: The statements, opinions and data contained in all publications are solely those of the individual author(s) and contributor(s) and not of MDPI and/or the editor(s). MDPI and/or the editor(s) disclaim responsibility for any injury to people or property resulting from any ideas, methods, instructions or products referred to in the content. |
© 2023 by the authors. Licensee MDPI, Basel, Switzerland. This article is an open access article distributed under the terms and conditions of the Creative Commons Attribution (CC BY) license (https://creativecommons.org/licenses/by/4.0/).
Share and Cite
Luetic, S.; Knezovic, Z.; Jurcic, K.; Majic, Z.; Tripkovic, K.; Sutlovic, D. Leafy Vegetable Nitrite and Nitrate Content: Potential Health Effects. Foods 2023, 12, 1655. https://doi.org/10.3390/foods12081655
Luetic S, Knezovic Z, Jurcic K, Majic Z, Tripkovic K, Sutlovic D. Leafy Vegetable Nitrite and Nitrate Content: Potential Health Effects. Foods. 2023; 12(8):1655. https://doi.org/10.3390/foods12081655
Chicago/Turabian StyleLuetic, Sanja, Zlatka Knezovic, Katarina Jurcic, Zrinka Majic, Ksenija Tripkovic, and Davorka Sutlovic. 2023. "Leafy Vegetable Nitrite and Nitrate Content: Potential Health Effects" Foods 12, no. 8: 1655. https://doi.org/10.3390/foods12081655
APA StyleLuetic, S., Knezovic, Z., Jurcic, K., Majic, Z., Tripkovic, K., & Sutlovic, D. (2023). Leafy Vegetable Nitrite and Nitrate Content: Potential Health Effects. Foods, 12(8), 1655. https://doi.org/10.3390/foods12081655