
Fluoride Levels in Supply Water from the Canary Islands Region
 ,
,  ,
,  ,
,  ,
,  ,
, 
Abstract
:1. Introduction
2. Material and Methods
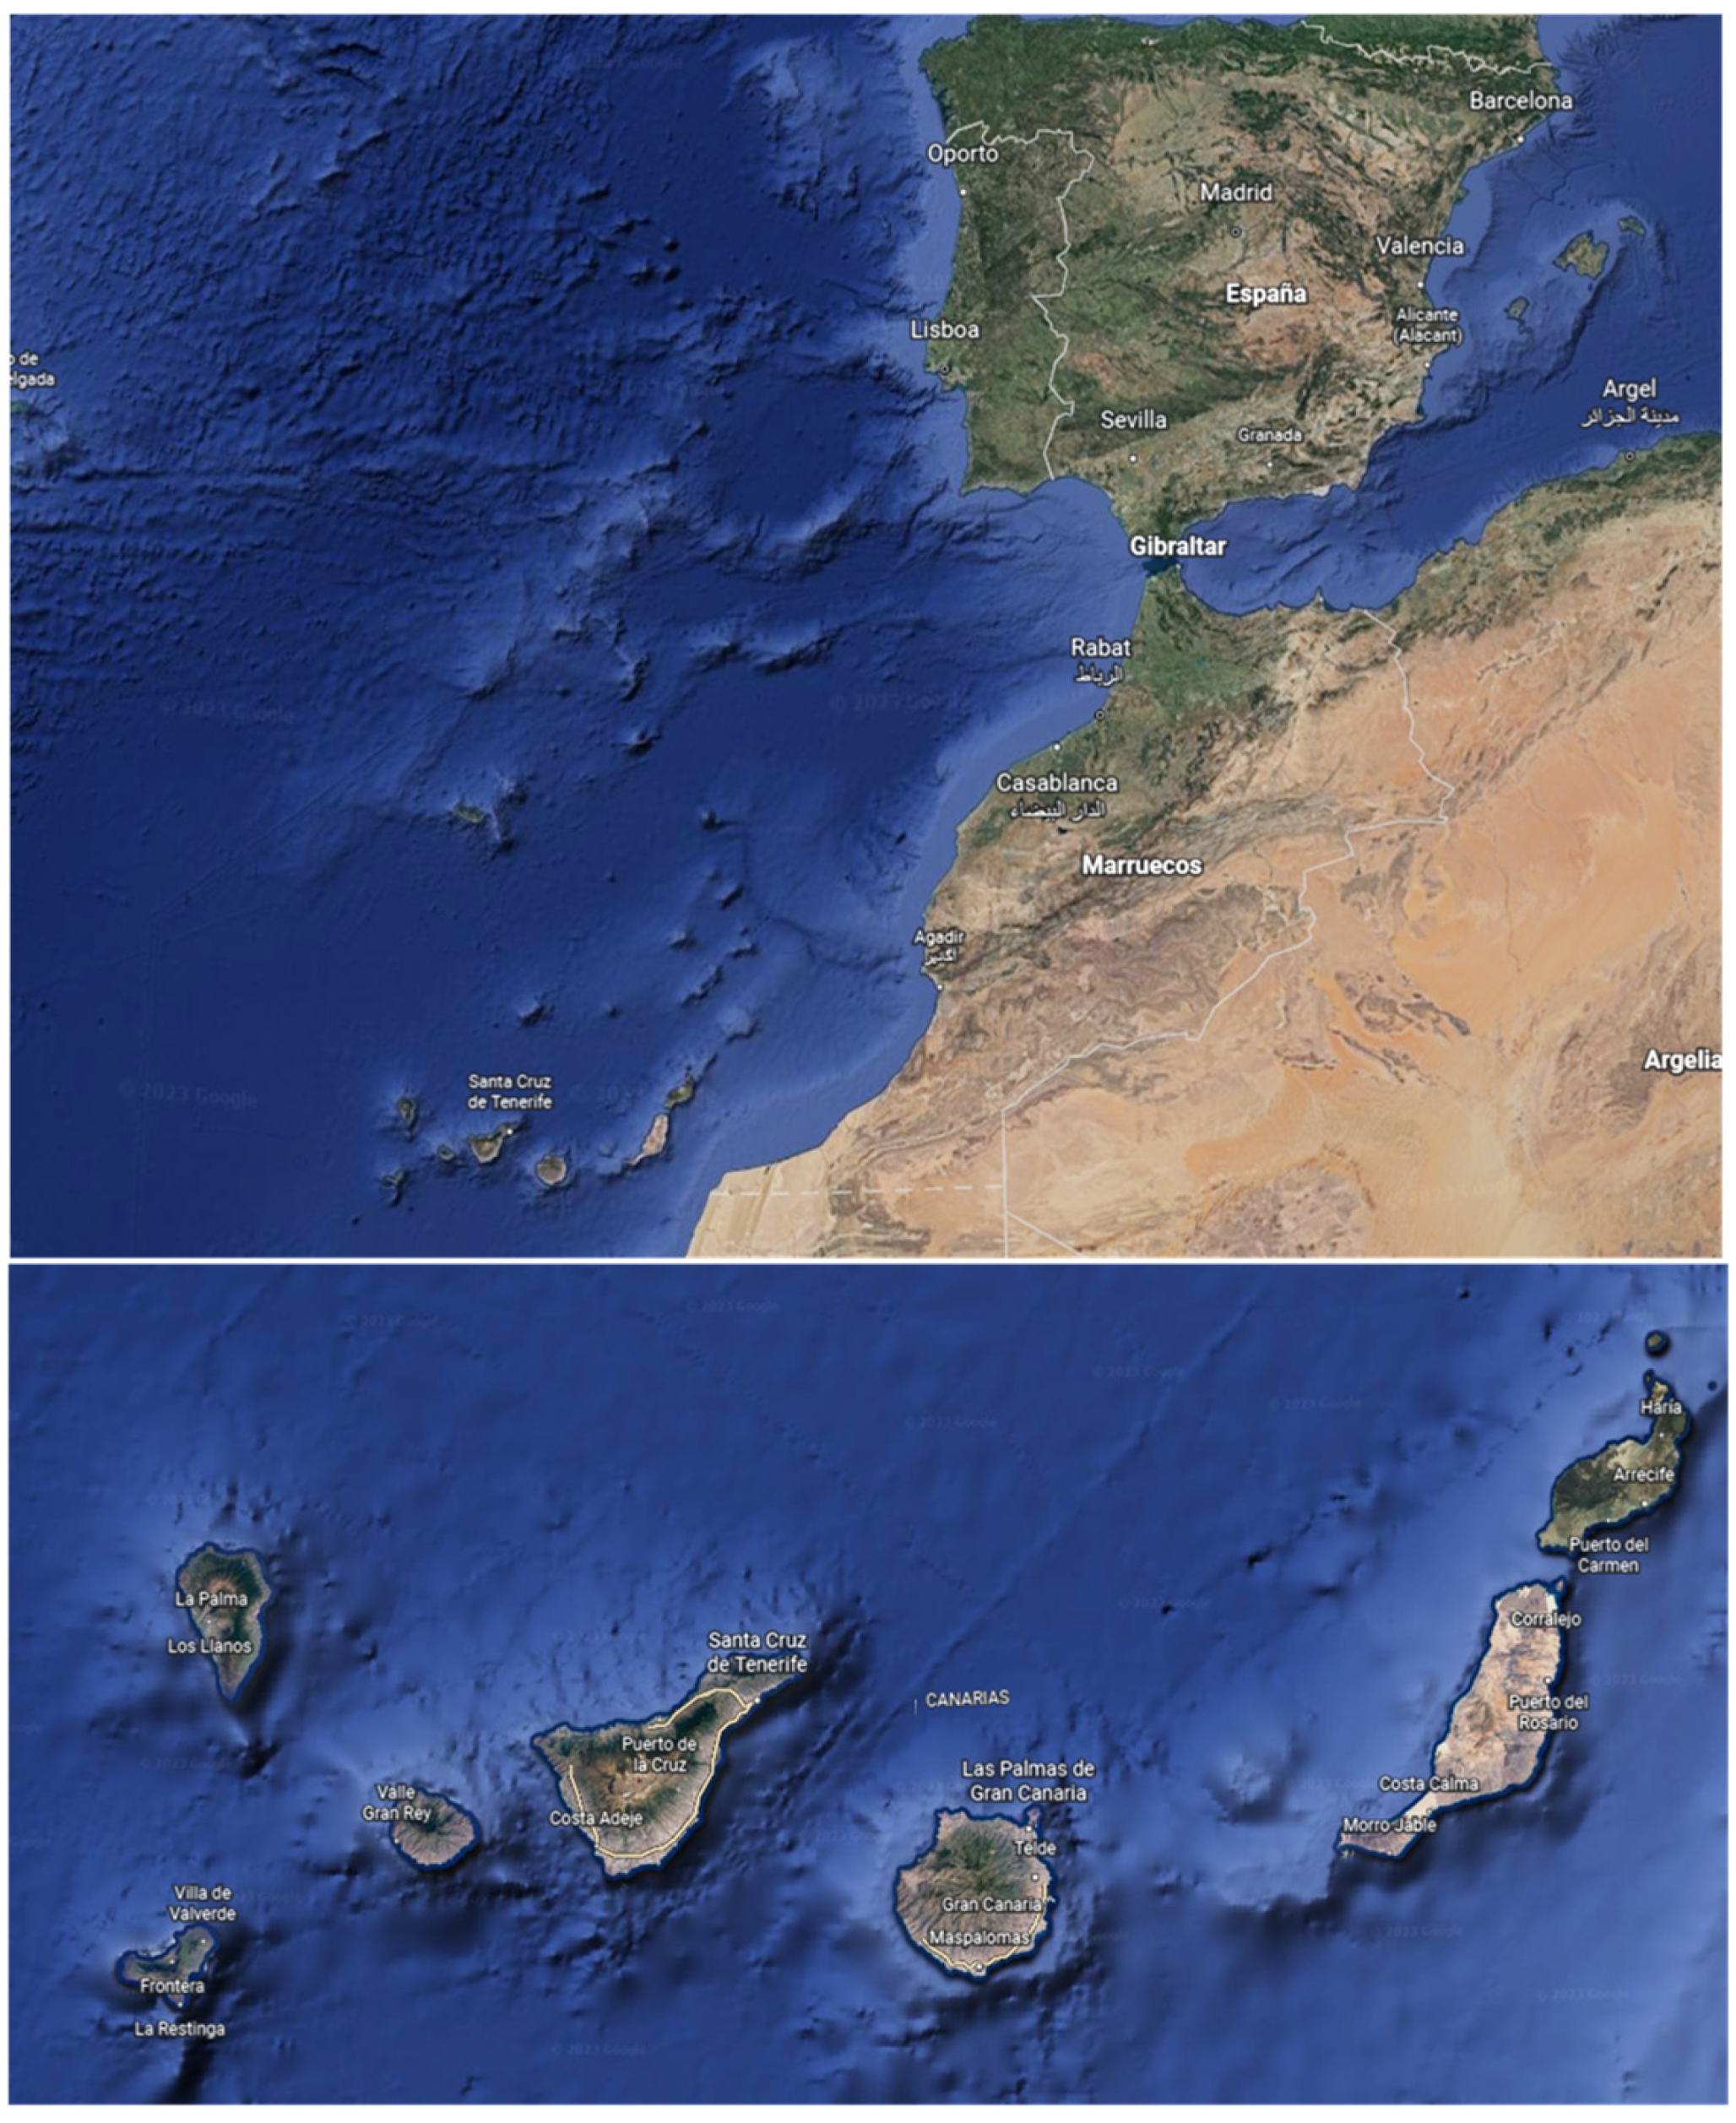
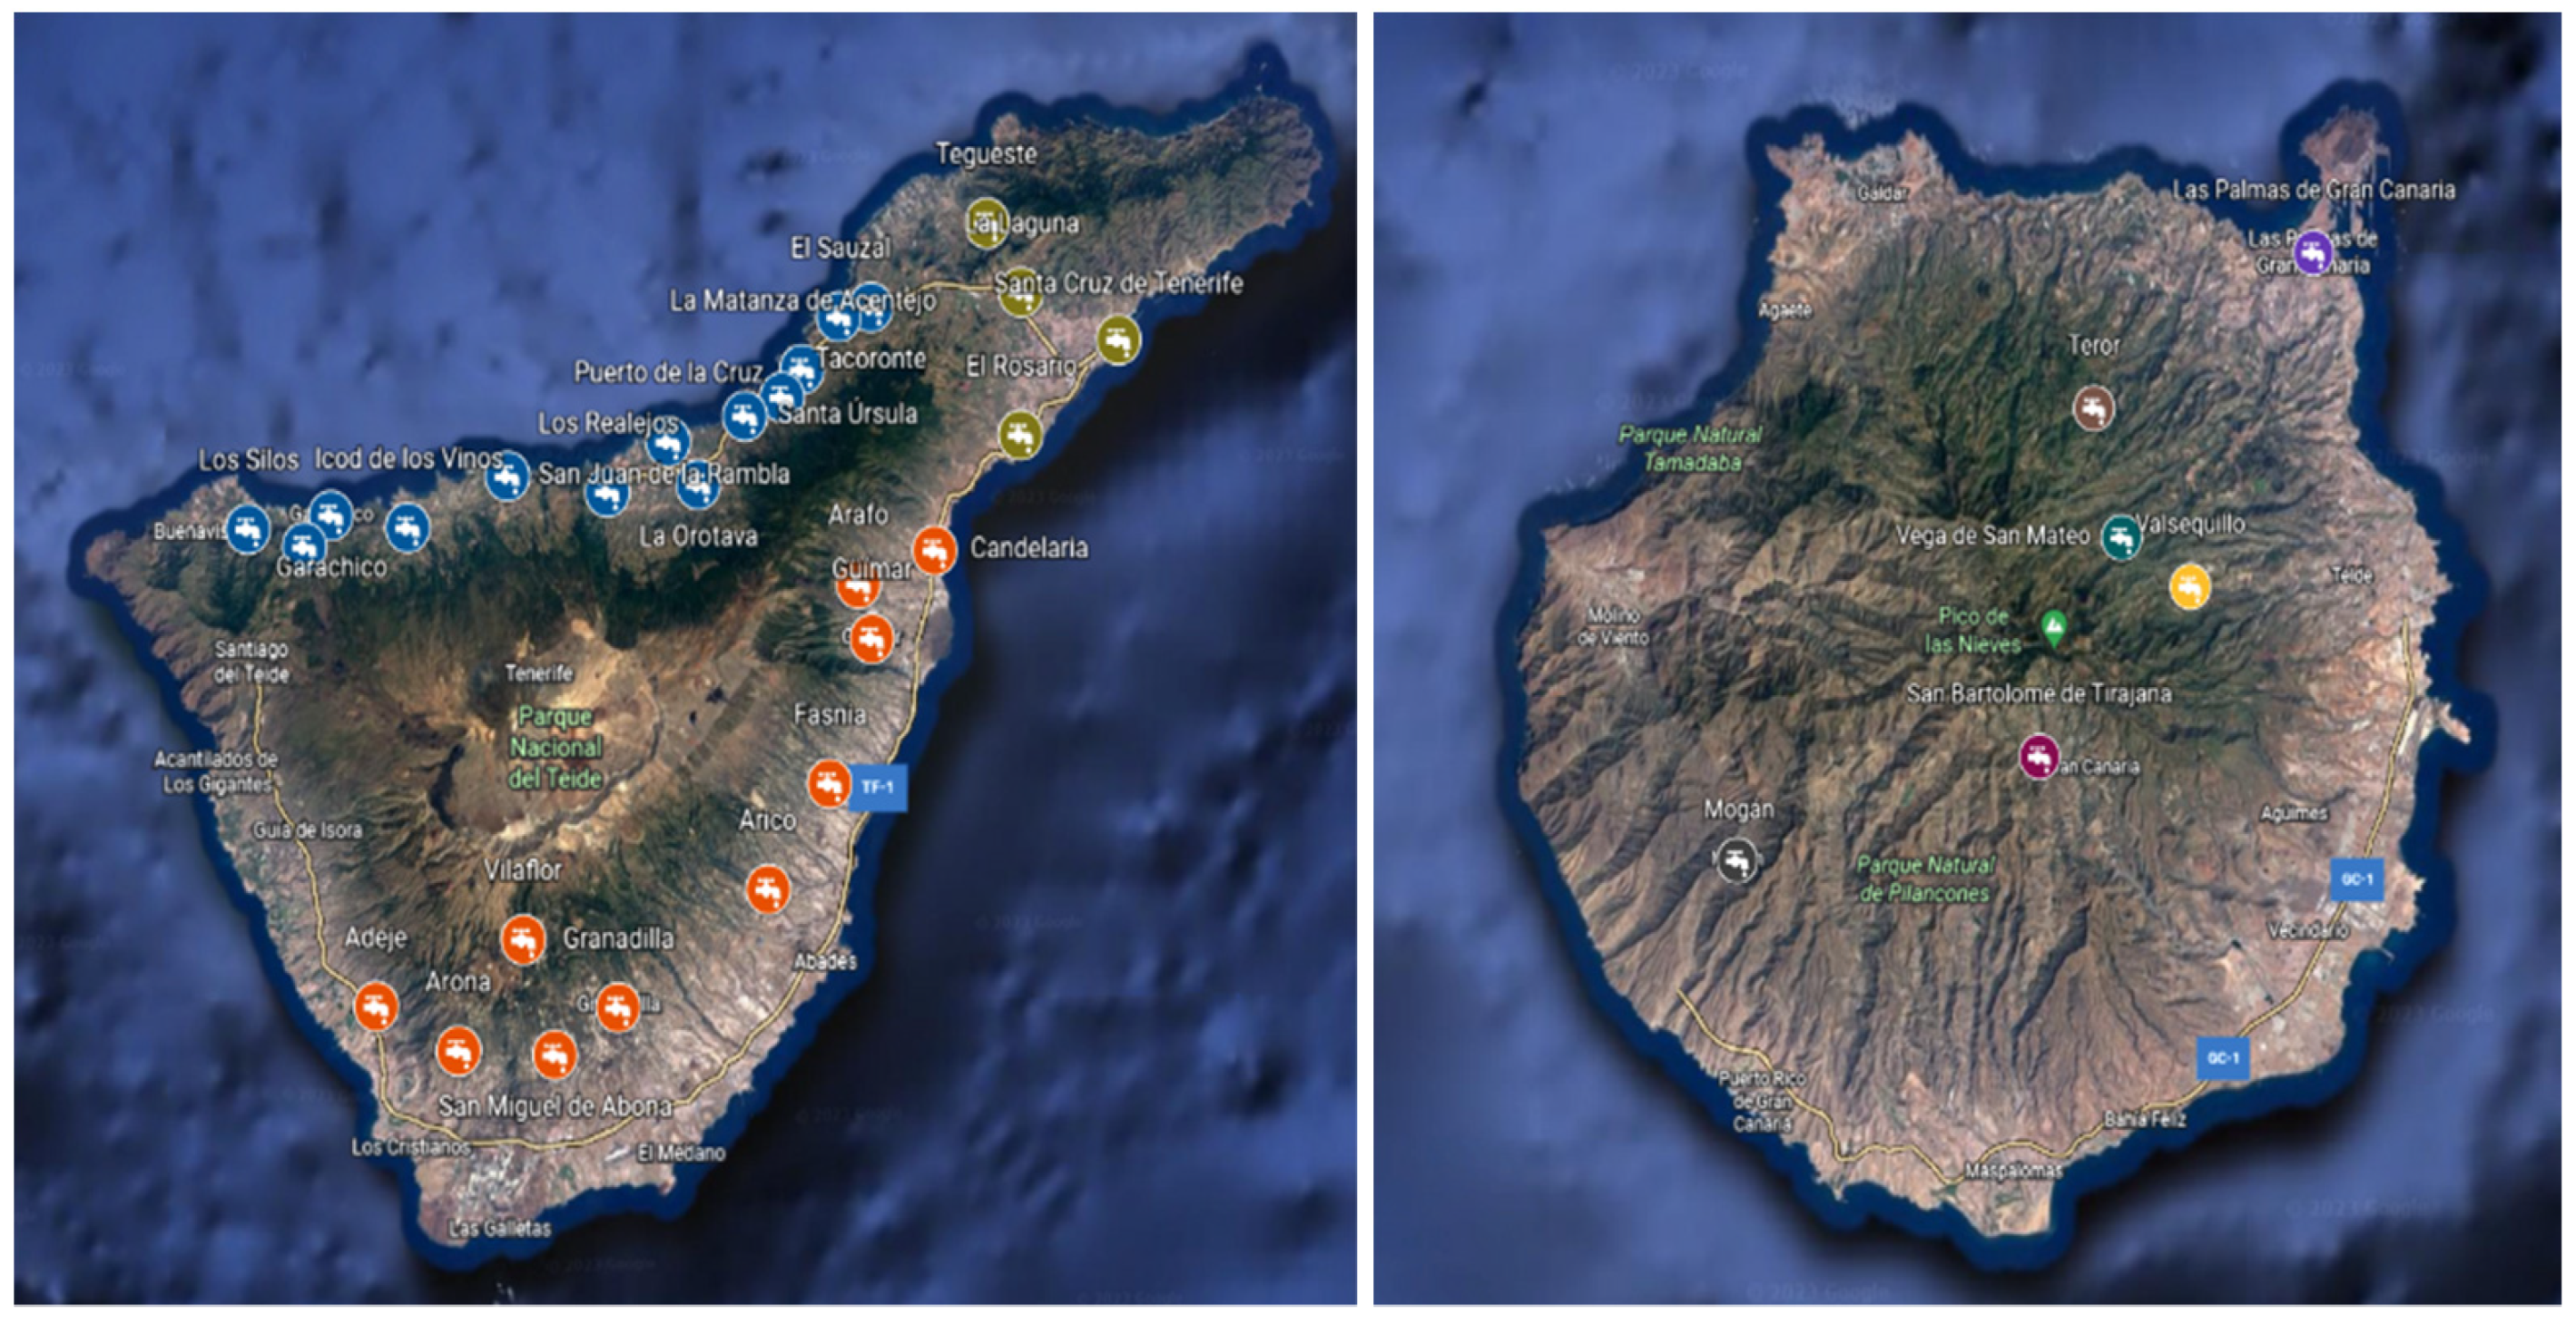
2.1. Samples and Sampling Areas
2.2. Analytical Method
2.3. Method Quality Control and Validation
2.4. Statistical Analysis
2.5. Dietary Intake Assessment
3. Results and Discussion
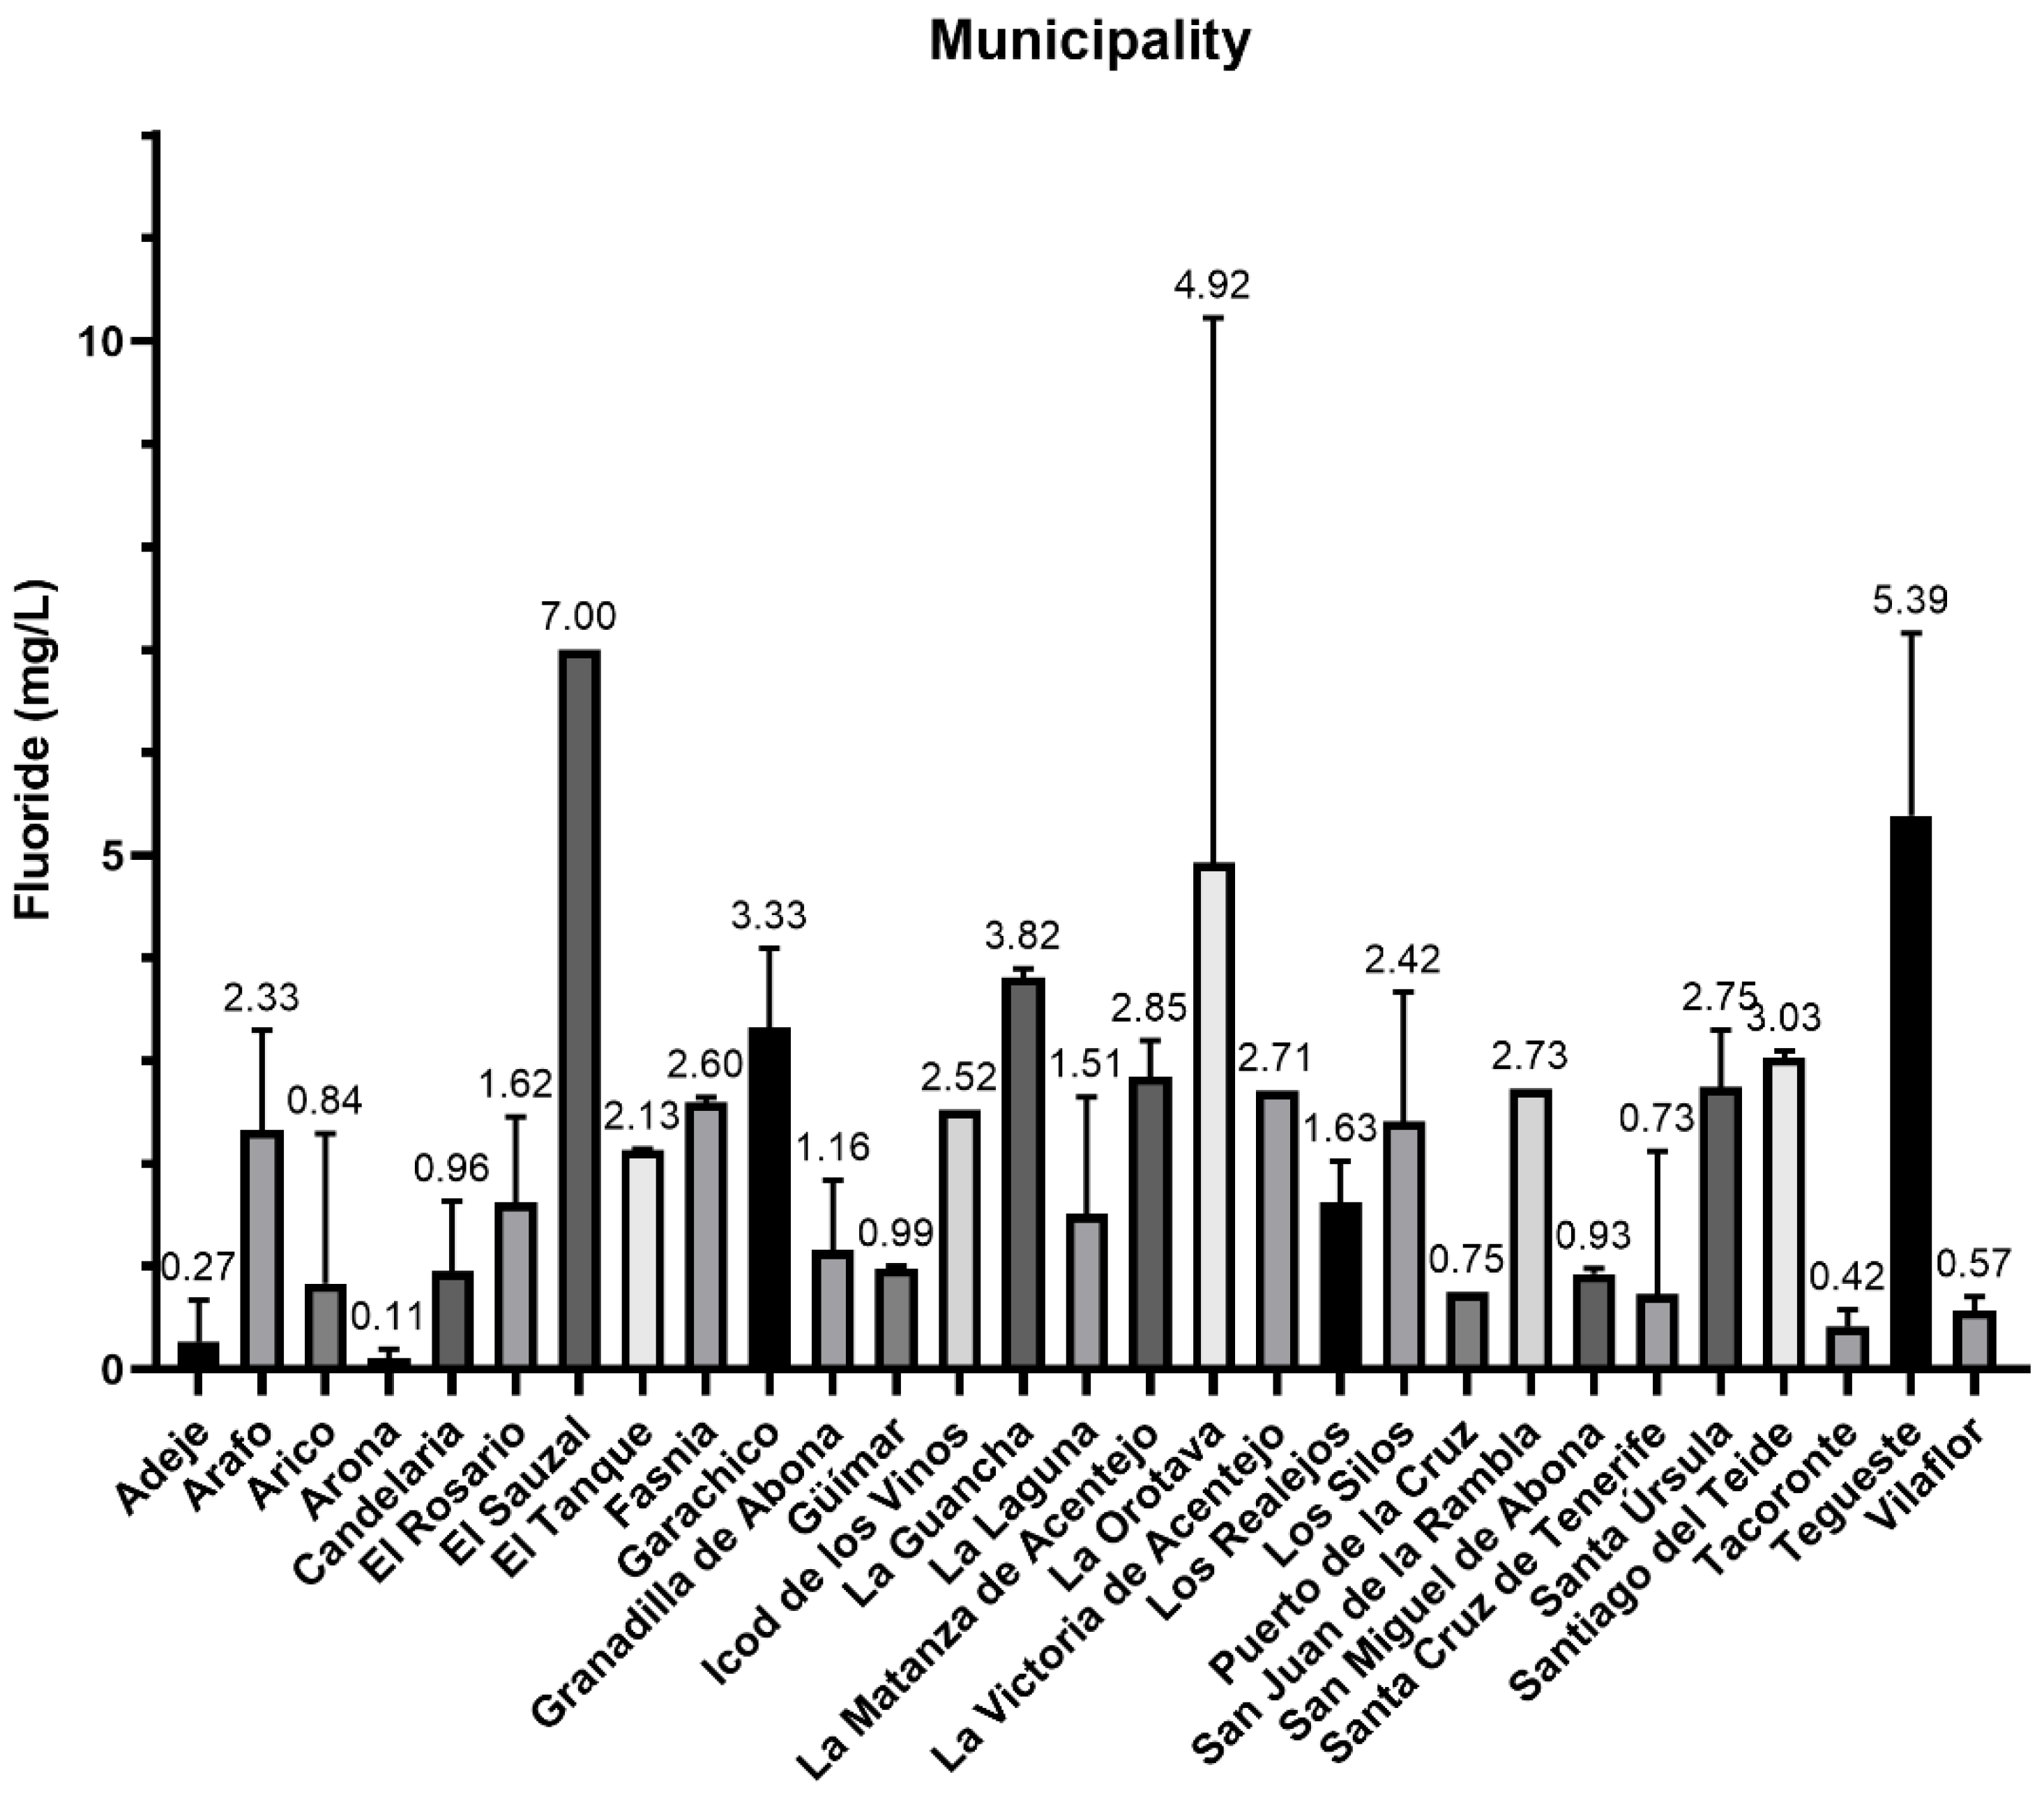
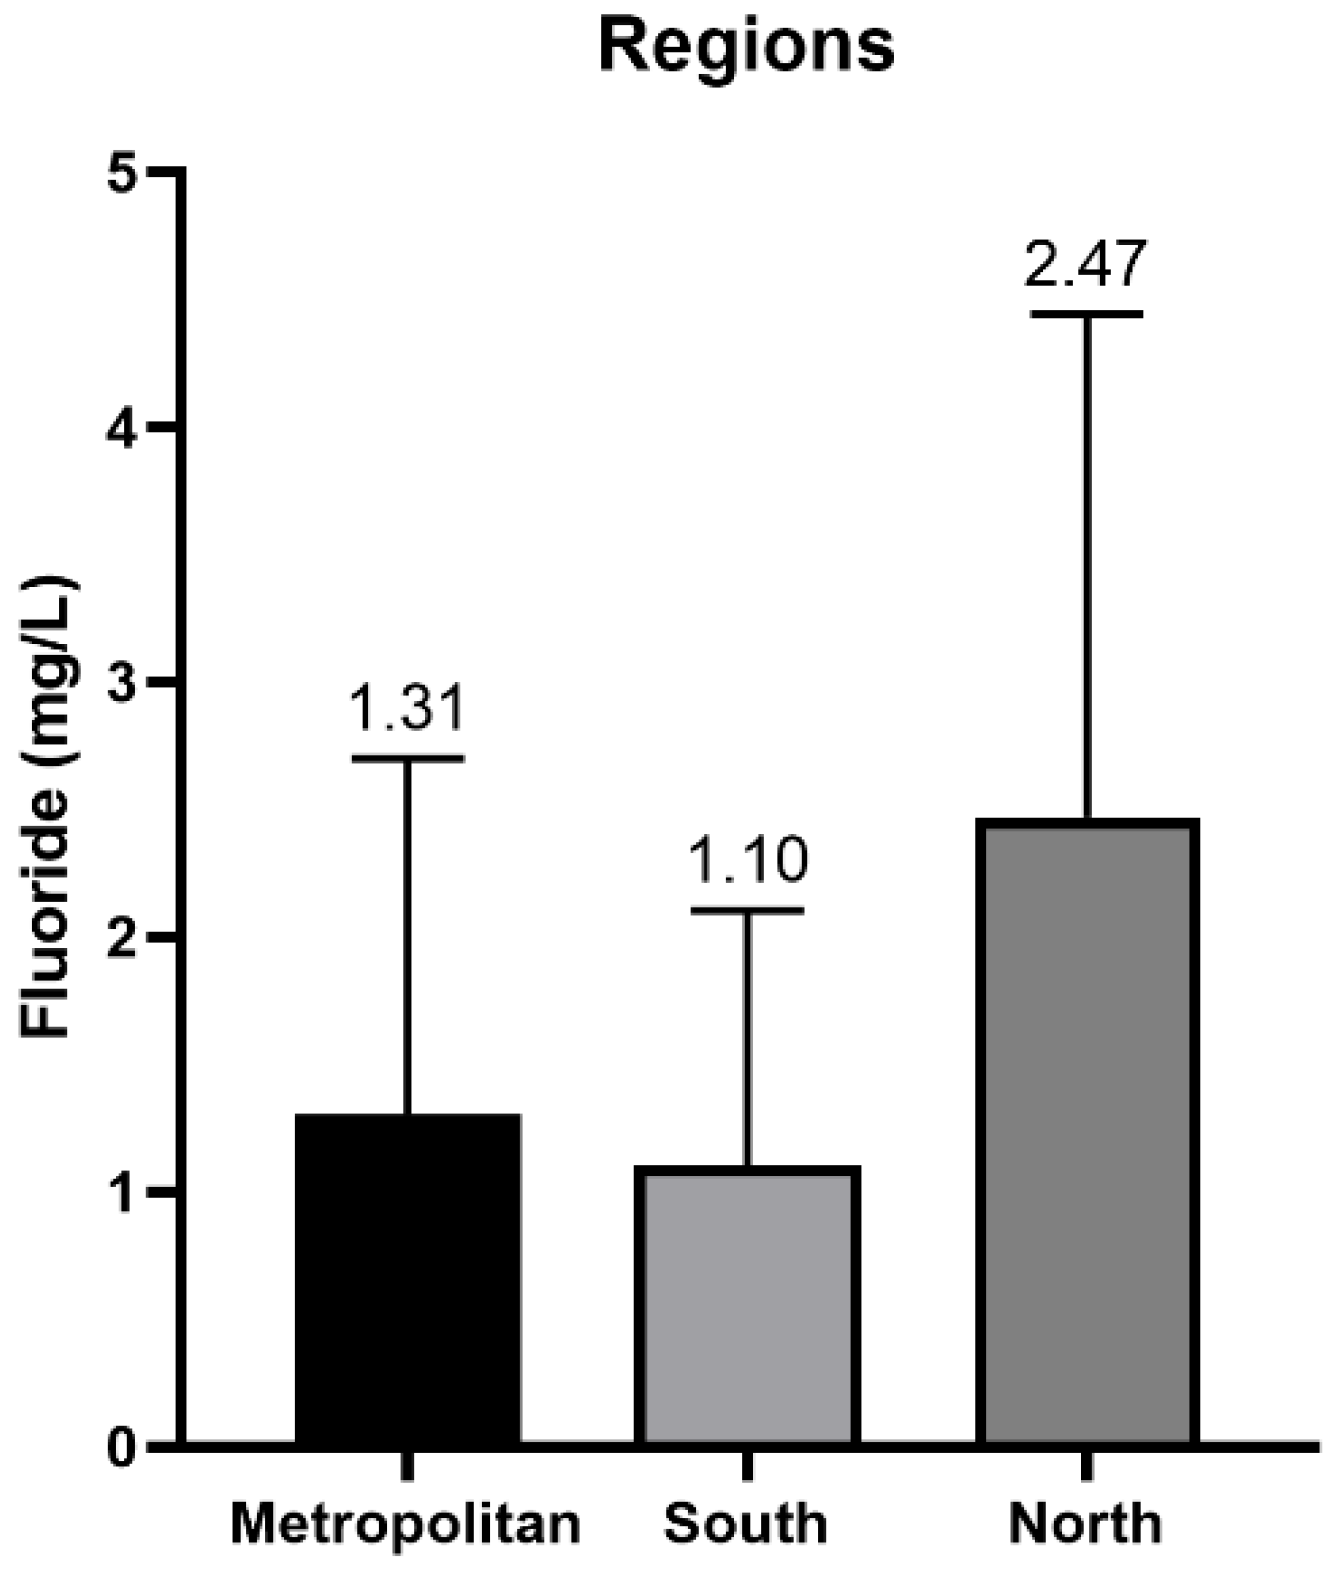
3.1. Fluoride Content in Tenerife Island
3.2. Fluoride Content on the Island of Gran Canaria
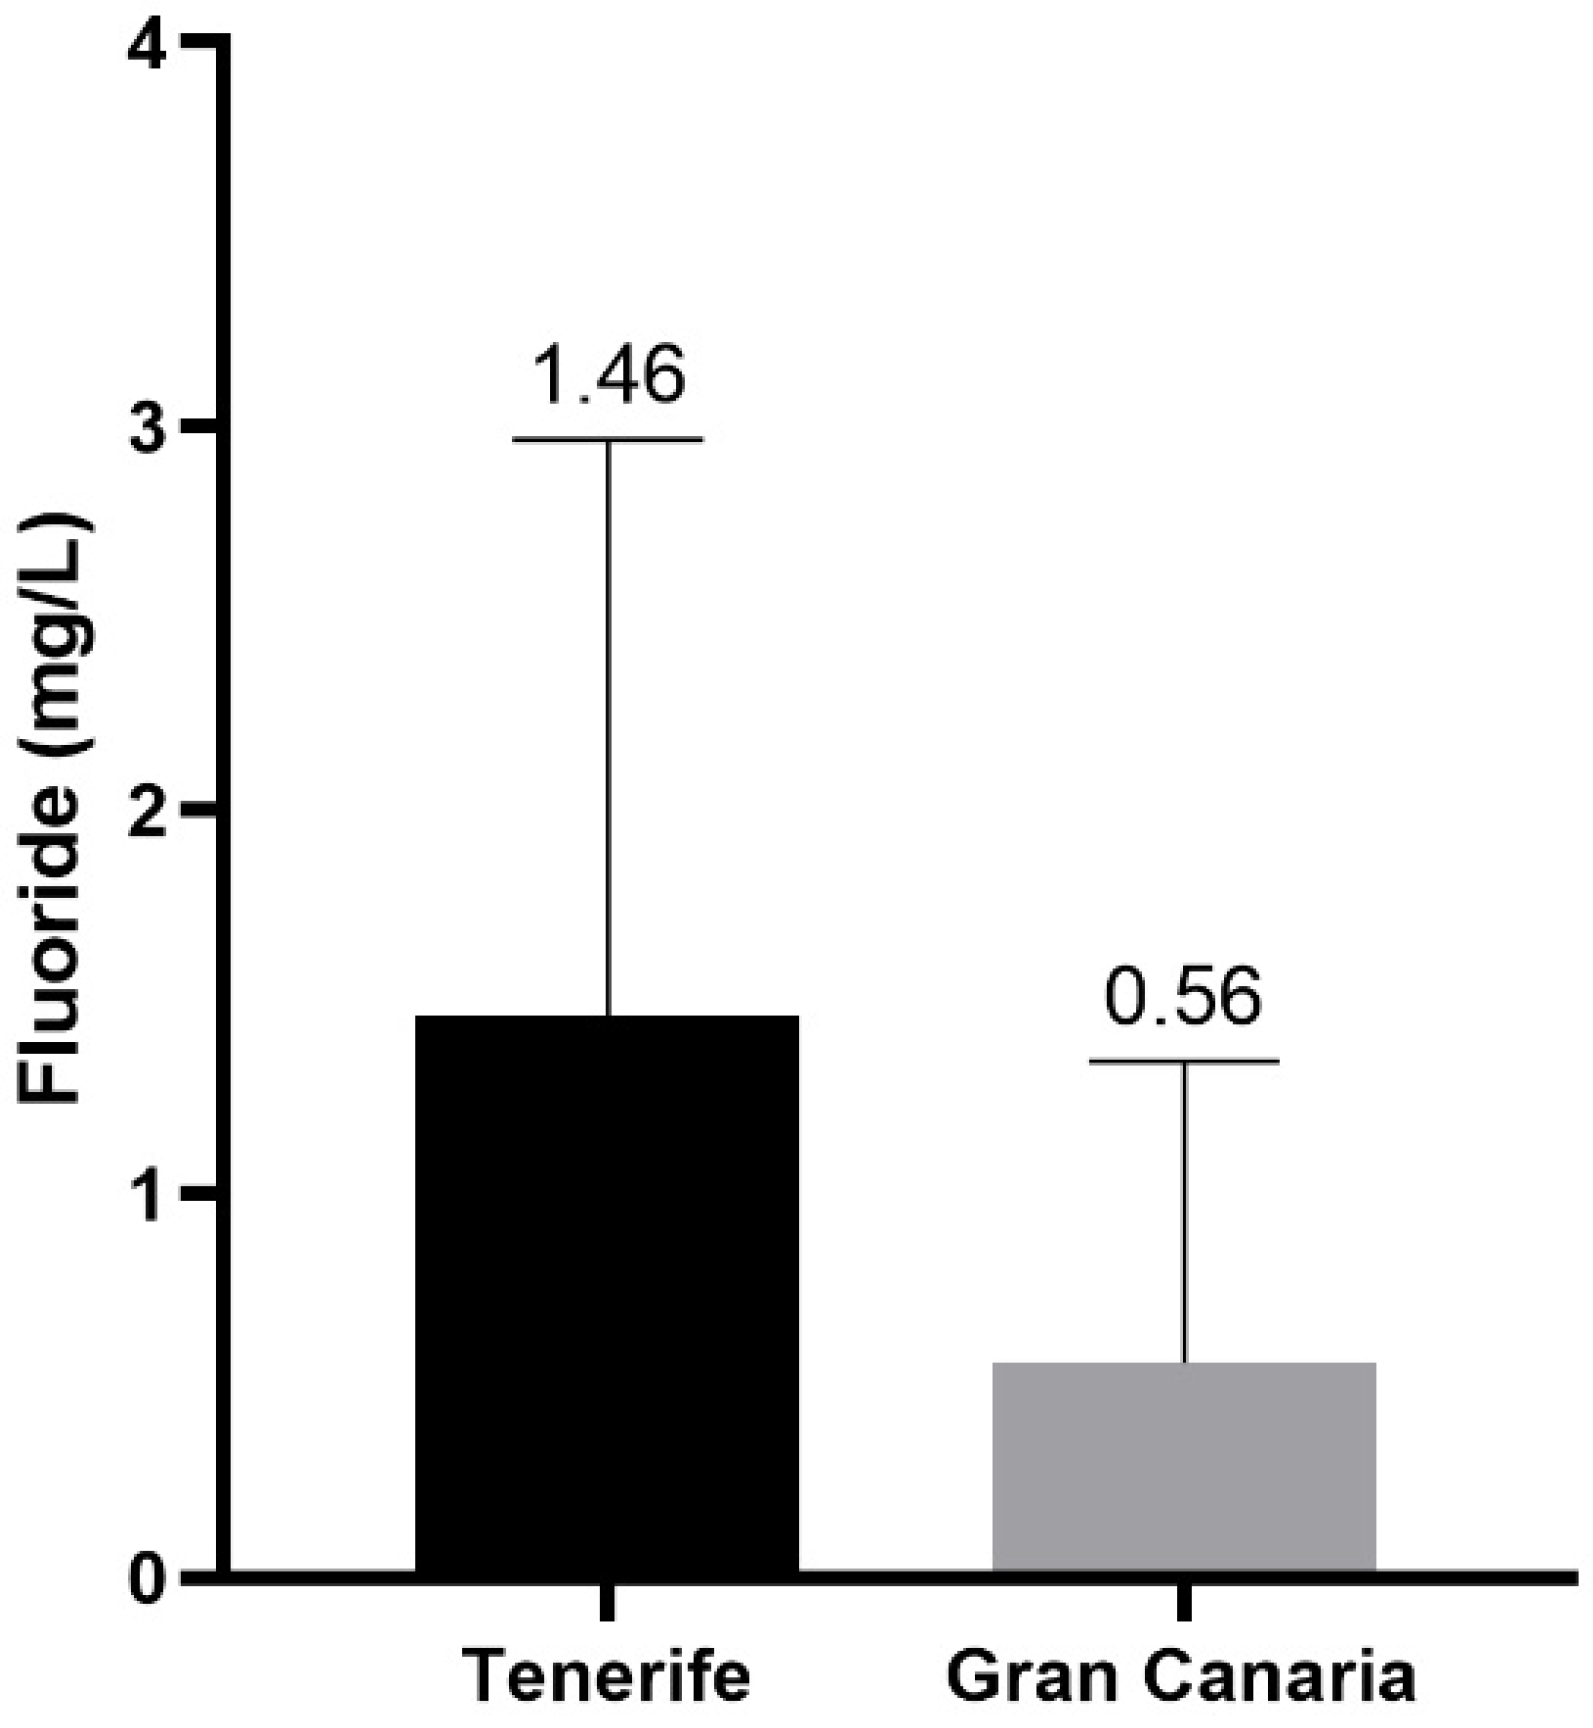
3.3. Comparison of Fluoride Content in Tenerife and Gran Canaria
3.4. Dietary Intake Assessment
4. Conclusions
Author Contributions
Funding
Institutional Review Board Statement
Informed Consent Statement
Data Availability Statement
Conflicts of Interest
References
- Christe, K.; Scheider, S. Fluorine. Encyclopedia Britannica. 2021. Available online: https://www.britannica.com/science/fluorine (accessed on 12 August 2022).
- Dehnen, S.; Schafer, L.L.; Lectka, T.; Togni, A. Fluorine: A very special element and its very special impacts on chemistry. Org. Lett. 2021, 23, 9013–9019. [Google Scholar] [CrossRef] [PubMed]
- EFSA Panel on Dietetic Products Nutrition and Allergies, (NDA). EFSA scientific opinion on dietary reference values for fluoride. EFSA J. 2013, 11, 3332. [Google Scholar] [CrossRef]
- Li, C.; Gao, X.; Liu, Y.; Wang, Y. Impact of anthropogenic activities on the enrichment of fluoride and salinity in groundwater in the Yuncheng Basin constrained by Cl/Br ratio, δ18O, δ2H, δ13C and δ7Li isotopes. J. Hydrol. 2019, 579, 124211. [Google Scholar] [CrossRef]
- Wang, H.; Mu, L.; Jiang, M.; Wang, Y.; Yan, W.; Jiao, Y. The relationship between chemical elements in soil and whole blood, and fluorosis induced by coal-fired pollution. Environ. Monit. Assess. 2014, 186, 2081–2088. [Google Scholar] [CrossRef] [PubMed]
- Stewart, C.; Johnston, D.M.; Leonard, G.S.; Horwell, C.J.; Thordarson, T.; Cronin, S.J. Contamination of water supplies by volcanic ashfall: A literature review and simple impact modelling. J. Volcanol. Geotherm. Res. 2006, 158, 296–306. [Google Scholar] [CrossRef]
- Buzalaf, M.A.R.; Whitford, G.M. Fluoride metabolism. Fluoride Oral Environ. 2011, 22, 20–36. [Google Scholar]
- Jha, S.K.; Mishra, V.K.; Sharma, D.K.; Damodaran, T. Fluoride in the environment and its metabolism in humans. In Reviews of Environmental Contamination and Toxicology Volume 211; Whitacre, D.M., Ed.; Springer: New York, NY, USA, 2011; pp. 121–142. [Google Scholar]
- Mertz, W. Trace Elements in Human and Animal Nutrition; Academic Press: Cambridge, MA, USA, 1986; Volume 1. [Google Scholar]
- Palmer, C.; Wolfe, S.H.; American Dietetic Association. Position of the American dietetic association: The impact of fluoride on health. J. Am. Diet. Assoc. 2005, 105, 1620–1628. [Google Scholar] [CrossRef]
- Opydo-Szymaczek, J.; Ogińska, M.; Wyrwas, B. Fluoride exposure and factors affecting dental caries in preschool children living in two areas with different natural levels of fluorides. J. Trace Elem. Med. Biol. 2021, 65, 126726. [Google Scholar] [CrossRef]
- Singh, A.; Singh, J. Chapter 1-Effects on human health due to fluoride. In Green Technologies for the Defluoridation of Water; Hadi Dehghani, M., Karri, R., Lima, E., Eds.; Elsevier: Amsterdam, The Netherlands, 2021; pp. 1–16. [Google Scholar]
- Miller, F.Y.; Campus, G.; Giuliana, G.; Piscopo, M.R.; Pizzo, G. Topical fluoride for preventing dental caries in children and adolescents. Curr. Pharm. Des. 2012, 18, 5532–5541. [Google Scholar] [CrossRef]
- Kashyap, S.J.; Sankannavar, R.; Madhu, G.M. Fluoride sources, toxicity and fluorosis management techniques–A brief review. J. Hazard. Mater. Lett. 2021, 2, 100033. [Google Scholar] [CrossRef]
- Zuo, H.; Chen, L.; Kong, M.; Qiu, L.; Lü, P.; Wu, P.; Yang, Y.; Chen, K. Toxic effects of fluoride on organisms. Life Sci. 2018, 198, 18–24. [Google Scholar] [CrossRef]
- Skórka-Majewicz, M.; Goschorska, M.; Żwierełło, W.; Baranowska-Bosiacka, I.; Styburski, D.; Kapczuk, P.; Gutowska, I. Effect of fluoride on endocrine tissues and their secretory functions-review. Chemosphere 2020, 260, 127565. [Google Scholar] [CrossRef]
- Choi Anna, L.; Guifan, S.; Ying, Z.; Philippe, G. Developmental fluoride neurotoxicity: A systematic review and meta-analysis. Environ. Health Perspect. 2012, 120, 1362–1368. [Google Scholar] [CrossRef]
- Valdez-Jiménez, L.; Soria Fregozo, C.; Miranda Beltrán, M.L.; Gutiérrez Coronado, O.; Pérez Vega, M.I. Efectos del flúor sobre el sistema nervioso central. Neurología 2011, 26, 297–300. [Google Scholar] [CrossRef]
- Tang, Q.; Du, J.; Ma, H.; Jiang, S.; Zhou, X. Fluoride and children’s intelligence: A meta-analysis. Biol. Trace Elem. Res. 2008, 126, 115–120. [Google Scholar] [CrossRef]
- Till, C.; Green, R.; Flora, D.; Hornung, R.; Martinez-Mier, E.A.; Blazer, M.; Farmus, L.; Ayotte, P.; Muckle, G.; Lanphear, B. Fluoride exposure from infant formula and child IQ in a Canadian birth cohort. Environ. Int. 2020, 134, 105315. [Google Scholar] [CrossRef]
- Anshumali; Kumar, M.; Chanda, N.; Kumar, A.; Kumar, B.; Venkatesh, M. Geochemical assessment of fluoride pollution in groundwater of tribal region in India. Bull. Environ. Contam. Toxicol. 2018, 100, 421–429. [Google Scholar] [CrossRef]
- Yadav, K.K.; Kumar, S.; Pham, Q.B.; Gupta, N.; Rezania, S.; Kamyab, H.; Yadav, S.; Vymazal, J.; Kumar, V.; Tri, D.Q.; et al. Fluoride contamination, health problems and remediation methods in Asian groundwater: A comprehensive review. Ecotoxicol. Environ. Saf. 2019, 182, 109362. [Google Scholar] [CrossRef]
- CIAG Esquema de Temas Importantes en Materia de Gestión de las Aguas de la Demarcación Hidrográfica de Gran Canaria; Consejo Insular de Aguas de Gran Canaria: Las Palmas, Spain, 2020.
- Gaciri, S.J.; Davies, T.C. The occurrence and geochemistry of fluoride in some natural waters of Kenya. J. Hydrol. 1993, 143, 395–412. [Google Scholar] [CrossRef]
- Regenspurg, S.; Virchow, L.; Wilke, F.D.H.; Zimmer, M.; Jolie, E.; Hachenberger, A.; Yirgu, G.; Gebru, E.F.; Vieth-Hillebrand, A.; Gizaw, B. Origin and migration of fluoride in the area of the Aluto Volcanic Complex (Main Ethiopian Rift). Appl. Geochem. 2022, 146, 105403. [Google Scholar] [CrossRef]
- Hardisson, A.; Rodríguez, M.I.; Burgos, A.; Flores, L.D.; Gutiérrez, R.; Várela, H. Fluoride levels in publicly supplied and bottled drinking water in the island of Tenerife, Spain. Bull. Environ. Contam. Toxicol. 2001, 67, 163–170. [Google Scholar] [CrossRef] [PubMed]
- Rubio, C.; Rodríguez, I.; Jaudenes, J.R.; Gutiérrez, A.J.; Paz, S.; Burgos, A.; Hardisson, A.; Revert, C. Fluoride levels in supply water from a volcanic area in the Macaronesia region. Environ. Sci. Pollut. Res. Int. 2020, 27, 11587–11595. [Google Scholar] [CrossRef]
- González Sacramento, N.; Rubio Armendáriz, C.; Gutiérrez Fernández, Á.J.; Luis González, G.; Hardisson de la Torre, A.; Revert Girones, C. Tap water as a dietary source of exposure to fluoride in Tenerife; risk assessment. Nutr. Hosp. 2015, 31, 1787–1794. [Google Scholar] [CrossRef] [PubMed]
- Cruz, T.; Espino-Mesa, M.; Benavides, A.; Cabrera, M.d.C.; Henández-Moreno, J.M. Fluoride contamination in ground and surface water in La Aldea Valley, Gran Canaria, Canary Island, Spain: Past and present. In Proceedings of the 25th International Applied Geochemistry Symposium (IAGS), Rowaniemi, Finland, 22–26 August 2011. [Google Scholar]
- Santamarta Cerezal, J.C. Hidrología y Recursos Hídricos en las Islas y Terrenos Volcánicos; Colegio de Ingenieros de Montes: Tenerife, Spain, 2013. [Google Scholar]
- Anguita, F.; Hernán, F. The Canary Islands origin: A unifying model. J. Volcanol. Geotherm. Res. 2000, 103, 1–26. [Google Scholar] [CrossRef]
- Delgado, M.M.M.; de la Torre, A.H.; Álvarez, R. Direct potentiometric determination of fluoride in beverages. Comparative study of different buffering solutions. Food Chem. 1993, 46, 85–88. [Google Scholar] [CrossRef]
- European Commission. Council Directive 98/83/EC of 3 November 1998 on the Quality of Water Intended for Human Consumption; European Commission: Brussels, Belgium, 1998. [Google Scholar]
- Gabriela Gulesserian. Un anillo insular del agua, solución para el exceso de flúor en La Guancha; Diario de Avisos: Santa Cruz de Tenerife, Spain, 2021. [Google Scholar]
- Schallenberg-Rodríguez, J.; Veza, J.M.; Blanco-Marigorta, A. Energy efficiency and desalination in the Canary Islands. Renew. Sustain. Energy Rev. 2014, 40, 741–748. [Google Scholar] [CrossRef]
- Mena, V.F.; Betancor-Abreu, A.; González, S.; Delgado, S.; Souto, R.M.; Santana, J.J. Fluoride removal from natural volcanic underground water by an electrocoagulation process: Parametric and cost evaluations. J. Environ. Manag. 2019, 246, 472–483. [Google Scholar] [CrossRef]
- SINAC Sistema de Información Nacional de Aguas de Consumo. Available online: https://sinac.sanidad.gob.es/CiudadanoWeb/ciudadano/informacionAbastecimientoActionEntrada.do (accessed on 12 December 2022).
- Gobierno de Canarias DECRETO 49/2000, de 10 de abril, por el que se determinan las masas de agua afectadas por la contaminación de nitratos de origen agrario y se designan las zonas vulnerables por dicha contaminación; No. 048; BOC: Islas Canarias, Spain, 2000.
- Consejo Insular de Aguas de Tenerife (CIATF). Plan Hidrológico de Tenerife (Ciclo de Planificación Hidrológica 2015–2021); Consejo Insular de Aguas de Tenerife: Santa Cruz de Tenerife, Spain, 2018. [Google Scholar]
- Koirala, B.; Niraula, S.R.; Ghimire, A. Estimation of fluoride content of drinking water in Dharan. J. BP Koirala Inst. Health Sci. 2020, 3, 88–95. [Google Scholar] [CrossRef]
- Rahman, M.M.; Bodrud-Doza, M.; Siddiqua, M.T.; Zahid, A.; Islam, A.R.M.T. Spatiotemporal distribution of fluoride in drinking water and associated probabilistic human health risk appraisal in the coastal region, Bangladesh. Sci. Total Environ. 2020, 724, 138316. [Google Scholar] [CrossRef]
- Lacson, C.F.Z.; Lu, M.C.; Huang, Y.H. Fluoride-containing water: A global perspective and a pursuit to sustainable water defluoridation management-An overview. J. Clean. Product. 2021, 280, 124236. [Google Scholar] [CrossRef]
- Nabizadehb, R.; Hadeib, M.; Zareif, A.; Asgharib, F.B.; Mohammadic, A.A. Northwest of Iran as an endemic area in terms of fluoride contamination: A case study on the correlation of fluoride concentration with physicochemical characteristics of groundwater sources in Showt. Desalin. Water Treat. 2019, 155, 183–189. [Google Scholar]
- Oruc, N. Occurrence and problems of high fluoride waters in Turkey: An overview. Environ. Geochem. Health 2008, 30, 315–323. [Google Scholar] [CrossRef]

| Tenerife | ||
| Area | Municipality | No. Samples |
| South | Adeje | 9 |
| Arafo | 5 | |
| Arico | 7 | |
| Arona | 2 | |
| Candelaria | 8 | |
| Fasnia | 3 | |
| Granadilla de Abona | 13 | |
| Güímar | 2 | |
| San Miguel de Abona | 5 | |
| Vilaflor | 3 | |
| North | El Sauzal | 1 |
| El Tanque | 2 | |
| Garachico | 2 | |
| Icod de los Vinos | 1 | |
| La Matanza de Acentejo | 5 | |
| La Orotava | 3 | |
| La Victoria de Acentejo | 1 | |
| Los Realejos | 7 | |
| Los Silos | 2 | |
| Puerto de la Cruz | 1 | |
| San Juan de la Rambla | 1 | |
| Santa Úrsula | 2 | |
| Tacoronte | 6 | |
| Metropolitan | El Rosario | 11 |
| La Laguna | 49 | |
| Santa Cruz de Tenerife | 38 | |
| Tegueste | 2 | |
| Total | 196 | |
| Gran Canaria | ||
| Area | Municipality | No. Samples |
| Metropolitan | Las Palmas | 30 |
| South | Mogán | 10 |
| San Bartolomé de Tirajana | 20 | |
| Midlands | Valsequillo | 5 |
| San Mateo | 5 | |
| North | Teror | 8 |
| Total | 78 | |
| Tenerife | Water Source | |||||
| Area | Desalation | Surface | Digged Well | Dug Well | Gallery | Spring |
| Metropolitan | 55 | 0 | 14 | 20 | 69 | 9 |
| North | 0 | 0 | 1 | 0 | 7 | 0 |
| South | 7 | 0 | 0 | 0 | 17 | 0 |
| Total | 62 | 0 | 15 | 20 | 90 | 8 |
| Gran Canaria | Water Source | |||||
| Area | Desalation | Surface | Digged Well | Dug Well | Gallery | Spring |
| South | 3 | 2 | 23 | 3 | 0 | 0 |
| Metropolitan | 20 | 1 | 2 | 7 | 1 | 0 |
| Midlands | 0 | 10 | 0 | 0 | 0 | 0 |
| North | 0 | 0 | 5 | 3 | 0 | 0 |
| Total | 23 | 13 | 30 | 11 | 1 | 0 |
| Area | Municipalities | Concentration F- (mg/L) | |||
|---|---|---|---|---|---|
| Mean | Min | Max | SD | ||
| Metropolitan | El Rosario | 1.62 | 0.47 | 2.61 | 0.83 |
| La Laguna | 1.51 | 0.03 | 6.04 | 1.13 | |
| Santa Cruz de Tenerife | 0.73 | 0.02 | 5.62 | 1.39 | |
| Tegueste | 5.39 | 4.14 | 6.64 | 1.77 | |
| North | El Sauzal | 7.00 | 7.00 | 7.00 | 0 |
| El Tanque | 2.13 | 2.12 | 2.14 | 0.01 | |
| Garachico | 3.32 | 2.78 | 3.87 | 0.78 | |
| Icod de los Vinos | 2.52 | 2.52 | 2.52 | 0 | |
| La Guancha | 3.82 | 3.75 | 3.91 | 0.08 | |
| La Matanza de Acentejo | 2.85 | 2.55 | 3.45 | 0.35 | |
| La Orotava | 4.92 | 0.65 | 10.86 | 5.30 | |
| La Victoria de Acentejo | 2.71 | 2.71 | 2.71 | 0 | |
| Los Realejos | 1.63 | 1.03 | 2.21 | 0.40 | |
| Los Silos | 2.41 | 1.53 | 3.30 | 1.25 | |
| Puerto de la Cruz | 0.75 | 0.75 | 0.75 | 0 | |
| San Juan de la Rambla | 2.73 | 2.73 | 2.73 | 0 | |
| Santa Úrsula | 2.75 | 2.36 | 3.14 | 0.55 | |
| Tacoronte | 0.42 | 0.30 | 0.74 | 0.16 | |
| South | Adeje | 0.27 | 0.03 | 1.08 | 0.40 |
| Arafo | 2.32 | 1.34 | 3.34 | 0.97 | |
| Arico | 0.84 | 0.02 | 3.66 | 1.46 | |
| Arona | 0.11 | 0.05 | 0.17 | 0.08 | |
| Candelaria | 0.96 | 0.19 | 1.82 | 0.67 | |
| Fasnia | 2.60 | 2.54 | 2.63 | 0.05 | |
| Granadilla de Abona | 1.16 | 0.04 | 1.89 | 0.68 | |
| Güimar | 0.99 | 0.97 | 1.00 | 0.02 | |
| San Miguel de Abona | 0.93 | 0.84 | 0.97 | 0.05 | |
| Santiago del Teide | 3.03 | 2.98 | 3.08 | 0.07 | |
| Vilaflor | 0.57 | 0.49 | 0.73 | 0.14 | |
| Area | Municipality | Mean Content (mg/L) | Min | Max |
|---|---|---|---|---|
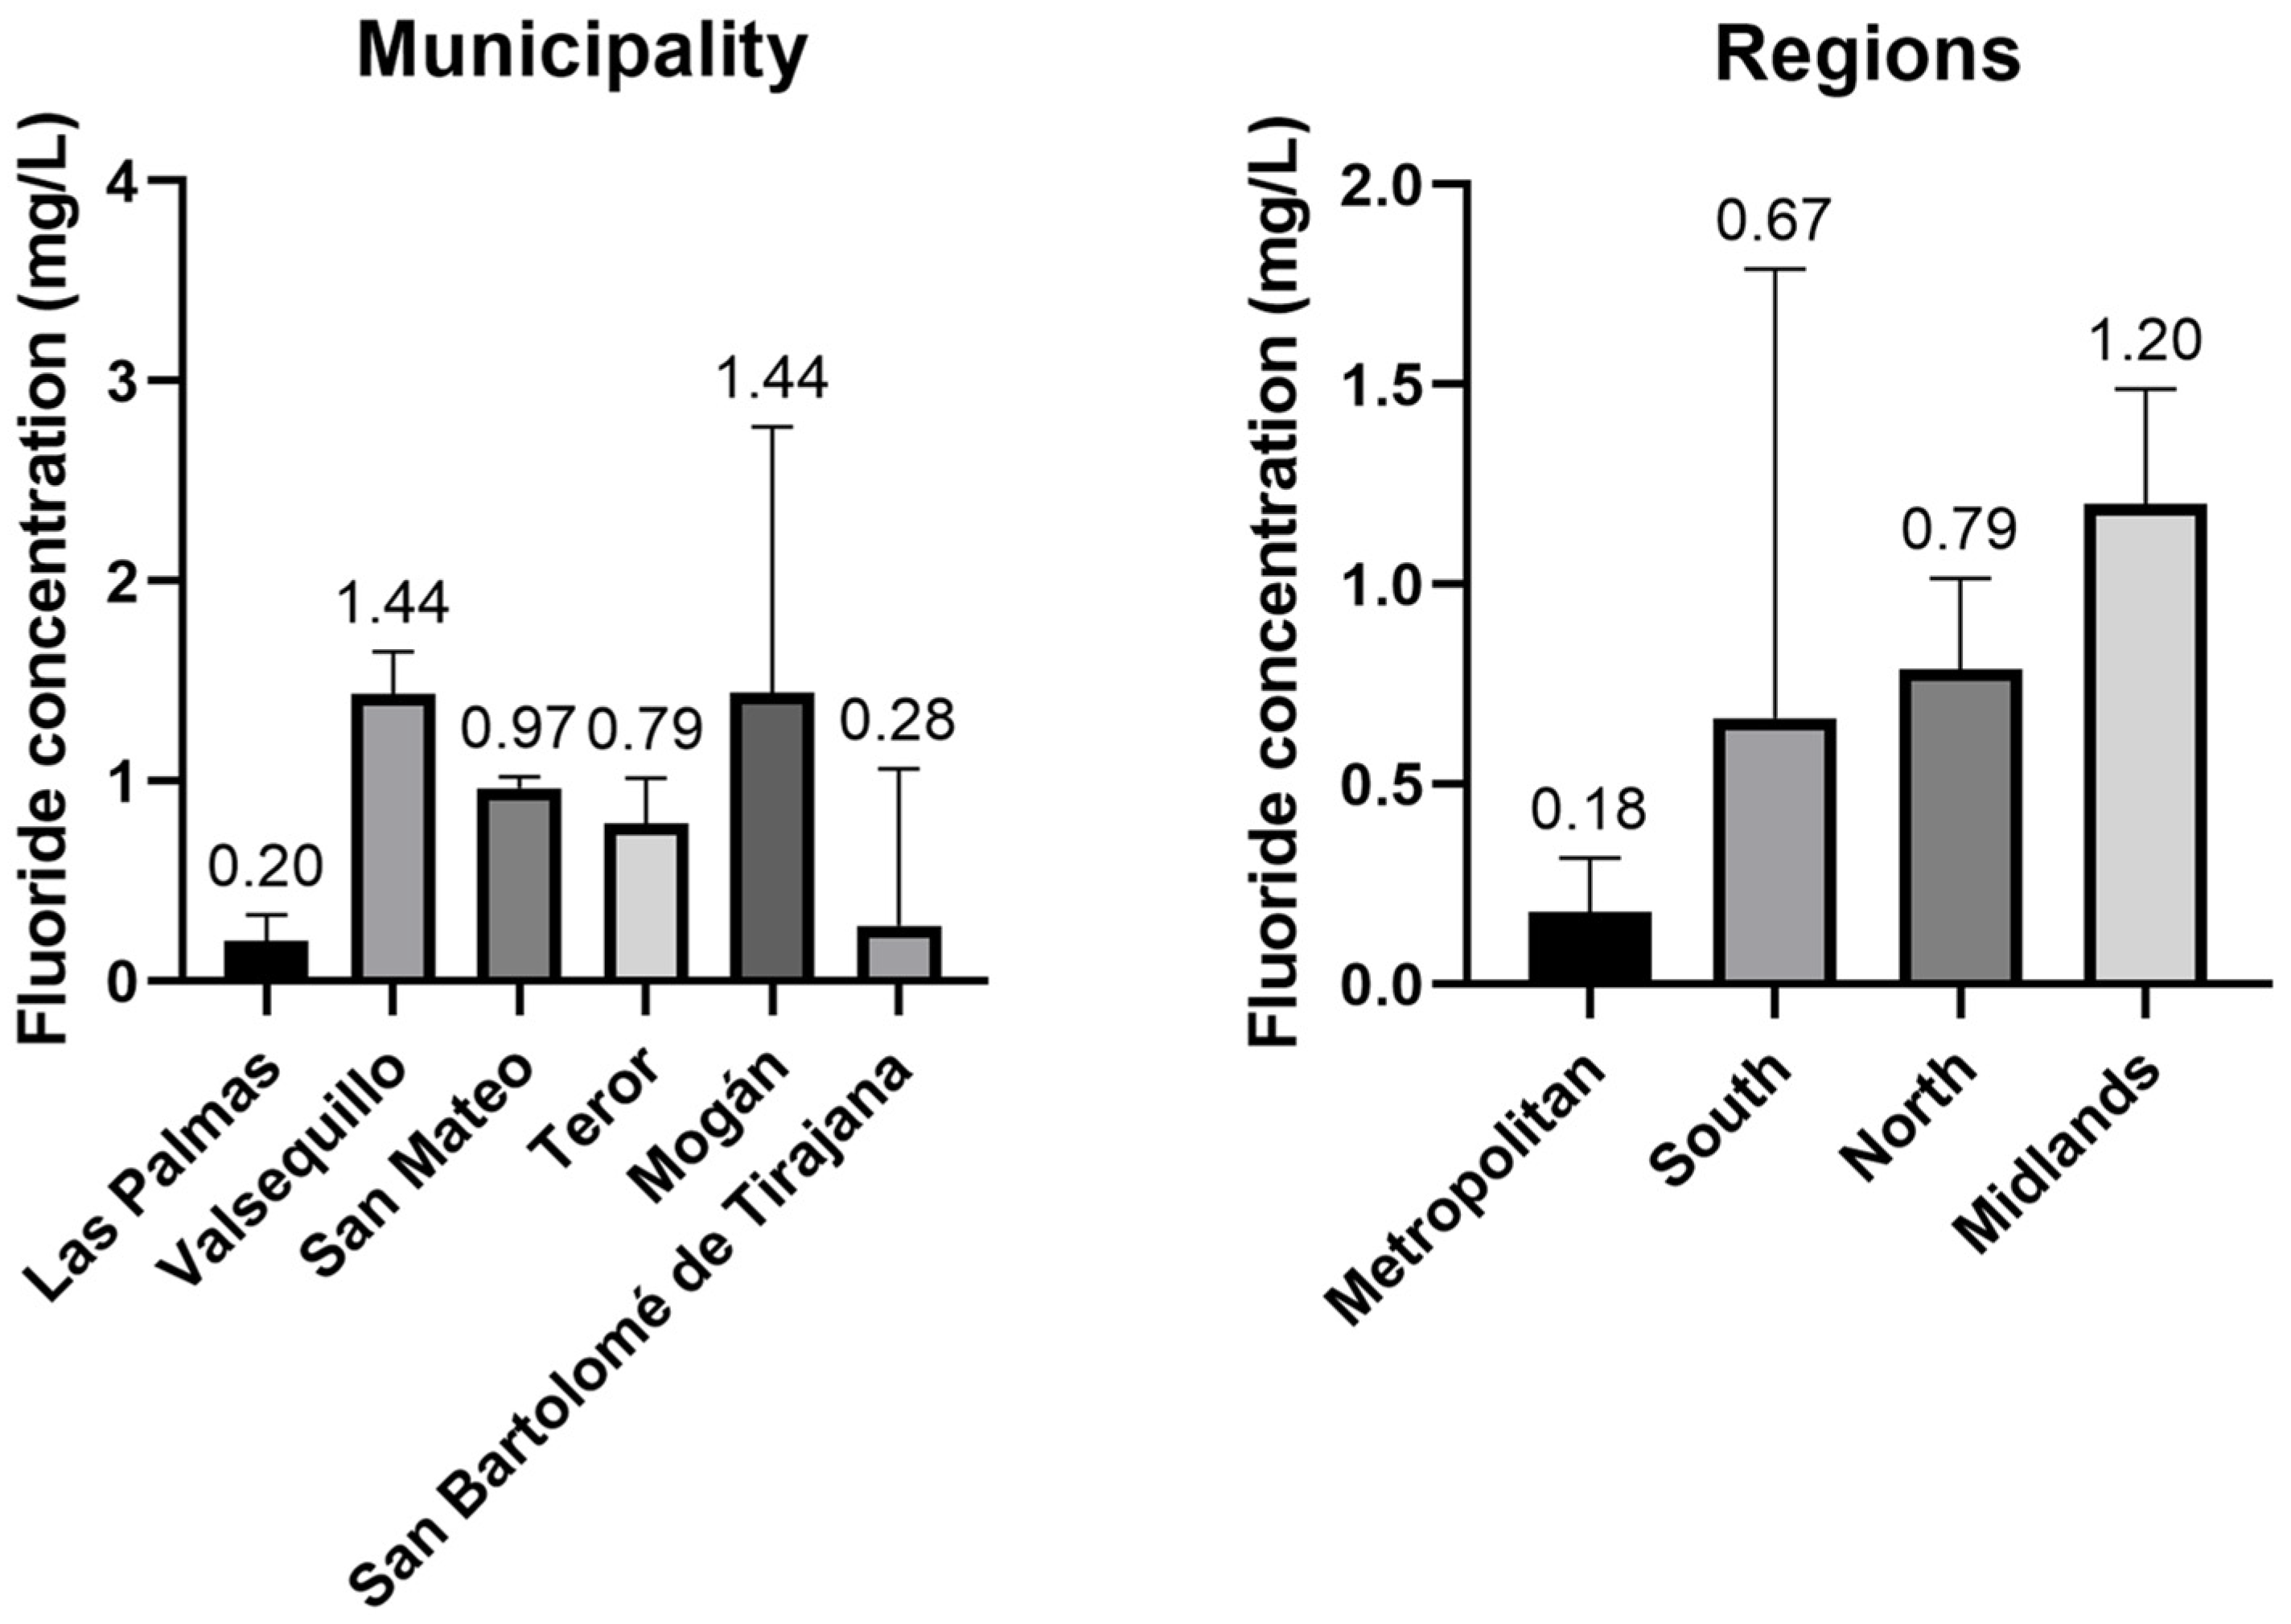
| Metropolitan | Las Palmas | 0.18 ± 0.13 | 0.04 | 0.38 |
| South | Mogán | 1.44 ± 1.33 | 0.03 | 2.99 |
| San Bartolomé de Tirajana | 0.28 ± 0.78 | 0.03 | 3.51 | |
| Midlands | San Mateo | 0.97 ± 0.06 | 0.90 | 1.03 |
| Valsequillo | 1.44 ± 0.21 | 1.21 | 1.77 | |
| North | Teror | 0.79 ± 0.23 | 0.42 | 1.18 |
| Region | Municipality | EDI (mg/Day) | Contribution Children (15–17 Years) and Adults (%) | Contribution Children (9–14 Years) (%) | ||||||
|---|---|---|---|---|---|---|---|---|---|---|
| 1 L/Day | 1.5 L/Day | 2 L/Day | 1 L/Day | 1.5 L/Day | 2 L/Day | 1 L/Day | 1.5 L/Day | 2 L/Day | ||
| Metropolitan | El Rosario | 1.62 | 2.44 | 3.25 | 23.2 | 34.8 | 46.4 | 32.5 | 48.7 | 65.0 |
| La Laguna | 1.51 | 2.27 | 3.03 | 21.6 | 32.5 | 43.3 | 30.3 | 45.4 | 60.6 | |
| Santa Cruz de Tenerife | 0.73 | 1.10 | 1.46 | 10.4 | 15.7 | 20.9 | 14.6 | 21.9 | 29.2 | |
| Tegueste | 5.39 | 8.09 | 10.78 | 77.0 | 116 | 154 | 108 | 162 | 216 | |
| North | El Sauzal | 7.00 | 10.51 | 14.01 | 100 | 150 | 200 | 140 | 210 | 280 |
| El Tanque | 2.13 | 3.20 | 4.26 | 30.4 | 45.7 | 60.9 | 42.6 | 63.9 | 85.2 | |
| Garachico | 3.32 | 4.99 | 6.65 | 47.5 | 71.2 | 95.0 | 66.5 | 99.7 | 133 | |
| Icod de los Vinos | 2.52 | 3.78 | 5.04 | 36.0 | 54.0 | 72.0 | 50.4 | 75.6 | 101 | |
| La Guancha | 3.82 | 5.73 | 7.63 | 54.5 | 81.8 | 109 | 76.3 | 115 | 153 | |
| La Matanza de Acentejo | 2.85 | 4.27 | 5.69 | 40.7 | 61.0 | 81.3 | 56.9 | 85.4 | 114 | |
| La Orotava | 4.92 | 7.39 | 9.85 | 70.4 | 106 | 141 | 98.5 | 148 | 197 | |
| La Victoria de Acentejo | 2.71 | 4.06 | 5.42 | 38.7 | 58.1 | 77.4 | 54.2 | 81.3 | 108 | |
| Los Realejos | 1.63 | 2.44 | 3.25 | 23.2 | 34.9 | 46.5 | 32.5 | 48.8 | 65.1 | |
| Los Silos | 2.41 | 3.62 | 4.83 | 34.5 | 51.7 | 68.9 | 48.3 | 72.4 | 96.5 | |
| Puerto de la Cruz | 0.75 | 1.12 | 1.50 | 10.7 | 16.0 | 21.4 | 15.0 | 22.4 | 29.9 | |
| San Juan de la Rambla | 2.73 | 4.09 | 5.46 | 39.0 | 58.5 | 78.0 | 54.6 | 81.9 | 109 | |
| Santa Úrsula | 2.75 | 4.12 | 5.50 | 39.3 | 58.9 | 78.5 | 55.0 | 82.5 | 110 | |
| Tacoronte | 0.42 | 0.63 | 0.84 | 6.0 | 9.0 | 12.1 | 8.4 | 12.7 | 16.9 | |
| South | Adeje | 0.27 | 0.41 | 0.55 | 3.9 | 5.9 | 7.8 | 5.5 | 8.2 | 10.9 |
| Arafo | 2.32 | 3.49 | 4.65 | 33.2 | 49.8 | 66.4 | 46.5 | 69.7 | 93.0 | |
| Arico | 0.84 | 1.26 | 1.68 | 12.0 | 18.0 | 24.0 | 16.8 | 25.2 | 33.6 | |
| Arona | 0.11 | 0.17 | 0.22 | 1.6 | 2.4 | 3.2 | 2.2 | 3.3 | 4.5 | |
| Candelaria | 0.96 | 1.44 | 1.92 | 13.7 | 20.6 | 27.5 | 19.2 | 28.8 | 38.4 | |
| Fasnia | 2.60 | 3.90 | 5.20 | 37.1 | 55.7 | 74.2 | 52.0 | 77.9 | 104 | |
| Granadilla de Abona | 1.16 | 1.74 | 2.31 | 16.5 | 24.8 | 33.1 | 23.1 | 34.7 | 46.3 | |
| Güimar | 0.99 | 1.48 | 1.97 | 14.1 | 21.1 | 28.2 | 19.7 | 29.6 | 39.4 | |
| San Miguel de Abona | 0.93 | 1.40 | 1.86 | 13.3 | 20.0 | 26.6 | 18.6 | 27.9 | 37.2 | |
| Santiago del Teide | 3.03 | 4.55 | 6.06 | 43.3 | 65.0 | 86.6 | 60.6 | 90.9 | 121 | |
| Vilaflor | 0.57 | 0.86 | 1.15 | 8.2 | 12.3 | 16.4 | 11.5 | 17.2 | 22.9 | |
| Region | Municipality | EDI (mg/Day) | Contribution Children (15–17 Years) and Adults (%) | Contribution Children (9–14 Years) (%) | ||||||
|---|---|---|---|---|---|---|---|---|---|---|
| 1 L/Day | 1.5 L/Day | 2 L/Day | 1 L/Day | 1.5 L/Day | 2 L/Day | 1 L/Day | 1.5 L/Day | 2 L/Day | ||
| Metropolitan | Las Palmas | 0.18 | 0.27 | 0.36 | 2.6 | 3.9 | 5.1 | 3.6 | 5.4 | 7.2 |
| South | Mogán | 1.44 | 2.16 | 2.88 | 20.6 | 30.9 | 41.1 | 28.8 | 43.2 | 57.6 |
| San Bartolomé de Tirajana | 0.28 | 0.42 | 0.56 | 4.0 | 6.0 | 8.0 | 5.6 | 8.4 | 11.2 | |
| Medianías | San Mateo | 0.97 | 1.46 | 1.94 | 13.9 | 21 | 28 | 19 | 29 | 39 |
| Valsequillo | 1.44 | 2.16 | 2.88 | 20.6 | 31 | 41 | 29 | 43 | 58 | |
| North | Teror | 0.79 | 1.19 | 1.58 | 11.3 | 17 | 23 | 16 | 24 | 32 |
Disclaimer/Publisher’s Note: The statements, opinions and data contained in all publications are solely those of the individual author(s) and contributor(s) and not of MDPI and/or the editor(s). MDPI and/or the editor(s) disclaim responsibility for any injury to people or property resulting from any ideas, methods, instructions or products referred to in the content. |
© 2023 by the authors. Licensee MDPI, Basel, Switzerland. This article is an open access article distributed under the terms and conditions of the Creative Commons Attribution (CC BY) license (https://creativecommons.org/licenses/by/4.0/).
Share and Cite
Revelo-Mejía, I.A.; Alejandro-Vega, S.; Paz-Montelongo, S.; Niebla-Canelo, D.; Cerdán-Pérez, S.; Rubio-Armendáriz, C.; Gutiérrez-Fernández, Á.J.; Hardisson, A.; Rodríguez-Díaz, R.; Hernández-Sánchez, C. Fluoride Levels in Supply Water from the Canary Islands Region. Foods 2023, 12, 745. https://doi.org/10.3390/foods12040745
Revelo-Mejía IA, Alejandro-Vega S, Paz-Montelongo S, Niebla-Canelo D, Cerdán-Pérez S, Rubio-Armendáriz C, Gutiérrez-Fernández ÁJ, Hardisson A, Rodríguez-Díaz R, Hernández-Sánchez C. Fluoride Levels in Supply Water from the Canary Islands Region. Foods. 2023; 12(4):745. https://doi.org/10.3390/foods12040745
Chicago/Turabian StyleRevelo-Mejía, Inés A., Samuel Alejandro-Vega, Soraya Paz-Montelongo, Daniel Niebla-Canelo, Santiago Cerdán-Pérez, Carmen Rubio-Armendáriz, Ángel J. Gutiérrez-Fernández, Arturo Hardisson, Rubí Rodríguez-Díaz, and Cintia Hernández-Sánchez. 2023. "Fluoride Levels in Supply Water from the Canary Islands Region" Foods 12, no. 4: 745. https://doi.org/10.3390/foods12040745
APA StyleRevelo-Mejía, I. A., Alejandro-Vega, S., Paz-Montelongo, S., Niebla-Canelo, D., Cerdán-Pérez, S., Rubio-Armendáriz, C., Gutiérrez-Fernández, Á. J., Hardisson, A., Rodríguez-Díaz, R., & Hernández-Sánchez, C. (2023). Fluoride Levels in Supply Water from the Canary Islands Region. Foods, 12(4), 745. https://doi.org/10.3390/foods12040745