
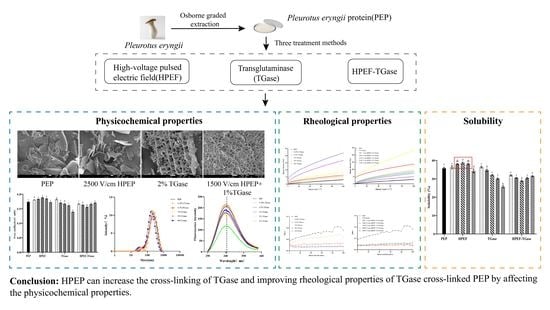
Investigation of Consequences of High-Voltage Pulsed Electric Field and TGase Cross-Linking on the Physicochemical and Rheological Properties of Pleurotus eryngii Protein
 and
and
Abstract
:
1. Introduction
2. Materials and Methods
2.1. Materials
2.2. Preparation of PEP
2.3. Treatment of PEP
2.3.1. Treatment of TGase
2.3.2. Treatment of HPEF
2.3.3. Combined Treatment of HPEF and TGase
2.4. Physicochemical Properties
2.4.1. Free Sulfhydryl Group
2.4.2. Scanning Electron Microscopy (SEM) Analysis
2.4.3. SDS-PAGE
2.4.4. Particle Size and Zeta-Potential
2.4.5. Intrinsic Fluorescence Emission Spectrum
2.4.6. Fourier Transform Infrared (FTIR) Spectroscopy
2.5. Rheological Property
2.5.1. Steady Rheological Properties of PEP Solution
2.5.2. Thixotropy of PEP Solution
2.6. Solubility
2.7. Statistical Analysis
3. Results
3.1. Free Sulfhydryl Group
3.2. SEM
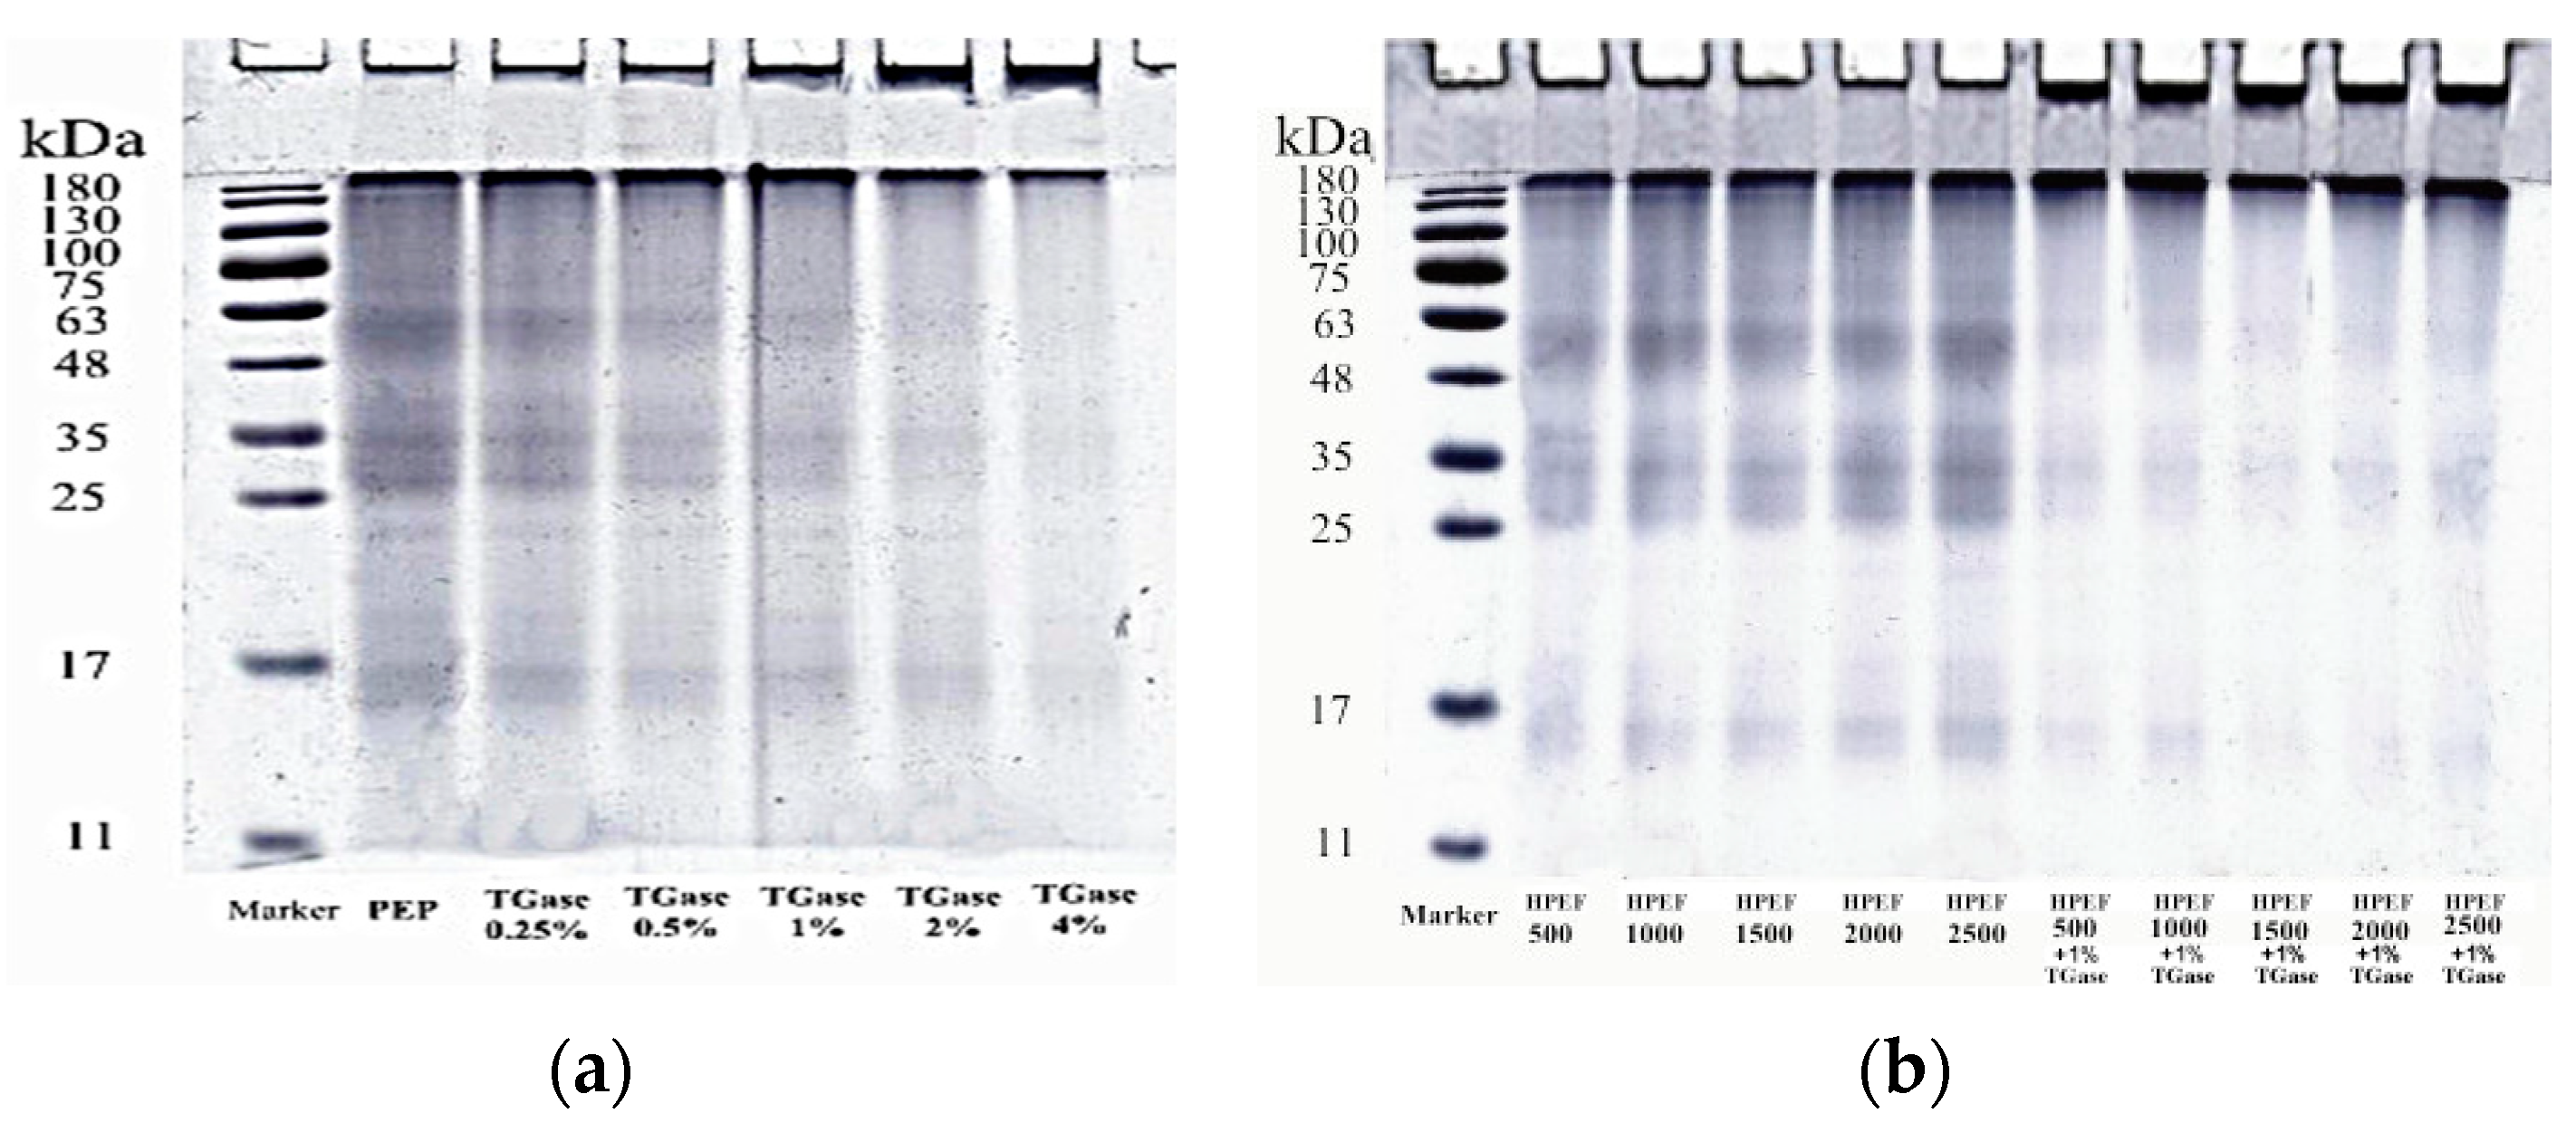
3.3. SDS-PAGE
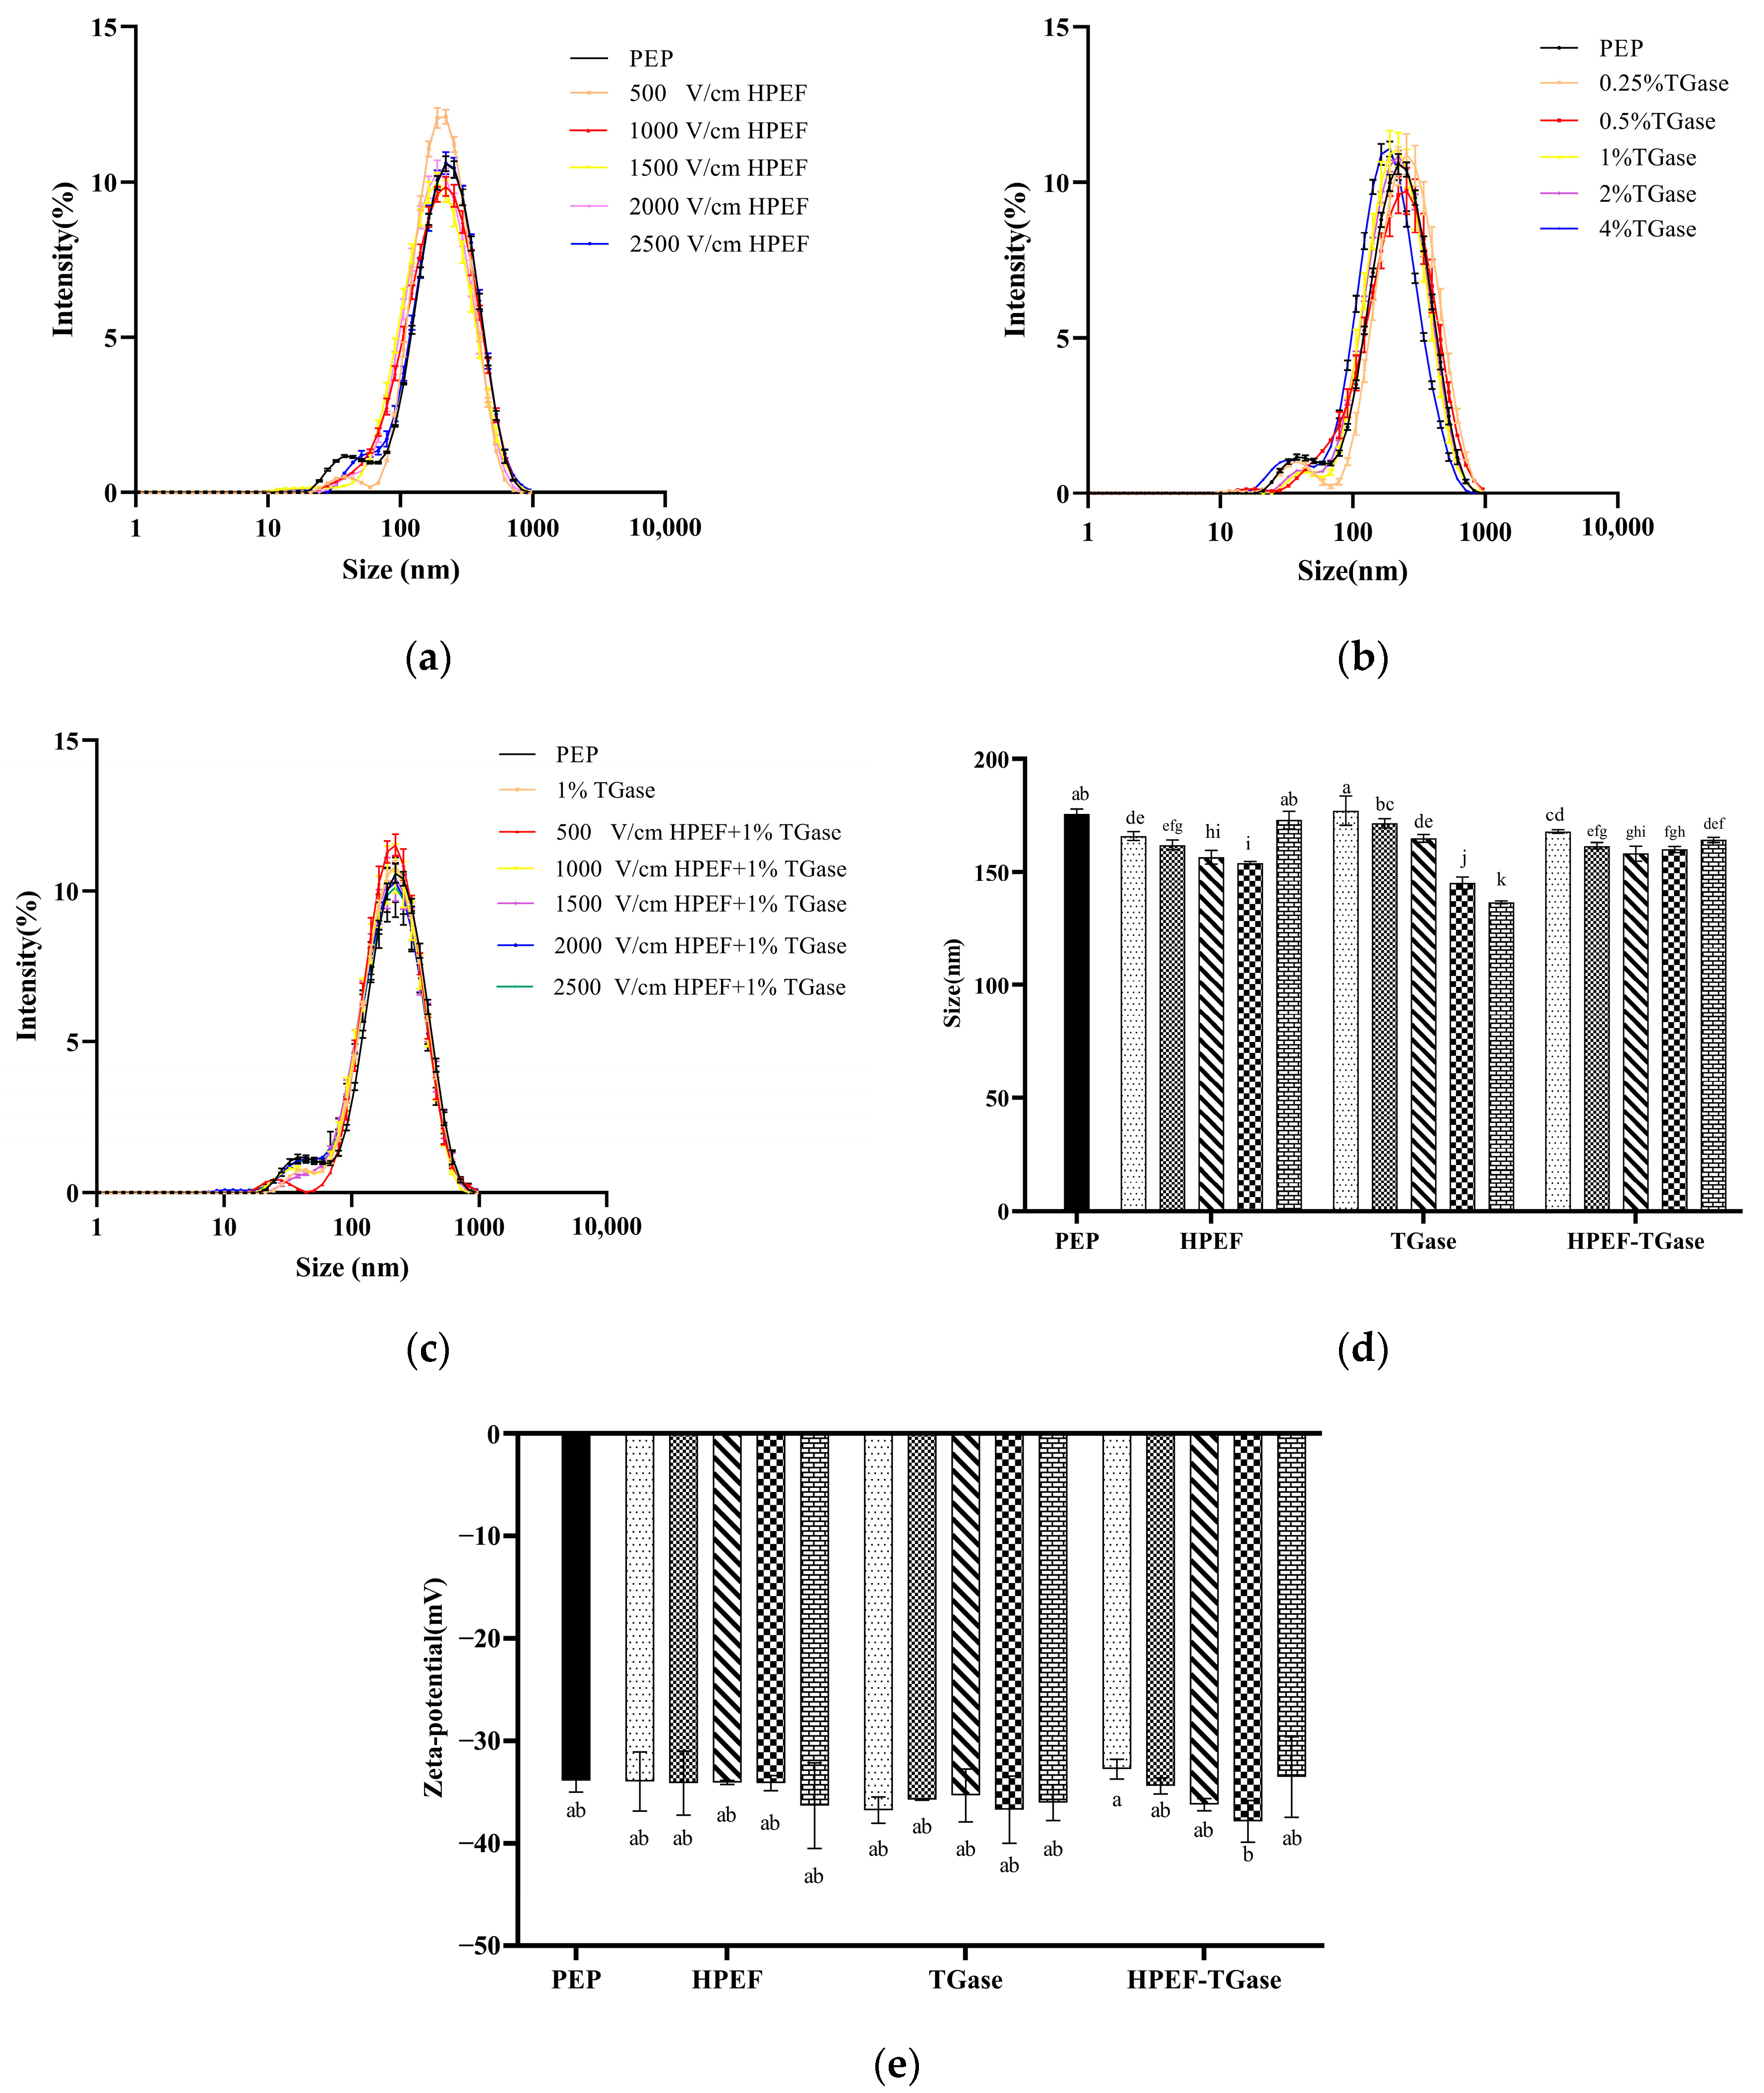
3.4. Particle Size Distribution, Average Particle Size
3.5. Zeta-Potential
3.6. Intrinsic Fluorescence Emission Spectrum
3.7. Secondary Structure
3.8. Rheological Properties
3.8.1. Steady-State Rheology
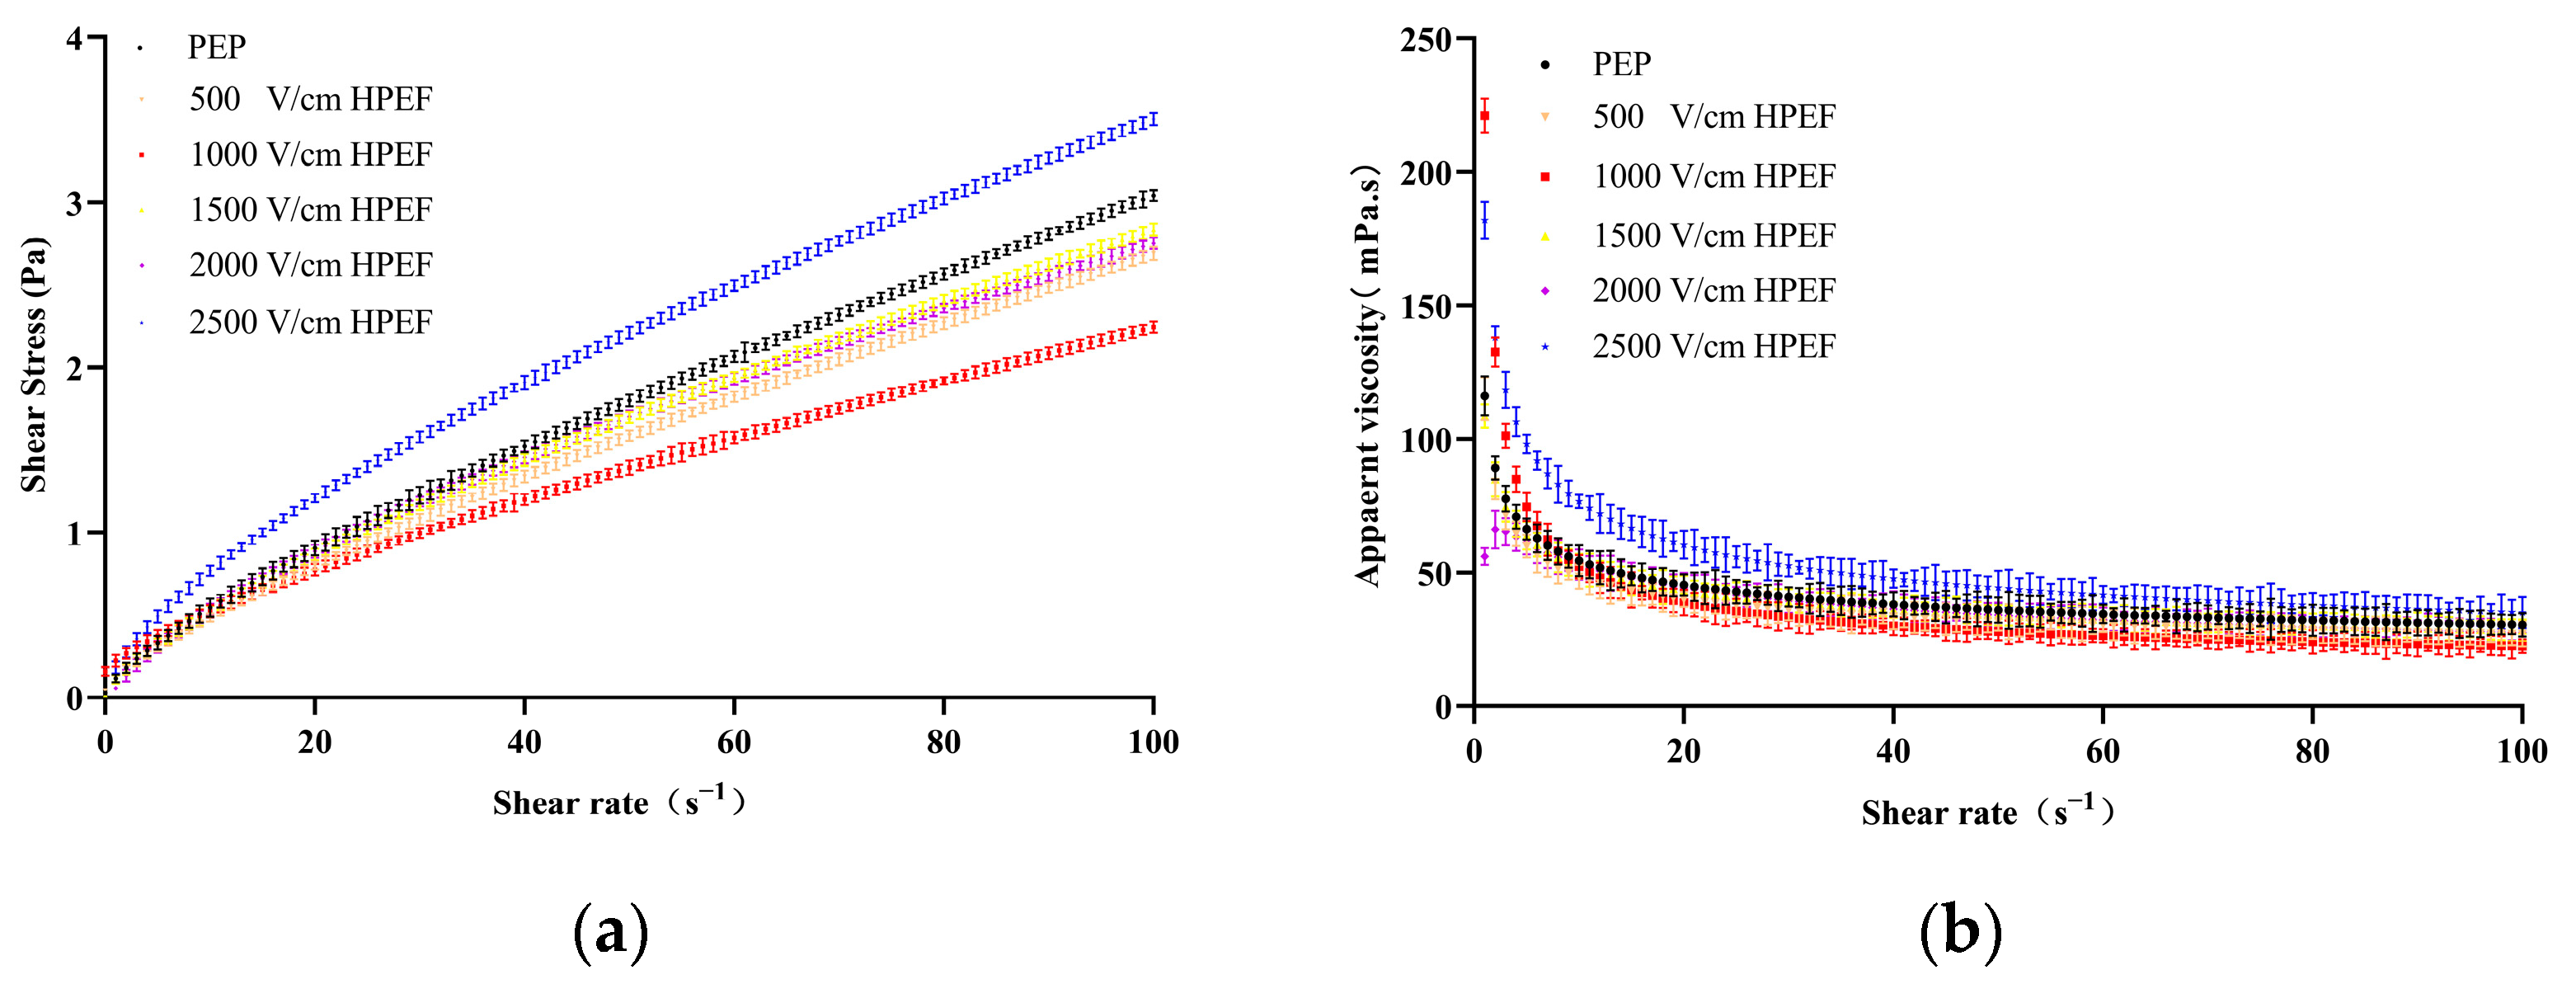
Effects of HPEF on Steady Rheological Properties of PEP Solution
Effects of TGase on Steady-State Rheological Properties of PEP
Effects of HPEF and TGase Treatment on Steady Rheological Properties of PEP Solution
3.8.2. Dynamic Rheological Properties of PEP Solution
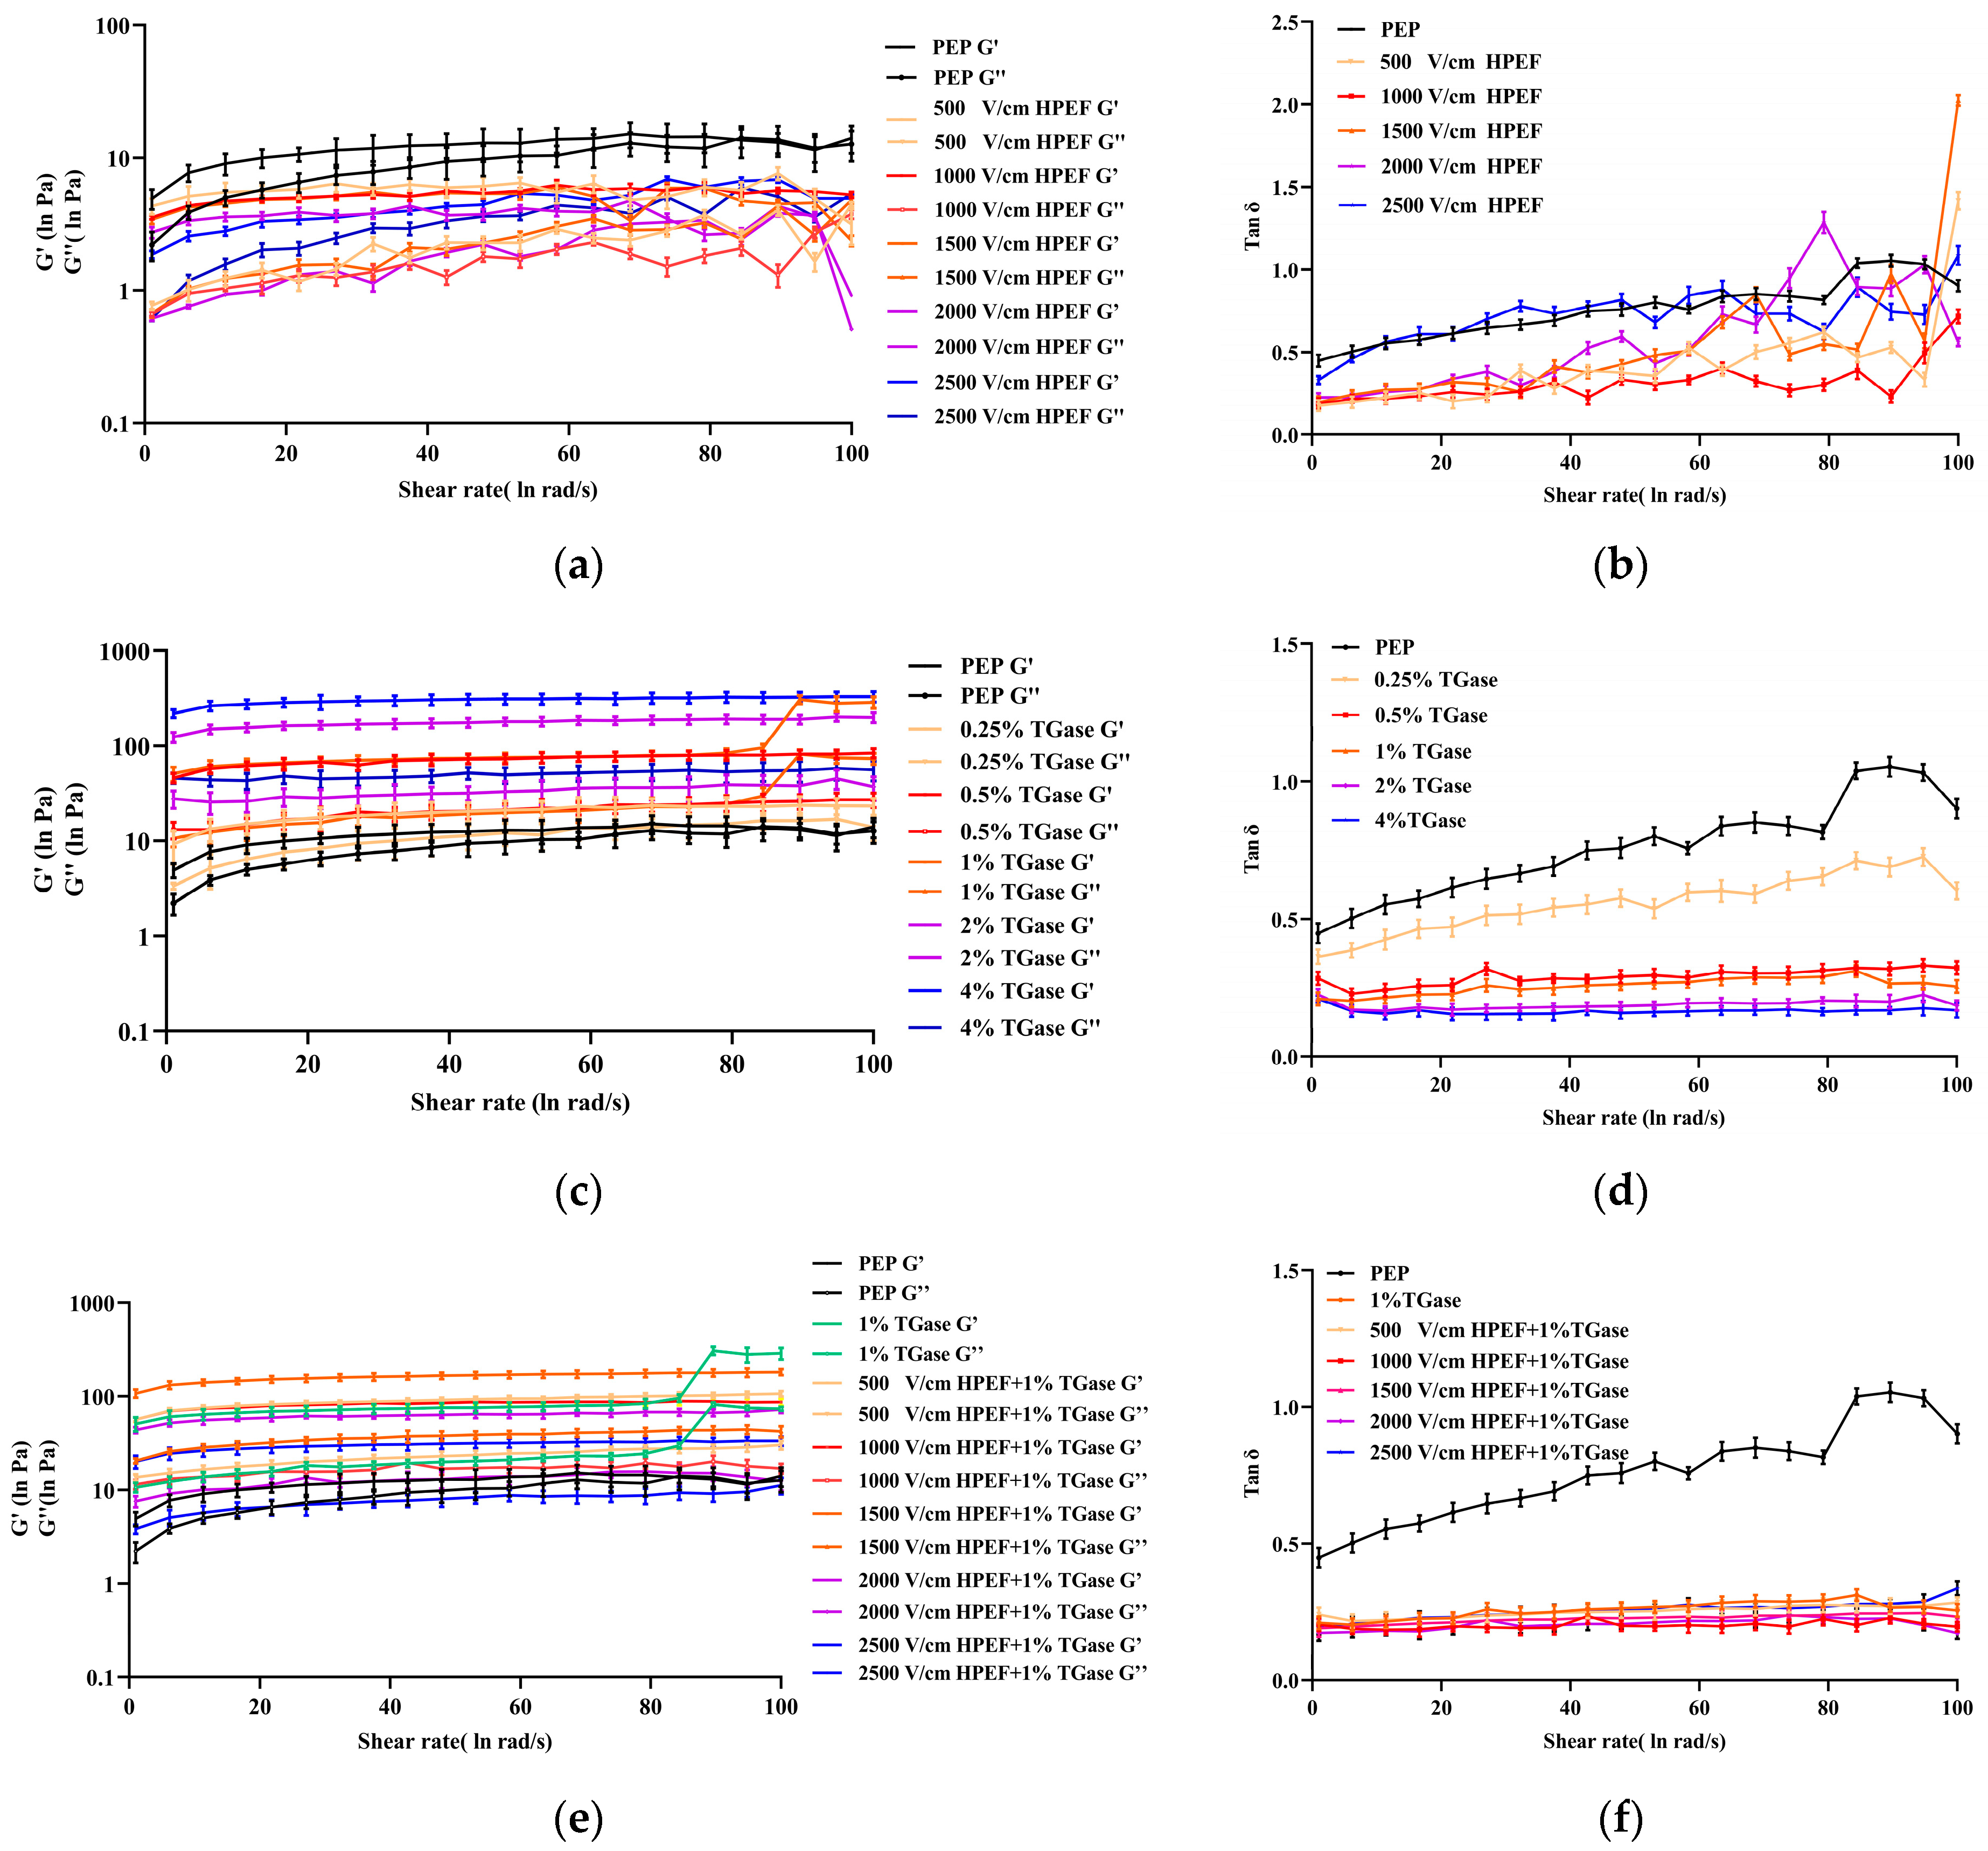
Effects of HPEF on Dynamic Rheological Properties of PEP Solution
Effects of TGase on Dynamic Rheological Properties of PEP Solution
Effects of HPEF and TGase Treatment on Dynamic Rheological Properties of PEP Solution
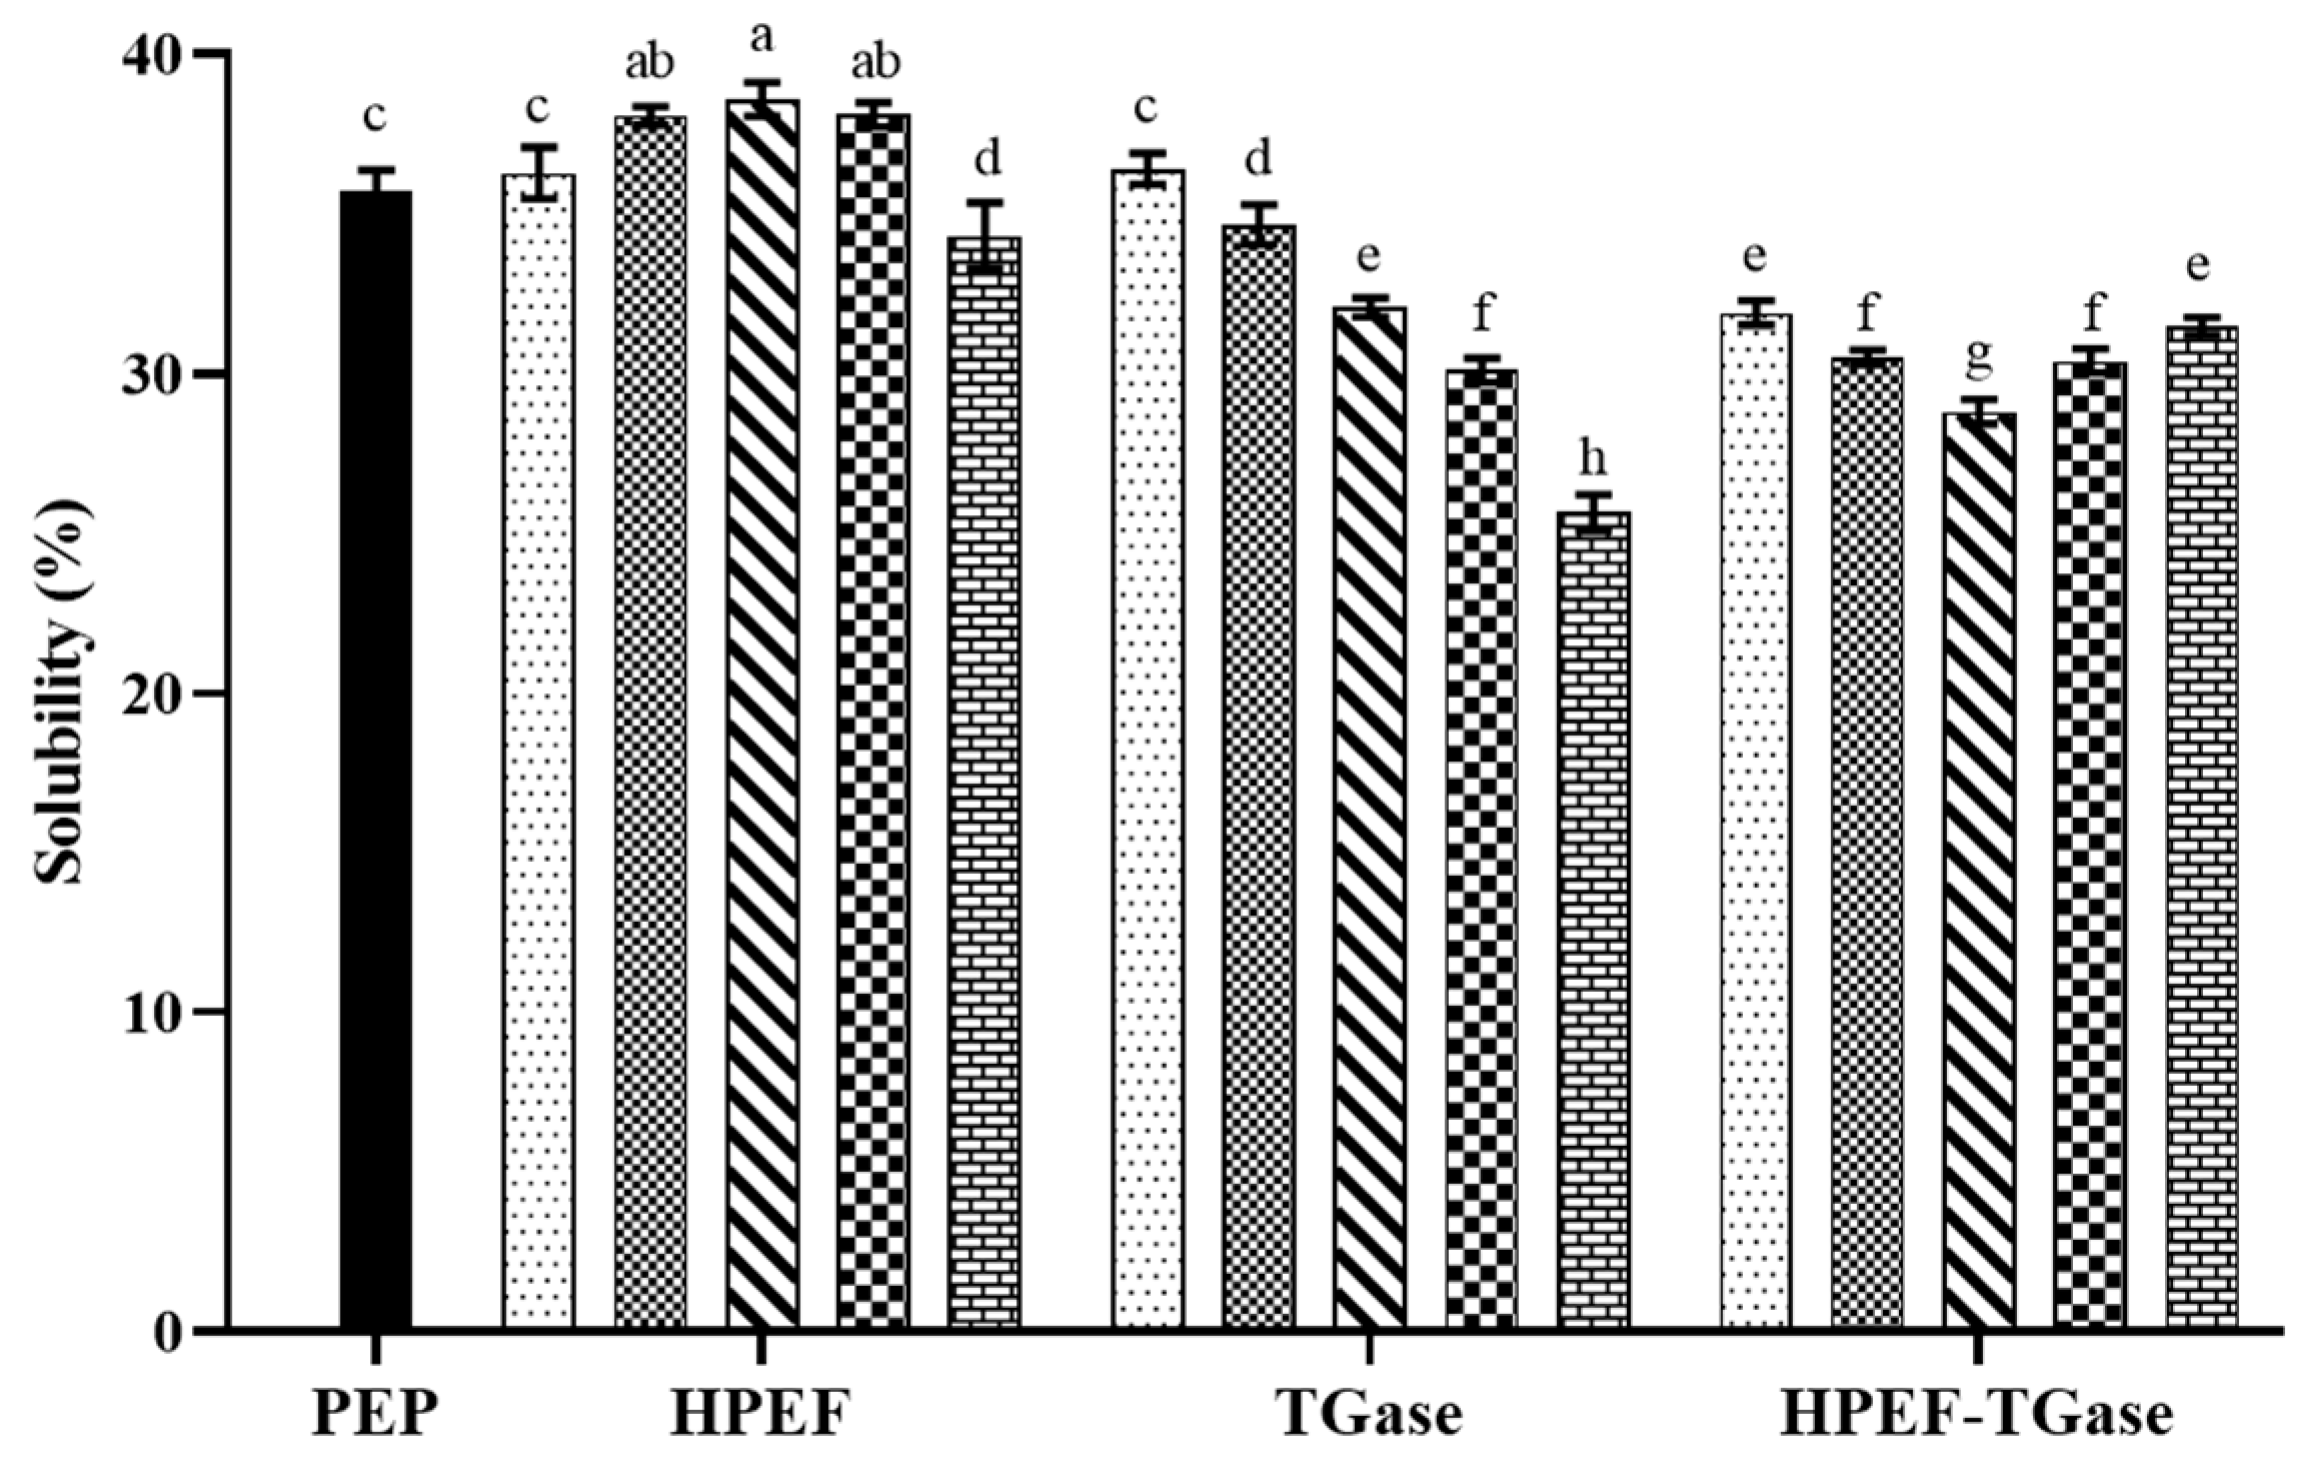
3.9. Solubility
4. Conclusions
Author Contributions
Funding
Institutional Review Board Statement
Informed Consent Statement
Data Availability Statement
Conflicts of Interest
References
- Zhang, J.; Liu, L.; Liu, H.; Yoon, A.; Rizvi, S.S.; Wang, Q. Changes in conformation and quality of vegetable protein during texturization process by extrusion. Crit. Rev. Food Sci. Nutr. 2019, 59, 3267–3280. [Google Scholar] [CrossRef] [PubMed]
- Yuan, B.; Zhao, L.; Rakariyatham, K.; Han, Y.; Gao, Z.; Kimatu, B.M.; Hu, Q.; Xiao, H. Isolation of a novel bioactive protein from an edible mushroom Pleurotus eryngii and its anti-inflammatory potential. Food Funct. 2017, 8, 2175–2183. [Google Scholar] [CrossRef] [PubMed]
- Barać, M.B.; Stanojević, S.P.; Jovanović, S.T.; Pešić, M.B. Soy protein modification: A review. Atca Period. Technol. 2004, 35, 3–16. [Google Scholar] [CrossRef]
- Robinson, N.E. Protein deamidation. Proc. Natl. Acad. Sci. USA 2002, 99, 5283–5288. [Google Scholar] [CrossRef]
- Heck, T.; Faccio, G.; Richter, M.; Thöny-Meyer, L. Enzyme-catalyzed protein crosslinking. Appl. Microbiol. Biotechnol. 2013, 97, 461–475. [Google Scholar] [CrossRef]
- Sato, H.; Hayashi, E.; Yamada, N.; Yatagai, M.; Takahara, Y. Further studies on the site-specific protein modification by microbial transglutaminase. Bioconjug. Chem. 2001, 12, 701–710. [Google Scholar] [CrossRef]
- Zhang, Y.M. Extraction and functional proterties of variety proteins from Pleurotus eryngii. Master’s Thesis, Shanxi Agricultural University, Taiyuan, China, 2019. [Google Scholar]
- Gauche, C.; Barreto, P.L.M.; Bordignon-Luiz, M.T. Effect of thermal treatment on whey protein polymerization by transglutaminase: Implications for functionality in processed dairy foods. LWT 2010, 43, 214–219. [Google Scholar] [CrossRef]
- Wang, C.Y.; Li, T.Q.; Ma, L.; Li, T.; Yu, H.Y.; Hou, J.C.; Jiang, Z.M. Consequences of superfine grinding treatment on structure, physicochemical and rheological properties of transglutaminase-crosslinked whey protein isolate. Food Chem. 2020, 309, 125757. [Google Scholar] [CrossRef]
- Arshad, R.N.; Abdul-Malek, Z.; Roobab, U.; Munir, M.A.; Naderipour, A.; Qureshi, M.I.; Bekhit, A.E.-D.; Liu, Z.W.; Aadil, R.M. Pulsed electric field: A potential alternative towards a sustainable food processing. Trends Food Sci. Technol. 2021, 111, 43–54. [Google Scholar] [CrossRef]
- Zhang, S.; Sun, L.; Ju, H.; Bao, Z.; Zeng, X.-a.; Lin, S. Research advances and application of pulsed electric field on proteins and peptides in food. Food Res. Int. 2021, 139, 109914. [Google Scholar] [CrossRef]
- Melchior, S.; Calligaris, S.; Bisson, G.; Manzocco, L. Understanding the impact of moderate-intensity pulsed electric fields (MIPEF) on structural and functional characteristics of pea, rice and gluten concentrates. Food Bioproc. Tech. 2020, 13, 2145–2155. [Google Scholar] [CrossRef]
- Zhang, L.; Wang, L.J.; Jiang, W.; Qian, J.Y. Effect of pulsed electric field on functional and structural properties of canola protein by pretreating seeds to elevate oil yield. LWT 2017, 84, 73–81. [Google Scholar] [CrossRef]
- Kumar, A.; Nayak, R.; Purohit, S.R.; Rao, P.S. Impact of UV-C irradiation on solubility of Osborne protein fractions in wheat flour. Food Hydrocoll. 2021, 110, 105845. [Google Scholar] [CrossRef]
- Roy, S.; Kumar, V. A practical approach on SDS PAGE for separation of protein. Int. J. Sci. Res. 2014, 3, 955–960. [Google Scholar]
- Song, X.Z.; Zhou, C.J.; Fu, F.; Chen, Z.L.; Wu, Q.L. Effect of high-pressure homogenization on particle size and film properties of soy protein isolate. Ind. Crops Prod. 2013, 43, 538–544. [Google Scholar] [CrossRef]
- Agyare, K.K.; Damodaran, S. pH-stability and thermal properties of microbial transglutaminase-treated whey protein isolate. J. Agric. Food Chem. 2010, 58, 1946–1953. [Google Scholar] [CrossRef]
- Qian, J.Y.; Ma, L.J.; Wang, L.J.; Jiang, W. Effect of pulsed electric field on structural properties of protein in solid state. LWT 2016, 74, 331–337. [Google Scholar] [CrossRef]
- Song, Y.; Zheng, Q. Dynamic rheological properties of wheat flour dough and proteins. Trends Food Sci. Technol. 2007, 18, 132–138. [Google Scholar] [CrossRef]
- Simonian, M.H.; Smith, J.A. Spectrophotometric and colorimetric determination of protein concentration. Curr. Protoc. Mol. Biol. 1996, 76, 10-1. [Google Scholar] [CrossRef]
- Zhao, W.; Yang, R. Pulsed electric field induced aggregation of food proteins: Ovalbumin and bovine serum albumin. Food Bioproc. Tech. 2012, 5, 1706–1714. [Google Scholar] [CrossRef]
- Hu, X.; Zhao, M.; Sun, W.; Zhao, G.; Ren, J. Effects of microfluidization treatment and transglutaminase cross-linking on physicochemical, functional, and conformational properties of peanut protein isolate. J. Agric. Food Chem. 2011, 59, 8886–8894. [Google Scholar] [CrossRef]
- Ding, X.; Zeng, N.; Zhang, G.; Pan, J.; Hu, X.; Gong, D. Influence of transglutaminase-assisted ultrasound treatment on the structure and functional properties of soy protein isolate. J. Food Process. Preserv. 2019, 43, e14203. [Google Scholar] [CrossRef]
- Gujral, H.S.; Rosell, C.M. Functionality of rice flour modified with a microbial transglutaminase. J. Cereal. Sci. 2004, 39, 225–230. [Google Scholar] [CrossRef]
- Gerrard, J.A. Protein–protein crosslinking in food: Methods, consequences, applications. Trends Food Sci. Technol. 2002, 13, 391–399. [Google Scholar] [CrossRef]
- Eissa, A.S.; Bisram, S.; Khan, S.A. Polymerization and gelation of whey protein isolates at low pH using transglutaminase enzyme. J. Agric. Food Chem. 2004, 52, 4456–4464. [Google Scholar] [CrossRef]
- Wen, X.; Jin, F.; Regenstein, J.M.; Wang, F. Transglutaminase induced gels using bitter apricot kernel protein: Chemical, textural and release properties. Food Biosci. 2018, 26, 15–22. [Google Scholar] [CrossRef]
- Guo, J.; Jin, Y.C.; Yang, X.Q.; Yu, S.J.; Yin, S.W.; Qi, J.R. Computed microtomography and mechanical property analysis of soy protein porous hydrogel prepared by homogenizing and microbial transglutaminase cross-linking. Food Hydrocoll. 2013, 31, 220–226. [Google Scholar] [CrossRef]
- Han, X.; Liang, Z.Q.; Tian, S.F.; Liu, L.; Wang, S. Modification of whey-soybean mixed protein by sequential high-pressure homogenization and transglutaminase treatment. LWT 2022, 172, 114217. [Google Scholar] [CrossRef]
- Zhang, P.; Hu, T.; Feng, S.; Xu, Q.; Zheng, T.; Zhou, M.; Chu, X.; Huang, X.; Lu, X.; Pan, S.; et al. Effect of high intensity ultrasound on transglutaminase-catalyzed soy protein isolate cold set gel. Ultrason Sonochem 2016, 29, 380–387. [Google Scholar] [CrossRef]
- Shi, R.; Ma, C.; Li, J.; Wang, K.; Qayum, A.; Wang, C.; Li, A.; Jiang, Z. Characterization of TGase-induced whey protein isolate: Impact of HPHP pretreatment. J. Food Eng. 2020, 282, 110025. [Google Scholar] [CrossRef]
- Yang, A.; Xia, J.; Gong, Y.; Deng, H.; Wu, Z.; Li, X.; Tong, P.; Chen, H. Changes in the structure, digestibility and immunoreactivities of glycinin induced by the cross-linking of microbial transglutaminase following heat denaturation. Int. J. Food Sci. Technol. 2017, 52, 2265–2273. [Google Scholar] [CrossRef]
- Zhang, T.; Zhao, Y.; Tian, X.; Liu, J.; Ye, H.; Shen, X. Effect of ultrasound pretreatment on structural, physicochemical, rheological and gelation properties of transglutaminase cross-linked whey protein soluble aggregates. Ultrason Sonochem. 2021, 74, 105553. [Google Scholar] [CrossRef] [PubMed]
- Zhang, M.; Wang, P.; Zou, M.; Yang, R.; Tian, M.; Gu, Z. Microbial transglutaminase-modified protein network and its importance in enhancing the quality of high-fiber tofu with okara. Food Chem. 2019, 289, 169–176. [Google Scholar] [CrossRef] [PubMed]
- Li, Y.Q.; Chen, Z.X.; Mo, H.Z. Effects of pulsed electric fields on physicochemical properties of soybean protein isolates. LWT 2007, 40, 1167–1175. [Google Scholar] [CrossRef]
- Akbari, A.; Wu, J. Cruciferin nanoparticles: Preparation, characterization and their potential application in delivery of bioactive compounds. Food Hydrocoll. 2016, 54, 107–118. [Google Scholar] [CrossRef]
- Wu, L.; Zhao, W.; Yang, R.; Chen, X. Effects of pulsed electric fields processing on stability of egg white proteins. J. Food Eng. 2014, 139, 13–18. [Google Scholar] [CrossRef]
- Tang, C.; Yang, X.Q.; Chen, Z.; Wu, H.; Peng, Z.Y. Physicochemical and structural characteristics of sodium caseinate biopolymers induced by microbial transglutaminase. J. Food Biochem. 2005, 29, 402–421. [Google Scholar] [CrossRef]
- Sun, C.; Wu, T.; Liu, R.; Liang, B.; Tian, Z.; Zhang, E.; Zhang, M. Effects of superfine grinding and microparticulation on the surface hydrophobicity of whey protein concentrate and its relation to emulsions stability. Food Hydrocoll. 2015, 51, 512–518. [Google Scholar] [CrossRef]
- Zhao, X.; Zhu, H.; Zhang, G.; Tang, W. Effect of superfine grinding on the physicochemical properties and antioxidant activity of red grape pomace powders. Powder Technol. 2015, 286, 838–844. [Google Scholar] [CrossRef]
- Babiker, E.E. Effect of transglutaminase treatment on the functional properties of native and chymotrypsin-digested soy protein. Food Chem. 2000, 70, 139–145. [Google Scholar] [CrossRef]
- Wang, H.; You, S.P.; Wang, W.H.; Zeng, Y.; Su, R.X.; Qi, W.; Wang, K.; He, Z.M. Laccase-catalyzed soy protein and gallic acid complexation: Effects on conformational structures and antioxidant activity. Food Chem. 2022, 375, 131865. [Google Scholar] [CrossRef]
- Vega-Mercado, H.; Powers, J.; Barbosa-Cánovas, G.V.; Swanson, B.G.; Luedecke, L. Inactivation of a protease from Pseudomonas fluorescens M3/6 using high voltage pulsed electric fields. In Proceedings of the IFT Annual Meeting, Anaheim, CA, USA, 1 January 1995; p. 267. [Google Scholar]
- Marcoa, C.; Rosell, C.M. Effect of different protein isolates and transglutaminase on rice flour properties. J. Food Eng. 2008, 84, 132–139. [Google Scholar] [CrossRef]
- Hemar, Y.; Augustin, M.; Cheng, L.J.; Sanguansri, P.; Swiergon, P.; Wan, J. The effect of pulsed electric field processing on particle size and viscosity of milk and milk concentrates. Milchwissenschaft 2011, 66, 126–128. [Google Scholar] [CrossRef]
- Xiang, B.Y.; Simpson, M.V.; Ngadi, M.O.; Simpson, B.K. Effect of pulsed electric field on the rheological and colour properties of soy milk. Int. J. Food Sci. Nutr. 2011, 62, 787–793. [Google Scholar] [CrossRef] [PubMed]
- Tang, Q.; Munro, P.A.; McCarthy, O.J. Rheology of whey protein concentrate solutions as a function of concentration, temperature, pH and salt concentration. J. Dairy Res. 1993, 60, 349–361. [Google Scholar] [CrossRef]
- Adapa, S.; Schmidt, K.; Toledo, R. Functional properties of skim milk processed with continuous high pressure throttling. J. Dairy Sci. 1997, 80, 1941–1948. [Google Scholar] [CrossRef]
- Sun, C.; Liu, R.; Ni, K.; Wu, T.; Luo, X.; Liang, B.; Zhang, M.J. Reduction of particle size based on superfine grinding: Effects on structure, rheological and gelling properties of whey protein concentrate. J. Food Eng. 2016, 186, 69–76. [Google Scholar] [CrossRef]
- Wang, K.; Luo, S.; Cai, J.; Sun, Q.; Zhao, Y.; Zhong, X.; Jiang, S.; Zheng, Z. Effects of partial hydrolysis and subsequent cross-linking on wheat gluten physicochemical properties and structure. Food Chem. 2016, 197, 168–174. [Google Scholar] [CrossRef] [PubMed]
- Shi, R.J.; Chen, Z.J.; Fan, W.X.; Chang, M.C.; Meng, J.L.; Liu, J.Y.; Feng, C.P. Research on the physicochemical and digestive properties of Pleurotus eryngii protein. Int. J. Food Prop. 2018, 21, 2785–2806. [Google Scholar] [CrossRef]
- Deng, C.; Liu, Y.; Li, J.; Yadav, M.P.; Yin, L. Diverse rheological properties, mechanical characteristics and microstructures of corn fiber gum/soy protein isolate hydrogels prepared by laccase and heat treatment. Food Hydrocoll. 2018, 76, 113–122. [Google Scholar] [CrossRef]
- Chen, H.; Han, M. Raman spectroscopic study of the effects of microbial transglutaminase on heat-induced gelation of pork myofibrillar proteins and its relationship with textural characteristics. Food Res. Int. 2011, 44, 1514–1520. [Google Scholar] [CrossRef]
- Djoullah, A.; Husson, F.; Saurel, R.J.F.H. Gelation behaviors of denaturated pea albumin and globulin fractions during transglutaminase treatment. Food Hydrocoll. 2018, 77, 636–645. [Google Scholar] [CrossRef]
- Shi, A.M.; Jiao, B.; Liu, H.Z.; Zhu, S.; Shen, M.J.; Feng, X.L.; Hu, H.; Liu, L.; Faisal, S.; Wang, Q. Effects of proteolysis and transglutaminase crosslinking on physicochemical characteristics of walnut protein isolate. LWT 2018, 97, 662–667. [Google Scholar] [CrossRef]
- Jiang, L.Z.; Wang, Z.J.; Li, Y.; Meng, X.H.; Sui, X.N.; Qi, B.K.; Zhou, L.Y. Relationship between surface hydrophobicity and structure of soy protein isolate subjected to different ionic strength. Int. J. Food Prop. 2015, 18, 1059–1074. [Google Scholar] [CrossRef]
- Chen, Y.; Chen, J.; Chang, C.; Chen, J.; Cao, F.; Zhao, J.; Zheng, Y.; Zhu, J. Physicochemical and functional properties of proteins extracted from three microalgal species. Food Hydrocoll. 2019, 96, 510–517. [Google Scholar] [CrossRef]
 : representative control group PEP. In the first group,
  represent HPEF-PEP of 500, 1000, 1500 2000, and 2500 V/cm, respectively. In the second group,
  represent TGase-PEP of 0.25, 0.5, 1, 2, and 4%, respectively. In the third group,
  represent HPEF-TGase-PEP treatments of HPEF-500, 1000, 1500, 2000, and 2500 V/cm, respectively, with 1% TGase. The average particle size group and the solubility are the same as the free sulfhydryl. The different lowercase letters indicate a significant difference between groups (p < 0.05).
: representative control group PEP. In the first group, represent HPEF-PEP of 500, 1000, 1500 2000, and 2500 V/cm, respectively. In the second group, represent TGase-PEP of 0.25, 0.5, 1, 2, and 4%, respectively. In the third group, represent HPEF-TGase-PEP treatments of HPEF-500, 1000, 1500, 2000, and 2500 V/cm, respectively, with 1% TGase. The average particle size group and the solubility are the same as the free sulfhydryl. The different lowercase letters indicate a significant difference between groups (p < 0.05).
represent HPEF-TGase-PEP treatments of HPEF-500, 1000, 1500, 2000, and 2500 V/cm, respectively, with 1% TGase. The average particle size group and the solubility are the same as the free sulfhydryl. The different lowercase letters indicate a significant difference between groups (p < 0.05).
: representative control group PEP. In the first group, represent HPEF-PEP of 500, 1000, 1500 2000, and 2500 V/cm, respectively. In the second group, represent TGase-PEP of 0.25, 0.5, 1, 2, and 4%, respectively. In the third group, represent HPEF-TGase-PEP treatments of HPEF-500, 1000, 1500, 2000, and 2500 V/cm, respectively, with 1% TGase. The average particle size group and the solubility are the same as the free sulfhydryl. The different lowercase letters indicate a significant difference between groups (p < 0.05).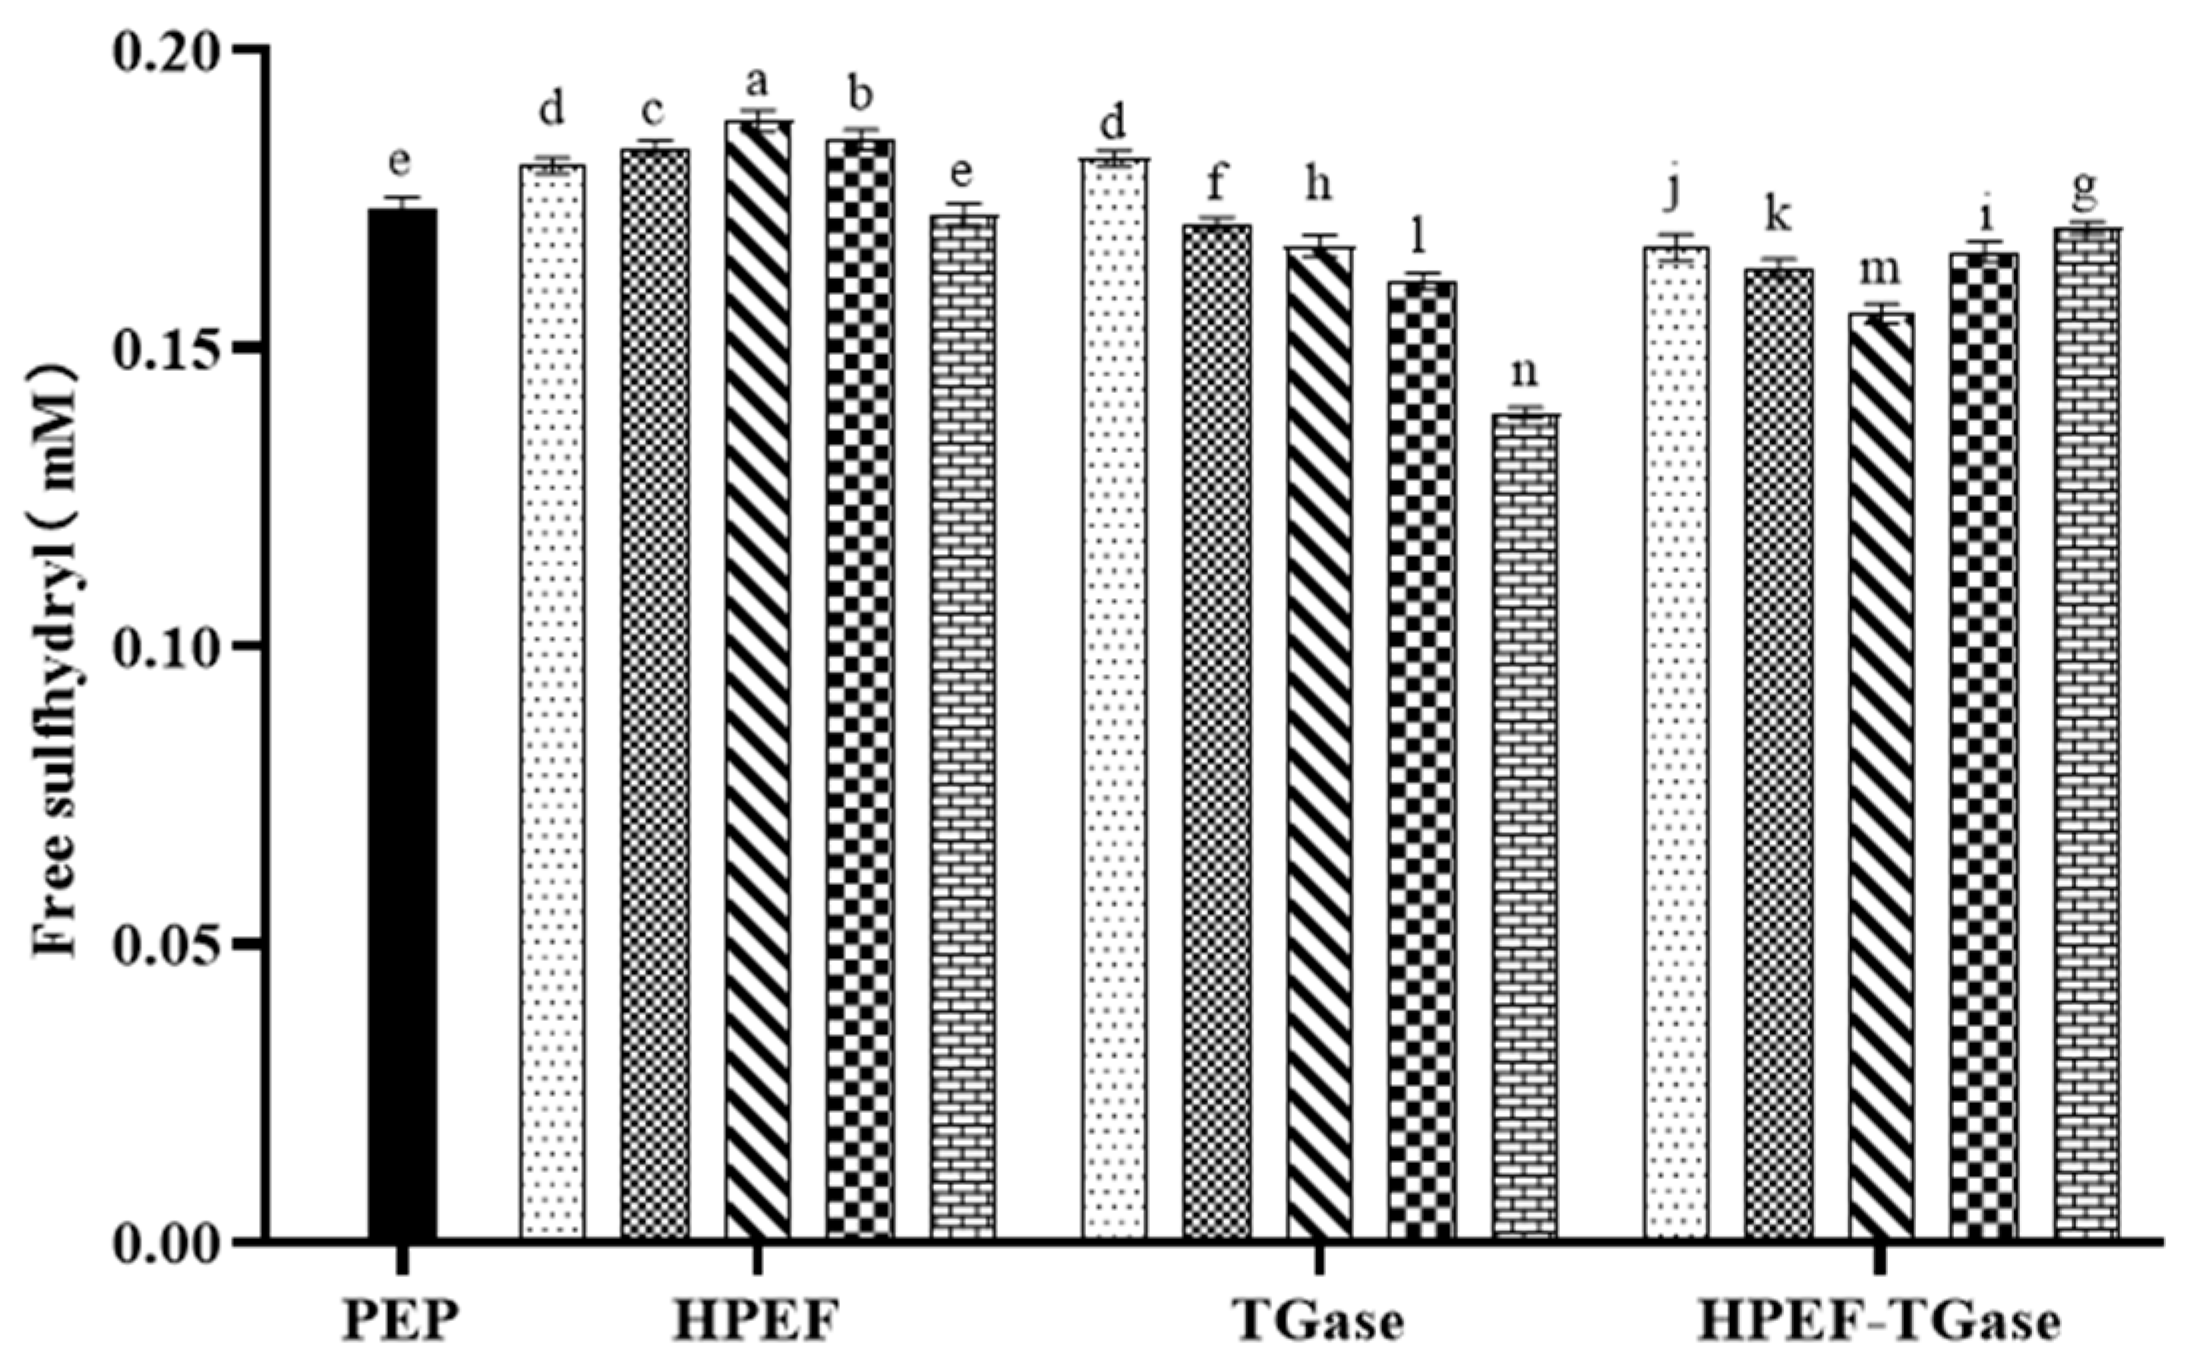


| PEP | Secondary Structure Content/% | ||
|---|---|---|---|
| α-Helix | β-Fold | β-Turn | |
| PEP | 26.6 ± 0.2 | 38.1 ± 0.3 | 35.3 ± 0.5 |
| 500 V/cm HPEF | 28.2 ± 0.6 * | 35.6 ± 1.0 * | 36.2 ± 0.2 |
| 1000 V/cm HPEF | 28.4 ± 0.6 * | 35.4 ± 0.5 * | 36.1 ± 0.2 |
| 1500 V/cm HPEF | 27.6 ± 0.8 * | 35.5 ± 0.7 * | 37.0 ± 0.6 * |
| 2000 V/cm HPEF | 27.2 ± 0.6 | 35.8 ± 0.4 * | 37.0 ± 0.8 * |
| 2500 V/cm HPEF | 26.2 ± 0.3 | 36.5 ± 0.5 * | 37.4 ± 0.6 * |
| 0.25% TG | 29.6 ± 0.5 * | 30.3 ± 0.6 * | 40.2 ± 0.3 * |
| 0.5% TG | 30.7 ± 1.0 * | 31.6 ± 0.4 * | 37.7 ± 0.2 * |
| 1% TG | 29.3 ± 0.4 * | 31.8 ± 0.2 * | 38.9 ± 1.1 * |
| 2% TG | 29.9 ± 0.7 * | 32.6 ± 0.5 * | 37.5 ± 0.6 * |
| 4% TG | 30.3 ± 0.6 * | 32.2 ± 0.4 * | 36.6 ± 0.5 * |
| 500 HPEF + 1% TGase | 29.1 ± 0.4 | 32.7 ± 0.2 # | 38.0 ± 0.5 |
| 1000 HPEF + 1% TGase | 28.7 ± 0.2 | 31.5 ± 0.4 | 39.8 ± 0.4 # |
| 1500 HPEF + 1% TGase | 29.3 ± 0.4 | 32.3 ± 0.3 | 38.5 ± 0.9 |
| 2000 HPEF + 1% TGase | 29.5 ± 0.6 | 32.5 ± 0.5 | 38.0 ± 0.7 |
| 2500 HPEF + 1% TGase | 29.0 ± 0.5 | 33.1 ± 0.5 # | 37.9 ± 0.1 |
| HPEF (V/cm) | K | N | R2 |
|---|---|---|---|
| PEP | 0.0885 | 0.7659 | 0.99999 |
| 500 HPEF | 0.0737 | 0.7778 | 0.99991 |
| 1000 HPEF | 0.0636 | 0.7582 | 0.99255 |
| 1500 HPEF | 0.0904 | 0.7469 | 0.99992 |
| 2000 HPEF | 0.1284 | 0.6710 | 0.99977 |
| 2500 HPEF | 0.1593 | 0.6698 | 0.99998 |
| TGase (%) | K | N | R2 |
|---|---|---|---|
| PEP | 0.0885 | 0.7659 | 0.99999 |
| 0.25 | 0.1318 | 0.7819 | 0.99964 |
| 0.5 | 0.2389 | 0.6799 | 0.99861 |
| 1 | 0.5345 | 0.5931 | 0.99971 |
| 2 | 0.7346 | 0.6626 | 0.99992 |
| 4 | 0.9309 | 0.6522 | 0.99976 |
| TGase-HPEF | K | N | R2 |
|---|---|---|---|
| PEP | 0.0885 | 0.7659 | 0.99999 |
| 1% TGase | 0.5345 | 0.5931 | 0.99971 |
| 500 HPEF + 1% TGase | 0.5347 | 0.6193 | 0.99999 |
| 1000 HPEF + 1% TGase | 0.6141 | 0.6032 | 0.99899 |
| 1500 HPEF + 1% TGase | 0.8546 | 0.6789 | 0.99956 |
| 2000 HPEF + 1% TGase | 0.4098 | 0.5540 | 0.99657 |
| 2500 HPEF + 1% TGase | 0.3004 | 0.6819 | 0.99961 |
Disclaimer/Publisher’s Note: The statements, opinions and data contained in all publications are solely those of the individual author(s) and contributor(s) and not of MDPI and/or the editor(s). MDPI and/or the editor(s) disclaim responsibility for any injury to people or property resulting from any ideas, methods, instructions or products referred to in the content. |
© 2023 by the authors. Licensee MDPI, Basel, Switzerland. This article is an open access article distributed under the terms and conditions of the Creative Commons Attribution (CC BY) license (https://creativecommons.org/licenses/by/4.0/).
Share and Cite
Li, J.; Feng, Y.; Cheng, Q.; Liu, J.; Yun, S.; Cheng, Y.; Cheng, F.; Cao, J.; Feng, C. Investigation of Consequences of High-Voltage Pulsed Electric Field and TGase Cross-Linking on the Physicochemical and Rheological Properties of Pleurotus eryngii Protein. Foods 2023, 12, 647. https://doi.org/10.3390/foods12030647
Li J, Feng Y, Cheng Q, Liu J, Yun S, Cheng Y, Cheng F, Cao J, Feng C. Investigation of Consequences of High-Voltage Pulsed Electric Field and TGase Cross-Linking on the Physicochemical and Rheological Properties of Pleurotus eryngii Protein. Foods. 2023; 12(3):647. https://doi.org/10.3390/foods12030647
Chicago/Turabian StyleLi, Jiaxin, Yan Feng, Qianying Cheng, Jingyu Liu, Shaojun Yun, Yanfen Cheng, Feier Cheng, Jinling Cao, and Cuiping Feng. 2023. "Investigation of Consequences of High-Voltage Pulsed Electric Field and TGase Cross-Linking on the Physicochemical and Rheological Properties of Pleurotus eryngii Protein" Foods 12, no. 3: 647. https://doi.org/10.3390/foods12030647
APA StyleLi, J., Feng, Y., Cheng, Q., Liu, J., Yun, S., Cheng, Y., Cheng, F., Cao, J., & Feng, C. (2023). Investigation of Consequences of High-Voltage Pulsed Electric Field and TGase Cross-Linking on the Physicochemical and Rheological Properties of Pleurotus eryngii Protein. Foods, 12(3), 647. https://doi.org/10.3390/foods12030647