
Structure Characterization and Functional Properties of Flaxseed Protein–Chlorogenic Acid Complex

 , and
, and
Abstract
:1. Introduction
2. Materials and Methods
2.1. Materials
2.2. Preparation of FP–CA Covalent Complexes
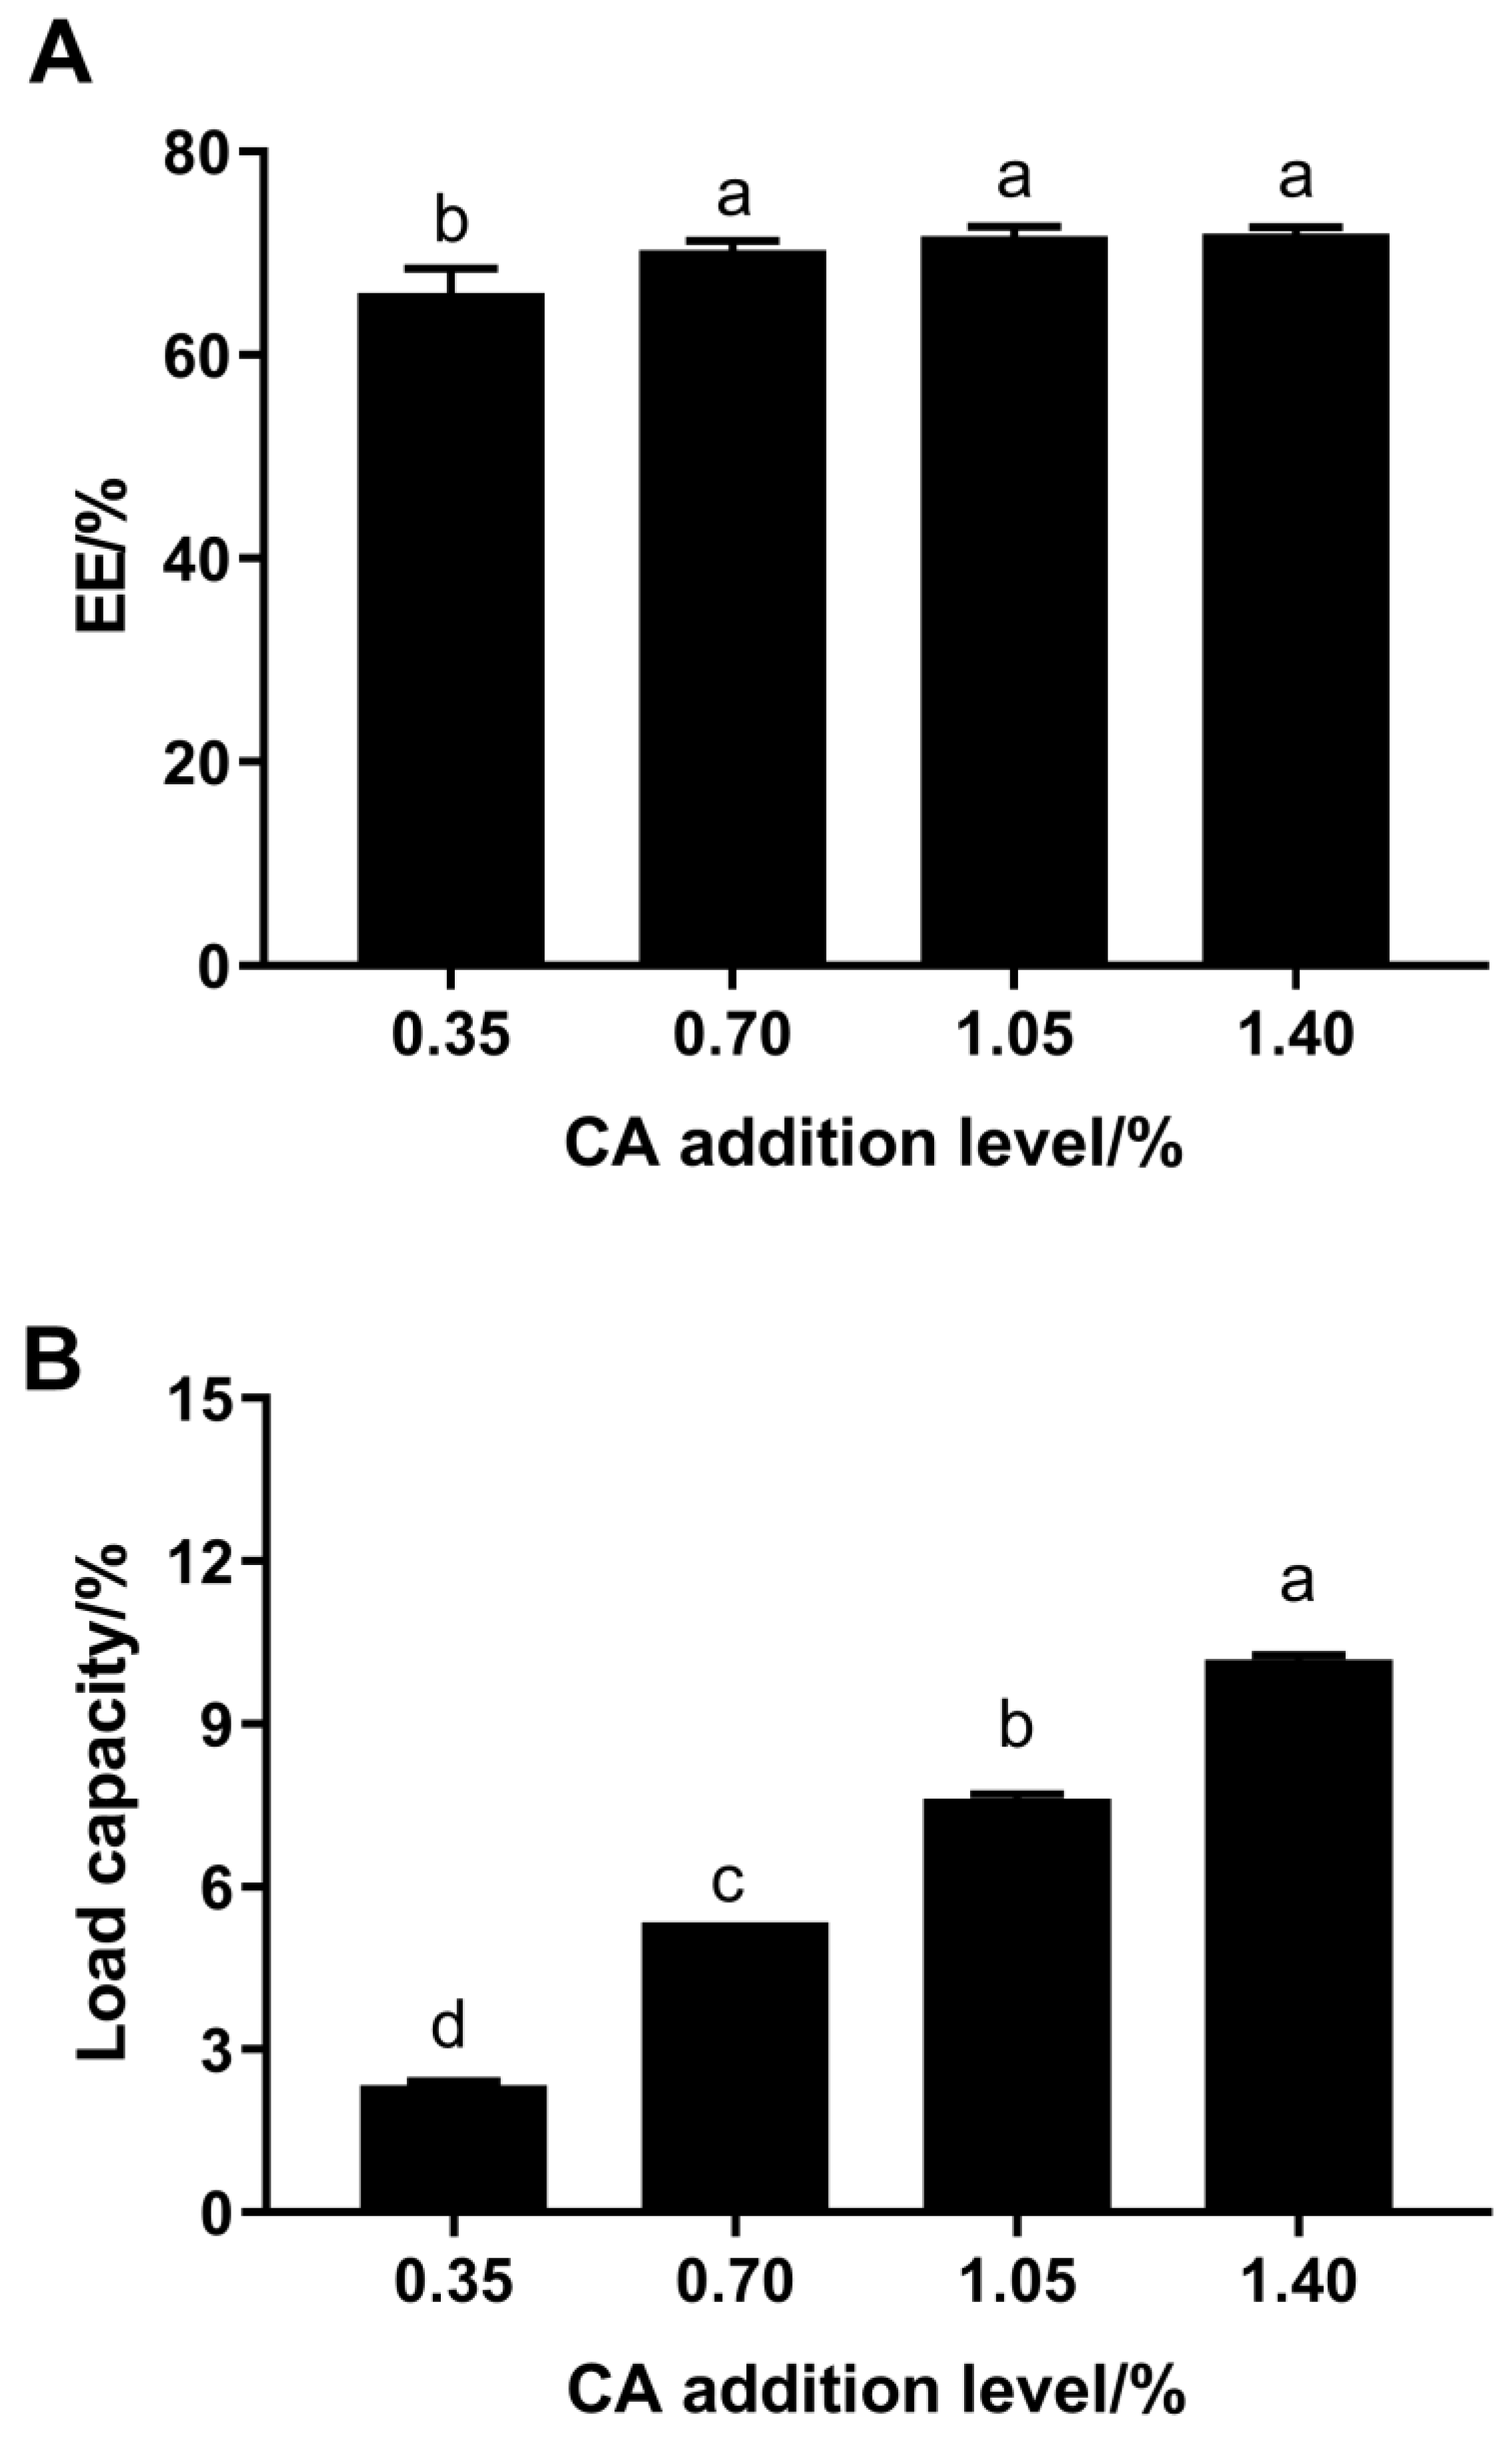
2.3. EE and Loading Capacity of CA in FP–CA Complexes
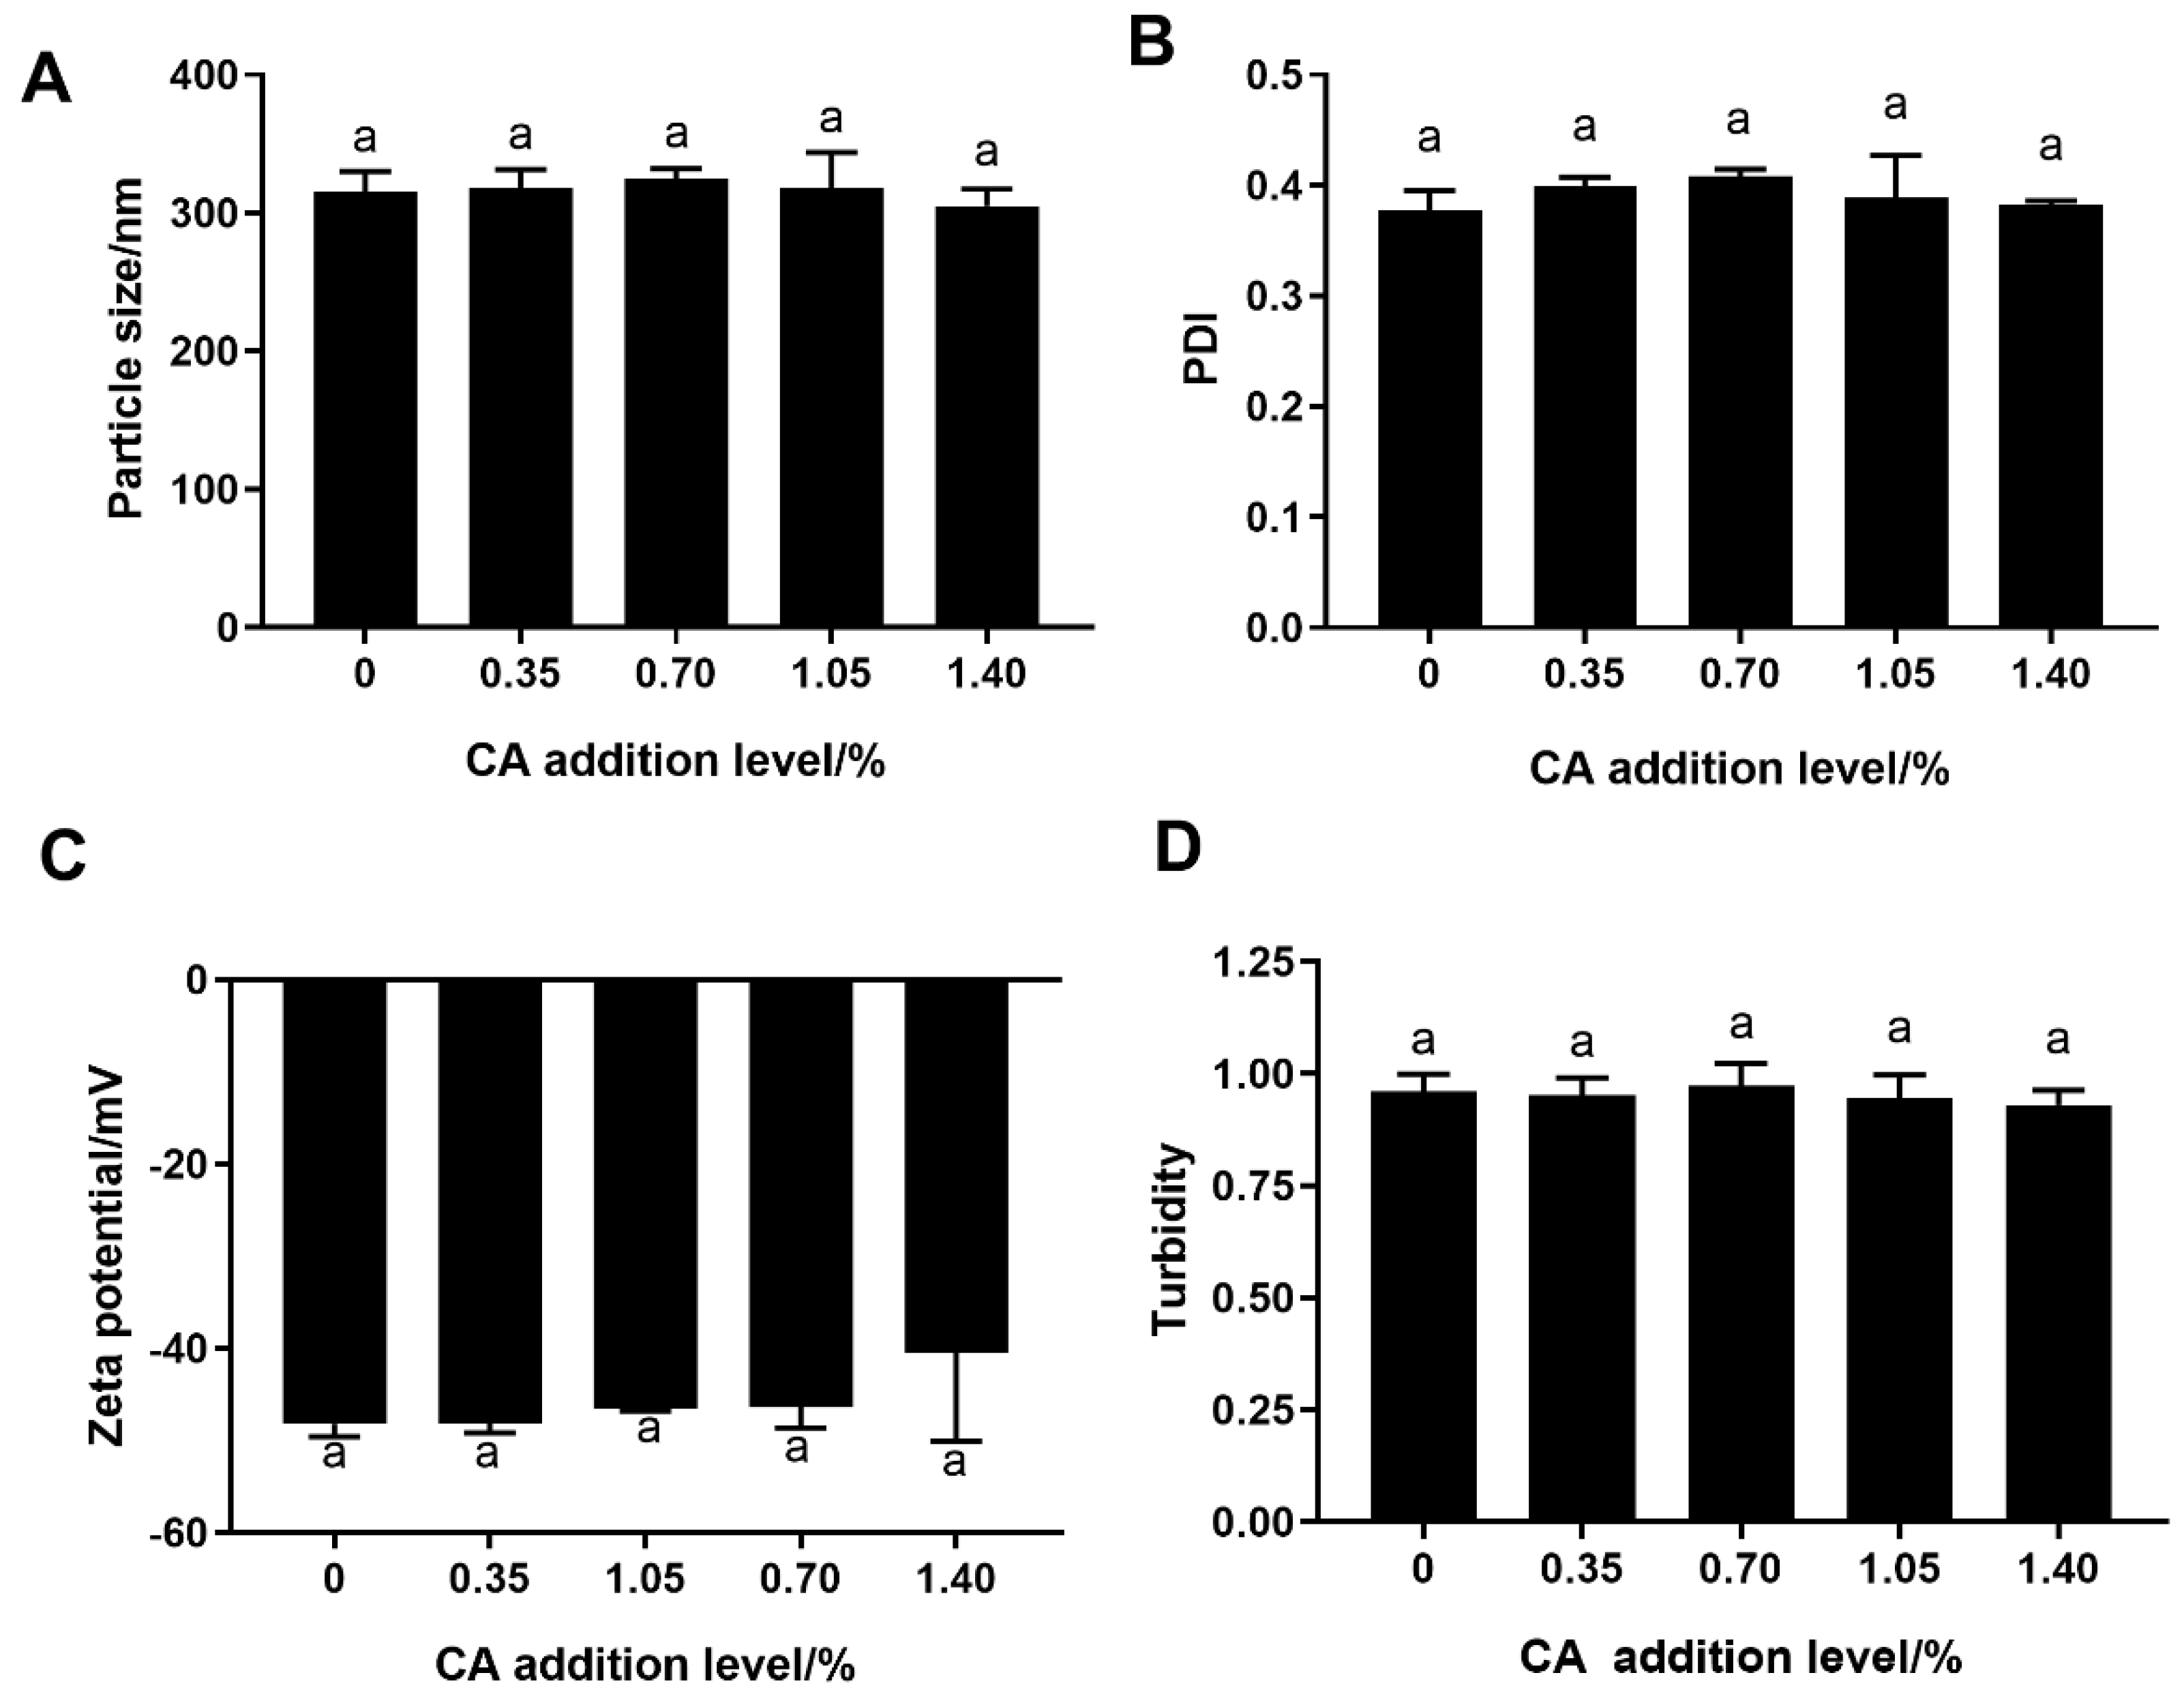
2.4. Particle Size, Ζ-Potential and Polydispersity Index (PDI)
2.5. Turbidity
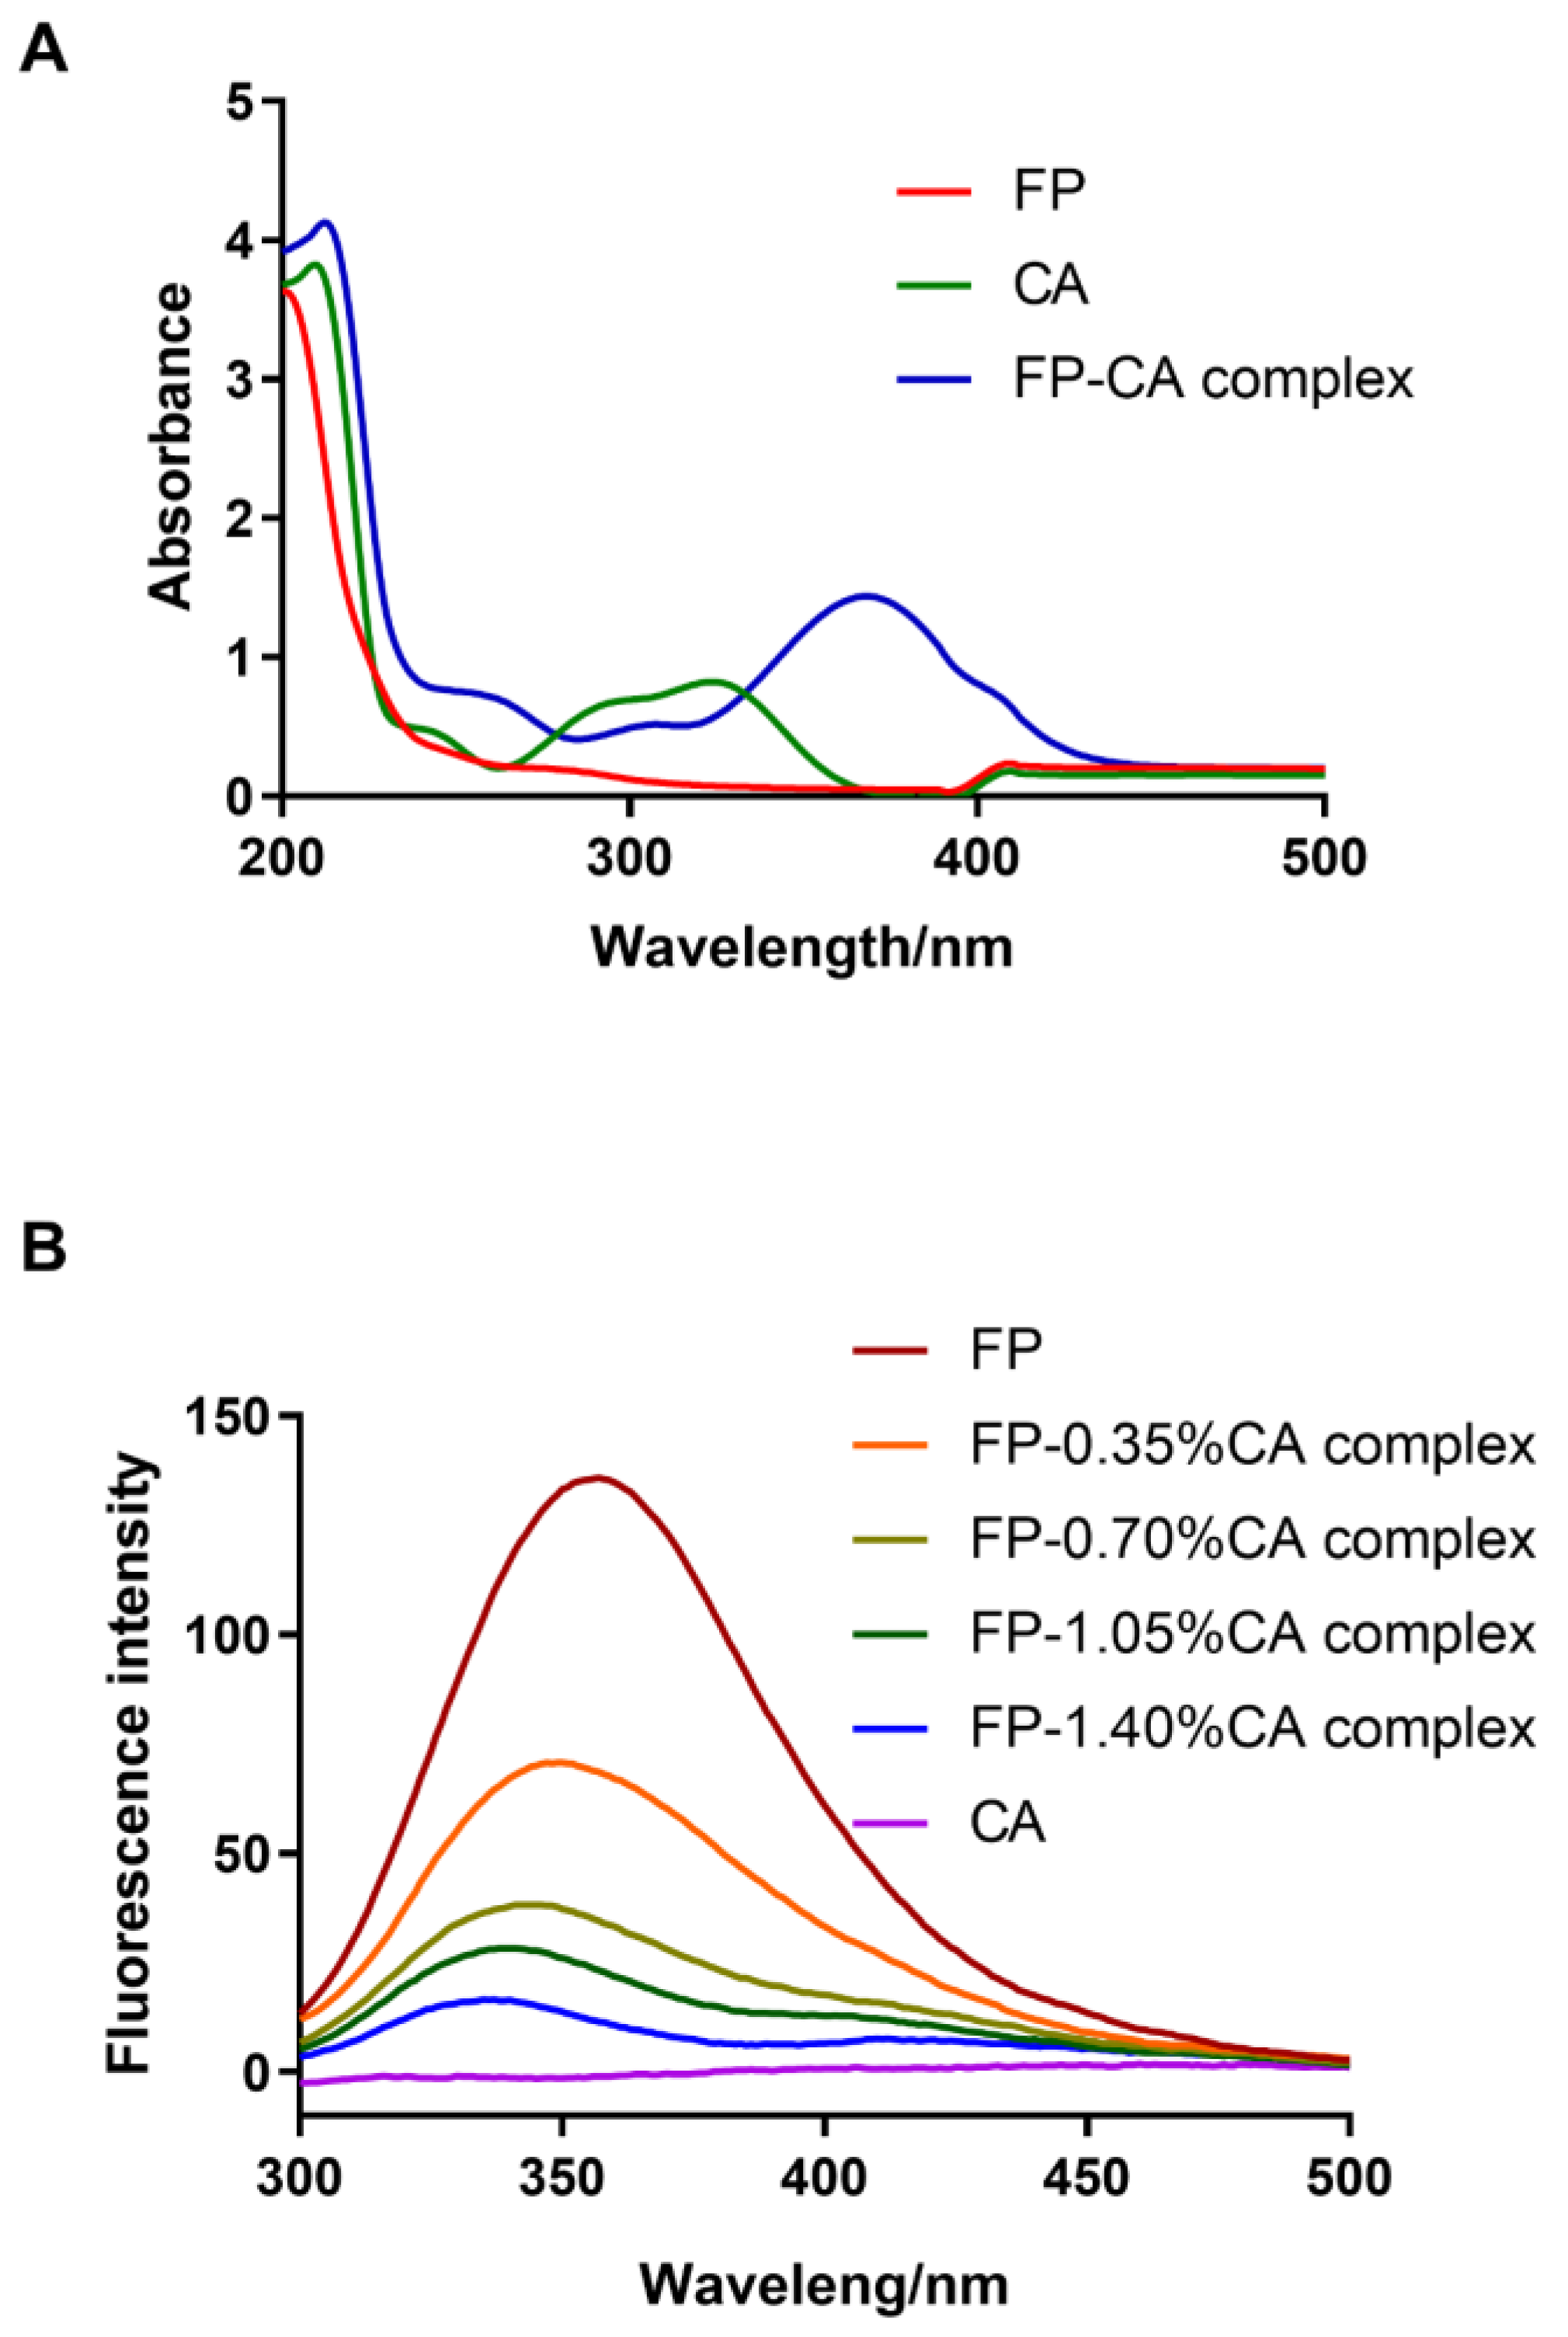
2.6. UV–Vis Spectra
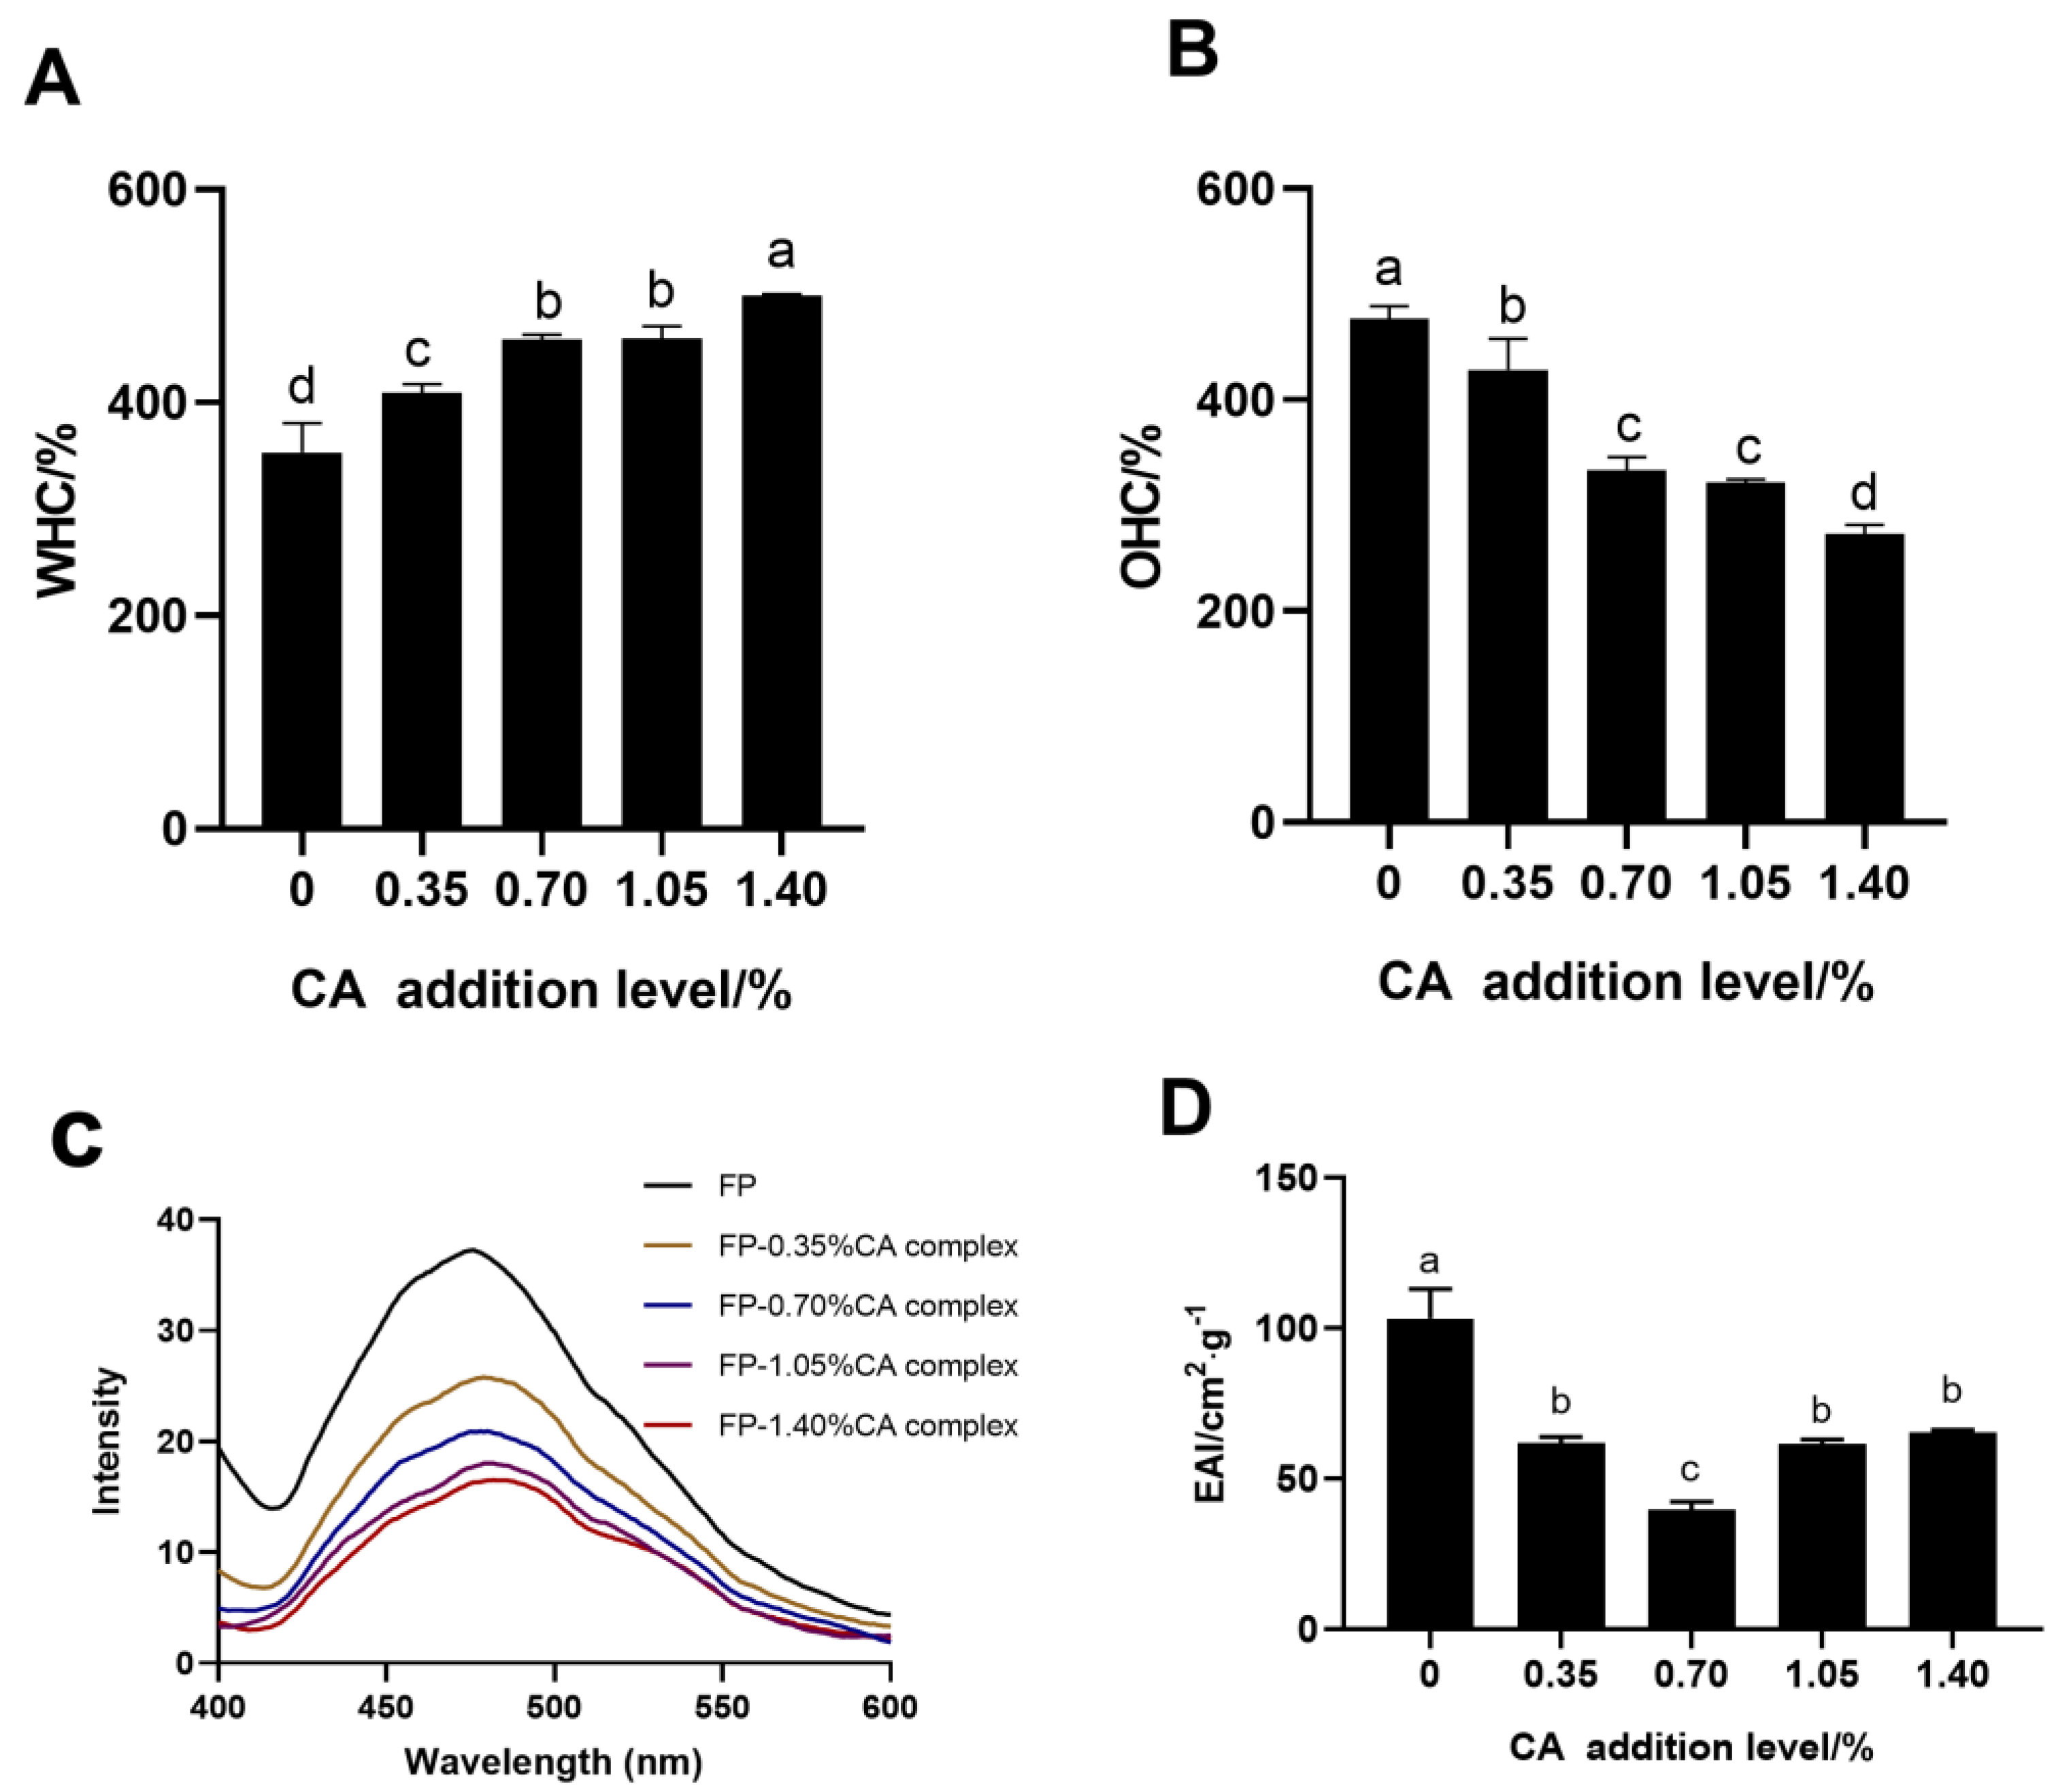
2.7. Fluorescence Spectra
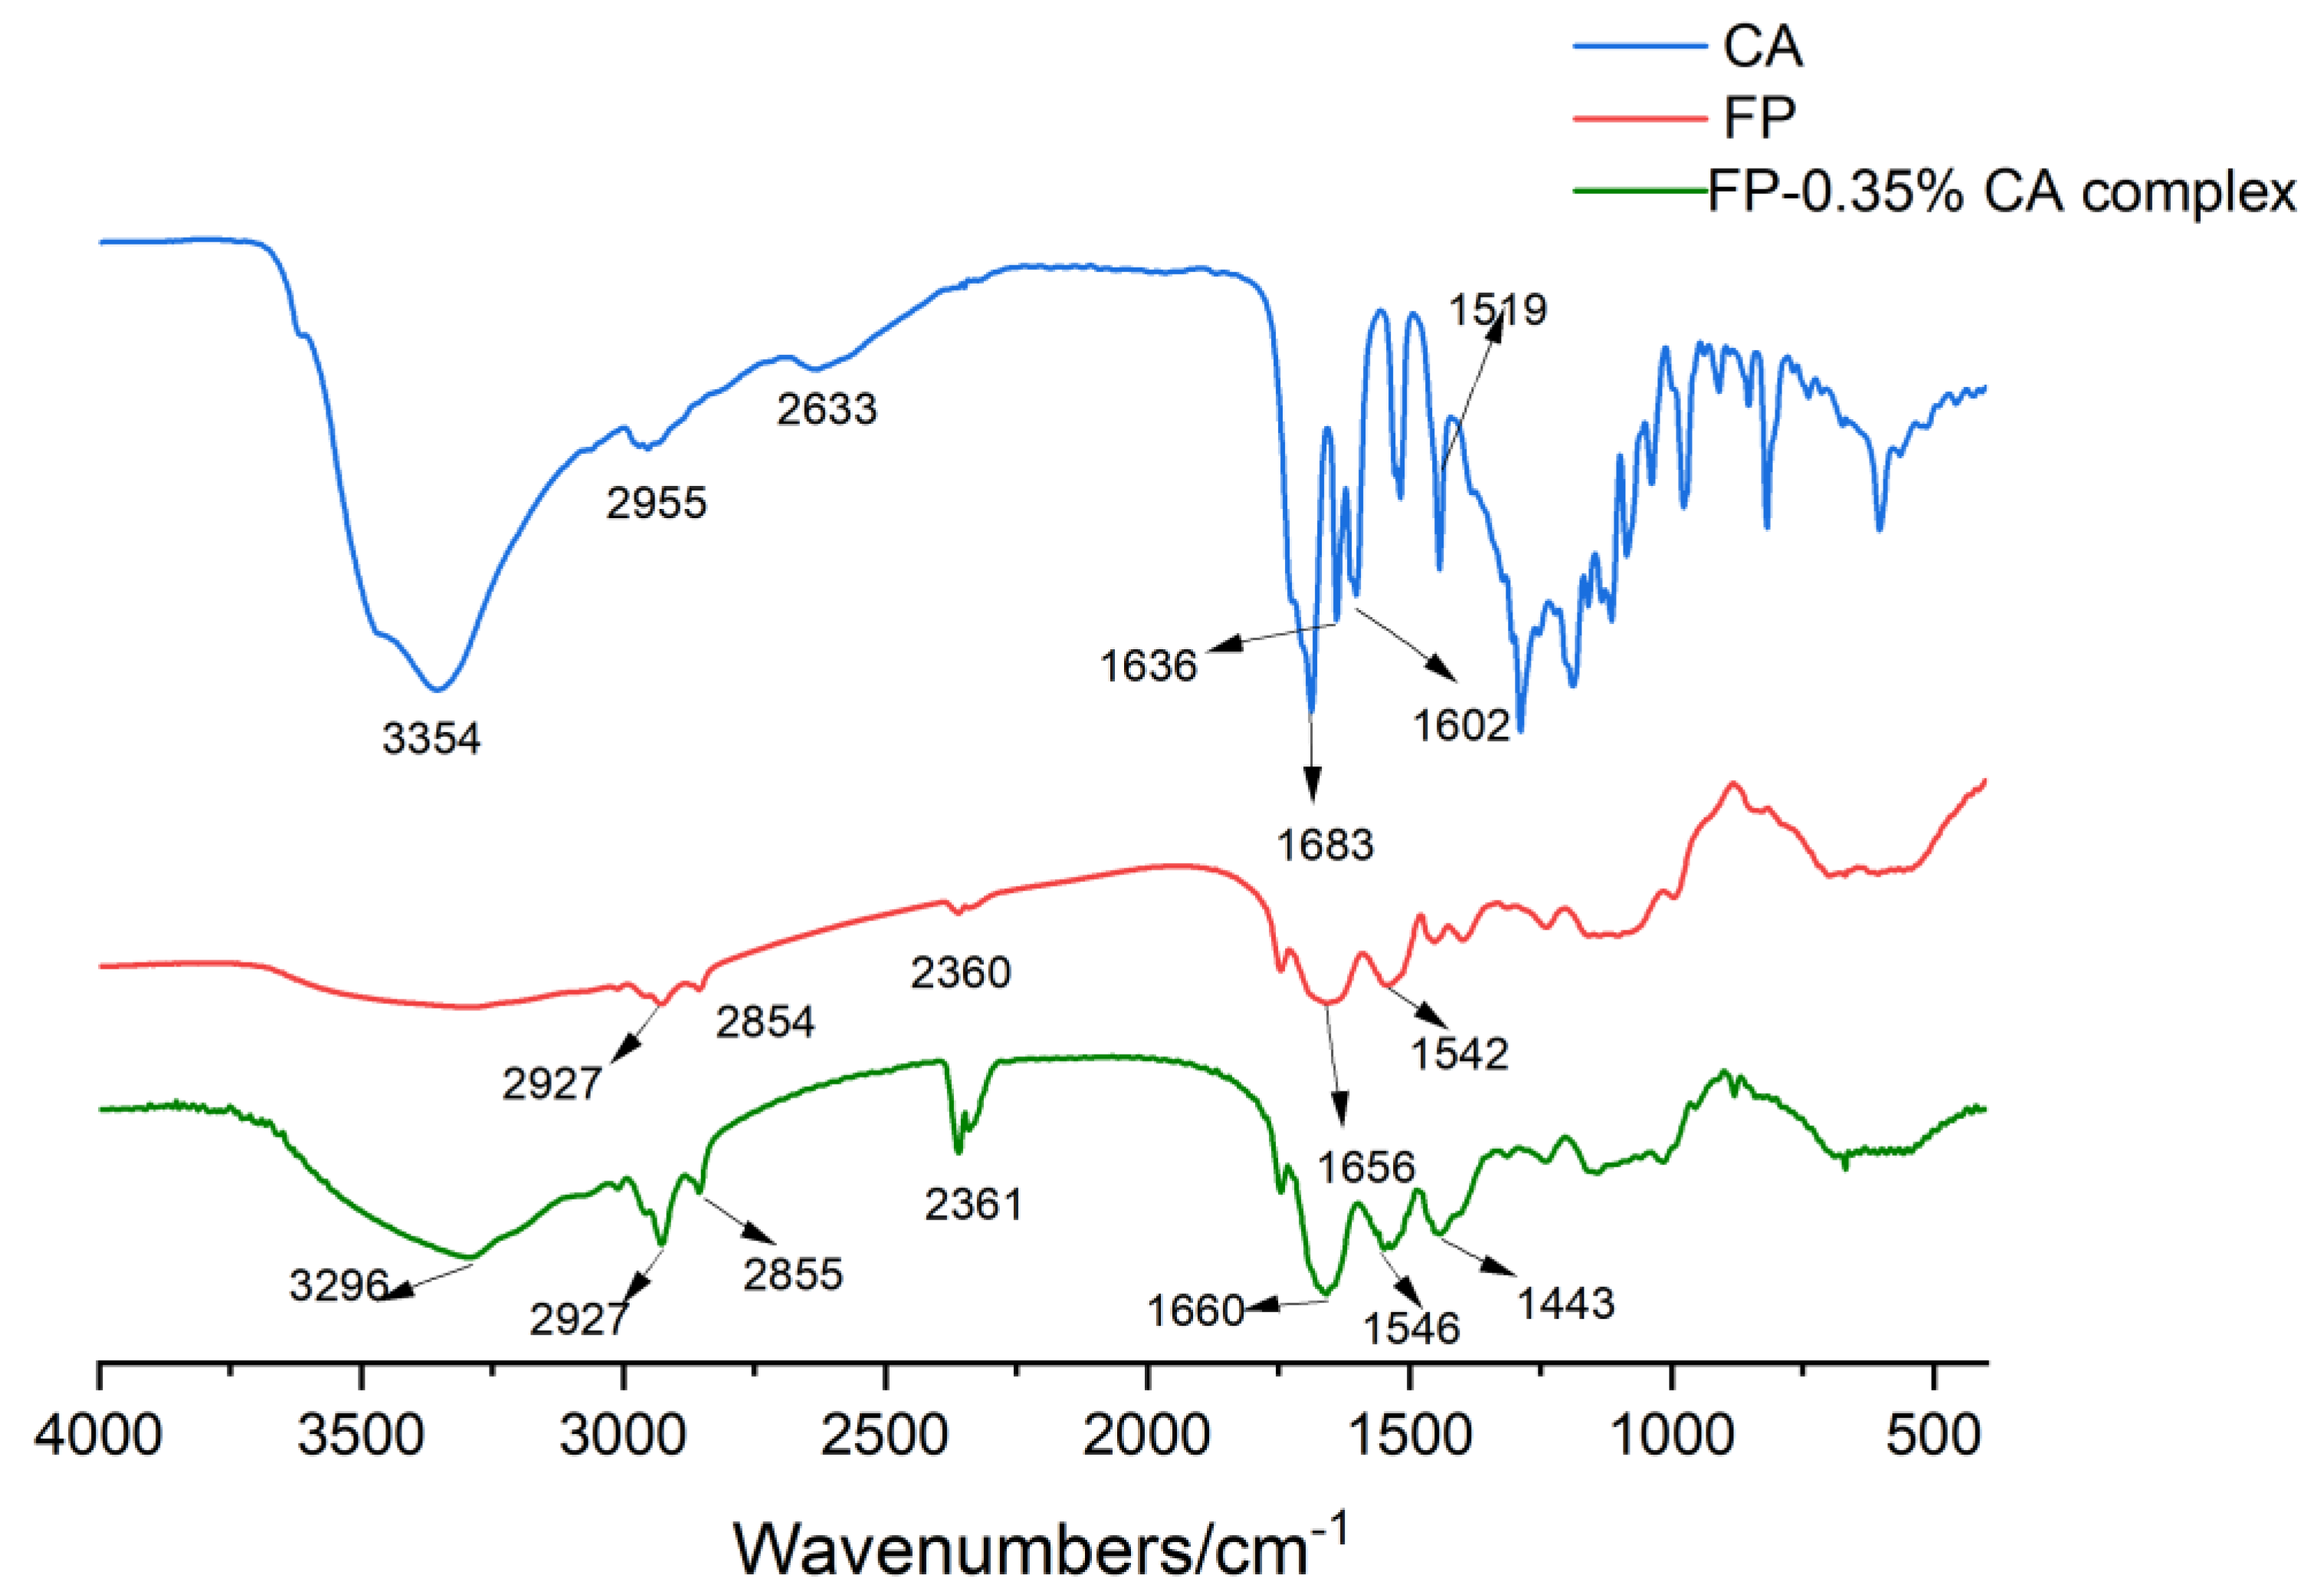
2.8. FTIR Spectra
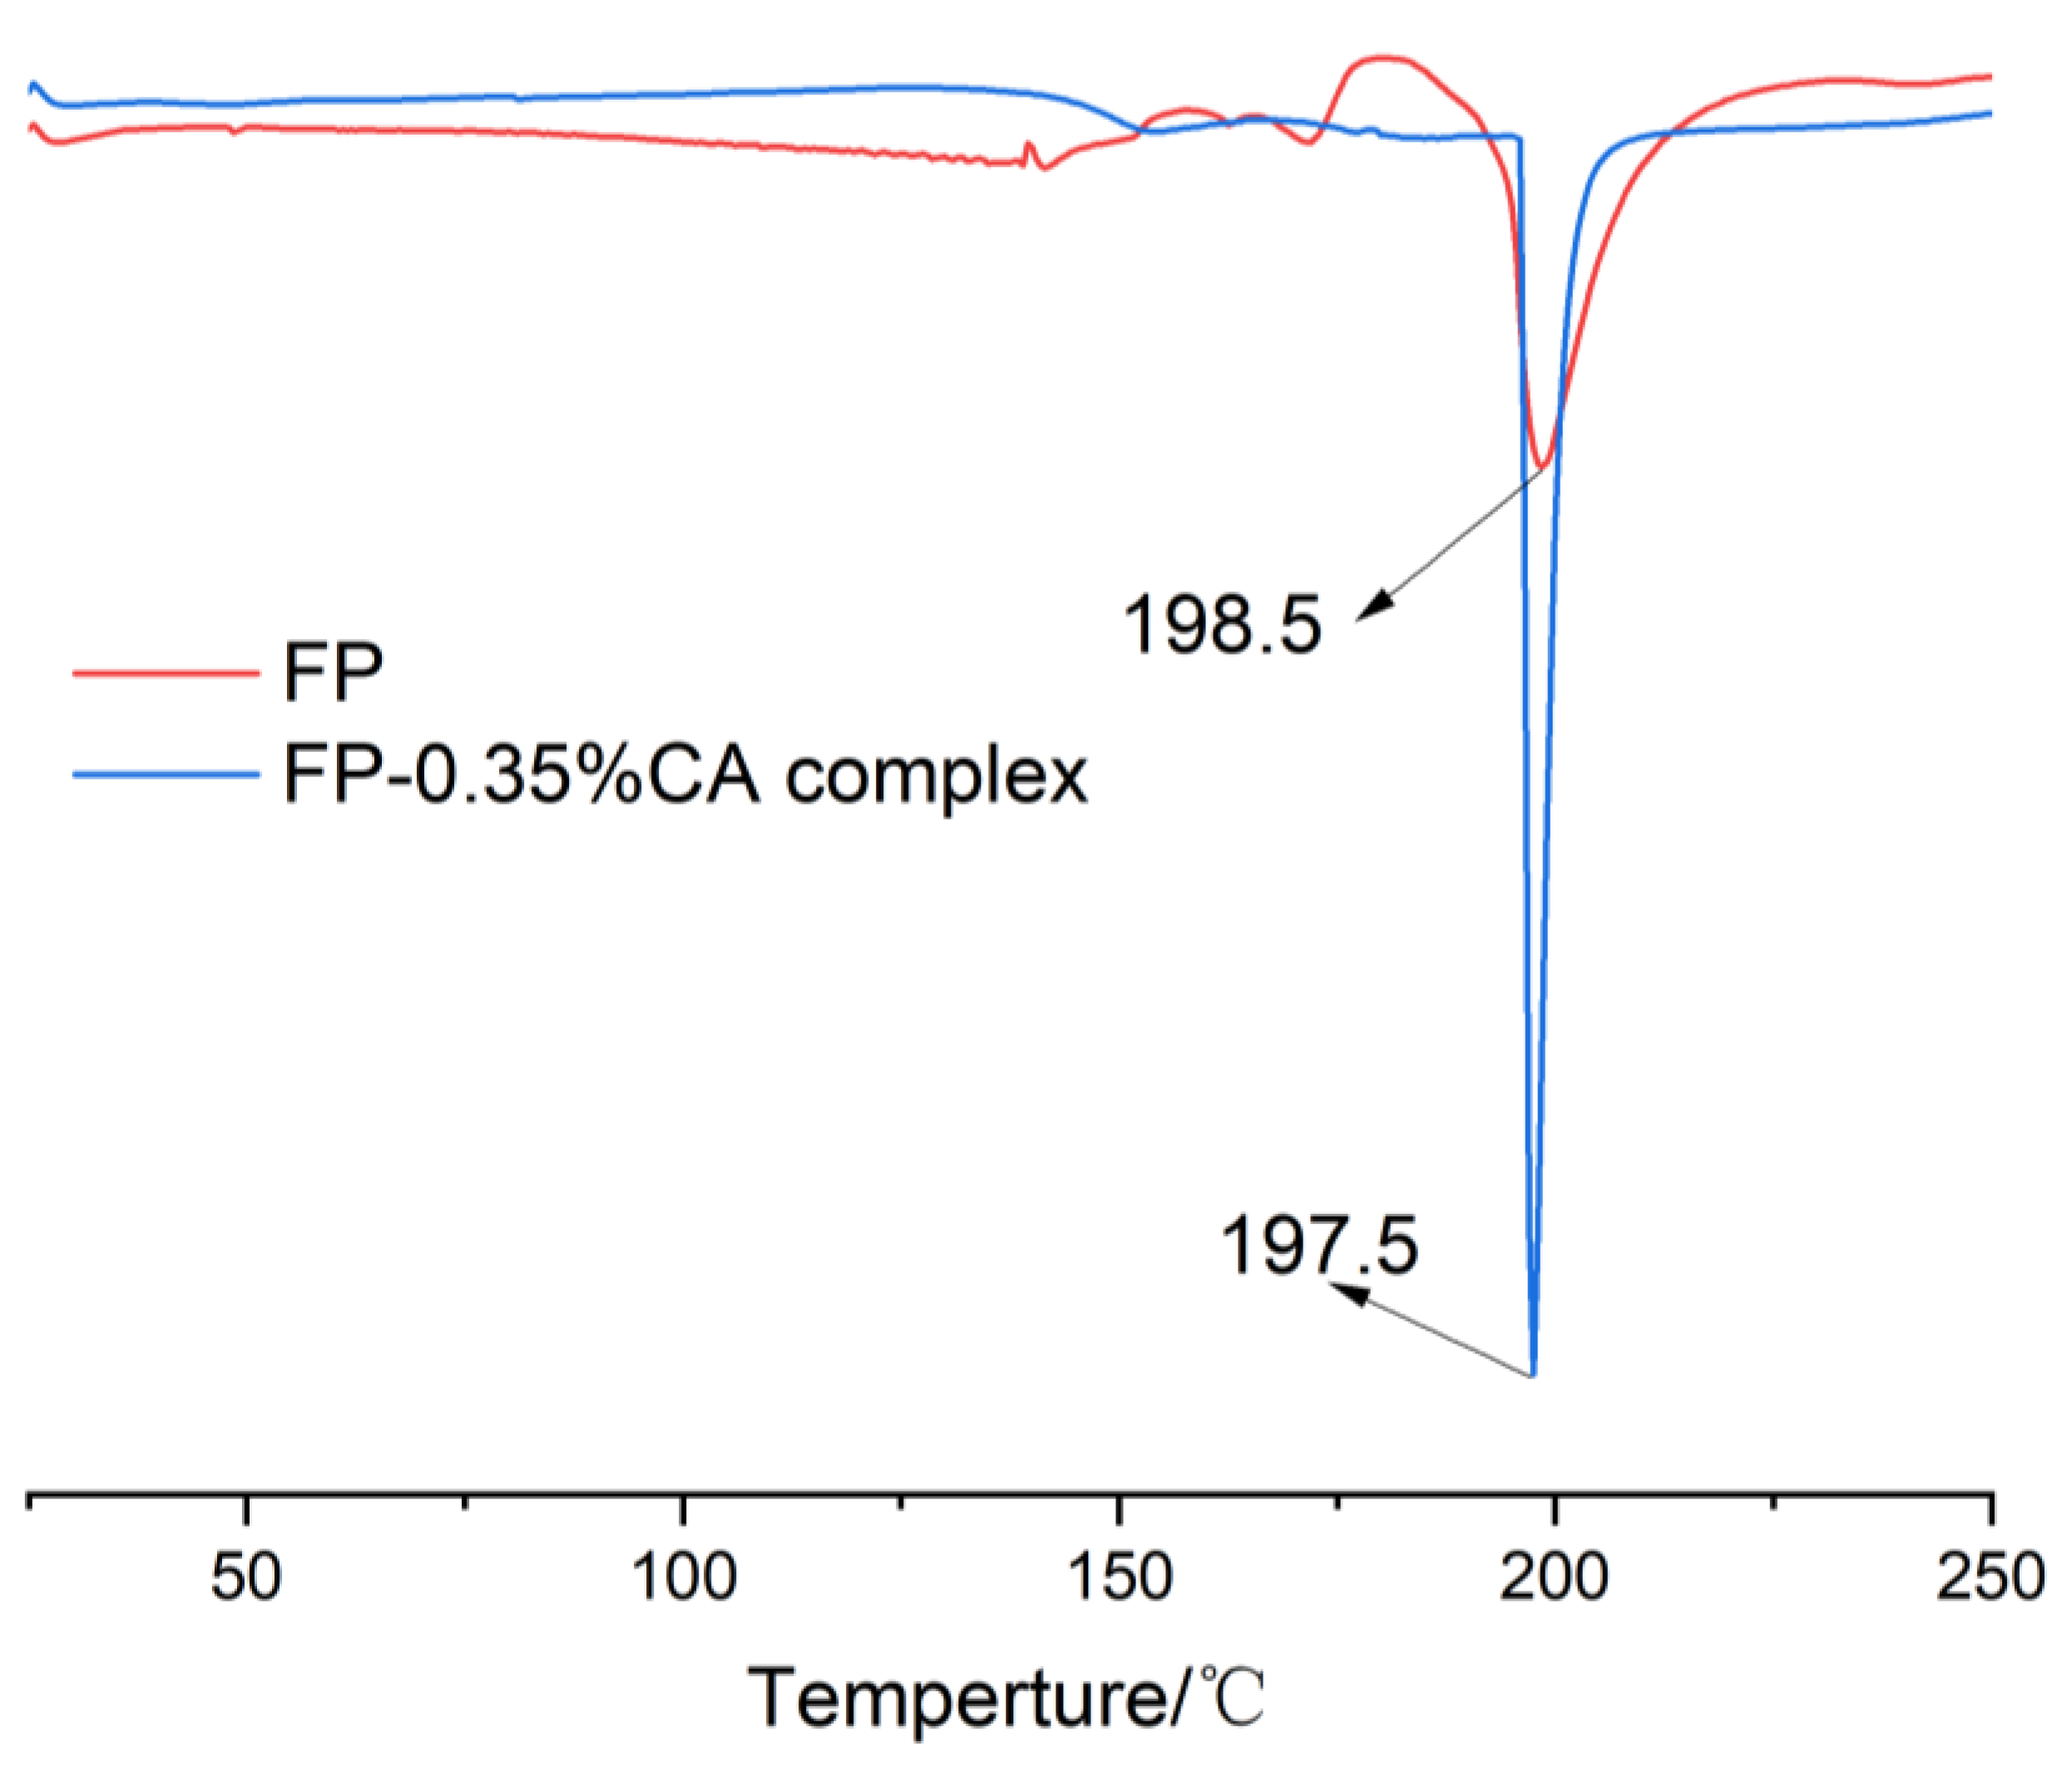
2.9. Differential Scanning Calorimetry (DSC)
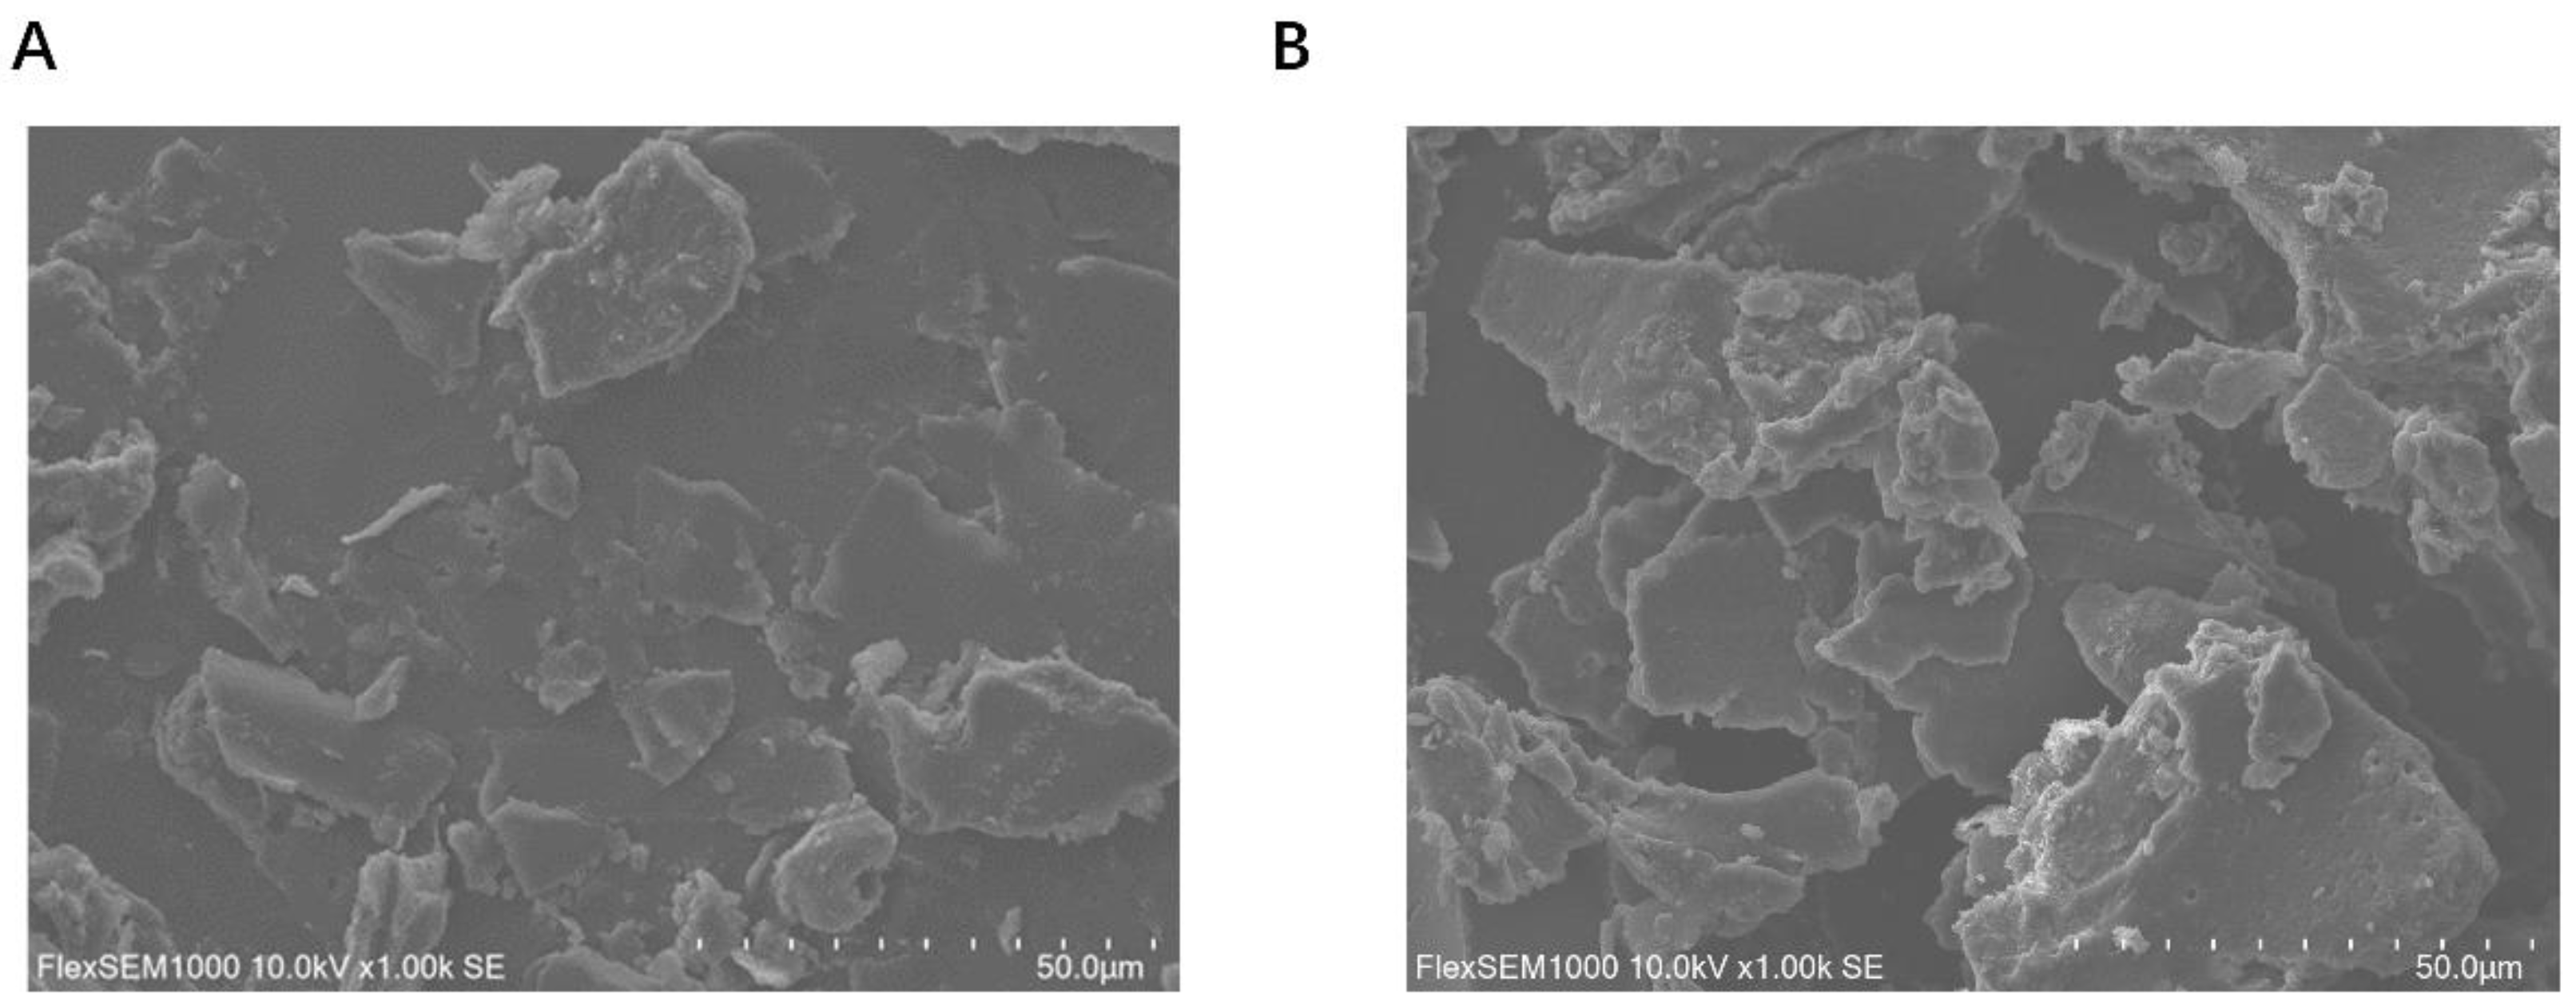
2.10. Scanning Electron Microscopy (SEM)
2.11. WHC Analysis
- m1: the mass of the added distilled water, g;
- m2: the mass of the centrifugated supernatant, g;
- m: the mass of the FP or FP–CA complexes, g.
2.12. OHC Analysis
- m1: the mass of the added peanut oil, g;
- m2: the mass of the centrifugated upper oil, g;
- m: the mass of the FP or FP–CA complexes, g.
2.13. Emulsifying Activity Index (EAI) Analysis
2.14. Surface Hydrophobicity Analysis
2.15. Antioxidant Activity Analysis
2.15.1. DPPH Radical Scavenging Capacity Assay
2.15.2. Ferric Reducing Antioxidant Power (FRAP) Assay
2.15.3. ABTS Radical Scavenging Capacity Assay
2.16. Data Analysis
3. Results and Discussion
3.1. EE and Loading Capacity of the FP–CA Complexes
3.2. Particle Size, PDI and Ζ-Potential Analysis
3.3. Turbidity Analysis
3.4. UV–Vis and Fluorescence Spectrum Analysis
3.5. FTIR Analysis
3.6. Thermal Stability
3.7. SEM Results
3.8. WHC
3.9. OHC
3.10. Surface Hydrophobicity
3.11. Emulsifying Properties
3.12. Antioxidant Activity
4. Conclusions
Author Contributions
Funding
Data Availability Statement
Conflicts of Interest
References
- Boukid, F. Plant-based meat analogues: From niche to mainstream. Eur. Food Res. Technol. 2021, 247, 297–308. [Google Scholar] [CrossRef]
- Shim, Y.Y.; Gui, B.; Arnison, P.G.; Wang, Y.; Reaney, M.J. Flaxseed (Linum usitatissimum L.) bioactive compounds and peptide nomenclature: A review. Trends Food Sci. Technol. 2014, 38, 5–20. [Google Scholar] [CrossRef]
- Singh, K.K.; Mridula, D.; Rehal, J.; Barnwal, P. Flaxseed: A potential source of food, feed and fiber. Crit. Rev. Food Sci. Nutr. 2011, 51, 210–222. [Google Scholar] [CrossRef]
- Santos-Buelga, C.; González-Paramás, A.M.; Oludemi, T.; Ayuda-Durána, B.; Manzano, S.G. Plant phenolics as functional food ingredients. Adv. Food Nutr. Res. 2019, 90, 183–257. [Google Scholar] [PubMed]
- Yan, X.; Zeng, Z.; McClements, D.J.; Gong, X.; Yu, P.; Xia, J.; Gong, D. A review of the structure, function, and application of plant-based protein–phenolic conjugates and complexes. Compr. Rev. Food Sci. Food Saf. 2023, 22, 1312–1336. [Google Scholar] [CrossRef] [PubMed]
- Guan, H.; Zhang, W.; Sun-Waterhouse, D.; Jiang, Y.; Li, F.; Waterhouse, G.I.; Li, D. Phenolic-protein interactions in foods and post ingestion: Switches empowering health outcomes. Trends Food Sci. Technol. 2021, 118, 71–86. [Google Scholar] [CrossRef]
- Bordenave, N.; Hamaker, B.R.; Ferruzzi, M.G. Nature and consequences of non-covalent interactions between flavonoids and macronutrients in foods. Food Funct. 2014, 5, 18–34. [Google Scholar] [CrossRef]
- Ozdal, T.; Capanoglu, E.; Altay, F. A review on protein–phenolic interactions and associated changes. Food Res. Int. 2013, 51, 954–970. [Google Scholar] [CrossRef]
- Baba, W.N.; McClements, D.J.; Maqsood, S. Whey protein–polyphenol conjugates and complexes: Production, characterization, and applications. Food Chem. 2021, 365, 130455. [Google Scholar] [CrossRef]
- Jing, H.; Sun, J.; Mu, Y.; Obadi, M.; McClements, D.J.; Xu, B. Sonochemical effects on the structure and antioxidant activity of egg white protein–tea polyphenol conjugates. Food Funct. 2020, 11, 7084–7094. [Google Scholar] [CrossRef]
- Curcio, M.; Parisi, O.I.; Puoci, F.; Altimari, I.; Spizzirri, U.G.; Picci, N. Antioxidant polymers by free radical grafting on natural polymers. In Antioxidant Polymers: Synthesis, Properties, and Applications; Scrivener Publishing LLC.: Beverly, MA, USA, 2012; pp. 153–178. [Google Scholar]
- Han, L.; Peng, X.; Cheng, Y.; Zhu, Y.; Huang, Y.; Zhang, S.; Qi, B. Effects of catechin types found in tea polyphenols on the structural and functional properties of soybean protein isolate–catechin covalent complexes. LWT 2023, 173, 114336. [Google Scholar] [CrossRef]
- Shi, J.; Cui, Y.-F.; Zhou, G.; Li, N.; Sun, X.; Wang, X.; Xu, N. Covalent interaction of soy protein isolate and chlorogenic acid: Effect on protein structure and functional properties. LWT 2022, 170, 114081. [Google Scholar] [CrossRef]
- Wang, L.; Pan, X.; Jiang, L.; Chu, Y.; Gao, S.; Jiang, X.; Zhang, Y.; Chen, Y.; Luo, S.; Peng, C. The biological activity mechanism of chlorogenic acid and its applications in food industry: A review. Front. Nutr. 2022, 9, 943911. [Google Scholar] [CrossRef] [PubMed]
- Jia, W.; Sethi, D.S.; van der Goot, A.J.; Keppler, J.K. Covalent and non-covalent modification of sunflower protein with chlorogenic acid: Identifying the critical ratios that affect techno-functionality. Food Hydrocoll. 2022, 131, 107800. [Google Scholar] [CrossRef]
- Jiang, J.; Zhang, Z.; Zhao, J.; Liu, Y. The effect of non-covalent interaction of chlorogenic acid with whey protein and casein on physicochemical and radical-scavenging activity of in vitro protein digests. Food Chem. 2018, 268, 334–341. [Google Scholar] [CrossRef]
- Wu, T.; Lin, L.; Zhang, X.; Wang, X.; Ding, J. Covalent modification of soy protein hydrolysates by EGCG: Improves the emulsifying and antioxidant properties. Food Res. Int. 2023, 164, 112317. [Google Scholar] [CrossRef]
- Paladines-Quezada, D.; Cueva, C.; Gil-Muñoz, R.; Cenis, J.L.; Bartolomé, B.; Moreno-Arribas, M.V.; Lozano-Pérez, A.A. Preparation, characterization and gastrointestinal stability of silk fibroin nanoparticles loaded with red wine polyphenols. Food Biosci. 2023, 52, 102431. [Google Scholar] [CrossRef]
- Soleimanifar, M.; Jafari, S.M.; Assadpour, E. Encapsulation of olive leaf phenolics within electrosprayed whey protein nanoparticles; production and characterization. Food Hydrocoll. 2020, 101, 105572. [Google Scholar] [CrossRef]
- Zhang, H.; Wang, T.; He, F.; Chen, G. Fabrication of pea protein-curcumin nanocomplexes via microfluidization for improved solubility, nano-dispersibility and heat stability of curcumin: Insight on interaction mechanisms. Int. J. Biol. Macromol. 2021, 168, 686–694. [Google Scholar] [CrossRef]
- Jiang, Y.; Li, D.; Tu, J.; Zhong, Y.; Zhang, D.; Wang, Z.; Tao, X. Mechanisms of change in gel water-holding capacity of myofibrillar proteins affected by lipid oxidation: The role of protein unfolding and cross-linking. Food Chem. 2021, 344, 128587. [Google Scholar] [CrossRef]
- Shen, Y.; Hong, S.; Singh, G.; Koppel, K.; Li, Y. Improving functional properties of pea protein through “green” modifications using enzymes and polysaccharides. Food Chem. 2022, 385, 132687. [Google Scholar] [CrossRef] [PubMed]
- Hao, L.; Sun, J.; Pei, M.; Zhang, G.; Li, C.; Li, C.; Ma, X.; He, S.; Liu, L. Impact of non-covalent bound polyphenols on conformational, functional properties and in vitro digestibility of pea protein. Food Chem. 2022, 383, 132623. [Google Scholar] [CrossRef]
- Parolia, S.; Maley, J.; Sammynaiken, R.; Green, R.; Nickerson, M.; Ghosh, S. Structure–Functionality of lentil protein-polyphenol conjugates. Food Chem. 2022, 367, 130603. [Google Scholar] [CrossRef]
- Qie, X.; Chen, Y.; Quan, W.; Wang, Z.; Zeng, M.; Qin, F.; Chen, J.; He, Z. Analysis of β-lactoglobulin–epigallocatechin gallate interactions: The antioxidant capacity and effects of polyphenols under different heating conditions in polyphenolic–protein interactions. Food Funct. 2020, 11, 3867–3878. [Google Scholar] [CrossRef]
- Jiang, B.; Zhong, S.; Yu, H.; Chen, P.; Li, B.; Li, D.; Liu, C.; Feng, Z. Covalent and noncovalent complexation of phosvitin and gallic acid: Effects on protein functionality and in vitro digestion properties. J. Agric. Food Chem. 2022, 70, 11715–11726. [Google Scholar] [CrossRef] [PubMed]
- Zhang, N.; Zhang, X.; Zhang, Y.; Li, Y.; Gao, Y.; Li, Q.; Yu, X. Non-covalent interaction between pea protein isolate and catechin: Effects on protein structure and functional properties. Food Funct. 2022, 13, 12208–12218. [Google Scholar] [CrossRef] [PubMed]
- Dai, S.; Lian, Z.; Qi, W.; Chen, Y.; Tong, X.; Tian, T.; Lyu, B.; Wang, M.; Wang, H.; Jiang, L. Non-covalent interaction of soy protein isolate and catechin: Mechanism and effects on protein conformation. Food Chem. 2022, 384, 132507. [Google Scholar] [CrossRef]
- Djuardi, A.U.P.; Yuliana, N.D.; Ogawa, M.; Akazawa, T.; Suhartono, M.T. Emulsifying properties and antioxidant activity of soy protein isolate conjugated with tea polyphenol extracts. J. Food Sci. Technol. 2020, 57, 3591–3600. [Google Scholar] [CrossRef]
- Wang, K.-Q.; Luo, S.-Z.; Zhong, X.-Y.; Cai, J.; Jiang, S.-T.; Zheng, Z. Changes in chemical interactions and protein conformation during heat-induced wheat gluten gel formation. Food Chem. 2017, 214, 393–399. [Google Scholar] [CrossRef]
- Liu, Z.-W.; Zhou, Y.-X.; Wang, L.-H.; Ye, Z.; Liu, L.-J.; Cheng, J.-H.; Wang, F.; Bekhit, A.E.-D.; Aadil, R.M. Multi-spectroscopies and molecular docking insights into the interaction mechanism and antioxidant activity of astaxanthin and β-lactoglobulin nanodispersions. Food Hydrocoll. 2021, 117, 106739. [Google Scholar] [CrossRef]
- Liu, Q.; Qin, Y.; Chen, J.; Jiang, B.; Zhang, T. Fabrication, characterization, physicochemical stability and simulated gastrointestinal digestion of pterostilbene loaded zein-sodium caseinate-fucoidan nanoparticles using pH-driven method. Food Hydrocoll. 2021, 119, 106851. [Google Scholar] [CrossRef]
- Guo, Q.; Su, J.; Shu, X.; Yuan, F.; Mao, L.; Liu, J.; Gao, Y. Production and characterization of pea protein isolate-pectin complexes for delivery of curcumin: Effect of esterified degree of pectin. Food Hydrocoll. 2020, 105, 105777. [Google Scholar] [CrossRef]
- Yuan, Y.; Zhang, S.; Ma, M.; Wang, D.; Xu, Y. Encapsulation and delivery of curcumin in cellulose nanocrystals nanoparticles using pH-driven method. LWT 2022, 155, 112863. [Google Scholar] [CrossRef]
- Han, S.; Cui, F.; McClements, D.J.; Xu, X.; Ma, C.; Wang, Y.; Liu, X.; Liu, F. Structural Characterization and Evaluation of Interfacial Properties of Pea Protein Isolate–EGCG Molecular Complexes. Foods 2022, 11, 2895. [Google Scholar] [CrossRef] [PubMed]
- Liu, F.; Ma, C.; McClements, D.J.; Gao, Y. A comparative study of covalent and non-covalent interactions between zein and polyphenols in ethanol-water solution. Food Hydrocoll. 2017, 63, 625–634. [Google Scholar] [CrossRef]
- Alu’datt, M.H.; Rababah, T.; Alli, I. Effect of phenolic compound removal on rheological, thermal and physico-chemical properties of soybean and flaxseed proteins. Food Chem. 2014, 146, 608–613. [Google Scholar] [CrossRef]
- Vonghirundecha, P.; Chusri, S.; Meunprasertdee, P.; Kaewmanee, T. Microencapsulated functional ingredients from a Moringa oleifera leaf polyphenol-rich extract: Characterization, antioxidant properties, in vitro simulated digestion, and storage stability. LWT 2021, 154, 112820. [Google Scholar] [CrossRef]
- Han, X.; Liang, Z.; Tian, S.; Liu, L.; Wang, S. Epigallocatechin gallate (EGCG) modification of structural and functional properties of whey protein isolate. Food Res. Int. 2022, 158, 111534. [Google Scholar] [CrossRef]
- Fernando, S.; Manthey, F.A. Soluble phenolic compounds affect functional and rheological properties of black bean protein isolates. Cereal Chem. 2022, 99, 119–129. [Google Scholar] [CrossRef]
- Pham, L.B.; Wang, B.; Zisu, B.; Adhikari, B. Covalent modification of flaxseed protein isolate by phenolic compounds and the structure and functional properties of the adducts. Food Chem. 2019, 293, 463–471. [Google Scholar] [CrossRef]
- Li, X.; Dai, T.; Hu, P.; Zhang, C.; Chen, J.; Liu, C.; Li, T. Characterization the non-covalent interactions between beta lactoglobulin and selected phenolic acids. Food Hydrocoll. 2020, 105, 105761. [Google Scholar] [CrossRef]
- Günal-Köroğlu, D.; Turan, S.; Capanoglu, E. Interaction of lentil protein and onion skin phenolics: Effects on functional properties of proteins and in vitro gastrointestinal digestibility. Food Chem. 2022, 372, 130892. [Google Scholar] [CrossRef] [PubMed]
- Zhou, S.-D.; Lin, Y.-F.; Xu, X.; Meng, L.; Dong, M.-S. Effect of non-covalent and covalent complexation of (−)-epigallocatechin gallate with soybean protein isolate on protein structure and in vitro digestion characteristics. Food Chem. 2020, 309, 125718. [Google Scholar] [CrossRef] [PubMed]
- Zhang, Y.; Xin, N.; Ashaolu, T.J.; Chen, N.; Wang, Y.; Zhang, T.; Zhao, C. In vitro and in silico studies of the structure and functional properties of the lactoferrin-chlorogenic acid complex. Food Hydrocoll. 2023, 144, 109051. [Google Scholar] [CrossRef]
- Liu, J.; Yong, H.; Yao, X.; Hu, H.; Yun, D.; Xiao, L. Recent advances in phenolic–protein conjugates: Synthesis, characterization, biological activities and potential applications. RSC Adv. 2019, 9, 35825–35840. [Google Scholar] [CrossRef]


| CA Addition Level/% | DPPH Radical Scavenging Activity/% | ABTS Radical Scavenging Activity/% | FRAP |
|---|---|---|---|
| 0.00 | 2.53 ± 0.25 b | 35.99 ± 0.87 d | 7.76 ± 0.10 e |
| 0.35 | 2.80 ± 0.09 b | 42.77 ± 0.87 c | 17.21 ± 0.15 d |
| 0.70 | 2.88 ± 1.07 b | 49.66 ± 1.48 b | 36.19 ± 0.33 c |
| 1.05 | 2.69 ± 0.09 b | 54.09 ± 1.46 a | 47.18 ± 0.30 b |
| 1.40 | 7.82 ± 1.27 a | 52.61 ± 1.35 a | 56.94 ± 1.21 a |
Disclaimer/Publisher’s Note: The statements, opinions and data contained in all publications are solely those of the individual author(s) and contributor(s) and not of MDPI and/or the editor(s). MDPI and/or the editor(s) disclaim responsibility for any injury to people or property resulting from any ideas, methods, instructions or products referred to in the content. |
© 2023 by the authors. Licensee MDPI, Basel, Switzerland. This article is an open access article distributed under the terms and conditions of the Creative Commons Attribution (CC BY) license (https://creativecommons.org/licenses/by/4.0/).
Share and Cite
Cao, W.; Chen, J.; Ma, S.; Chen, X.; Dai, X.; Zhang, L.; Guo, M.; Li, L.; Liu, W.; Ren, G.; et al. Structure Characterization and Functional Properties of Flaxseed Protein–Chlorogenic Acid Complex. Foods 2023, 12, 4449. https://doi.org/10.3390/foods12244449
Cao W, Chen J, Ma S, Chen X, Dai X, Zhang L, Guo M, Li L, Liu W, Ren G, et al. Structure Characterization and Functional Properties of Flaxseed Protein–Chlorogenic Acid Complex. Foods. 2023; 12(24):4449. https://doi.org/10.3390/foods12244449
Chicago/Turabian StyleCao, Weiwei, Junliang Chen, Shuhua Ma, Xin Chen, Xin Dai, Li Zhang, Mengyao Guo, Linlin Li, Wenchao Liu, Guangyue Ren, and et al. 2023. "Structure Characterization and Functional Properties of Flaxseed Protein–Chlorogenic Acid Complex" Foods 12, no. 24: 4449. https://doi.org/10.3390/foods12244449
APA StyleCao, W., Chen, J., Ma, S., Chen, X., Dai, X., Zhang, L., Guo, M., Li, L., Liu, W., Ren, G., Duan, X., & Xie, Q. (2023). Structure Characterization and Functional Properties of Flaxseed Protein–Chlorogenic Acid Complex. Foods, 12(24), 4449. https://doi.org/10.3390/foods12244449