Article

Sensory Determination of Peach and Nectarine Germplasms with Instrumental Analysis

1
Institute of Pomology, Jiangsu Academy of Agricultural Sciences, No. 50 Zhongling Street, Nanjing 210014, China
2
Jiangsu Key Laboratory for Horticultural Crop Genetic Improvement, Jiangsu Academy of Agricultural Sciences, No. 50 Zhongling Street, Nanjing 210014, China
3
Co-Innovation Center for Sustainable Forestry in Southern China, College of Biology and the Environment, Nanjing Forestry University, Nanjing 210037, China
*
Authors to whom correspondence should be addressed.
Foods 2023, 12(24), 4444; https://doi.org/10.3390/foods12244444
Submission received: 8 November 2023 / Revised: 30 November 2023 / Accepted: 6 December 2023 / Published: 11 December 2023
(This article belongs to the Section Food Analytical Methods)

Abstract

:
The flavour and mouthfeel of peaches are crucial qualities of peach germplasm resources that significantly influence consumer preferences. In this study, we utilized 212 peach germplasm resources from the Nanjing Peach Resource Repository, National Fruit Germplasm facility, Jiangsu Academy of Agricultural Sciences as materials for sensory analysis, electronic nose analysis, and composition analysis via high-performance liquid chromatography (HPLC). In the sensory analysis, we divided 212 peach germplasms into three clusters based on hierarchical cluster analysis (d = 5). No.27, No.151, and No.46 emerged as the most representative of these clusters. The electronic nose was used to conduct an evaluation of the aroma profiles of the 212 peach germplasms, revealing that the primary distinguishing factors of peach aroma can be attributed to three sensors: W1S (methane), W1W (terpenes and organosulfur compounds), and W5S (hydrocarbons and aromatic compounds). The primary differences in the aromatic substances were characterized by sensors W2W (aromatic compounds, sulphur, and chlorine compounds) and W1C (aromatic benzene). The HPLC analysis indicated that the persistence of peach sensory characteristics was positively correlated with acids and sourness and negatively correlated with sweetness and the ratio of sugar to acids. The overall impression of the 212 peach germplasms revealed a negative correlation with acids, while a positive correlation was observed between the overall impression and the ratio of sugar to acids. Therefore, this study substantially contributes to the preliminary screening of the analysed specific characteristics of peach germplasms such as No.27, No.46, No.151, and No.211. These selections may provide valuable information for the potential creation of superior germplasm resources.

1. Introduction

Peaches (Prunus persica (L.) Batsch) are the most important fruits in the world. Peaches are native to China and widely planted over 10,000 hectares (15.02 million tons, FAOSTAT, 2020), accounting for over 60% of the global total of peaches and nectarines. The evaluation of peach germplasm resources is important for their protection and utilization and the full exploitation of their potential economic, social, and ecological value in China [1]. The evaluation indexes used in this regard include morphological and biological characteristics, quality characteristics, stress resistances, and pest resistance. Recent studies have mainly focused on morphological and quality characteristics [2].
Peach fruit quality is composed of fruit appearance; internal, nutritional, and flavour quality; storage qualities; and stress tolerance [3]. Sensory evaluation, electronic nose analysis, electronic tongue analysis, and GC-MS are used to assess fruit flavour and palate as well as in comprehensive evaluation methods. Sensory evaluation involves the comprehensive and objective evaluation of the colour, aroma, taste, and appearance of food using human sensory organs (eyes, nose, mouth, teeth, hands, etc.), providing real data for mathematical and statistical analyses [4]. Previous research has been conducted on fruit wine and strawberry jam [5,6]. Sensory quality analysis plays a crucial role in the development of new food varieties, market prediction, setting product standards, and determining product shelf life [7]. Liu et al. [8] used fuzzy comprehensive judgment and the percentage total score method to objectively evaluate the colour, taste, and flavour of canned yellow peaches. However, there is limited research on the sensory analysis of fresh peach germplasm resources.
An electronic nose is a sensitive device used to detect a wide range of volatile compounds through the overall response of a specific sensor and a pattern recognition system [9]. Its advantages are its simplicity, rapidity, and facilitation of non-destructive sample analysis and automatic data collection. It is widely used in food testing, environmental monitoring, air-quality monitoring, and healthcare [10]. In the context of fruits, it can be used for variety identification, harvest and shelf-life judgement, disease identification, and the determination of freshness, ripeness, and decay [11]. An electronic nose not only enables the comparison and analysis of the odour information from different samples but also facilitates the establishment of a database by collecting the fingerprints of standard samples. This database can be used for the qualitative and quantitative analysis of the unknown components in samples [12].
This study combines sensory evaluation and electronic nose analysis with HPLC to explore the differences in aroma and palate among peach fruits with different flesh types and colours in 212 peach germplasms. The findings contribute to the selection, breeding, and utilization of excellent peach germplasms and improve the evaluation methods for peach germplasm resources, meeting the new demand pertaining to production and consumption.

2. Method and Materials

2.1. Plant Materials

The 212 varieties of peaches/nectarines (Appendix A) analysed were harvested at the National Peach Germplasm Repository (Nanjing, China, 32°20′ N, 118°52′ E, located 11 m above sea level) from May to July 2022, with each variety represented by two trees. The test varieties were 5-year-old mature trees with a Y shape and a row spacing of 3 to 5 m, and conventional cultivation measures were employed. Samples (50 peaches/nectarines) of each variety were randomly collected upon reaching maturity (defined as the disappearance of green coloration on the bottom of the fruit) from the two trees [13,14]. Samples were harvested before 11:00 a.m. A total of 30 fruits of each variety were immediately stored in a freezer (−80 °C) for E-nose and HPLC measurement. A total of 20 fruits of each variety were taken into the sensory room for evaluation the following afternoon.

2.2. Sensory Analysis

The quantitative descriptive analysis method was used to train the sensory panel and carry out the sensory analysis according to the Sensory Analysis–Methodology Paired comparison test (ISO, 5495:2005) [15]. Different samples of peaches and nectarines were used to allow the panel members to recognize their qualitive characteristics. Based on their availability, health, and general food habits, ten candidates (postgraduate students and researchers from JAAS, comprising five females and five males) were pre-screened. They volunteered for the project. All subjects gave their informed consent for inclusion before they participated in the study. In this study, materials were taken from the National Peach Germplasm Repository, Nanjing, China. These materials are safe for sensory research. All the experimental procedures involving volunteers were conducted in accordance with the Declaration of Helsinki. Also, the volunteers had the ability to discriminate between products according to basic taste thresholds and to describe their perceptions. Panel descriptions and definitions for peach and nectarine attributes (flavour, palate, persistence, and overall impression) were developed through brainstorming and round-table consensus.
The next step was to develop the score sheet for the different attributes for analysis. Flavour was evaluated according to being fruity, floral, earthy, woody, caramel, nutty and herbaceous, or vegetative. Palate (aroma, sweetness, sourness, and bitterness and astringency), persistence, and over impression were evaluated by assigning categorical scores from 0 to 10 (0, no sensation; 0.1–1.9, absence of sensation; 2.0–4.9, weak; 5.0–7.9, moderate; 8.0–10, intense) [16]. Each of them independently estimated 20 fruits of typical size and appearance and with similar ripeness per germplasm. Then, each panellist randomly chose two fruits from each variety for palate evaluation. The evaluated samples were not named until the end of the evaluation. The evaluations were judged at 10 a.m in individual booths under white light.

2.3. E-Nose Measurement for Fruit Aroma

In total, 15 fruits were randomly divided into 3 blocks for E-nose measurement and analysed in triplicate. Measurements were performed using a portable, commercially available E-nose (PEN3.5, Airsense Analytics GmbH, Schwerin, Germany). The sensor array of the PEN3.5 has ten metal oxide semiconductor-type chemical sensors (Table 1) capable of operating at high temperatures to permit the classification and identification of different volatile species. When the sensors were exposed to volatiles, the changes in the conductivity (G)-to-initial-conductivity (G0) ratio (G/G0, relative conductivity or response value) depended on G conductivity. The concentration of volatiles led to the deviation of G/G0 (greater than or less than 1). In this study, 10 g of flesh from each sample was placed into a 300 mL beaker covered with sealing film. The beaker was kept at 25 °C for 30 min for E-nose evaluation. The aroma measurement method used followed that reported by Yan et al. [17], with some modifications. We inserted the E-nose sampling needle into the sealing film and extracted the gas in the beaker for detection. The volatile gas was pumped over the sensors of the E-nose at a flow rate of 400 mL/min. The E-nose analyses were recorded over a range from 0 to 60 s. One to three stable signals (response values) were observed to be in the middle period of the data stabilization time [18]. After each analysis, the sampling chamber was washed with an air-dried flow for 60 s.

2.4. HPLC Measurement for Sugars and Acids

A total of 15 fruits were randomly divided into 3 groups for HPLC measurement and analysed in triplicate. The method of HPLC measurement for sugars and acids followed was modified by Shen et al. [19]. Using 5 mL of extracting solution (ethanol: 0.2% metaphoric acid v/v), 0.5 g of the flesh was ground and extracted using ultrasound waves for 1 h. The solution was centrifuged for 5 min at 10,000 rpm and 4 °C. The 0.8 mL supernatant was dried using a concentrator (Eppendorf, Concentrator plus, Sigma Aldrich, Saint Louis, MO, USA, 230 V/50–60 Hz) for 2 h. A total of 1.6 mL of ultrapure water was added to the concentrate to obtain sugar/organic acid solution. The samples were filtered through a 0.22 μm nylon syringe filter into an HPLC glass vial and capped tightly. Then, 0.5 μL portions of the samples were injected into an HPLC system with a 10 μm, 250 × 6 mm CARBOSep CHO-620 CA column (Transgenomic, Omaha, NE, USA) to detect soluble sugars at 80 °C using a differential refractive index detector. For the mobile phase, we used ultrapure water added at 0.5 mL min−1.
A total of 0.5 μL of the samples was injected into an HPLC system with a 5 μm, 250 × 4.6 mm ZORBAX Eclipse XDB-C18 column (Agilent, Santa Clara, CA, USA) to analyse organic acids at 2 °C using a VWD UV detector (λ = 214 nm). The mobile phase was 0.02 mol/L of KH2PO4 (pH 2.7) for 0.5 mL min−1. Data were analysed using the Chemstation (Agilent) chromatography data system. KH2PO4 was used as a standard for each batch of samples. A total of 0.02 mol/L of KH2PO4 (pH 2.7) (3.333, 1.667, 0.333, 0.167, and 0.033 g/L) was used to establish a standard curve for reporting organic acids. Soluble sugars and organic acids were identified by their retention times, and their concentrations were calculated in parallel to calibrate the internal ultrapure water and 0.02 mol/L of KH2PO4 (pH 2.7) standard curves.

2.5. Statistical Analysis

Sensory and HPLC data were tested in terms of their average characteristics at maturity using IBM SPSS Statistics 22 (IBM, Armonk, NY, USA). Pearson correlation test (p < 0.05) was conducted to analyse the relationship between sensory indexes and sugars and acids. Principal component analysis (PCA) and hierarchical cluster analysis were performed using OriginPro 2021 (OriginLab Corporation, Northampton, MA, USA). Data related to E-nose were processed using the WinMuster program in PEN3.5 (Airsense Analytics GmbH, Schwerin, Germany) and OriginPro 2021. The main sensors used for main peach smell detection were analysed via loading analysis (LOA) using WinMuster software (Version 1.6.2.15–2011, Airsense Analytics, Schwerin, Germany). Principal component analysis (PCA) and hierarchical cluster analysis were performed using OriginPro 2021 based on main and aromatic substance sensors.

3. Results

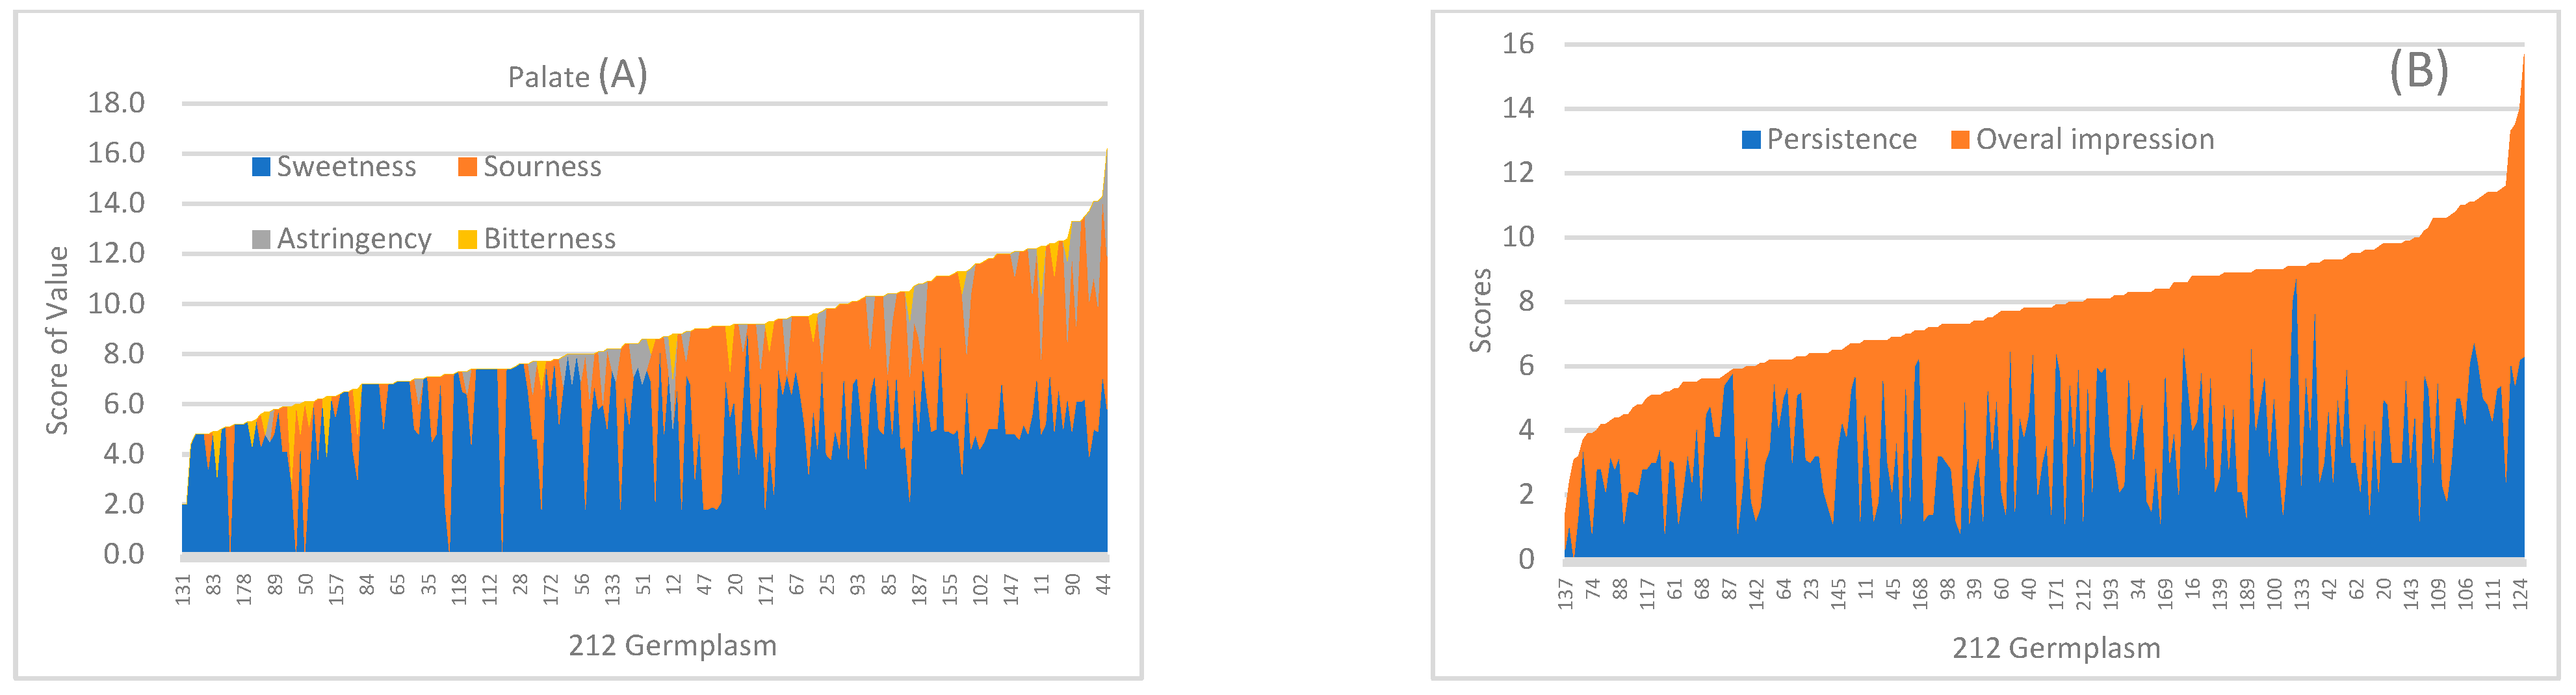
3.1. Sensory Analysis

The sensory evaluation results for the 212 peach germplasms are shown in Appendix A, including the scores for sweetness (0–9.2), sourness (0–7.5), astringency (0–6.3), and bitterness (0–3.1). In Figure 1A, sweetness has a larger area than sourness, astringency, and bitterness. Five germplasms exhibited intense sweetness (8–10 points); five germplasms elicited no sensation (0); and nine germplasms provoked a near absence of sensation (0.1–1.9). The most prominent sweetness was that of No.134. Regarding sourness, 79 resources elicited no sensation of sourness, 33 scored between 0 and 2.4, and 101 scored between 2.5 and 7.5. Only a small percentage of germplasms elicited astringent or bitter sensations. Astringency was weak in 17 germplasms and moderate in No.200. Three germplasms (No.2, No.11, and No.37) had weak bitterness.
Persistence was described as the duration of flavours and aromas for a peach, ranging from none to long. As indicated in Figure 1B, No.164 showed no persistence, 39 germplasms had a short finish (0.1–1.9), and 112 peach fruits exhibited short to medium persistence (2.0–4.9), constituting the largest group in the study. No.38, No.47, and No.119 had long finishes (8.0–10.0). Overall impression encompassed final thoughts with a rating (score out of 10) and freestyle impressions, aiding in distinguishing the participants’ favourite peaches. Germplasms were evaluated as excellent (8.0–10.0), good (5.0–7.9), medium (2.0–4.9), and poor (0.1–1.9), with 40 poor, 88 medium, 77 good, and 7 excellent germplasms. No.76 had a poor overall impression, while the highest scores for excellent impressions were those for No.209 and No.134.
‘The Davis Wine Aroma Wheel’ is an ideal tool for identifying and visualising the various tastes, smells, and aromatic qualities in most wines, regardless of grape variety. According to this wheel, the 212 peach germplasms contain special flavours such as fruity (passion fruit, lemon, citrus, apple, green apple, honeydew, mango, apricot, juicy honey peach, and yellow peach), floral (gardenia, jasmine, rose, and violet), herbaceous or vegetative (herb, grass, celery, carrot, and lotus seed), caramel (candy, popcorn, molasses, and honey), woody (smoky and rubber), nutty (peanut, cereal, and red bean), animal (butter/milk), and pungent (metal) as well as faults like being spoiled and exuding off-odours.
Table 2 indicates that 137 germplasms possessed one or more special flavours, while 75 germplasms lacked any special flavour. Notably, No.15 and No.196 each had three distinct flavours (lemon, gardenia, and smoky for No.15; mango, violet, and butter/milk for No.196). A total of 29 germplasms had a violet aroma, and 31 germplasms had a butter/milk aroma. Certain aromas were unique to one germplasm, such as apricot (No.207), herb (No.173), celery (No.137), lotus seed (No.168), carrot (No.118), and rubber (No.111). Seven germplasms exhibited faults, including being spoiled (No.38, No.50, and No.76) and exuding an off-odour (No.11, No.123, No.160, and No.199).
Principal component analysis (PCA) revealed the influence of each sensory descriptor on the evaluation of peach germplasm resource (Figure 2A). The first principal component (PC1) accounted for 46.1% of the variance, with sweetness and overall impression contributing significantly. Sourness and persistence also had negative loadings for PC1. The variance contribution of the second principal component (PC2) was 19.2%, with astringency and bitterness serving as major contributors. Thus, PC1 reflected an enjoyable taste, while PC2 was associated with negative feedback. No.211 was characterized as sweet with a great impression, while No.101 was perceived as astringent and bitter with an unpleasant impression. No.119 had light sweetness, strong sourness, and a long finish, resulting in a harsh impression. Additionally, sweetness correlated closely with overall impression, as did sourness with persistence. Cluster analysis categorized the 212 germplasms into three groups (Figure 2B), with 127 in cluster 1, 13 in cluster 2, and 72 in cluster 3. No.27, No.151, and No.46 were the most representative of their respective clusters.

3.2. Instrumental Analysis

Response to Different Sensors Evaluated via E-Nose

Based on the response values of 10 sensors, 212 peach germplasm samples were divided into four categories (d = 15) (Figure 3): 186 were assigned to Class I, 23 were assigned to Class II, 2 were assigned to Class III, and 1 was assigned to Class IV. Consequently, No.82, No.91, and No.193 were deemed notable for their distinction from Class I and II.
In Figure 4A, the W1W sensor had an influence on both the first and second principal components. The sensors W1S and W5S contributed to the first principal component. To validate the significance of sensors W1W, W1S and W5S in differentiating the peach fruit aromas, the three sensors were analysed in the current mode, as depicted in Figure 4B. They collectively accounted for 99.99% of the total contribution, signifying a substantial role in the discrimination of peach fruit aromas in the experiment.
Figure 5 exhibits the response values of No.193 to the various sensors of an electronic nose, with peak values around at 24s. A stable period for further analysis was determined to be from 35 s to 37 s. Among the ten sensors, W1S (short-chain alkanes) exhibited the greatest response, followed by W5S (hydrocarbons and aromatic compounds), W1W (terpenes and organosulfur compounds), W2S (alcohols, ethers, aldehydes, and ketones), W6S (hydrogen), W2W (aromatic components and sulphur and chlorine compounds), W5C (nitrogen oxides), W3C (ammonia and aromatic compounds), and W1C (aromatic benzene). The largest response value was observed for W1S (32.702 ± 0.015), followed by W5S (32.803 ± 0.067), W1W (24.373 ± 0.102), and W2S (8.789 ± 0.005). The other sensors had lower response values of around 1. The coefficients of variation for W5C, W2W, and W1W were 1.24%, 0.74%, 0.39%, and 0.42%, respectively. W1C and W3S displayed relatively minor coefficients of variation, amounting to 0.14% and 0.04%, respectively.
Figure 6 and Figure 7 show the stable signals for Classes I and II in the response values of the three primary sensors and the three aromatic sensors. The response values of the three main sensors differed significantly between Class I and Class II. Compared with the response values of the three aroma sensors, germplasms in Class I responded notably to the sensor W1C, while germplasms in Class II responded significantly to sensor W2W. This result was consistent with the previous results for the coefficient of variation. It indicates that the differences in peach aromas predominantly arose from non-aromatic substances such as methane, nitrogen oxides, and hydrogen sulphide, with variations in aromatic substances primarily reflected in the response values of W2W and W1C.

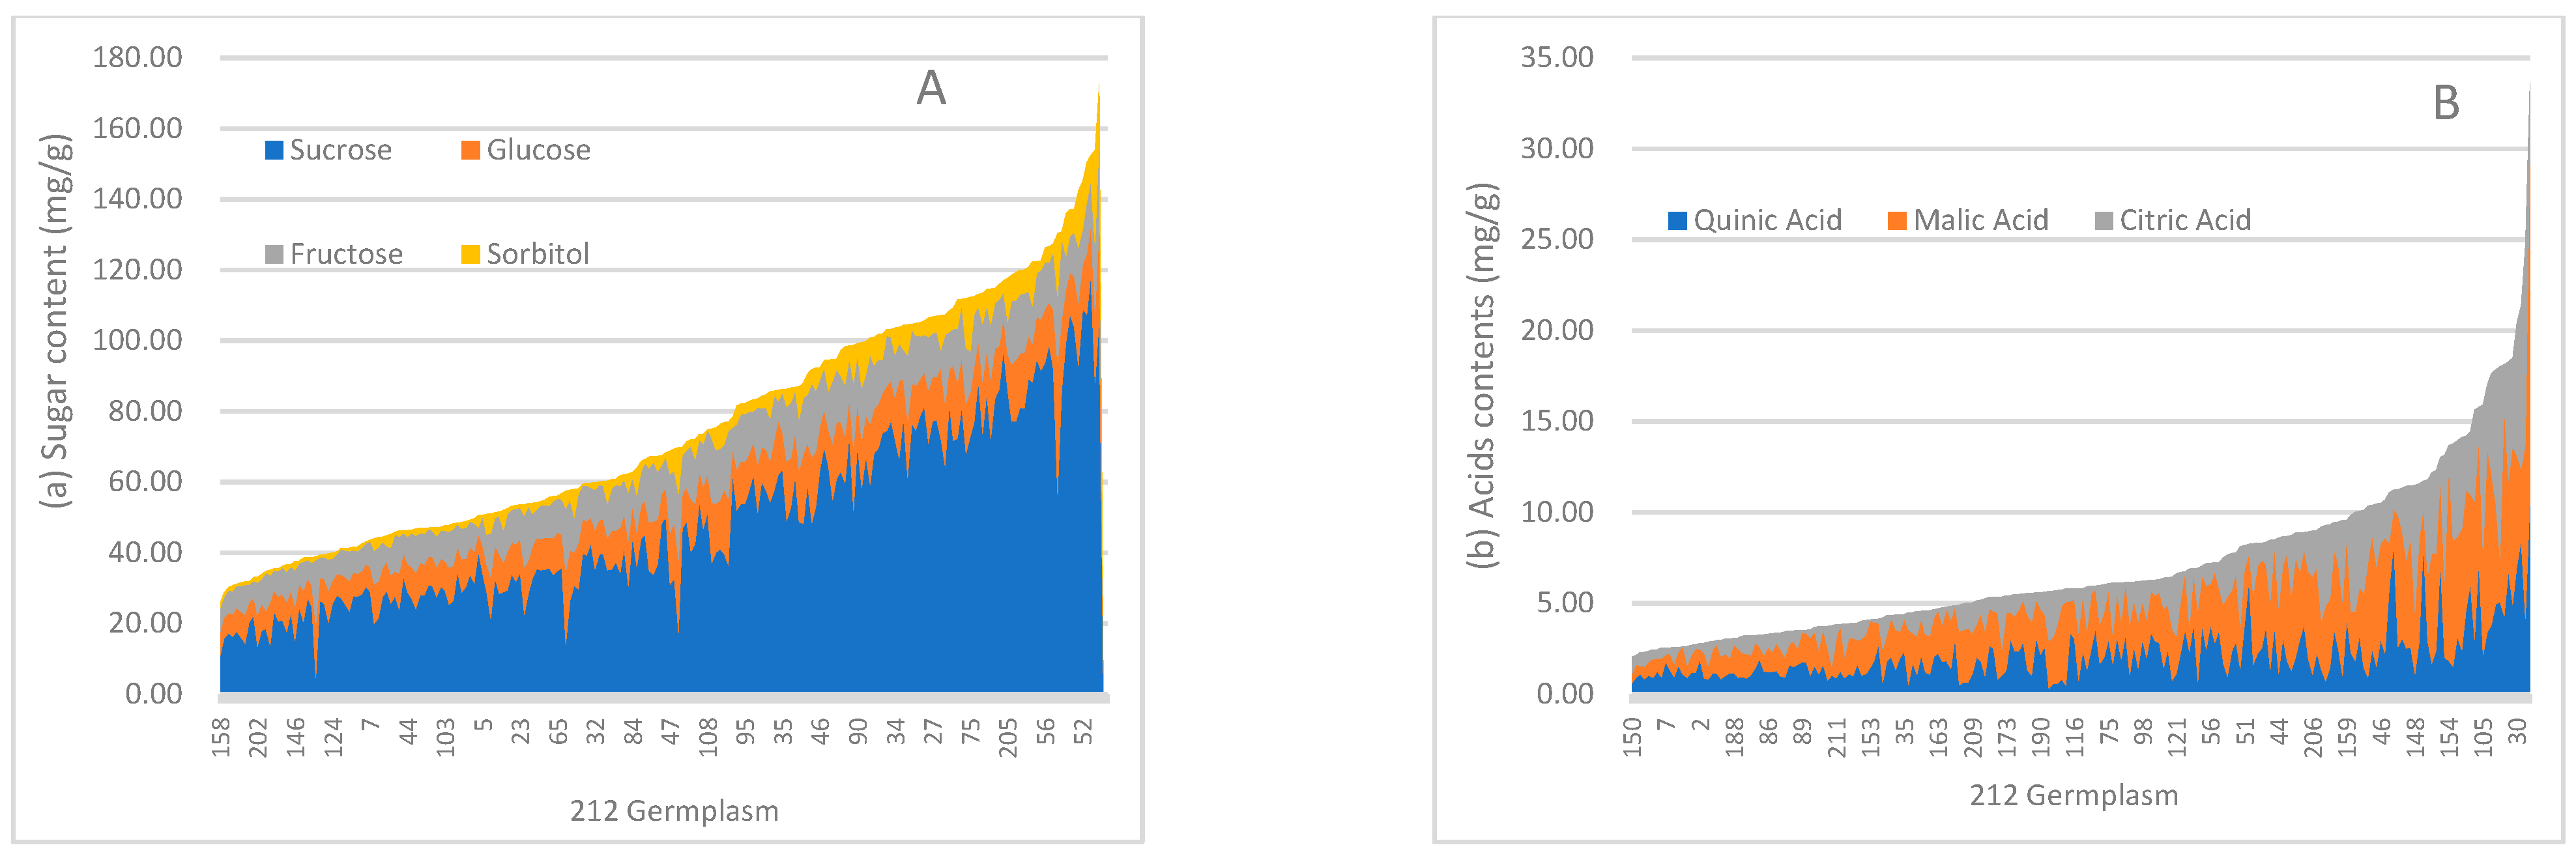
3.3. Sugars and Acids Identified via HPLC

Figure 8A presents the sucrose, glucose, fructose, and sorbitol content of 212 germplasms determined via HPLC, with sucrose ranging from constituting 11.9% to 83.3% (from 4.61 mg/g to 118.28 mg/g) of the total sugar content, while sorbitol corresponded to the lowest content, ranging from 0.01 to 26.80 mg/g (from 0% to 18.6%), in the 212 germplasms. The glucose and fructose percentages were similar, spanning from 3.8% to 47.7%. No.158 had the lowest total sugar content at 25.86 mg/g, whereas the highest content was 172.61 mg/g, corresponding to No.73. In Figure 8B, the total acid content varies from 2.07 mg/g in No.150 to 33.61 mg/g in No.76. The quinic acid content ranges from 0.32 to 10.72 mg/g, accounting for 5.6% to 76.3% of the total acid content. The malic acid content also showed similar ranges (0.40 to 19.26 mg/g) and percentages (from 12.9% to 79.6%) across the germplasms. No citric acid was detected in No.36, No.157, and No.203, while the highest citric acid content was found in No.64.
PCA was performed to assess the impact of sugars and acids on the evaluation of peach germplasms (Figure 9). The first principal component (PC1) accounted for 49.5% of the variance, with sugars and acids providing the largest contributions. The second principal component (PC2) contributed 25.9% to the variance, with the ratio of sugars to acids and sucrose contributing significantly. Quinic, malic, and citric acids had negative loadings for PC2. Thus, PC2 reflects a taste profile emphasizing sweetness. No.107 was characterized by sweetness with light sourness, but No.155 was sour with a hint of sweetness. No.49 had negative loadings for both PC1 and PC2. Additionally, a close relationship was found between sweetness and total sugars, similar to the relationship between malic acids and total acids.

3.4. Comparison of Instrumental and Sensory Results

A negative correlation existed between sweetness and quinic, malic, and citric acids (r > −0.7), while a positive correlation was observed between sweetness and the ratio of sugar to acids (r < 0.6) (Figure 10). Sourness negatively correlated with sweetness and the ratio of sugar to acids but positively correlated with acids. Persistence showed a positive correlation with acids and sourness and a negative correlation with sweetness and the sugar-to-acid ratio. Overall impression correlated negatively with acids and sourness while correlating positively with sweetness and the sugar-to-acid ratio.

4. Discussion

Fruit quality evaluation is an important component of peach fruit quality research. Sensory evaluation is commonly used to assess fruit quality. Based on the evaluation criteria, different samples are scored, allowing for the calculation of the mean values [20,21]. This study included the sensory determination of 212 peach germplasm resources, focusing on aroma, palate (sweetness, sourness, astringency, and bitterness), persistence, and overall impression. In 212 peach germplasm resources, the predominant taste profiles, ranked from highest to lowest, were sweetness, sourness, astringency, and bitterness (Figure 1A). No.134 exhibited the most pronounced sweetness, with an excellent impression, resulting from its high total sugar content and low total acids content. The long-finish germplasms (No.38 and No.47) presented high total acid content (over 15 mg/g) and a small ratio of sugar to acid (below 5). The PCA revealed the influence of each sensory descriptor on the evaluation of peach germplasm resources. PC1 reflected an enjoyable taste, while PC2 corresponded with negative feedback. The sensory evaluation highlighted that No.211 was sweet with a great impression, but No.101 was astringent and bitter, resulting in an unpleasant impression. The profile of No.119 included light sweetness, strong sourness, and a long finish, leading to a harsh impression. These findings reveal the importance of a strong characteristic aroma in shaping consumer preferences. However, some germplasms can present a faulty flavour because of an excessively strong aroma. An overly strong passion fruit flavour had the potential to present bromhidrosis in one sensory evaluation [22]. Thus, it was crucial to screen for peach germplasms with intense sweetness and an appropriate characteristic aroma to enhance peach quality.
An electronic nose (E-nose) is a simple, efficient, non-destructive, and stable device that imitates the human olfactory system. It has been used for assessing fruit quality and ripeness and in other applications [23,24]. In our research, W5S, W1S, and W1W could explain up to 99.99% of the total contributions, indicating that these non-aromatic substance classes (nitrogen oxides, methane, and hydrogen sulphide) distinguished the peach fruit aromas in our research. The distinction in aromatic substance classes corresponded mainly to the response values of two sensors (W2W and W1C); these values aligned with studies on pear and blueberry quality and aroma evaluation [25,26]. Upon comparing the results of the sensory evaluation and E-nose, the germplasms in Class I responded significantly to sensor W1C, which correlated with sensory perceptions of milk and caramel flavours. Germplasms in Class II showed a significant response to sensor W2W, associated with floral and herbaceous sensations. Notably, No.82, No.91, and No.193 were the most representative samples, with distinctive aromas of apple, butter/milk, and violet, respectively. These could serve as valuable indicators for fruit quality assessment and determining consumer preferences [27,28]. Thus, they could be used in developing new peach germplasm with excellent aroma profiles.
Sucrose and malic acid were identified as the predominant components in peach germplasms, corroborating the results of previous studies [29]. The correlation between the sensory and HPLC results indicated that the fruits’ sweetness was primarily determined by their sugar content. The relative sweetness perceptions of fructose, sucrose, and glucose has been rated as 1.75, 1, and 0.75, respectively [16]. Despite high levels of sugars, peach sweetness was not necessarily pronounced because of sucrose. Sucrose made up the largest share of total sugars and did not contribute as strongly to sweetness. Additionally, the types of sugars and their ratio with respect to acids also affected perceived sweetness. Malic acid, which imparted a soft, refreshing, slightly irritating, and long-lasting sour–bitter taste, was the primary acid in peaches, while citric acid provided a pleasant, quickly dissipating sour taste. Three germplasms (No.36, No.157, and No.203) lacked citric acid, resulting in less sourness detected in their sensory evaluations. Furthermore, for the 212 peach germplasms studied, it was observed that a sugar-to-acid ratio exceeding 20 corresponded to sweetness scores above 5. This finding supports the results of the research by Colaric et al. [14], who suggested that a sugar-to-acid ratio ranging from 20 to 60 is typically associated with a moderate level of perceived sweetness. This ratio is important because it provides a balance of flavours, contributing to the overall sensory pleasure elicited by and the acceptability of peach fruit by consumers. By analysing the sugar-to-acid ratio, breeders and researchers can better understand and predict the sweetness profiles of peaches, constituting a crucial factor in consumer satisfaction and the marketability of the fruit.

5. Conclusions

In this study, we employed sensory evaluation, an electronic nose (E-nose), and high-performance liquid chromatography (HPLC) to assess fruit quality attributes such as aroma, sugars, and acids across 212 peach germplasm resources. These methods significantly contributed to the preliminary screening of peach germplasms with specific desirable characteristics. This study provides essential information that could facilitate the creation of superior germplasm resources. Therefore, evaluating and analysing the aroma and taste profiles of peach germplasms hold significant theoretical and practical value for the discovery, development, and utilization of high-quality peach resources. For future research, the integration of the electronic nose technique with headspace solid-phase microextraction (HS-SPME) and gas chromatography–mass spectrometry (GC-MS) could enhance the discrimination of peach fruit aroma components and aid in identifying the key aroma compounds within peach germplasm resources. This multidisciplinary approach may lead to a deeper understanding of the complex interactions between volatile compounds and contribute to the advancement of peach breeding programs targeting improved fruit aromas and flavour.

Author Contributions

Conceptualization, M.S.; Methodology, J.Y.; Investigation, J.M.; Resources, Z.C.; Data curation, J.Y.; Writing—original draft, M.S.; Writing—review & editing, R.M.; Supervision, Y.X.; Project administration, M.Y.; Funding acquisition, Z.S. All authors have read and agreed to the published version of the manuscript.

Funding

This work was supported by the China Agriculture Research System (CARS-30); the Species Conservation Project of the Ministry of Agriculture and Rural Affairs (19210895); National Crop Germplasm Resources Infrastructure in China (NHGRC2020-NH16); Accurate Identification of Peach and Strawberry Germplasm Resources in Southern China (19230697); and the Species Conservation Project of Crop Germplasm Resources (Peach and Strawberry) in Jiangsu Province (2023-SJ-011).

Institutional Review Board Statement

All participants volunteered to take part in this project. All subjects gave their informed consent for inclusion before they participated in the study. In this study, materials were taken from the National Peach Germplasm Repository, Nanjing, China. These materials were safe for sensory research. All the experimental procedures involving volunteers were conducted in accordance with the Declaration of Helsinki.

Informed Consent Statement

Informed consent was obtained from all subjects involved in the study.

Data Availability Statement

Data are contained within the article.

Conflicts of Interest

The authors declare no conflict of interest.

Appendix A. Germplasm Resource Information of 212 Peaches

NumberGermplasm NameCountry of OriginAromaPalate and TastePersistenceOverall RatingThe Ratio of Sugars to Acids
SweetnessSournessAstringencyBitterness
1Li Xia HongCHN3.552004520.3
2Chun LeiCHN43.9002.43.2421.3
3Zao Shuo MiCHN4.45.82.3004.75.318.8
4Zao MeiCHN3.84.61.81.304.55.122.8
5Chun HuaCHN3.63.82.4003.64.215.5
6Hu 021CHN44.12.50022.817.8
7Zao Xia LuCHN34.430044.617.2
804-13-40CHN5.55.22.60045.214.8
9Yun Long Shui MiCHN7.5800056.35.8
10Zao Lu Pan TaoCHN5.1602.105.3520.5
11Jing ChunCHN7.54.832.524.8216.0
12Chun YanCHN65021.84.9412.6
1382-18-73CHN6.27.80005632.6
14MayfireUSA7360062.38.3
15SpringCrestUSA4.854006.157.6
16Jin Shan Zao HongCHN76.800044.814.3
17TakeiwasehakuhoJPN6.25.20004.34.514.4
18Zao Hong ZhuCHN6.36.42003.8417.9
19Hua GuangCHN231.801.84213.2
20Shu GuangCHN36.230054.810.6
21SaotomeJPN67.500035.427.7
22SpringtimeUSA3570062.84.6
23Bai Xiang LuCHN6.56.500033.415.3
24Jin Shan Zao LuCHN77.400033.88.0
25ArmkingUSA2.545.8004.853.6
26Xia Hui 3CHN7.47.401.803.24.115.9
27Sha Ji 2CHN4.26.20002.8626.0
28Zao Hong Bao ShiCHN3.87.600036.312.3
29Tsukuba 86JPN2.44.81.2103.15.213.6
30FlordacrestUSA6.44.96.201.35.84.45.5
31SunsplashUSA03.26005.84.16.1
32NJN72USA6.86.83.3004.94.16.4
33RobinUSA7.17.600036.121.5
34Favolate 3ITA7.453.2004.14.210.0
35Hui Yu LuCHN7.57.100036.519.7
36Yang Zhou Zao Tian TaoCHN3.24.11.8002.13.815.1
37Kun Ming Hong Rou TaoCHN02.8003.132.116.9
38Mang Zhong LuCHN01.97.20081.15.0
39Xia Hui 1CHN3.26.31.81.102.64.817.9
40Spring SnowUSA4.14.52.6004.53.313.7
41Tropic PrinceUSA6.13.860065.28.3
42FlordakingUSA7.27.14.9004.84.55.5
43CrimsonbabyUSA4.83.46.9005.12.57.2
44TX2B7NUSA57.27.1006.23.25.4
45Zi Jin Hong 1CHN7.15.92.601.12.14.810.5
46BabioleFRA6.94.26.3005.82.38.8
47Hong TaoCHN01.87.2008.214.4
4885-13-24CHN9.57.51.9002.13.48.4
4963-15-75CHN1.26.801.201.84.212.8
50Hong Rou Tao 1CHN006.1005.80.913.0
51Li Jiang TaoCHN06.801.801.64.513.7
52TX4C199USA07.40002.16.826.4
53Yu Hua 3CHN4.680001.15.413.0
54Jing Ling Huang LuCHN4.86.430035.217.9
55An Nong Shui MiCHN6.27.401.201.45.825.5
56Jiang Jin IV2-9CHN6.56.901.101.25.617.5
57Hikawa HakuhouJPN7.17.70004.86.619.3
58Early Chinese ClingCHN3.856.1302.8211.8
59HatsukamiJPN6.63.96.23.605.81.27.5
60Ying Hua LuCHN6.87.20.51.202.15.619.9
61Early White GiantUSA5.84.86.31032.312.9
62TX4C189LNUSA06.43.10036.528.8
63Mei Gui HongCHN2.56.82002.1610.8
64NJN70USA225.20051.24.5
65Hu You 018CHN4.86.90001.8519.9
66Red JuneUSA64.96.2005.31.44.1
67Hu You 003CHN3.47.42.1002.16.118.7
68Rui Guang 22CHN6.95.23.2001.83.89.0
69QuettaIND3.81.87.3006.61.25.9
70TX4C188LWNUSA6.66.91.100.61.46.38.4
71TX2C104NUSA52.17007.10.65.6
72SunraycerUSA4.24.25.8004.51.16.4
73Xian Yang Hong Rou TaoCHN2.14.83.9002.11.812.0
74Xiao Hong Pao CHN1.25.40000.83.121.7
75Shen Nong Hong RouCHN032.1012.81.618.4
76Bei Jing Yi Xian HongCHN1.606005.80.13.9
77Ye Ji HongCHN3.84.40002.12.110.4
78Tang Shan TaoCHN04.8001.21.13.49.2
79Jie TaoCHN06.30000.85.16.5
80Jin XiangCHN4.6700036.815.6
81ChiyohimeJPN2.14.80001.25.921.3
82NunomewaseJPN350000.84.418.9
83Zao Jin LuCHN24.90005.13.815.8
84Jin Hua LuCHN1.86.80006.27.124.7
85Jiu YanCHN07.203.201.46.47.5
86Jing HongCHN4.27.101.3036.811.6
87Bao Pi Yang TaoJPN6.81.87.2005.60.26.5
88Bei Nong 2CHN7.24.87.2003.21.218.05
89NatsukiJPN3.84.81002.81.423.25
90Fertini MorettiniITA3.24.97.21.2062.110.5
91Zhe Jin 2CHN74.57.20061.17.2
92Spring GoldUSA54.96005.83.25.1
9385-13-19CHN4.47.13003.25.86.3
94Jin XuCHN4.44.954.203.32.211.6
95Nagin 1JPN054.8004.93.423.2
96Yu Hua LuCHN2.14.800032.18.9
97Yuan Dong Bai TaoCHN1.47.400037.614.4
98Tou Xin HongCHN07.450034.313.9
99SunkingUSA65.27.1005.21.15.9
100NJN76USA7.456.3005.23.89.4
101Liu Yang Si Jin TaoCHN1.86.32.23.20.93.13.210.5
102PegasoITA4.84.27.40062.85.1
103SunblazeUSA2.107.2003.50.25.1
104FlordagloUSA74.87.4006.84.32.8
105MaravilhaUSA6.956.8005.40.35.1
106Hu You 004CHN07.12004.26.819.6
107Hu You 007CHN3.25.10002.35.928.3
108Zi Jing Hong 2CHN1.86.82.1005.46.127.2
109Early Red 2USA6.86.75.8005.84.87.3
110Sheng GuangCHN2.46.41.82.1026.610.3
111801CHN7.27.42.6004.37.116.8
112Rui Pan 1CHN6.87.400036.818.5
113Zao Feng WangCHN06.80002.86.121.5
114Kana IwaJPN07.40002.46.916.0
115Da Zhao Huang Tao CHN5.87.40002.38.321.6
116Mei TingCHN2.14.8000.92.84.517.4
117Qu Jing Tian Tao CHN1.84.63.1002.82.26.1
11863-15-59CHN1.37.30005.48.113.0
119Yi Xian BaiCHN007.4008.90.24.8
120Rui Guang 7CHN1.24.25.4003.12.111.9
121Ao19AUS4.356.1005.41.97.3
122Rui Guang 19CHN6.97.23.1003618.0
123Rui Guang 2CHN4.36.10002.17.613.0
124Feng HuangCHN76.50006.27.87.6
125RedhavenUSA6.856.8005.14.211.9
126VesuvioUSA4.24.84.51.103.23.210.6
127SunfreUSA01.86.2005.40.85.5
128Silver LoadUSA4.14.33.801.23.42.88.2
129GalaxyUSA4.26.50.80037.713.2
130TX4D170USA1.81.870060.86.7
131Ban HanCHN720001.11.312.2
132Xia Hui 5CHN5.86.80001.48.222.9
133Mei Guo Hong Pan TaoUSA6.17.400.802.36.814.7
134UFO4ITA9.29.20006.39.418.2
135SaturnUSA1.36.80002.16.711.3
136Jin Jiu HongCHN4.36.134.203.23.217.9
137NectarossUSA03.1001.80.31.17.5
138Hong Gan LuCHN3.26.90001.26.123.2
139You DaoCHN6.86.53002.56.321.5
140Rui Guang 2CHN4.34.82.30025.86.1
141Yue 172CHN4.37.20001.17.36.3
142Qing Pi Qiu TaoCHN4.45.30001.24.823.3
143Qing GuangCHN3.17.430036.913.8
144Crimson GoldUSA04.36.2005.82.35.2
145Rui Guang Mei YuCHN1.24.11.8003.43.110.4
146FuzalodeFRA6.93.27.200.95.60.63.9
147TX4F244CUSA3.24.87.20062.17.6
148Rose PrincessUSA1.355.3005.11.25.0
149Da Hong PaoCHN7.36.901.305.36.15.3
150Da Tian TaoCHN051.80033.119.2
151Yi Xian HongCHN1.14.30012.12.412.4
152Lu Shui Tao 6CHN1.24.31.3003.24.24.8
153Xai CuiCHN06.900055.824.3
154Tian Jin Shui MiCHN005.1002.81.25.6
155Flavor GoldUSA4.84.96.2004.80.83.7
156Xiang Jin PanCHN2.14.85.5005.83.316.6
157Xia Hui 6CHN1.85.50.8001.56.221.2
158Lu LinCHN04.80001.14.26.9
159Huang Nian HeCHN4.15.51.801.82.43.111.4
160Miyako HakuhouJPN3.85.20002.14.319.5
161Tsukuba 89JPN1..251.21.802.12.619.1
162Asama HakutoJPN4.67.10001.47.610.1
163Xiao Hong HuaCHN1.36.51.1002.16.821.9
164MatsumoriJPN1.53.41.40003.18.9
165Ta QiaoCHN5.88.62.5003.55.818.6
166CullinanUSA02.152.21.25.82.210.7
167HarkenCAN7.15.64.81.805.61.912.2
168FredericaUSA5.23.86.2006.30.812.8
169Vista RichESP02.46.9006.22.25.9
170RedtopUSA04.67.5006.81.89.4
171LisbethHUN1.81.87.4006.51.49.1
172CatherinaESP7.26.21.5004.25.49.4
173Zao Shu Huang Gan TaoCHN6.51.84.801.13.81.88.3
174Blaze PrinceUSA05.44.8004.12.16.0
175RumianaBGR5.16.14.8003.21.14.9
176Rui Pan 5CHN3.87.602.102.17.419.6
177Rui Pan 3CHN2.16.80001.86.514.6
178Yu Xia Pan TaoCHN1.85.20001.25.515.3
179Jin Xia Pan TaoCHN7.27.40001.56.816.5
18063-13-35CHN04.501.201.85.215.9
181Babygold 5USA6.85.24.30033.26.5
182Babygold 6USA7.27.25003.83.111.7
183Stark DeliciousUSA3.23.26.3004.32.29.3
184NJC3USA6.16.17.2003.54.56.3
185Fa Guo You TaoFRA4.81.86.4004.31.28.5
186Stark SungloHUN5.12.16.5003.81.85.1
187YoshihimeJPN1.84.93.82.103.44.119.0
188Xia Hui 7CHN6.45.80001.16.217.3
189Yang Shan 2CHN57.500.901.37.622.3
190Jing FengCHN7.26.82.51.4035.410.8
191Gan Xuan 4CHN020001.41.815.8
192Kanto 5JPN6.96.80001.26.213.2
193Xi Zhuang 1CHN7.254.2003.54.611.1
194Yellow St.JohnUSA5.157.5006.82.18.0
195Yu Hua 2CHN77.603.202.46.811.0
196ShastaUSA8.26.27.3006.21.85.3
197McNeelyUSA6.85.26.9003.51.65.8
198HarbriteCAN54.86.8005.82.16.6
199Da Jie TaoCHN8.96.400.901.45.813.9
200Hei You TaoCHN05.86.14.305.43.26.9
201DixonUSA4.86.81.23.3034.810.5
202VeteranCAN6.36.90001.16.85.8
203Nan Shan Tian TaoCHN1.86.81.2001.64.815.0
204Huang Rou Pan TaoCHN4.37.202.201.15.816.5
205Xi Shan Pan TaoCHN3.56.701.200.86.518.8
206Qiu KuiCHN04.26.2104.53.26.4
207Compact RomanUSA2.23.85.4003.82.811.9
208Xia Hui 8CHN06.40001.28.836.4
209Jin Xiu CHN2.57.40002.49.213.3
210Shen Zhou Hong MiCHN3.14.86.40033.88.6
211A Chu TaoJPN08.60001.88.88.2
212MikaJPN07.301.401.26.811.8
Note: CHN, China; USA, the United States of America; JPN, Japan; CAN, Canada; FRA, France; ESP, Spain; ITA, Italy; BGR, Bulgaria; IND, India; AUS, Australia; HUN, Hungary.

References

  1. Li, Y.; Wang, L. Genetic resources, breeding programs in China, and gene mining of peach: A review. Hortic. Plant J. 2020, 6, 205–215. [Google Scholar] [CrossRef]
  2. Zhu, G.Y.; Xiao, Z.B.; Zhou, R.J.; Zhu, Y.L.; Niu, Y.W. Study on development of a fresh peach flavor. Adv. Mater. Res. 2013, 781–784, 1570–1573. [Google Scholar] [CrossRef]
  3. Xue, H.; Sekozawa, Y.; Sugaya, S. Investigating the aromatic compound changes in table grape varieties during growth and development, using HS-SPME-GC/MS. Horticulturae 2023, 9, 85. [Google Scholar] [CrossRef]
  4. Ricardo-Rodrigues, S.; Laranjo, M.; Agulheiro-Santos, A.C. Methods for quality evaluation of sweet cherry. J. Sci. Food Agric. 2022, 103, 463–478. [Google Scholar] [CrossRef]
  5. Liu, R.; Liu, Y.; Zhu, Y.; Kortesniemi, M.; Zhu, B.; Li, H. Aromatic Characteristics of Passion Fruit Wines Measured by E-Nose, GC-Quadrupole MS, GC-Orbitrap-MS and Sensory Evaluation. Foods 2022, 11, 3789. [Google Scholar] [CrossRef] [PubMed]
  6. Gunness, P.; Kravchuk, O.; Nottingham, S.M.; D’Arcy, B.R.; Gidley, M.J. Sensory analysis of individual strawberry fruit and comparison with instrumental analysis. Postharvest Biol. Technol. 2009, 52, 164–172. [Google Scholar] [CrossRef]
  7. Xu, B.G.; Feng, M.; Chitrakar, B.; Cheng, J.N.; Wei, B.X.; Wang, B.; Zhou, C.S.; Ma, H.L. Multi-frequency power thermosonication treatments of clear strawberry juice: Impact on color, bioactive compounds, flavor volatiles, microbial and polyphenol oxidase inactivation. Innov. Food Sci. Emerg. Technol. 2023, 84, 103295. [Google Scholar] [CrossRef]
  8. Liu, L.; Liu, M.; Liu, C.H.; Qiu, K.; Zhong, Q.D.; Lu, J.H.; Lv, X.L. Comparison of the hundred-mark system method and fuzzy mathematics in sensory evaluation of canned peaches. Sci. Technol. Food Ind. 2015, 36, 113–116. (In Chinese) [Google Scholar]
  9. Hotel, O.; Poli, J.-P.; Mer-Calfati, C.; Scorsone, E.; Saada, S. A review of algorithms for SAW sensors e-nose based volatile compound identification. Sens. Actuators B Chem. 2018, 255, 2472–2482. [Google Scholar] [CrossRef]
  10. Wang, X.L.; Xiao, H.G.; Wang, J.Y.; Yang, Y.Q.; Liu, H.Y. The research of feature extraction methods in the tomatoes detection. In Proceedings of the 2012 Second International Conference on Instrumentation, Measurement, Computer, Communication and Control, Harbin, China, 8–10 December 2012; pp. 702–705. [Google Scholar] [CrossRef]
  11. Zhang, J.; Pan, L.; Tu, K. Aroma in freshly squeezed strawberry juice during cold storage detected by E-nose, HS–SPME–GC–MS and GC-IMS. J. Food Meas. Charact. 2023, 44, 286–296. [Google Scholar] [CrossRef]
  12. Wei, G.; Dan, M.; Zhao, G.; Wang, D. Recent advances in chromatography-mass spectrometry and electronic nose technology in food flavor analysis and detection. Food Chem. 2023, 405 Pt A, 134814. [Google Scholar] [CrossRef]
  13. Sun, M.; Zhao, B.; Cai, Z.; Yan, J.; Ma, R.; Yu, M. Amino Acid Profiles in Peach (Prunus persica L.) Fruit. Foods 2022, 11, 1718. [Google Scholar] [CrossRef]
  14. Zhao, B.; Sun, M.; Li, J.; Su, Z.; Cai, Z.; Shen, Z.; Ma, R.; Yan, J.; Yu, M. Carotenoid Profiling of Yellow-Flesh Peach Fruit. Foods 2022, 11, 1669. [Google Scholar] [CrossRef] [PubMed]
  15. ISO 5495:2005; Sensory Analysis—Methodology—Paired Comparison Test. International Organization for Standardization: Geneva, Switzerland, 2005.
  16. Colaric, M.; Veberic, R.; Stampar, F.; Hudina, M. Evaluation of peach and nectarine fruit quality and correlations between sensory and chemical attributes. J. Sci. Food Agric. 2005, 85, 2611–2616. [Google Scholar] [CrossRef]
  17. Yan, J.; Zhang, M.H.; Peng, B.; Su, Z.W.; Xu, Z.Y.; Cai, Z.X.; Yang, J.; Ma, R.J.; Yu, M.L.; Shen, Z.J. Predicting chilling requirement of peach floral buds using electronic nose. Sci. Hortic. 2021, 290, 110517. [Google Scholar] [CrossRef]
  18. Wilson, A.D. Diverse Applications of Electronic-Nose Technologies in Agriculture and Forestry. Sensors 2013, 13, 2295–2348. [Google Scholar] [CrossRef] [PubMed]
  19. Shen, Z.J.; Ma, R.J.; Yu, M.L.; Cai, Z.X.; Song, H.F.; Li, X. Regularity Analysis of Main Sugar and Acid in Fruit Development of Peach. Agric. Boreali-Sin. 2007, 22, 130–135. (In Chinese) [Google Scholar]
  20. Pereda, M.S.B.; Nazareno, M.A.; Viturro, C.I. Volatile compound profile and sensory features of cape gooseberry (Physalis peruviana Linnaeus): Comparative study between cultivated and wild fruits. Eur. Food Res. Technol. 2022, 249, 1007–1021. [Google Scholar] [CrossRef]
  21. Zhu, J.C.; Xiao, Z.B. Characterization of the key aroma compounds in peach by gas chromatography–olfactometry, quantitative measurements and sensory analysis. Eur. Food Res. Technol. 2019, 245, 129–141. [Google Scholar] [CrossRef]
  22. Rocha, I.F.d.O.; Bolini, H.M.A. Passion fruit juice with different sweeteners: Sensory profile by descriptive analysis and acceptance. Food Sci. Nutr. 2015, 3, 129–139. [Google Scholar] [CrossRef]
  23. Qiao, J.L.; Su, G.Q.; Liu, C.; Zou, Y.J.; Chang, Z.Y.; Yu, H.L.; Wang, L.J.; Guo, R.X. Study on the application of electronic nose technology in the detection for the artificial ripening of crab apples. Horticulturae 2022, 8, 386. [Google Scholar] [CrossRef]
  24. Wang, Y.J.; Wang, D.; Lv, Z.Z.; Zeng, Q.X.; Fu, X.L.; Chen, Q.Y.; Luo, Z.W.; Luo, C.; Wang, D.C.; Zhang, W. Analysis of the volatile profiles of kiwifruits experiencing soft rot using E-nose and HS-SPME/GC–MS. LWT 2023, 173, 114405. [Google Scholar] [CrossRef]
  25. Wei, H.; Gu, Y. A Machine Learning Method for the Detection of Brown Core in the Chinese Pear Variety Huangguan Using a MOS-Based E-Nose. Sensors 2020, 20, 4499. [Google Scholar] [CrossRef] [PubMed]
  26. Gurjar, P.; Killadi, B.; Pareek, P.K.; Hada, T. Application of melatonin in maintaining post harvest quality of fruits and vegetables: A review. Agric. Rev. 2022, 43, 193–198. [Google Scholar] [CrossRef]
  27. Manuela, B.; Wilson, A.D. Electronic-nose applications for fruit identification, ripeness and quality grading. Sensors 2015, 15, 899–931. [Google Scholar] [CrossRef]
  28. Wang, Q.; Chen, X.; Zhang, C.; Li, X.; Yue, N.; Shao, H.; Wang, J.; Jin, F. Discrimination and Characterization of Volatile Flavor Compounds in Fresh Oriental Melon after Forchlorfenuron Application Using Electronic Nose (E-Nose) and Headspace-Gas Chromatography-Ion Mobility Spectrometry (HS-GC-IMS). Foods 2023, 12, 1272. [Google Scholar] [CrossRef]
  29. Mahawanich, T.; Schmidt, S. Molecular mobility and the perceived sweetness of sucrose, fructose, and glucose solutions. Food Chem. 2004, 84, 169–179. [Google Scholar] [CrossRef]
Figure 1. (A). Palate scores of 212 peach germplasm resources: blue area corresponds to sweetness scores; orange area corresponds to sourness; grey area corresponds to astringency; and yellow area corresponds to bitterness. (B). Persistence and overall impression scores of 212 peach germplasm resources: blue area corresponds to persistence, and orange area corresponds to overall impression.
Foods 12 04444 g001
Figure 2. (A). Principal component analysis (PCA) of sensory evaluations for 212 peach germplasm resources: red dots, 212 peach germplasms; blue arrow lines, loadings. (B). Hierarchical cluster analysis of sensory analysis for 212 peach germplasm resources: red, Class I germplasms; green, Class II germplasms; blue, Class III germplasms.
Foods 12 04444 g002
Figure 3. Hierarchical cluster analysis of E-nose performance for 212 peach germplasm resources: red, Class I germplasms; blue, Class II germplasms; green, Class III germplasms.
Foods 12 04444 g003
Figure 4. Aroma loading analysis conducted using E-nose in relation to 212 peach germplasm resources ((A): ten sensors; (B): three sensors).
Foods 12 04444 g004
Figure 5. No.193 response values to different sensors of an electronic nose.
Foods 12 04444 g005
Figure 6. Main and aromatic sensors’ response values for Class I germplasms: (A), W5S sensitive to hydrocarbons, aromatic compounds; (B), W1S sensitive to short-chain alkanes such as methane; (C), W1W sensitive to terpenes and organosulfur compounds; (D), W2W sensitive to aromatic, sulfur and chlorine compounds; (E), W3S sensitive to long-chain alkanes; (F), W1C sensitive to aromatic benzene.
Foods 12 04444 g006aFoods 12 04444 g006b
Figure 7. Main and aromatic sensors’ response values for Class II germplasms: (A), W5S sensitive to hydrocarbons, aromatic compounds; (B), W1S sensitive to short-chain alkanes such as methane; (C), W1W sensitive to terpenes and organosulfur compounds; (D), W2W sensitive to aromatic, sulfur and chlorine compounds; (E), W3S sensitive to long-chain alkanes; (F), W1C sensitive to aromatic benzene.
Foods 12 04444 g007
Figure 8. (A). Sucrose, glucose, fructose, and sorbitol content in 212 peach germplasms: blue area corresponds to sucrose scores; orange area corresponds to glucose; grey area corresponds to fructose; and yellow area corresponds to sorbitol. (B). Quinic, malic and citric acids content in 212 peach germplasms: blue area corresponds to quinic acid; orange area corresponds to malic acid; and grey area corresponds to citric acid.
Foods 12 04444 g008
Figure 9. PCA of sugars and acids in 212 peach germplasm resources: red dot, 212 peach germplasms; blue arrow lines, loadings.
Foods 12 04444 g009
Figure 10. Correlation matrix heat map. Heat map of spearman correlation between sensory and HPLC analysis between each biomarker for the overall population analysed. * Indicated significant differences between instrumental and sensory parameters according to Pearson correlation coefficient (p < 0.05).
Foods 12 04444 g010
Table 1. Electronic nose sensor array (PEN 3.5) using the portable E-nose (Air-sense Analytics GmbH, Germany).
Sensor NameSensor Sensitives
W1CSensitive to aromatic benzene
W3CSensitive to ammonia and aromatic compounds
W5CSensitive to nitrogen oxides
W1SSensitive to short-chain alkanes such as methane
W2SSensitive to alcohols, ethers, aldehydes, and ketones
W3SSensitive to long-chain alkanes
W5SSensitive to hydrocarbons and aromatic compounds
W6SSensitive to hydrogen
W1WSensitive to terpenes and organosulfur compounds
W2WSensitive to aromatic compounds and sulphur and chlorine compounds
Table 2. Special flavours in 212 peach germplasm resources.
Aroma TypeFlavourPeach Germplasm Number
FruityCitrus59, 181
Apple29, 54, 62, 91, 117, 163, 200
Green Apple18, 31, 208
Honeydew56, 161
Mango84, 99, 172, 182, 184, 196
Apricot207
Juicy Honey Peach188, 195, 205
Yellow-Flesh Peach147, 159, 167, 179, 197
Passionfruit8, 14, 19, 23, 100
Lemon15, 20, 87, 147
FloralGardenia15, 30, 44, 45, 66, 185
Jasmine64, 178
Rose28, 63, 70, 99, 109, 144, 148, 183, 186
Violet22, 24, 41, 65, 68, 69, 71, 80, 83, 97, 106, 107, 108, 110, 112, 118, 120, 121, 122, 125, 127, 129, 130, 131, 132, 133, 134, 135, 137, 139, 141, 146, 171, 177, 189, 196, 197, 199, 202, 204, 210
Herbaceous or VegetativeHerb173
Grass34, 53, 92, 174, 176, 203, 206
Celery137
Lotus Seed168
Carrot118
AnimalButter/Milk9, 21, 55, 56, 59, 60, 61, 68, 76, 80, 86, 89, 91, 101, 112, 115, 128, 133, 134, 141, 144, 146, 152, 162, 165, 172, 176, 179, 181, 188, 196
CaramelCandy153, 189
Popcorn3, 57, 82, 94, 149
Molasses82, 201
Honey58, 165
NuttyPeanut32, 74, 78, 114, 143, 154
Cereal37, 145
Red Bean13
WoodySmoky15, 139, 152
Rubber111
PungentMetal50, 71, 190, 195
FaultsSpoiled38, 50, 76
Off-Odour11, 123, 160, 199
Disclaimer/Publisher’s Note: The statements, opinions and data contained in all publications are solely those of the individual author(s) and contributor(s) and not of MDPI and/or the editor(s). MDPI and/or the editor(s) disclaim responsibility for any injury to people or property resulting from any ideas, methods, instructions or products referred to in the content.

