Article

Dietary Marine Hydrolysate Improves Memory Performance and Social Behavior through Gut Microbiota Remodeling during Aging

1
Université Bordeaux, INRAE, Bordeaux INP, Nutrineuro, UMR 1286, 33076 Bordeaux, France
2
Abyss Ingredients, 56850 Caudan, France
3
NutriBrain Research and Technology Transfer, NutriNeuro, 33076 Bordeaux, France
*
Author to whom correspondence should be addressed.
Foods 2023, 12(23), 4199; https://doi.org/10.3390/foods12234199
Submission received: 22 September 2023 / Revised: 27 October 2023 / Accepted: 7 November 2023 / Published: 21 November 2023
(This article belongs to the Special Issue Recent Advances in Marine Functional Foods)

Abstract

:
Aging is characterized by a decline in social behavior and cognitive functions leading to a decrease in life quality. In a previous study, we show that a fish hydrolysate supplementation prevents age-related decline in spatial short-term memory and long-term memory and anxiety-like behavior and improves the stress response in aged mice. The aim of this study was to determine the effects of a fish hydrolysate enriched with EPA/DHA or not on the cognitive ability and social interaction during aging and the biological mechanisms involved. We showed for the first time that a fish hydrolysate enriched with EPA/DHA or not improved memory performance and preference for social novelty that were diminished by aging. These changes were associated with the modulation of the gut microbiota, normalization of corticosterone, and modulation of the expression of genes involved in the mitochondrial respiratory chain, circadian clock, neuroprotection, and antioxidant activity. Thus, these changes may contribute to the observed improvements in social behavior and memory and reinforced the innovative character of fish hydrolysate in the prevention of age-related impairments.

Graphical Abstract

1. Introduction

Healthy aging has become one of the primary social and economic challenges of the 21st century for nations; particularly as the elderly population (e.g., 65 years and older) has tripled from 4% to 13% and it is projected to double in the next three decades, reaching 20% of the population in 2025 and 33% in 2050 [1,2]. Aging is characterized by a complex and dynamic remodeling of different neurobiological and physiological processes and behavioral changes. It is highly associated with increased susceptibility to cognitive impairments [3,4,5,6,7] and with a deficit in social cognition. Moreover, cognitive decline has an impact on social abilities [8]. And the maintenance of social interactions is known to be essential to increase quality of life and longevity [9,10]. More and more studies investigated the role of gut microbiota on cognition and social interaction across the lifespan [11,12] and particularly during aging. There is growing evidence that the gut microbiota actively participates in the aging process [13,14,15]. Age-related microbial dysbiosis is involved in reshaping immune responses during aging, which manifest as immunosenescence, inflammaging, and oxidative stress that accompany many age-associated alterations, like cognitive disorders [16,17]. Furthermore, disruptions in the microbiome–gut–brain axis could lead to the development of central nervous system pathologies [18,19,20,21] and behavioral disorders [12,22]. Notably, intestinal flora richness and diversity correlate with the extent of human social interactions, with reduced interactions causing decreased microbial diversity [23]. Moreover, targeting the microbiota during aging may be an effective strategy to prevent cognitive and social alterations.
Nutrition appears as an interesting innovative approach for preventing or delaying the development of age-related cognitive social behavior deficits by targeting microbiota [24]. Indeed, several studies reported the effects of nutrition on gut microbiota, notably peptides and omega-3 PUFAs [25,26,27,28,29,30]. We previously demonstrated that dietary supplementation with a fish hydrolysate containing low-molecular-weight peptides and n-3 LC-PUFAs effectively prevent age-related spatial short-term memory deficits and influence navigation strategies during spatial learning [31]. However, the impact of a fish hydrolysate containing low-molecular-weight peptides and n-3 LC-PUFA on social behavior through gut microbiota modulation remains unexplored. Understanding these aspects could offer valuable insights to better exploit the potential benefits of this dietary supplementation.
In this study, we investigated the potential effects of a fish hydrolysate supplementation, containing mainly low-molecular-weight peptides and n-3 LC-PUFAs, on the prevention of age-related social decline. To understand the mechanisms involved, we explored the microbiota as a platform that communicates with the brain through the gut–brain axis and that modifies the host metabolism. We then measured the stress response, expression of genes involved in the mitochondrial metabolism, circadian clock, inflammation, antioxidant defenses, beta-oxidation, and neuroprotection. We also explored whether the inclusion of n-3 LC-PUFAs to the existing fish hydrolysate could potentially have an additional effect.

2. Materials and Methods
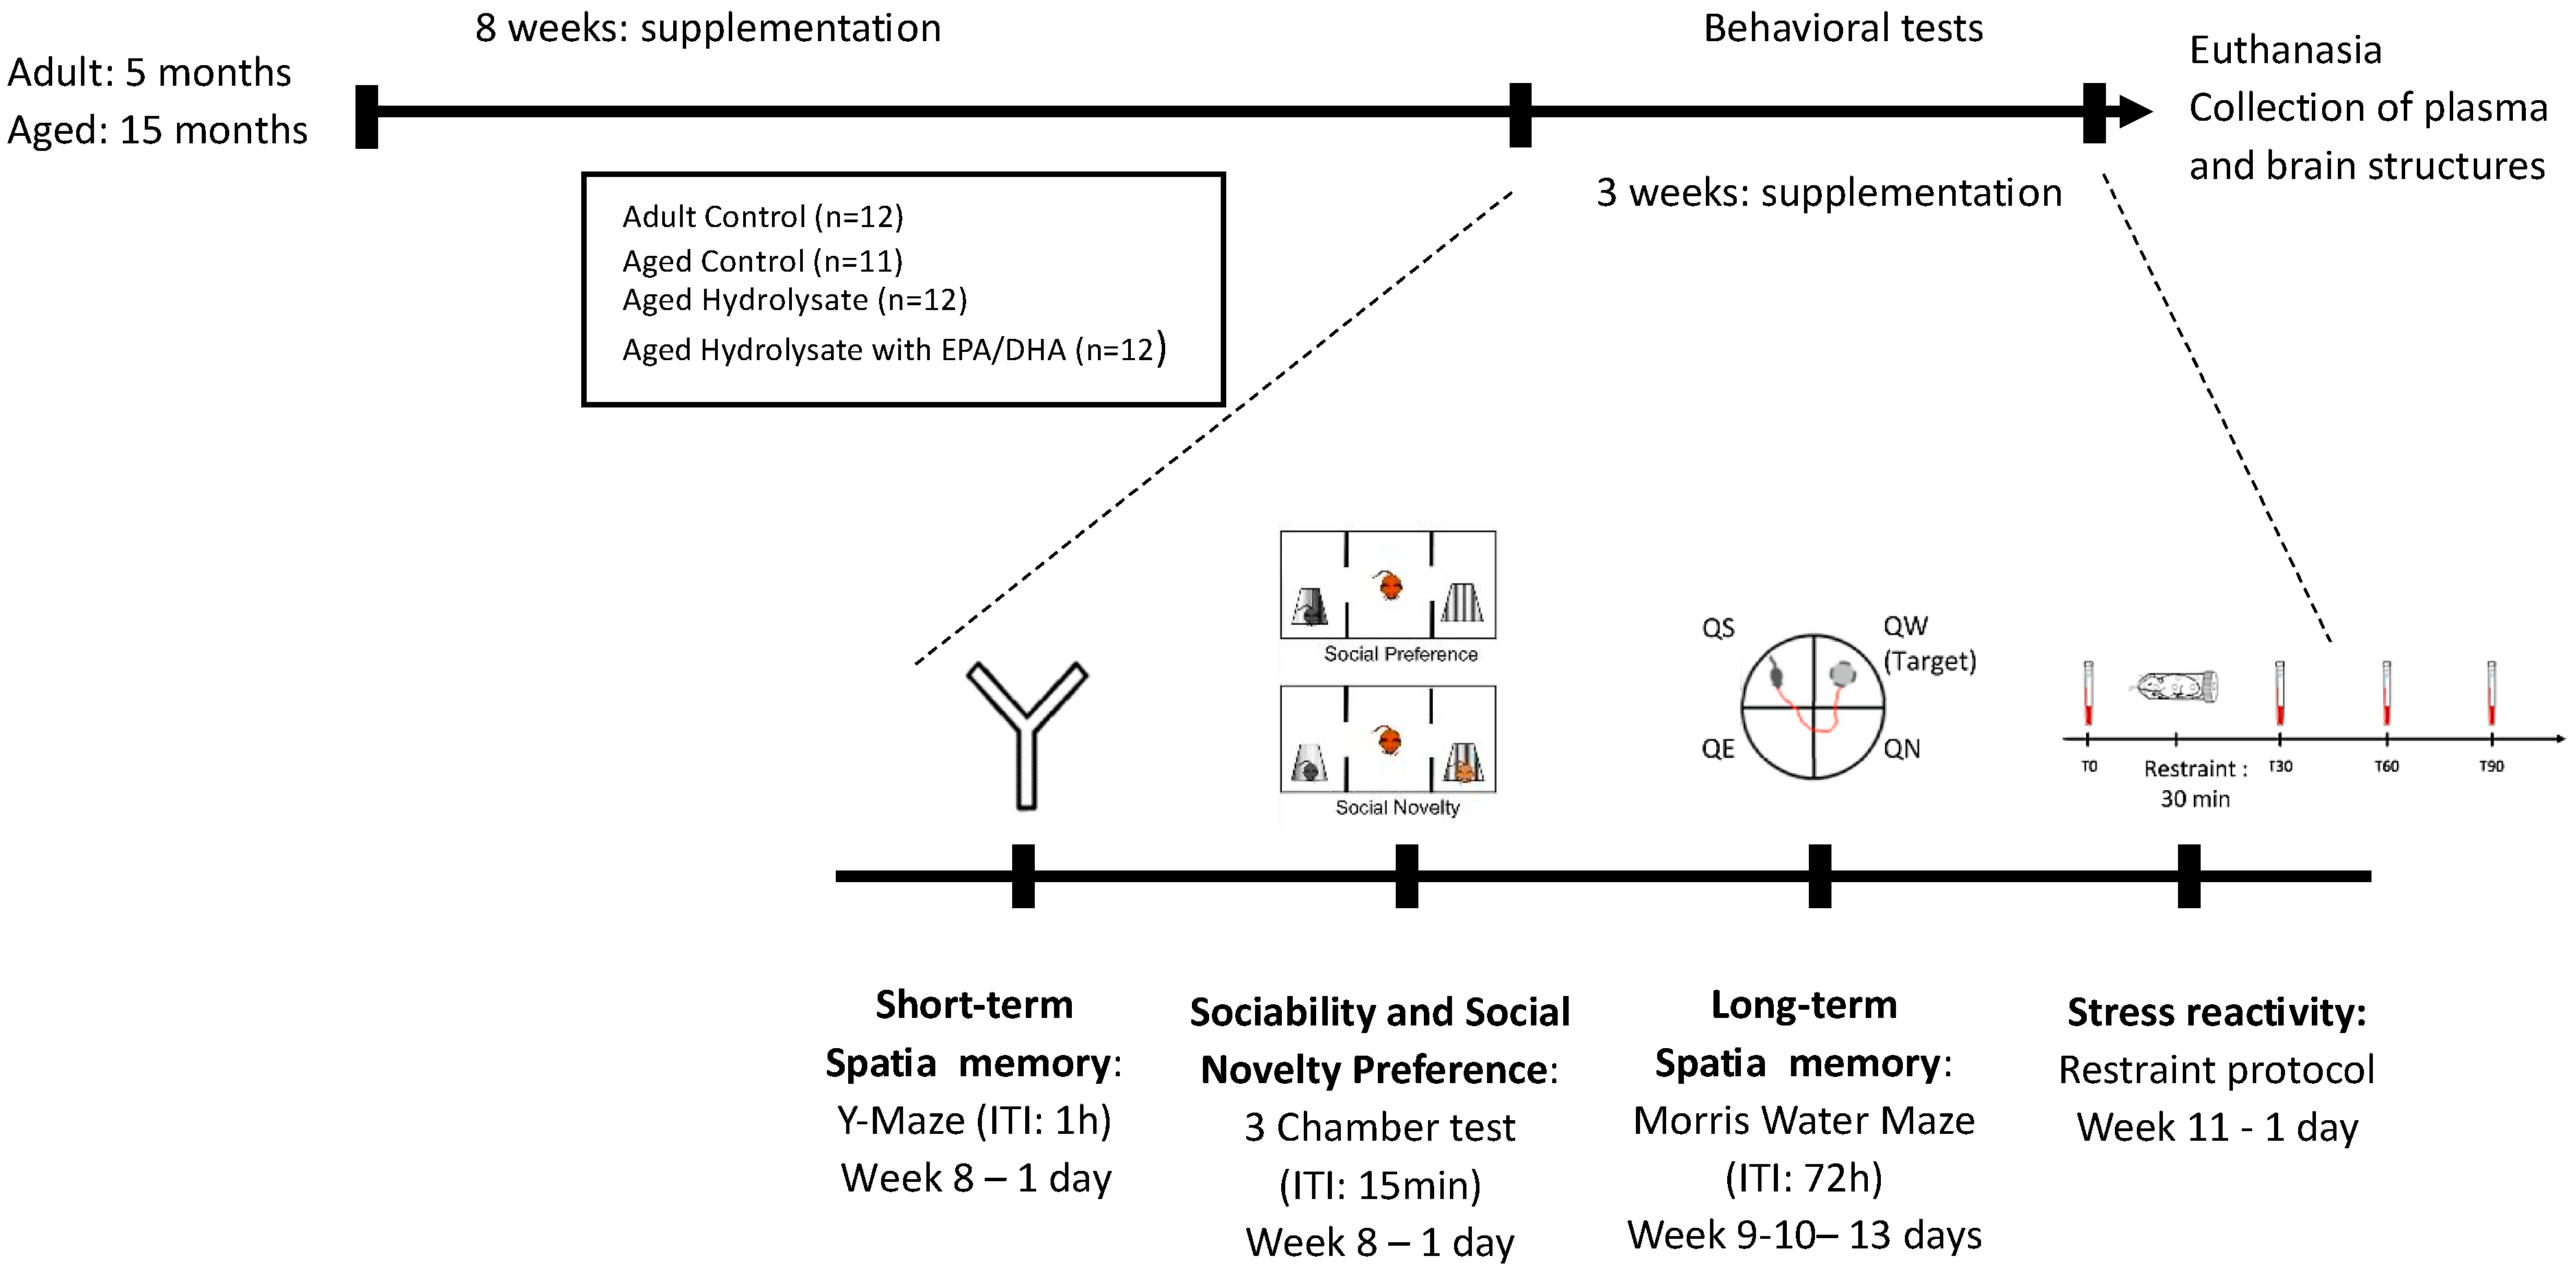
2.1. Animals

Male C57Bl/6J mice, aged 7 weeks and 15 months, were obtained from Janvier Labs, Le Genest-Saint-Isle, France. They were reared in a standard 12 h light/12 h dark cycle, housed on cellulose bedding in a controlled environment (temperature maintained at 21–23 °C, humidity at 40%), and provided with ad libitum access to both food and water. All animal care and experimental procedures were conducted in compliance with the EU Directive 2010/63/EU for animal experiments and were approved by the national ethical committee overseeing the welfare and use of animals (approval ID A27756).

2.2. Diet

After 11 weeks on a control diet, the mice were segregated into distinct groups: one group of adult mice (n = 12) and one of aged mice (n = 11) continued with the control diet. The two remaining groups of aged mice were provided with diets enriched with fish hydrolysate, comprising 0.21% of the hydrolysate for one group (n = 12) and 0.21% of the hydrolysate with an additional 0.09% of EPA/DHA for the other group (n = 12) (Table 1). Diets were provided by INRAE (Jouy en Josas, France). The diets were initiated when the adult mice were 5 months old and the aged mice were 15 months old, and these diets were maintained throughout the entire 11-week experiment (Figure 1). Consequently, by the end of the experiment, the adult and aged mice were approximately 8 and 18 months old, respectively. The fish hydrolysate, sourced from Abyss Ingredients in Caudan, France, was derived from marine byproducts and primarily consisted of low-molecular-weight peptides (<1000 Da) along with n-3 LC-PUFAs, like DHA and EPA. The detailed composition of the fish hydrolysate is outlined in patent number FR3099339(B1). The low-molecular-weight peptides dose (2.9 mg of low-molecular-weight peptides/mouse/day) corresponded to the quantity of peptides (<1000 Da) provided by 1 g of hydrolysate in humans and was determined by our previous results (not published). Polaris (Quimper, France) provided EPA (OMEGAVIE® EPA 600 TG Qualitysilver® 5) and DHA (OMEGAVIE® DHA 70 TG). The dose of EPA/DHA was 1.56 mg/mouse/day (of which 1.248 mg/mouse/day of EPA and 0.312 µg/mouse/day of DHA) and corresponded to 250 mg/day of omega-3 in humans.

2.3. Behavioral Test

2.3.1. Short-Term Spatial Recognition Memory Assessed in the Y-Maze

After eight weeks of supplementation, the Y-maze test was conducted to evaluate spatial recognition memory, following the procedure outlined by Dellu et al. [32]. The Y-shaped maze consisted of three arms, each 35 cm long and 10 cm deep, with a 15 lux illumination and extramaze visual cues on the walls to help mice orient themselves in the space. In the first trial, one arm of the Y-maze was closed, and mice were given 5 min to explore the remaining two arms. After an hour-long intertrial interval (ITI), mice were returned to the start arm for the second trial and given 5 min to explore all three arms. The start and closed arms were randomly assigned to each mouse, and their movements were tracked using video recording (SMART system; Bioseb, Vitrolles, France) to analyze the time spent in each arm. An index of recognition was computed to evaluate the animals’ performance against the expected chance level (33%).

2.3.2. Spatial Memory Assessed in the Morris Water Maze Task

Spatial learning and memory were evaluated using the Morris water maze (MWM) test conducted following the method described in previous studies [33,34]. The test involved two days of familiarization, where mice had to locate a visible platform in a pool (3 trials/day, 60 s cut-off). This was followed by a day of cued learning to evaluate visuomotor deficits, where mice had to find a visible platform with the help of a cue (6 trials/day, 90 s cut-off). Spatial learning was then assessed over four consecutive days, during which mice were trained to find a submerged platform using distal extramaze cues (6 trials/day, 90 s cut-off). The Imetronic videotracking system was used to record the latency, distance traveled, and swim path for each trial. After 72 h, spatial memory was evaluated during a 60 s probe test in the maze without a platform.
The SMART system was utilized to measure the distance covered in each of the four quadrants, designating the quadrant where the platform was originally located during spatial learning as the target quadrant. Additionally, an index of recognition was computed to evaluate the animals’ performance against the expected chance level (25%).

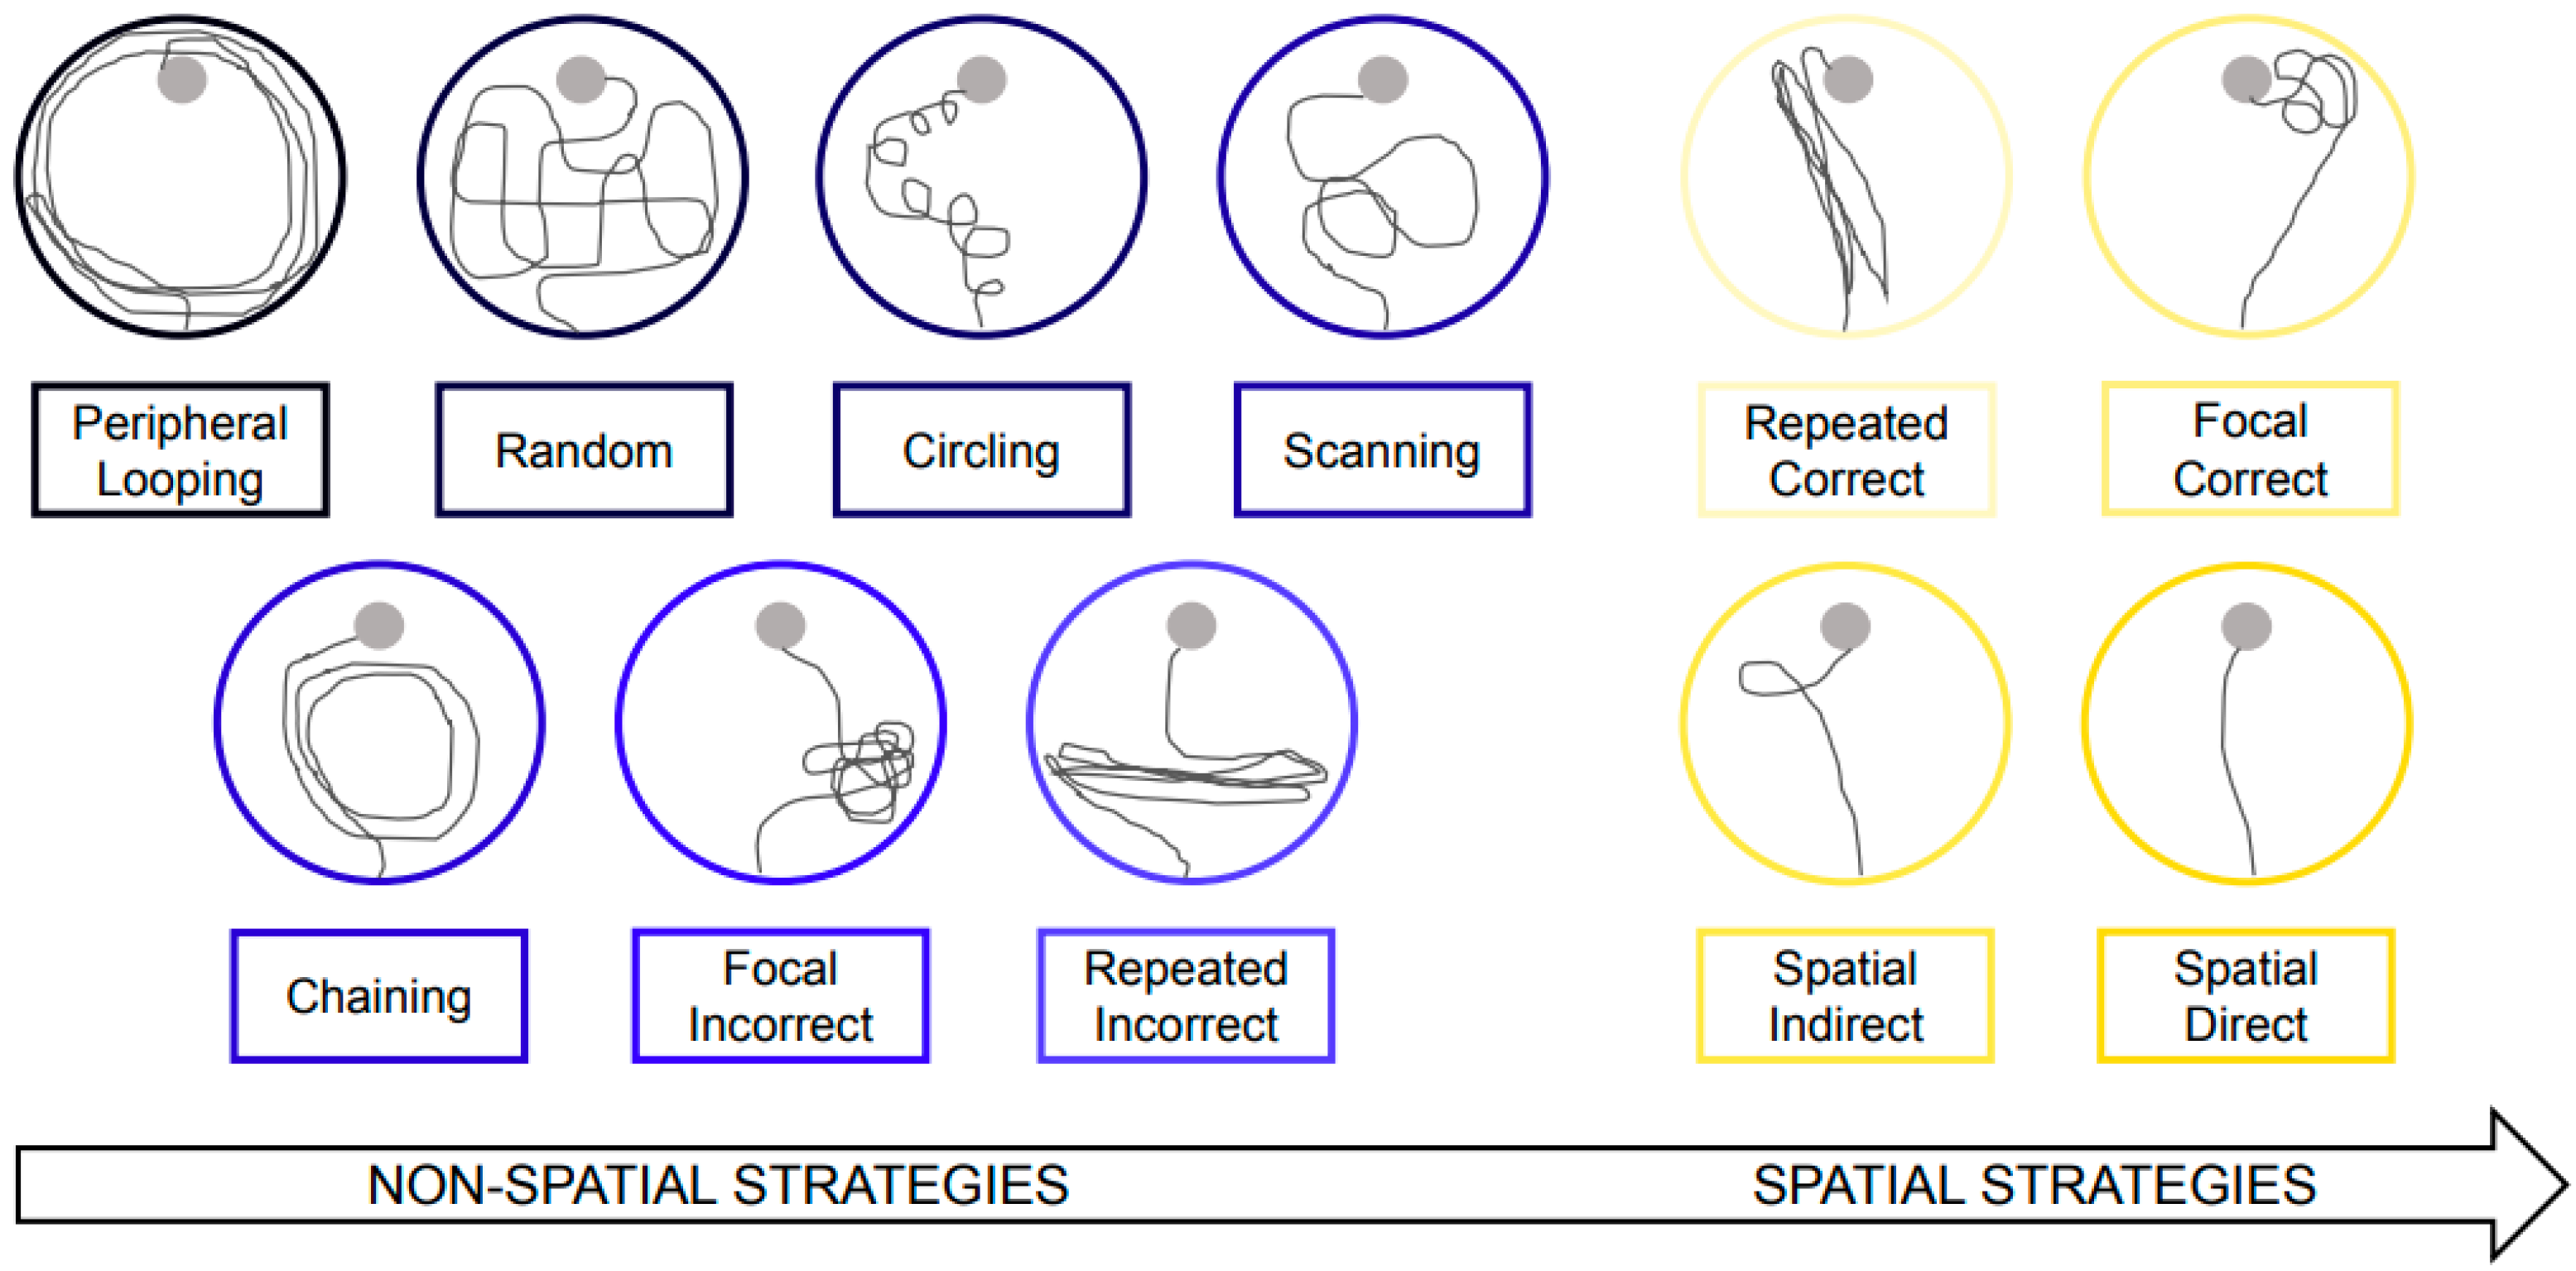
2.3.3. Examination of Navigation Strategies in the Morris Water Maze

For each trial in the spatial learning test, we evaluated the navigation path using the categorization system outlined by Bensalem et al. [32] (Figure 2). The navigation strategies were classified into two primary categories: nonspatial and spatial strategies. Nonspatial strategies encompassed initial “global search” strategies, such as “peripheral looping” and “random” along with “circling”. Additionally, there were “local search” strategies, including “scanning”, “chaining”, “repeated incorrect”, and “focal incorrect”. Spatial strategies, on the other hand, comprised “repeated correct”, “focal correct”, “spatial indirect”, and “spatial direct”.

2.3.4. Sociability and Interest in Social Novelty in the Three-Chamber Test

To evaluate sociability and interest in social novelty, a three-chamber apparatus was used. The protocol was adapted from that described in Boyer et al. [35]. A rectangular arena (60 × 37.5 × 21 cm) made of transparent plexiglass plastic was divided into three compartments of the same size (18.5 × 37 × 21 cm). Two openings connected the center chamber with the two side chambers. A cylindrical container (10 cm in diameter, 20 cm high) was located in a corner of each side chamber. During the first trial (exploration), the target mouse was placed in the middle chamber facing a wall and allowed to explore. In the next trial (sociability), a stranger mouse was introduced in one of the containers, while the other was empty. In the last trial (social novelty preference), the same stranger mouse was introduced on one side, but a novel stranger was placed in the other container. The duration of each trial was 5 min, and animals were left for 15 min in their home cages between trials. Strangers were juvenile C57Bl/6J male mice (7 weeks) that were used to staying in the container. For each mouse, the stranger mice were randomly assigned to the left or right side of the chamber.

2.3.5. Restraint Test to Explore Stress Reactivity

To evaluate their response to stress, mice were placed in a restraint device for 30 min. Blood samples were collected from the mandibular vein at 4 different time points: before the start of the restraint (T0), 30 min into the restraint (T30), 60 min into the restraint (T60), and finally via a transcardiac puncture at 90 min (T90).

2.4. Tissue Processing

Thirty minutes before the restraint test, the mice received an analgesic (buprenorphine, 300 mg/kg). After the 90 min restraint test, the mice were euthanized by an injection of exagon (300 mg/kg). The brain structures and plasma were collected and frozen at −80 °C until further analysis, following transcardiac perfusion with phosphate-buffered saline (PBS). Plasma was obtained by centrifuging the blood at 3000× g for 20 min.

2.5. Biochemical Measurements

2.5.1. Measurement of Corticosterone

Plasma corticosterone levels were measured at four time points: before the onset of the stress protocol and 30, 60, and 90 min thereafter. An ELISA DetectX® corticosterone immunoassay kit (Arbor assays, Strasbourg, France) was used for the measurements.

2.5.2. Tryptophan (TRP) and Kynurenine (KYN) Levels

The concentrations of Trp and Kyn were measured with commercial ELISA kits following the instructions of the manufacturer (Trp: BAE-2700, Kyn: BAE-2200, ImmuSmol, Bordeaux, France). Optical density was measured using a microplate reader (Victor3V, PerkinElmer, Villebon-sur-Yvette, France) at a wavelength of 450 nm. Concentrations were calculated by reference to the standard curve.

2.5.3. RNA Expression by Fluidigm Microfluidics Arrays

One microgram of total RNA was obtained from hippocampus as described in Dinel et al. [36] and was reverse-transcribed with SuperScript III reverse transcriptase (Invitrogen, Cergy-Pontoise, France). Diluted cDNA (2 µL, 5 ng/µL) was added to DNA Binding Dye Sample Loading Reagent (Fluidigm), EvaAreen (Interchim, Montluçon, France) and TE low EDTA to constitute Sample Mix plate. In Assay Mix plate, 10 µL of primer pairs (100 µM) was added to the Assay Loading Reagent (Fluidigm) and TE low EDTA to a final concentration of 5 µM. Following priming the chip in the Integrated Fluidic Circuit Controller, Sample Mix (5 µL) and Assay Mix (5 µL) were loaded into the sample inlet wells. One well was filled with water as a contamination control. To verify and specify target amplification and q-PCR process efficiencies, a sample control (mouse gDNA, Thermo Fisher, Waltham, MA, USA) was treated, preamplified, and quantified on assay control (RNaseP TaqMan probe, Thermo Fisher) using the same process in the same plate at the same time. The expected value of cycle quantification was around 13. The chip was placed into the IFC Controller, where 6.3 nL of Sample Mix and 0.7 nL of Assay Mix were mixed. Real-time PCR was performed on the Biomark System (Fluidigm) by BioControl to Grape platform (Bordeaux, France) with the following protocol: Thermal Mix at 50 °C, 2 min; 70 °C, 30 min; 25 °C, 10 min; Uracil-DNA N-glycosylase (DNA) at 50 °C, 2 min; Hot Start at 95 °C, 10 min; PCR cycle of 35 cycles at 95 °C, 15 s; 60 °C, 60 s; and melting curves (from 60 °C to 95 °C). Results were analyzed using the Fluidigm Real-time PCR Analysis software v.4.1.3. (San Francisco, CA, USA) to control specific amplification for each primer. Then, the raw data of the qPCR were analyzed using GenEx software version 7 (MultiD analyses AB, Freising, Germany) in order to choose the best reference gene to normalize mRNA expression and to measure the relative expression of each of the 93 genes analyzed between groups. The best reference gene was found to be β-2 microglobulin (B2m) that was thus used for normalization of gene expression.

2.5.4. Analysis of the Microbiome in 16S

For DNA extraction we used Qiagen’s DNeasy 96 PowerSoil Pro Kit (Qiagen, Germany). Template DNA quantity in samples was determined by creating 1:8 and 1:64 dilutions of each sample and subjecting them all to qPCR using primers V5F_Nextera and V6R_Nextera targeting the V5V6 locus in the rRNA gene. Samples were diluted with water if necessary to normalize starting template abundances, and then amplicons were generated by subjecting sample DNA to 25-cycle PCRs using the same primers. PCR products were diluted 1:100 in water and subjected to a second 10-cycle PCR to attach Illumina sequencing primer-compatible DNA regions as well as individual barcodes for each sample. Samples were all uniquely dual-indexed, as detailed in Gohl, et al. [37]. Sequencing libraries were loaded onto an Illumina MiSeq using a 2 × 300 v3 flow cell (Illumina, San Diego, CA, USA). Sequenced data was analyzed using qiime2 [38]; taxonomy was assigned using the Silva release 132 database using 99% identities to the V5V6 16S region.

2.6. Statistical Analysis

Statistical analyses were conducted with GraphPad Prism 7 (GraphPadSotfware, San Diego, CA, USA). Heatmap was performed using the web interface of MetaboAnalyst (MetaboAnalyst 5.0, https://www.metaboanalyst.ca/MetaboAnalyst/home.xhtml (accessed on 15 February 2023), Canada).
A one-sample t-test was used to compare the four experimental groups against the expected chance level of 33% in the Y-maze and against the chance level of 25% in Probe test of MWM.
A 1-way ANOVA with diet as the factor was assessed to analyze the cued learning in the MWM, the time spent around the empty cage, the cage with stranger 1, the cage with stranger 2 in the 3-chamber test, and the gene expression. Fisher’s LSD post hoc tests were applied when appropriate.
A 2-way ANOVA with repeated measures was used to analyze the swim speed and spatial learning across training days in the MWM (factors: diet and days of learning) and the corticosterone levels (factors: diet and time of stress). Subsequently, Fisher’s LSD post hoc tests were conducted.
All data related to the gut microbiota were subjected to a 1-way ANOVA with diet as the factor. Post hoc Fisher’s LSD tests were performed when appropriate. Sequenced data were processed using the QIIME pipeline (v1.9.0) against the Greengenes (v13.8) database. Bioinformatic analyses and assessment of gut bacterial diversity (both beta and alpha diversity) were conducted using the web interface of MicrobiomeAnalyst (MicrobiomeAnalyst 2.0, https://www.microbiomeanalyst.ca/ (accessed on 10 June 2023), Canada).
All data were presented as means ± SEM. Differences were considered significant when the p-value was less than 0.05.

3. Results

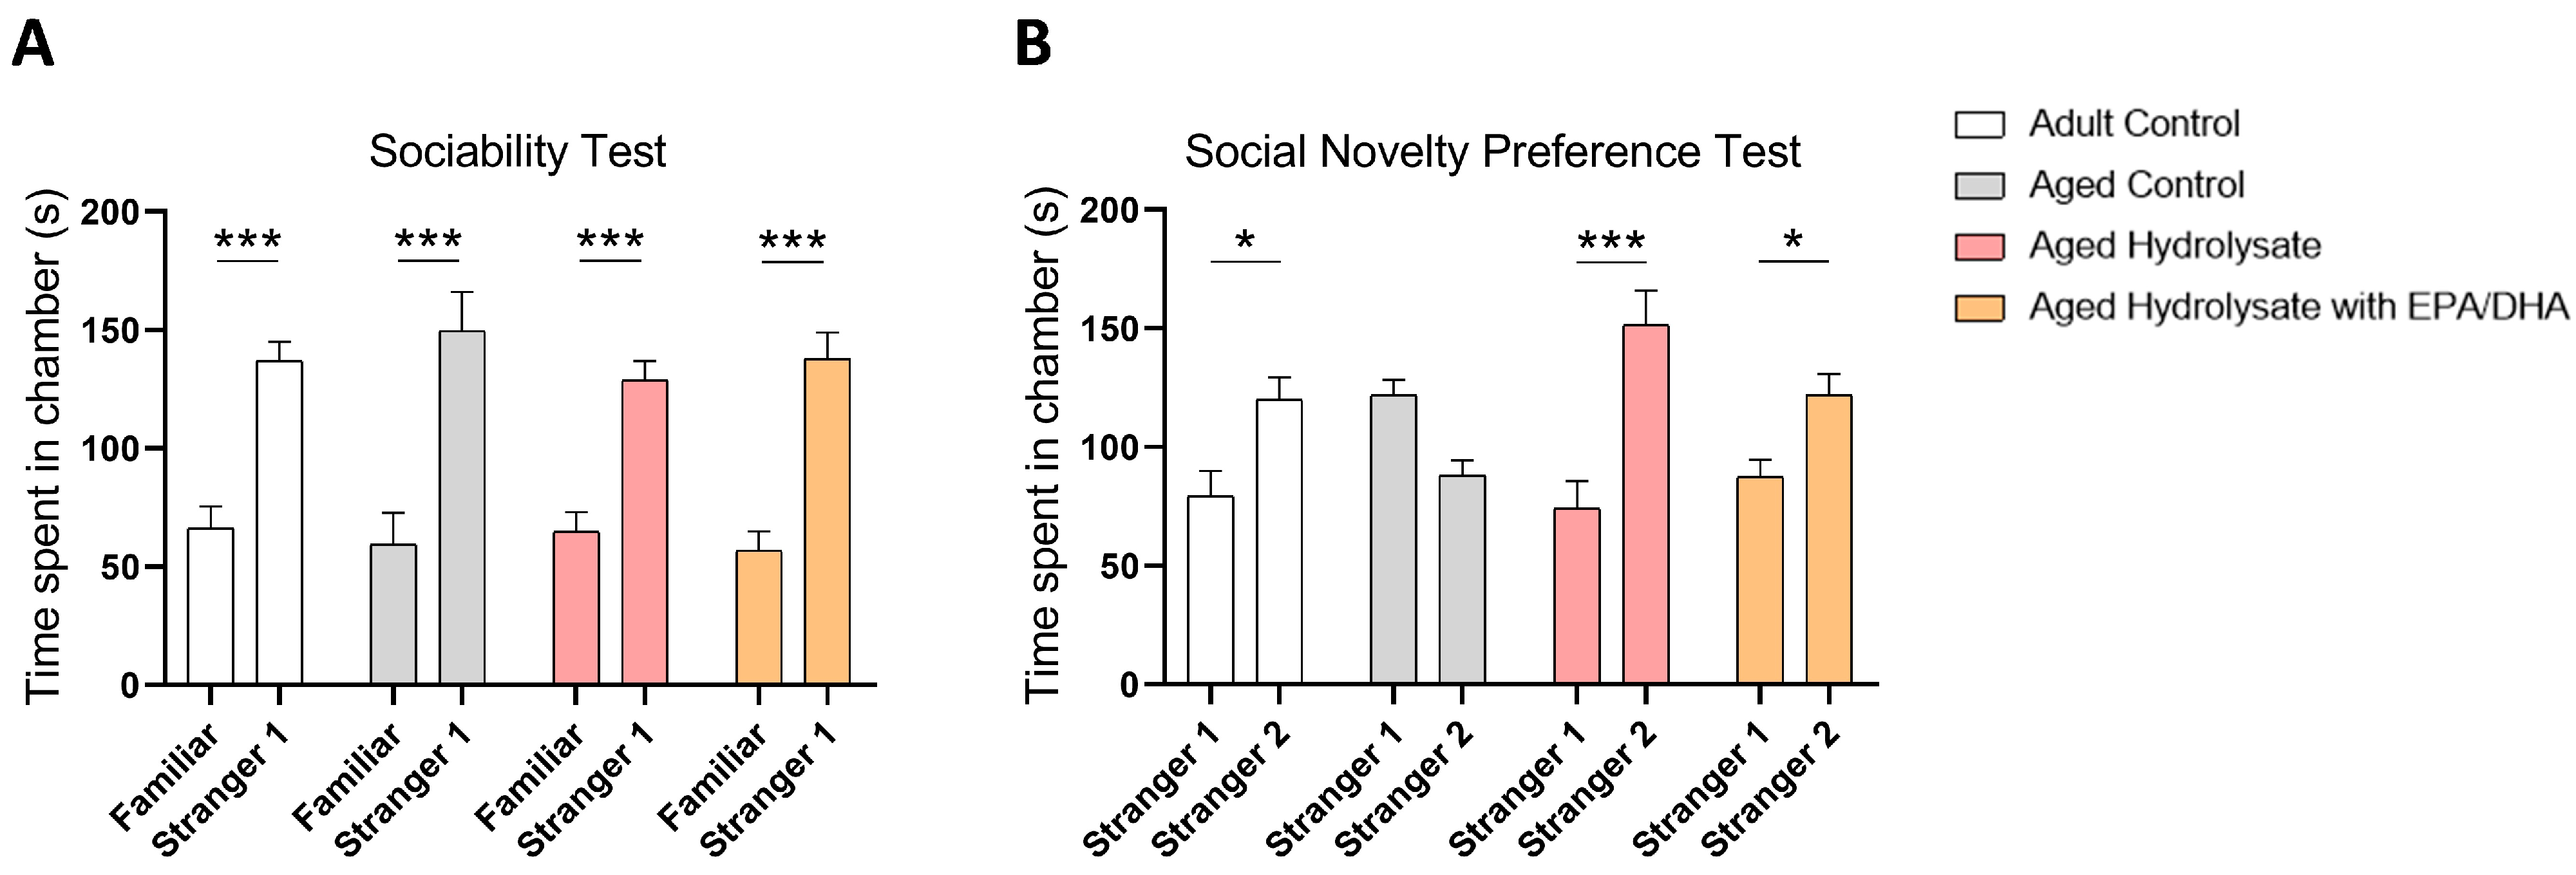
3.1. Both Fish Hydrolysate Supplementations Promote Social Novelty Preference in Aged Mice

We first evaluated social behavior in the three-chamber test. Each group of mice spent significantly more time exploring social target (stranger 1) than the empty cage (adult control, p < 0.001; aged control, p < 0.001; aged hydrolysate, p < 0.001; aged hydrolysate with EPA/DHA, p < 0.001) (Figure 3A) indicating that aging did not affect social interaction.
In the social novelty preference test, the adult control group spent significantly more time exploring the novel social target (stranger 2) compared to the stranger 1 (p = 0.02) (Figure 3B), which was not the case for the aged control group (p > 0.05). These observations reflected an impaired social recognition in aged mice. This was prevented in both supplemented groups (aged hydrolysate, p < 0.001; aged hydrolysate with EPA/DHA p = 0.05).

3.2. Both Fish Hydrolysate Supplementations Prevent Short-Term and Long-Term Spatial Memory Deficits in Aged Mice

The effect of the supplementations on short-term spatial memory was assessed using a Y-maze test with a 1 h ITI.
The index of recognition of the adult control group was significantly higher than the chance level (33%), indicating an absence of spatial memory alterations (p = 0.03) (Figure 4A).
The aged control group presented a lack of recognition for the new arm, while the aged groups fed with supplementations spent significantly more time in this arm (aged hydrolysate, p = 0.004; aged hydrolysate with EPA/DHA, p = 0.03). Hence, the deficit observed in the aged control group was prevented by hydrolysate and hydrolysate with EPA/DHA supplementations.
Next, we evaluated the impact of the supplements on spatial learning and long-term memory using the Morris water maze. Due to a slower swimming speed in the aged control group compared to the adult control group (age effect, p < 0.001), we opted to measure the distance traveled to reach the platform as a more appropriate indicator of spatial learning acquisition (Figure 4B). All groups covered comparable distances to reach the platform, indicating comparable visual abilities (Figure 4C). Furthermore, all groups showed a significant reduction in distance covered over the four days of training (day effect, p = 0.02), indicating successful learning of the platform location (Figure 4D). Spatial memory was assessed 72 h after the final day of spatial learning. In comparison to the chance level of 25%, the adult control group covered more distance in the target quadrant than in the others (p = 0.002), whereas the aged control group did not show a significant difference (p > 0.05) (Figure 4E). These findings suggest a memory impairment in the aged control group, as the mice failed to recognize the target quadrant. Both supplementations effectively prevented this issue (aged hydrolysate, p = 0.03; aged hydrolysate with EPA/DHA, p = 0.02).

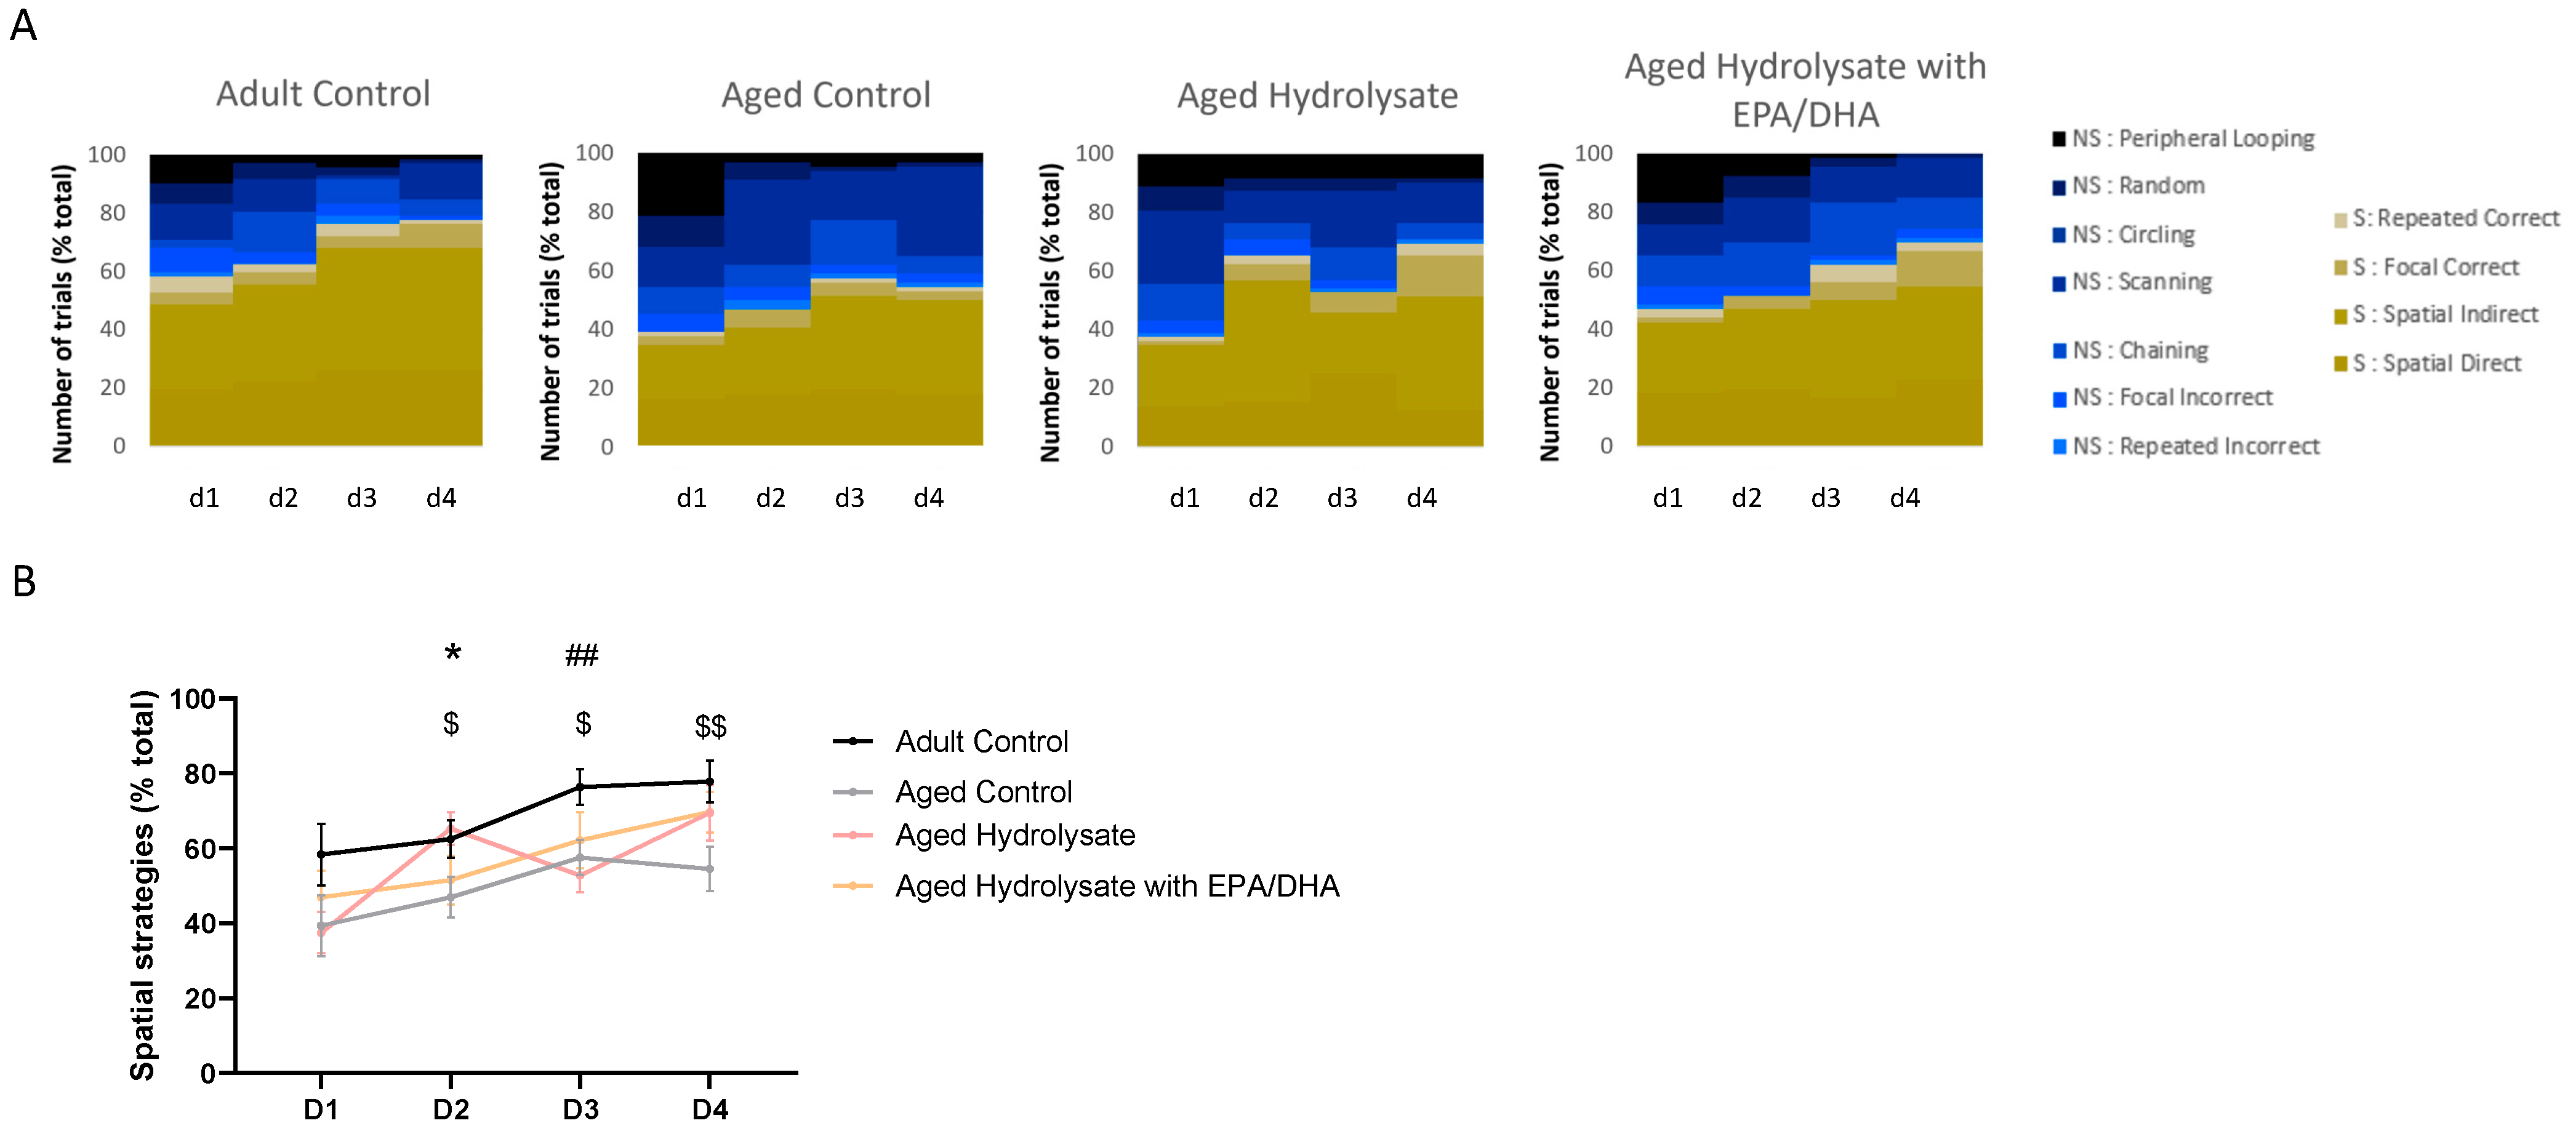
3.3. Fish Hydrolysate Supplementation Facilitates the Early Adoption of Spatial Strategies in the Process of Spatial Learning

The examination of navigation patterns indicated a transition in strategies from nonspatial to spatial across the learning days for all mice in the four groups (Figure 5A). The application of spatial strategies showed a consistent increase after each day of training (time effect, p < 0.001) (Figure 5B). On the initial day of learning, all groups employed spatial strategies to a similar extent (p > 0.05). On the second day of training, the aged control group utilized fewer spatial strategies compared to the adult control group, indicating a deficiency in spatial learning (p = 0.04). This pattern persisted on day 3 and day 4 (day 3, p = 0.01; day 4, p = 0.009). On day 2, the aged hydrolysate group exhibited a restoration of spatial strategy usage to levels similar to the adult control group (p = 0.02), suggesting that the hydrolysate supplementation facilitates the use of spatial strategies. However, from day 3 to day 4 of training, the supplemented and the aged control groups were not significantly different (p > 0.05).

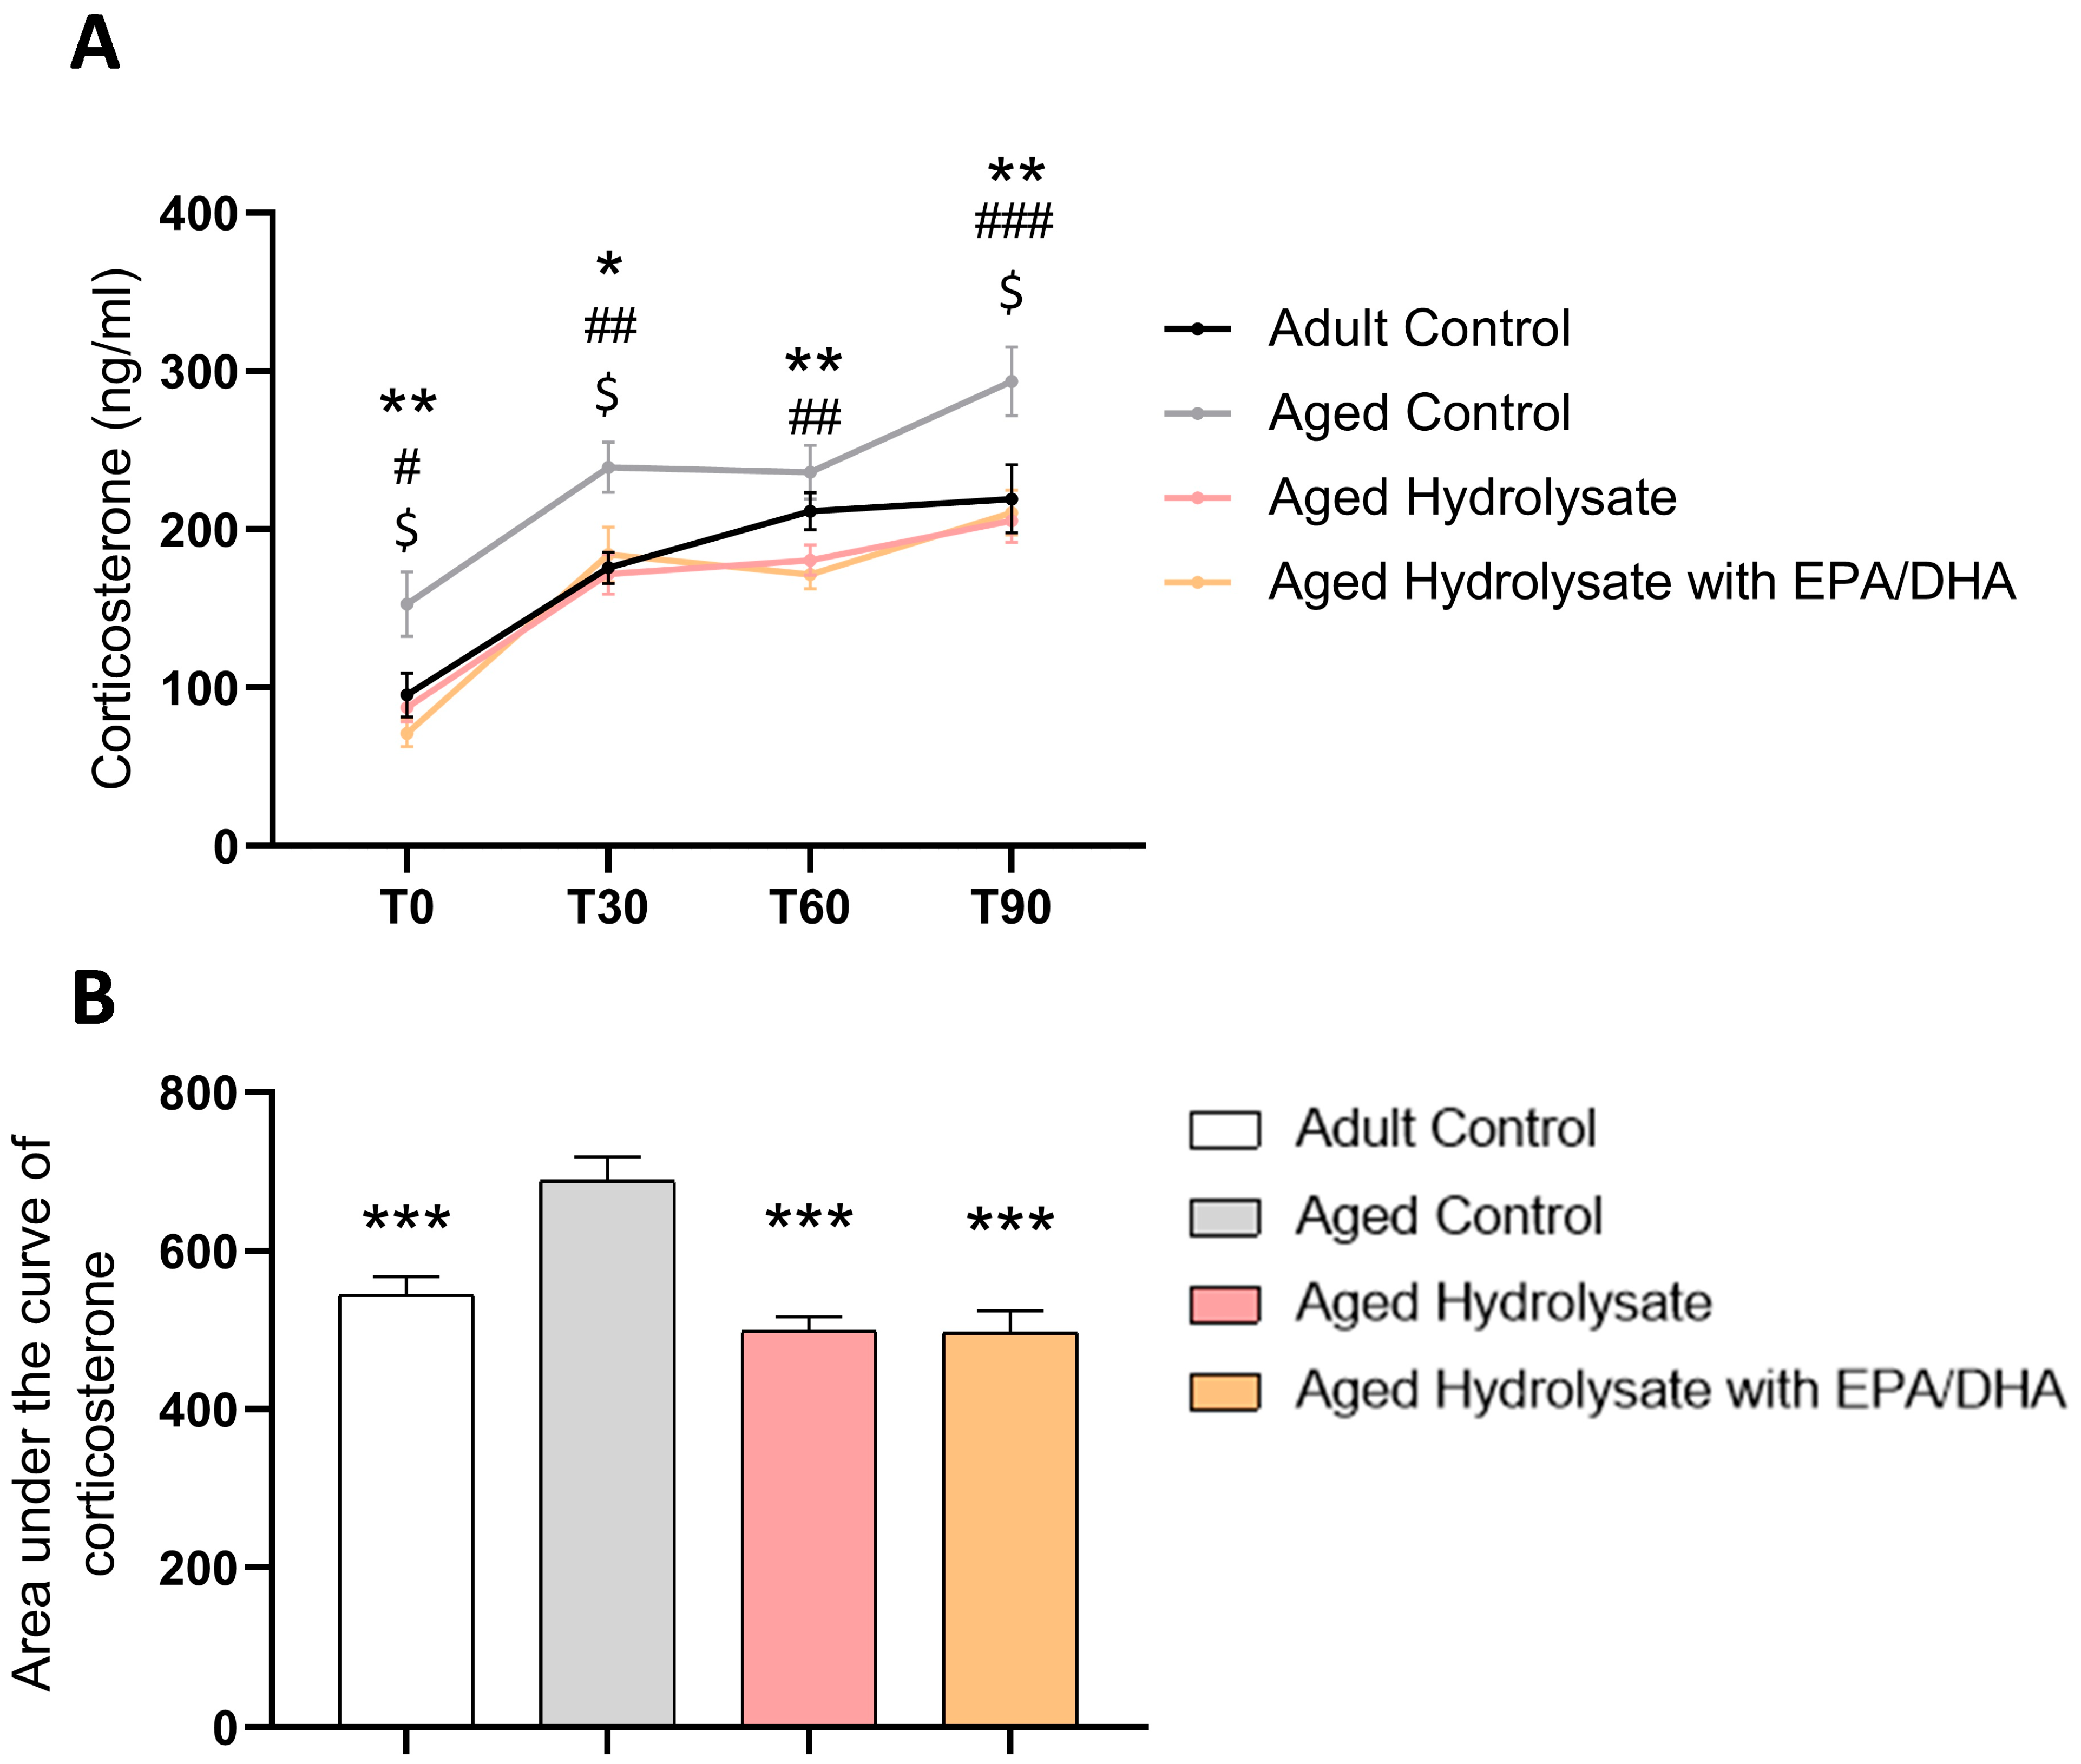
3.4. Both Supplementations Decrease Basal Stress and Modulate Stress Response in Aged Mice

Plasma corticosterone levels were assessed in samples obtained prior to stress induction and at 30, 60, and 90 min after the initiation of the restraint protocol. The plasmatic corticosterone concentrations exhibited an elevation in response to the restraint protocol (time effect, p < 0.001) (Figure 6A).
The aged control mice displayed elevated levels of corticosterone before (T0, p = 0.03) and after stress (T30, p = 0.004; T90 p = 0.02) compared to the adult control mice and that was prevented by both supplementations (T0, aged hydrolysate, p = 0.01, aged hydrolysate with EPA/DHA, p = 0.003; T30, aged hydrolysate, p = 0.003, aged hydrolysate with EPA/DHA, p = 0.03); T60, aged hydrolysate, p = 0.01, aged hydrolysate with EPA/DHA, p = 0.01; T90, aged hydrolysate, p = 0.004, aged hydrolysate with EPA/DHA, p = 0.005).
The area under the curve (AUC) of corticosterone was significantly increased by age (p < 0.001), and this was rescued by both supplementations (aged hydrolysate, p < 0.001, aged hydrolysate with EPA/DHA, p < 0.001) (Figure 6B).

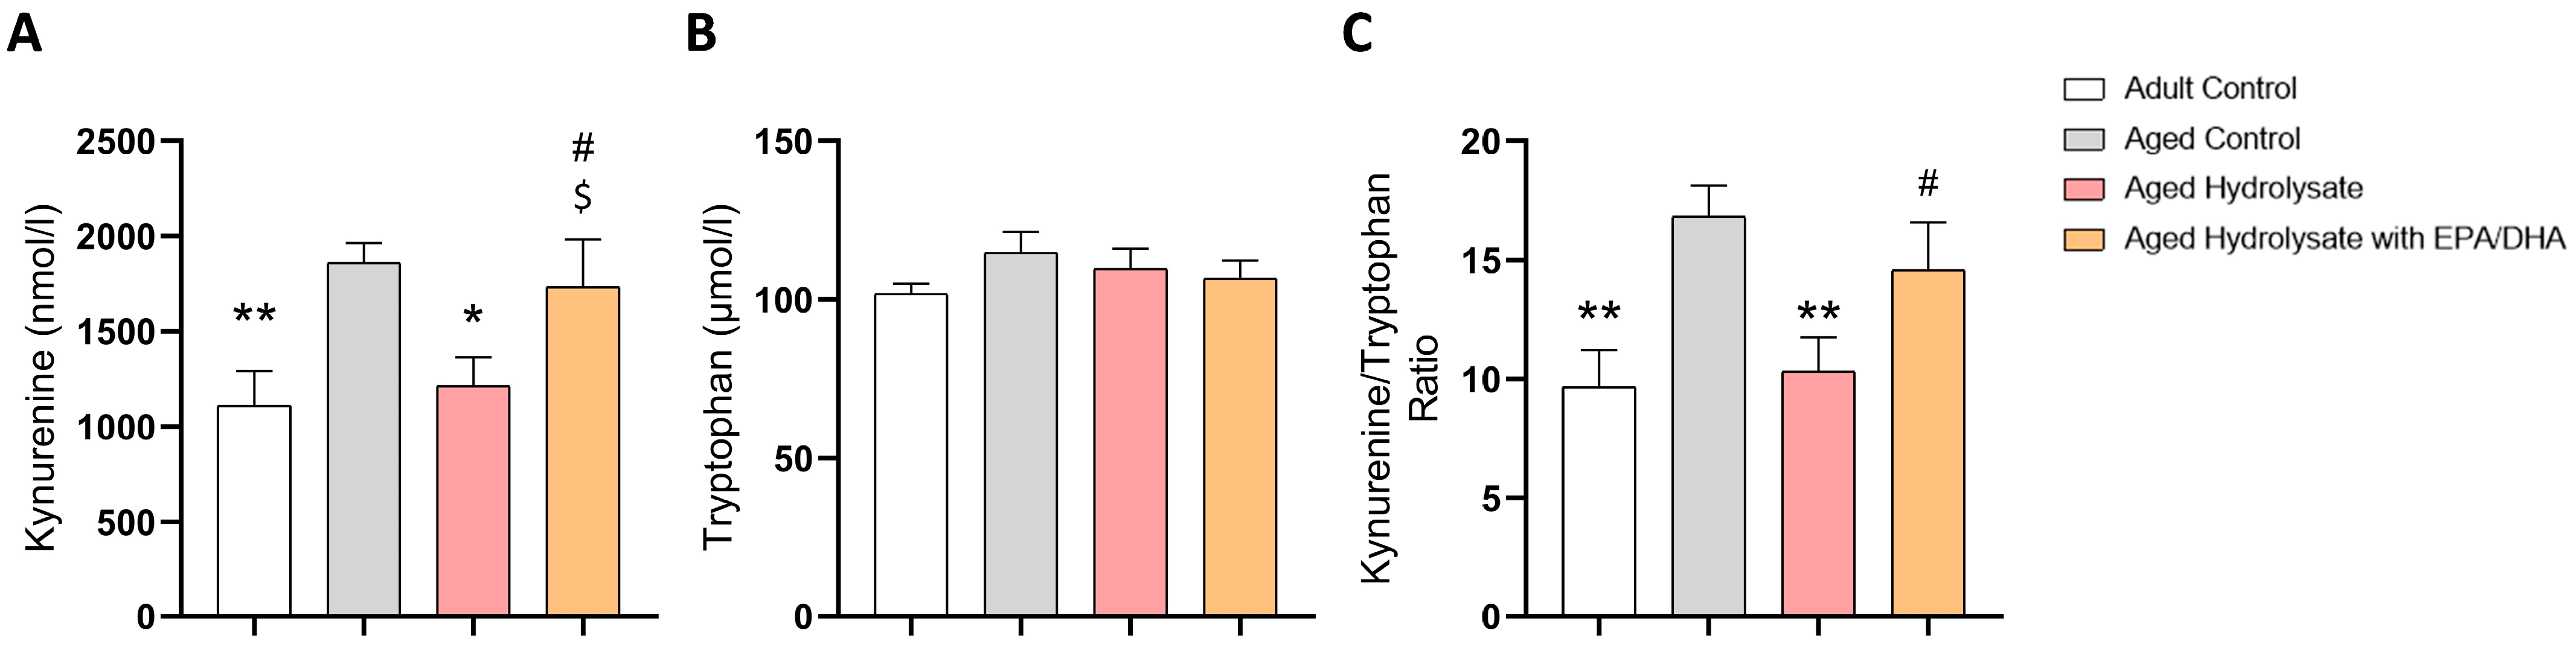
3.5. Fish Hydrolysate Supplementation Decreases the Levels of Plasmatic Kynurenine in Aged Mice

The level of Kyn and the Kyn/Trp ratio were higher in the aged control mice than in the adult control mice (p = 0.006, p = 0.003, respectively) (Figure 7A,C). Interestingly, the Kyn level and the Kyn/Trp ratio were restored similar to the adult control’s level in aged hydrolysate mice (p = 0.02; p = 0.006, respectively) but not in the aged hydrolysate with EPA/DHA group. Age and supplementation had no effect on the level of Tryp (Figure 7B).

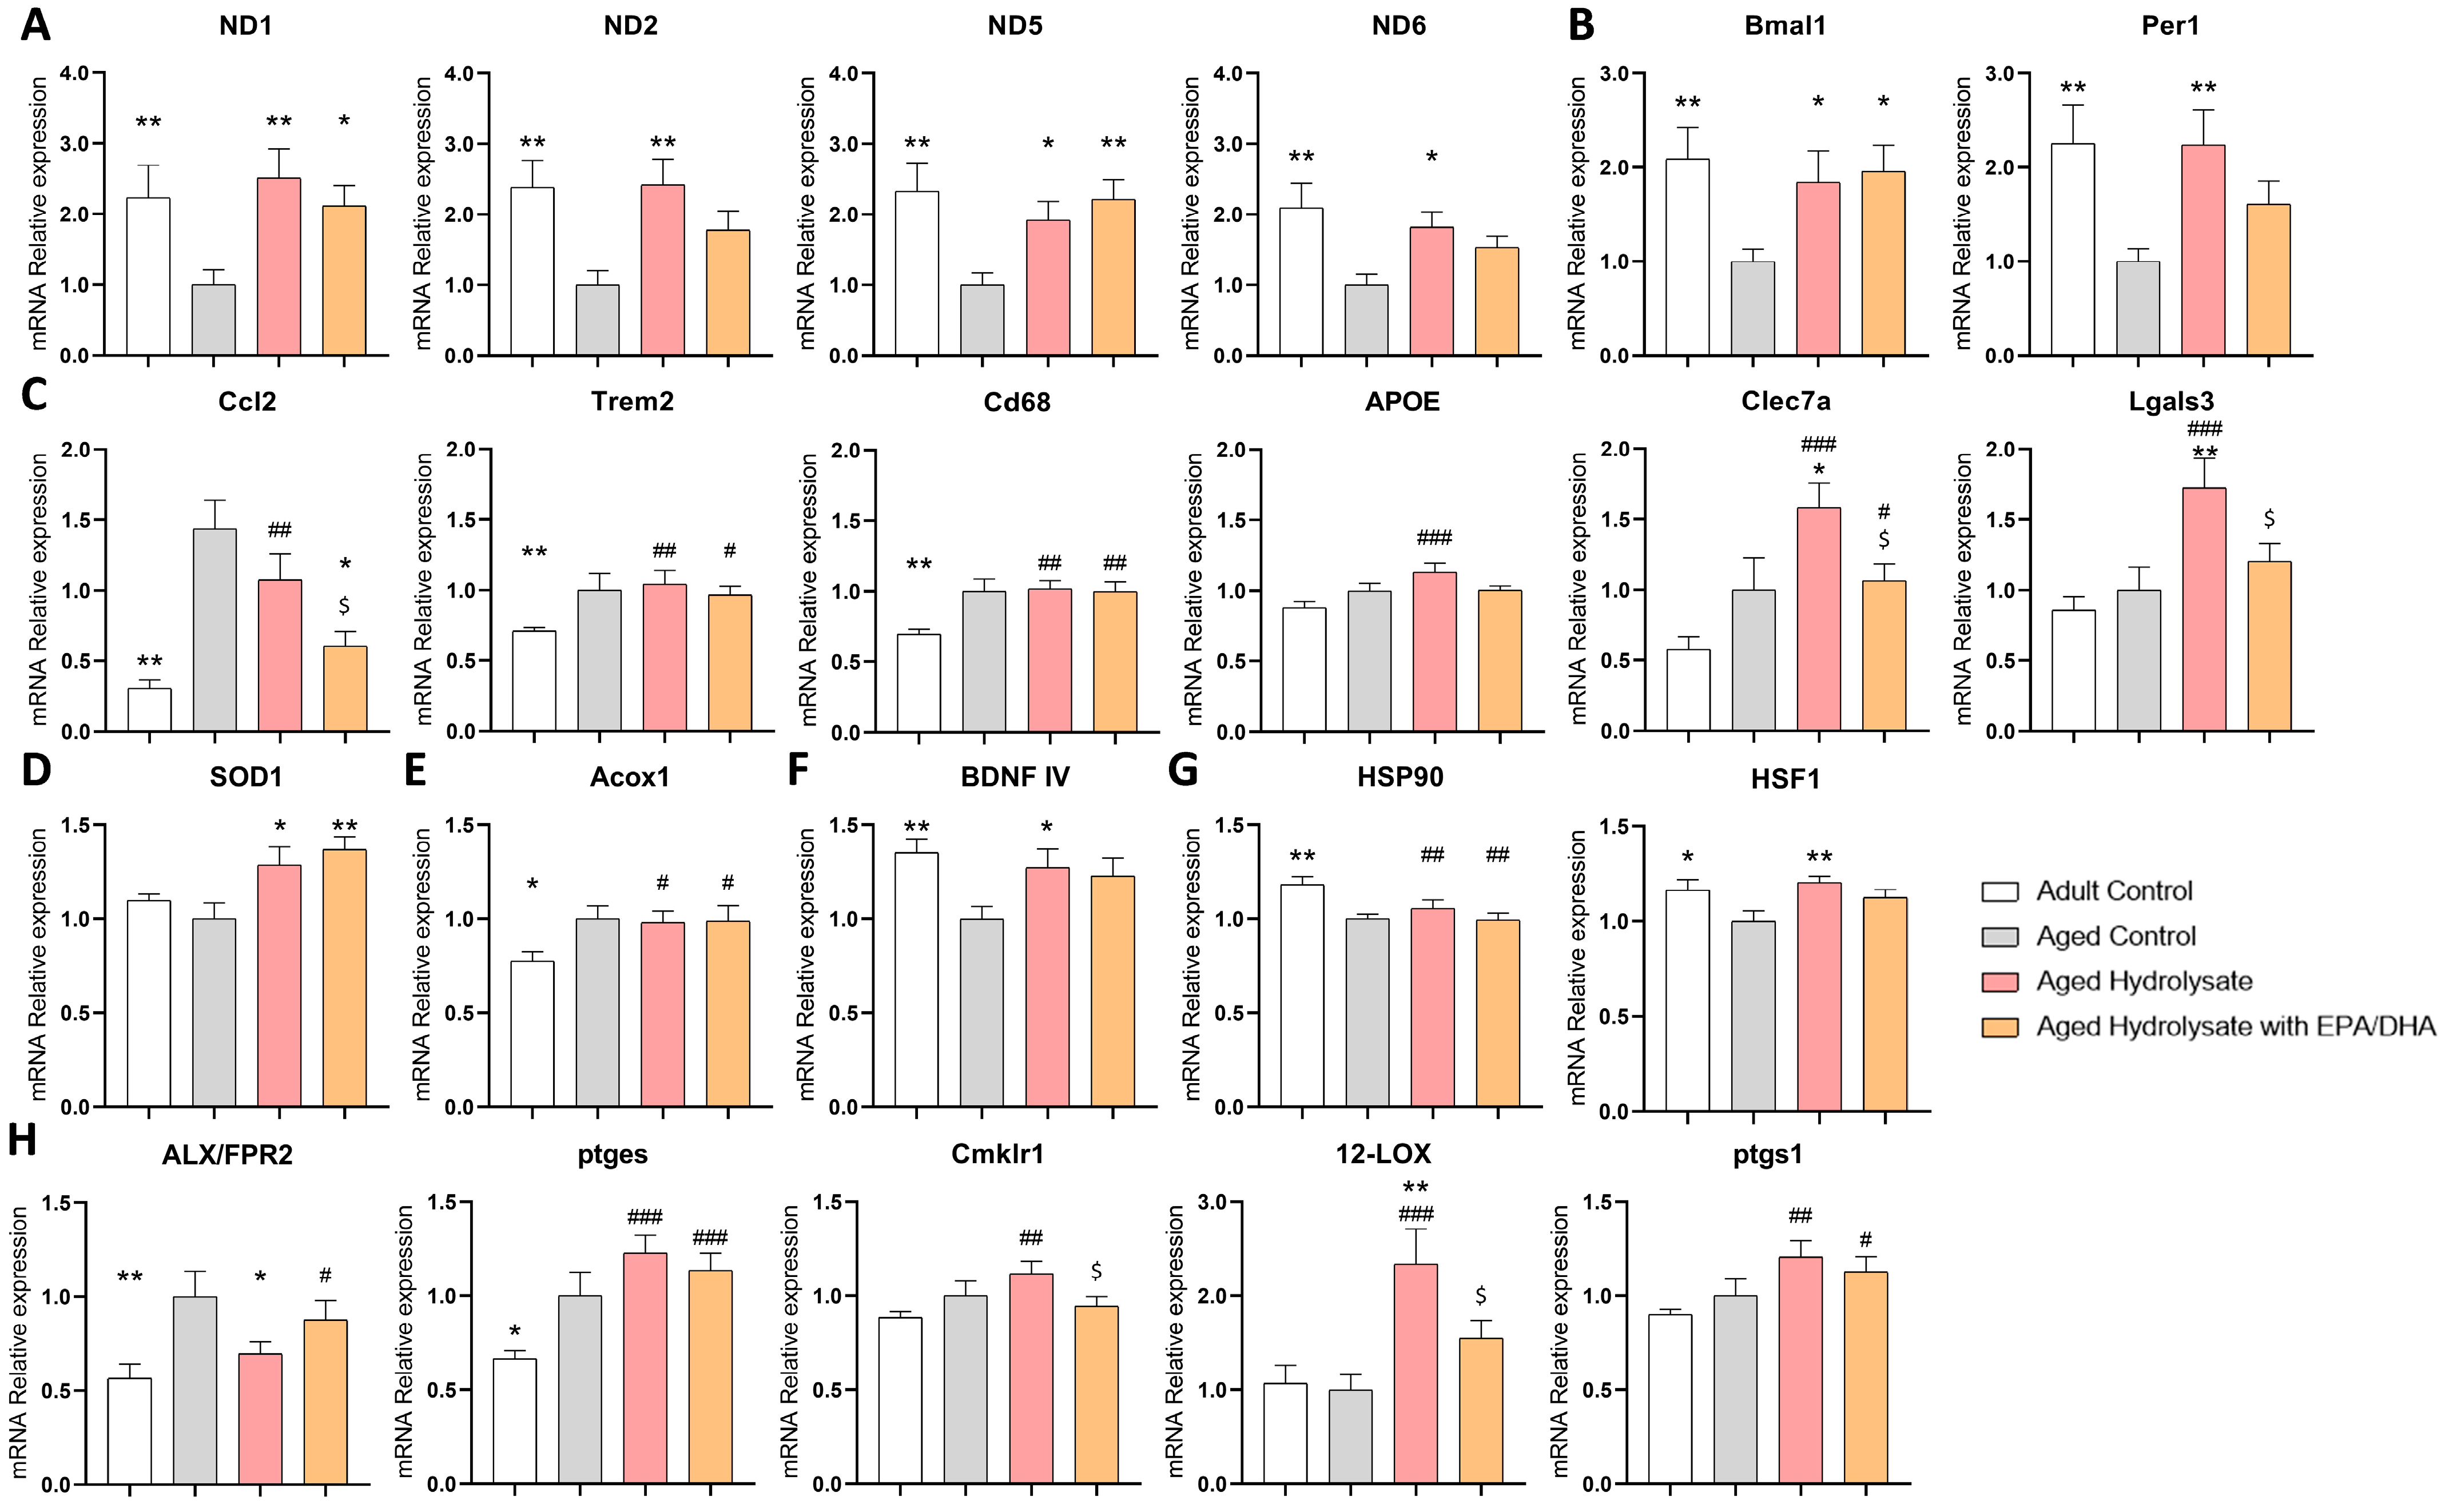
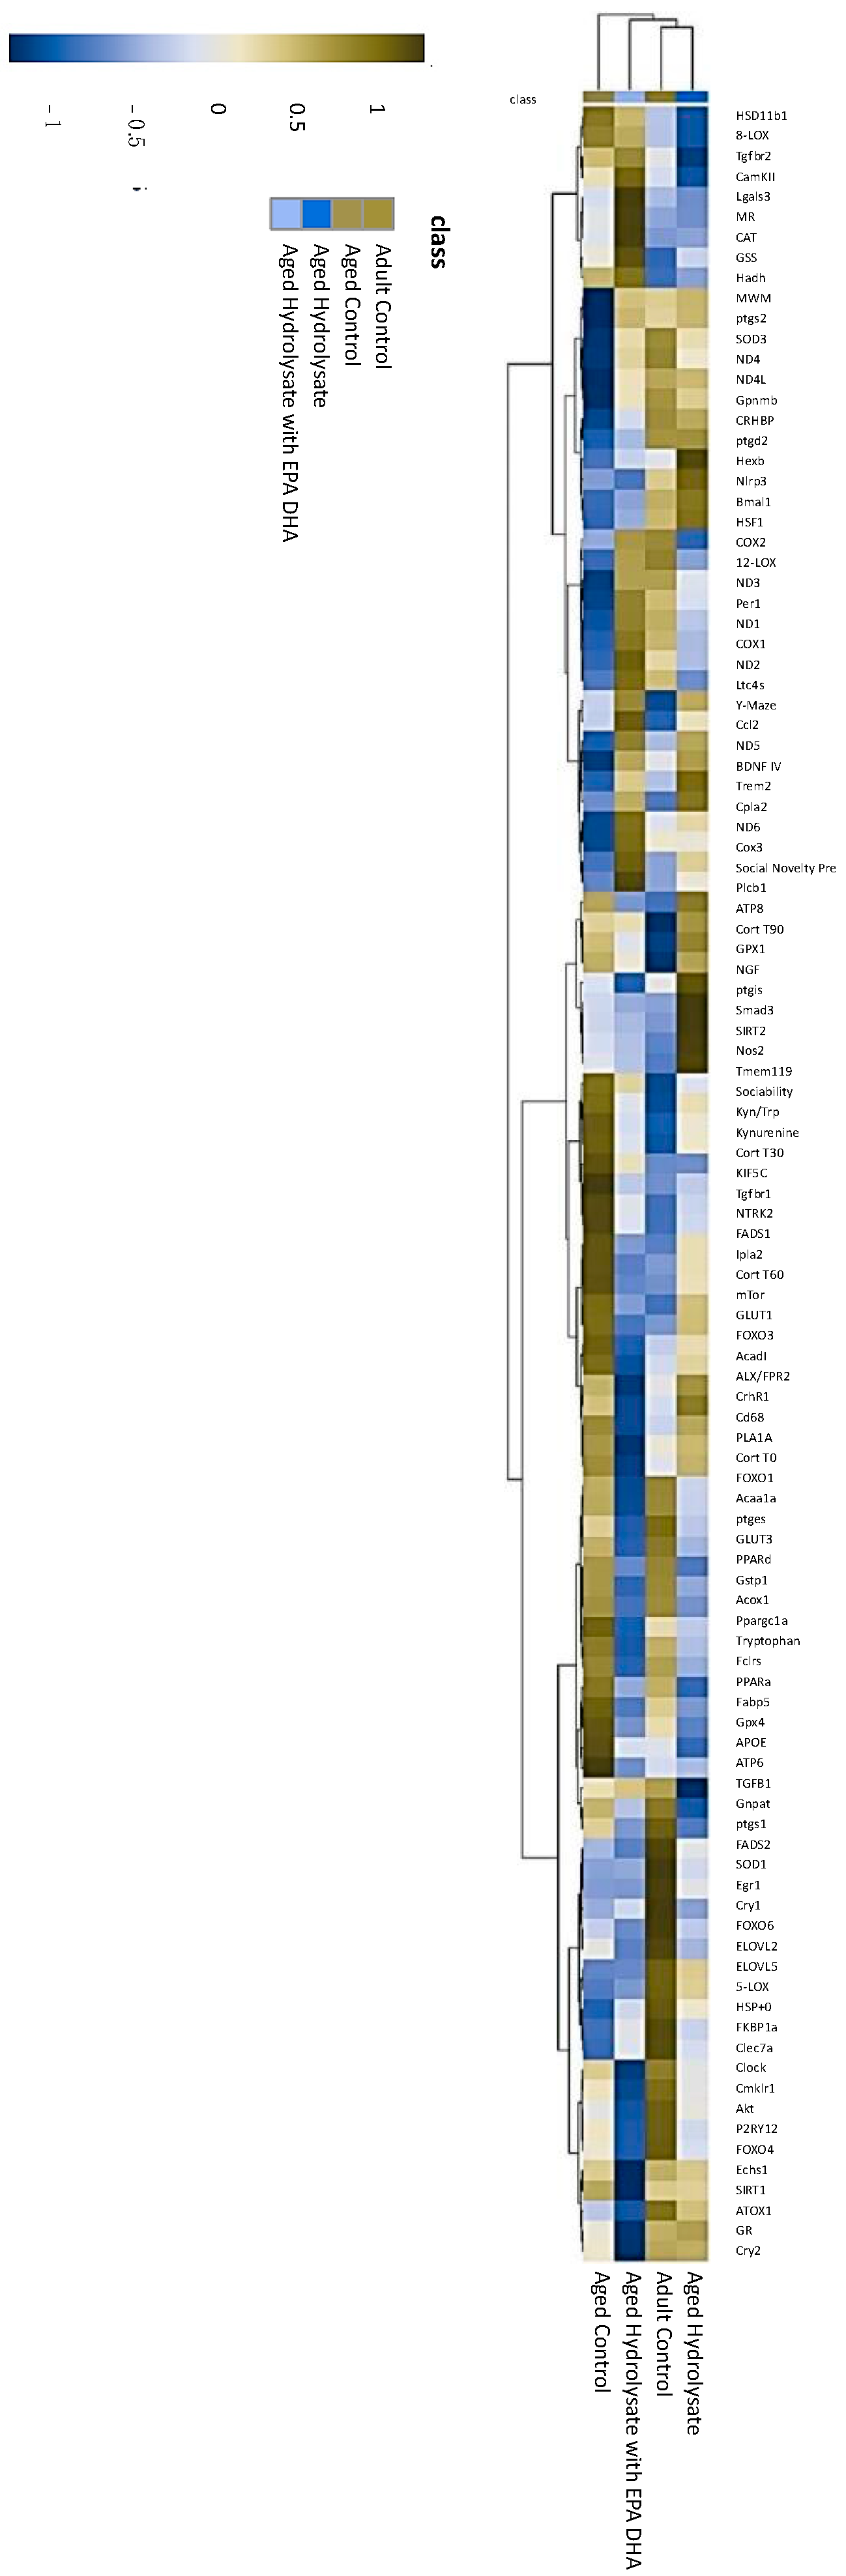
3.6. Both Supplementations Modulate Gene Expression Changes Associated with Aging

To understand the mechanisms involved in the prevention of social preference and memory deficits observed in the supplemented groups during aging, the expressions of 93 genes in the hippocampus were analyzed. These genes are involved in different pathways, such as inflammation, hypothalamic–pituitary–adrenal (HPA) axis, antioxidant defenses, heat shock protein response, neuroprotection, mitochondrial respiratory chain, circadian rhythm, β-oxidation, microglial phenotype, glucose metabolism, and synthesis of PUFAs and oxylipins. All genes that were significantly modulated are presented in Table 2.
The expression of ND1, ND2, ND5, and ND6 involved in the formation of complex 1 of the mitochondrial respiratory chain was downregulated with age (Figure 8A). Interestingly, the expression of these four genes was significantly increased in the aged hydrolysate group compared to the aged group and restored to a similar expression level as the adult control group (p = 0.006; p = 0.004; p = 0.04; p = 0.02, respectively). In the same way, the expression level of ND1 and ND5 was similarly restored in the hydrolysate with EPA/DHA group compared to the adult control group (p = 0.04; p = 0.006, respectively).
The expression of Bmal1 and Per1 involved in the regulation of the circadian clock was also downregulated with age (p = 0.01; p = 0.008, respectively) (Figure 8B). The expression of Bmal1 and Per1 was significantly increased in the aged hydrolysate group to the same level as in the adult control group (p = 0.04; p = 0.008, respectively). The expression of Bmal1 was significantly increased in the aged hydrolysate with EPA/DHA group as compared to the aged control group (p = 0.02).
The expression of six genes involved in microglial neurodegenerative phenotype was modulated (Figure 8C). The expression of Ccl2, Trem2, and Cd68 was upregulated by age (p = 0.02; p = 0.003, p < 0.001, respectively). However, the expression of Ccl2 significantly decreased in the aged hydrolysate with EPA/DHA group (p < 0.001). Both supplementations had no effect on the expression of Trem2 and Cd68 (p > 0.05). Moreover, the expression of APOE, Clec7a, and Lgals3 was increased only in the aged hydrolysate group as compared to the adult control group (p < 0.001).
Although aging did not affect SOD1 involved in antioxidant defenses, both supplementations increased its expression compared to the aged control group (aged hydrolysate, p = 0.01; aged hydrolysate with EPA/DHA, p = 0.002) (Figure 8D).
The expression of Acox1 involved in β-oxidation was significantly increased in the aged control group as compared to the adult control group (p = 0.02). It was not modulated by the supplementations (p > 0.05) (Figure 8E).
BDNF IV expression was significantly decreased by age (p = 0.007) (Figure 8F). Interestingly, it was significantly increased by the hydrolysate supplementation at the same level as the adult control group (p = 0.04).
The expression of two genes involved in heat shock responses was modulated (Figure 8G). The expression of HSP90 was significantly decreased in the aged control group as compared to the adult control and that was not restored by the supplementations (aged control, p = 0.002; aged hydrolysate, p = 0.02; aged hydrolysate with EPA/DHA, p = 0.001). The expression of HSF1 was also significantly decreased by age (p = 0.02). The hydrolysate supplementation restored its expression at the same level as the adult control (p = 0.004).
The expression of four genes involved in the synthesis of oxylipins was modulated (Figure 8H). ALX/FPR2 and ptges expression was significantly increased by age (p = 0.003; p = 0.02, respectively). Interestingly, ALX/FPR2 expression was decreased in the aged hydrolysate group (p = 0.02). Hydrolysate with EPA/DHA supplementation had no effect on the expression of ptges. Cmklr1, 12-LOX, and ptgs1 expression was not affected by aging but was significantly upregulated in the aged hydrolysate group compared to the adult control (p = 0.007; p = 0.001; p = 0.005, respectively). The same result was obtained in the aged hydrolysate with EPA/DHA group for ptgs1 expression (p = 0.04).
Finally, we performed a multivariate analysis. The result of a hierarchical clustering is displayed in a heat map as a dendrogram (Figure 9). Column dendrograms show the distance (or similarity) among the gene expression, behavioral results, and stress response. Row dendrograms show the distance (or similarity) between groups and which nodes each group belongs to as a result of the clustering calculation. Column dendrograms discriminated two clusters of parameters. The first cluster was composed of downregulated variables (blue color) in the aged control group compared to the adult control group. This cluster integrated genes from the mitochondrial respiratory chain (ND1, ND2, ND3, ND4, ND4L, ND5, ND6, COX1, and COX2), circadian clock (Per1, Bmal1), antioxidant defenses (SOD3), and behavioral variables that were altered in aged mice (social novelty preference, MWM and Y-maze). The second cluster was composed of upregulated parameters (red color) in the aged control group compared to the adult control: the stress response (corticosterone level), levels of kynurenine and tryptophan, and Kyn/Trp ratio. Then, row dendrograms separated the aged control group and the adult control group into two different clusters. Column dendrograms confirmed similarity between the adult control group and both supplemented groups. Indeed, both supplementations restored social novelty preference, MWM, and Y-maze parameters at the same level as in the adult control group. They also restored parameters from the stress response (corticosterone level), levels of Kyn and Trp, and Kyn/Trp ratio. From these results, both the aged-supplemented group and the adult control group were gathered in the same cluster. Further in the classification, the aged hydrolysate group is gathered with the adult control group suggesting a stronger similarity between these two groups.

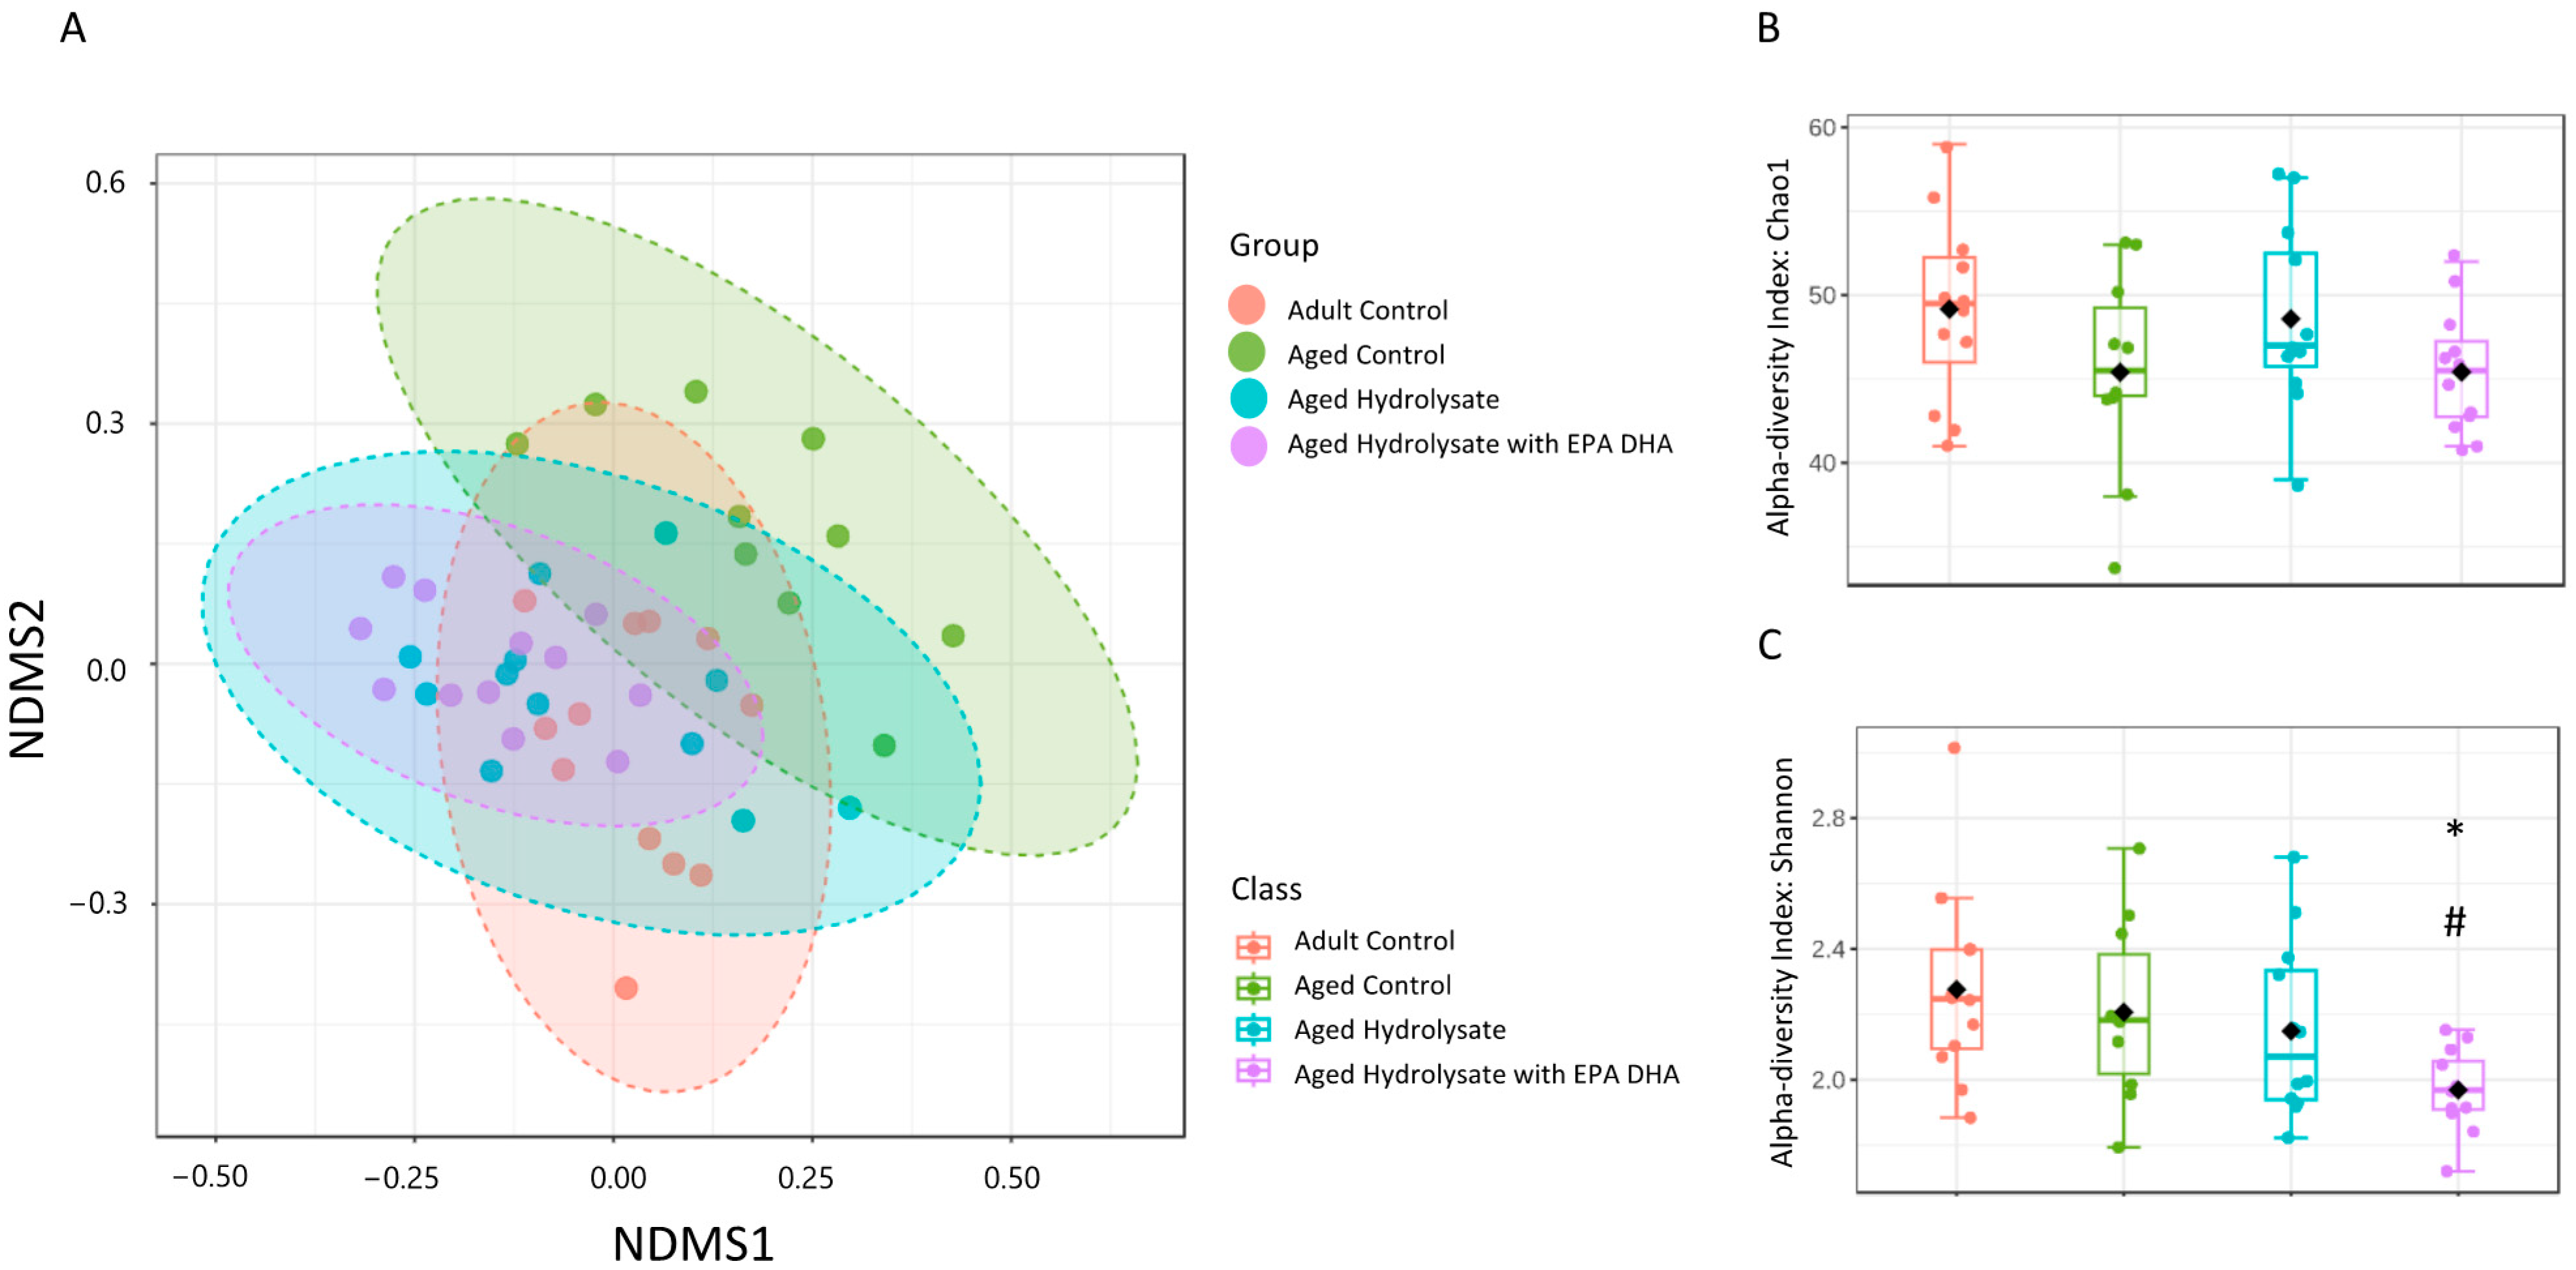
3.7. Age and Supplementations Have Distinct Microbiota Profiles

The beta diversity of the samples was analyzed using a nonmetric multidimensional scaling (NMDS) based on the binary Jaccard algorithm. The results suggest that there were significant differences in the community among the four groups (Figure 10A). Moreover, the intergroup distance was significantly greater than the intragroup distance (R = 0.18, p = 0.001), indicating that the four groups had distinct gut microbiota profiles.
Age and supplementations did not impact the species richness (Figure 10B). The Shannon index was significantly lower in the aged hydrolysate with EPA/DHA group compared to the adult control group (p = 0.02) and the aged control group (p = 0.04) (Figure 10C).

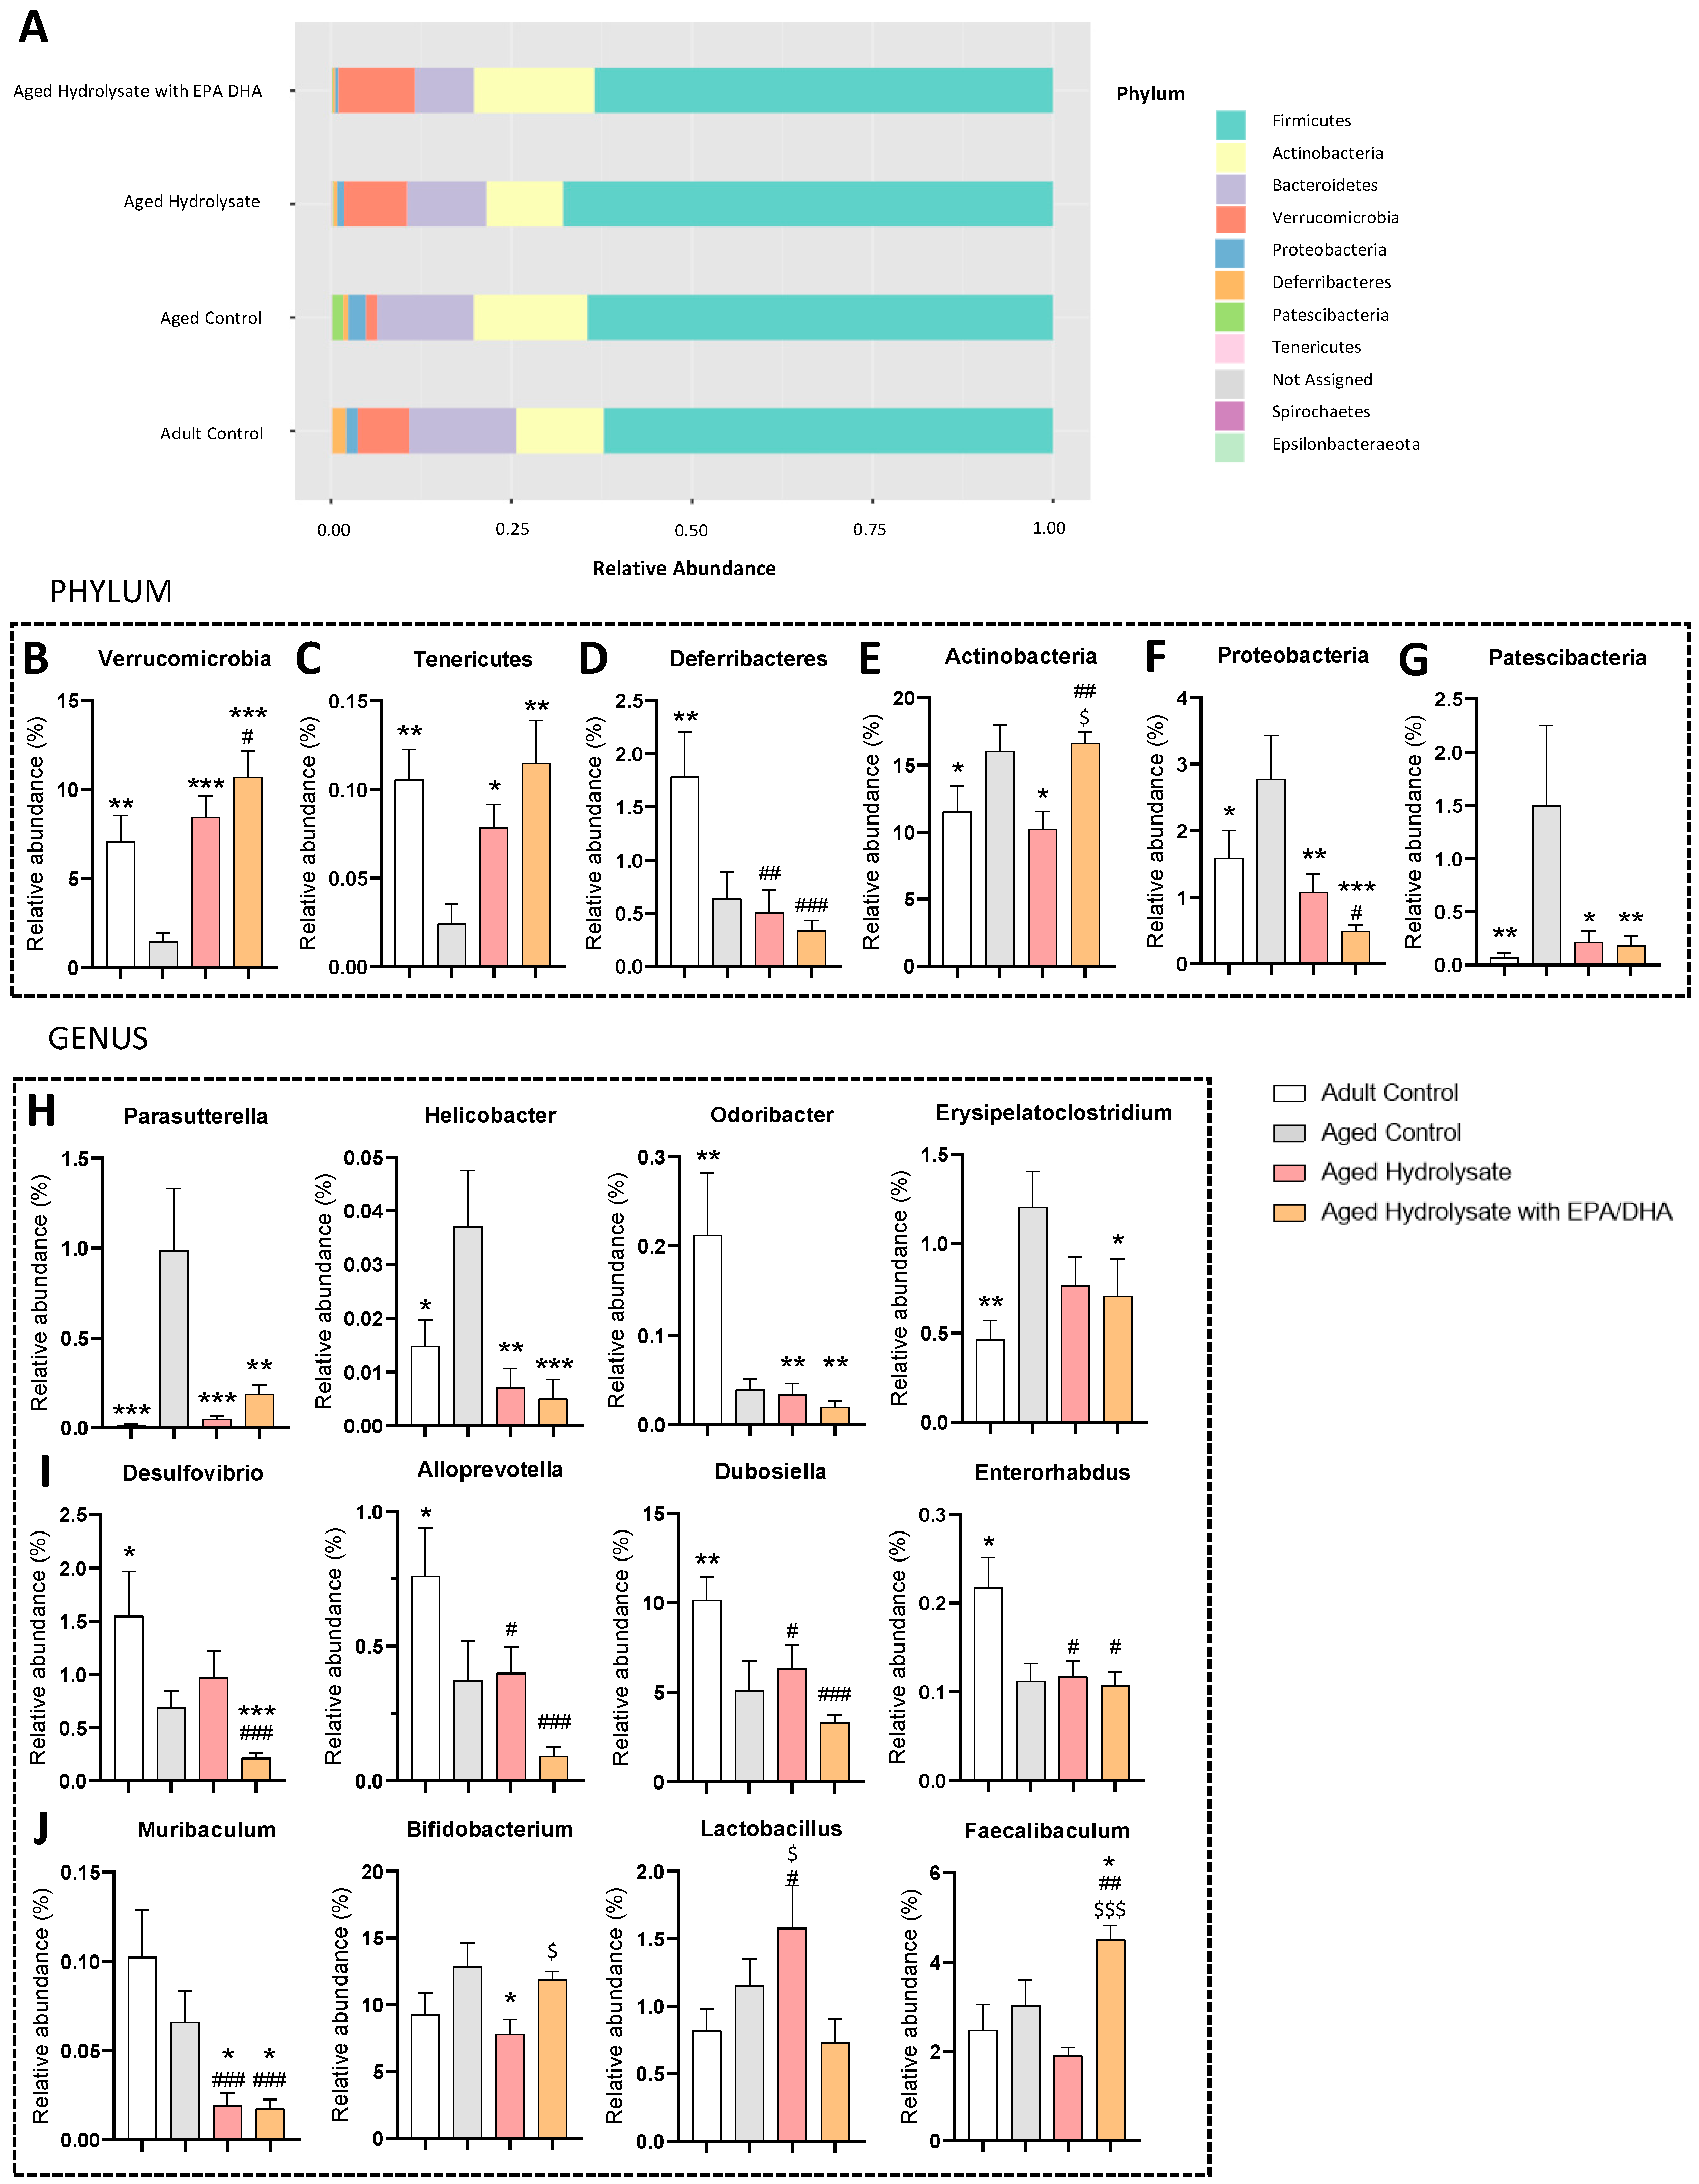
3.8. Both Supplementations Prevent Microbiota Impairments in Aged Mice

We analyzed the relative abundance of gut microbiota at the phylum level (Figure 11A). Of the 10 phyla analyzed, six were modulated by age and/or supplementations.
Verrucomicrobia (Figure 11B) and Tenericutes (Figure 11C) relative abundance was significantly decreased by age (p = 0.005; p = 0.003, respectively), and this was reversed by both supplementations (Verrucomicrobia, aged hydrolysate, p < 0.001, aged hydrolysate with EPA/DHA, p < 0.001; Tenericutes, aged hydrolysate, p = 0.04, aged hydrolysate with EPA/DHA, p = 0.001). Deferribacteres abundance was significantly decreased in the aged control group and in both supplemented groups as compared to the adult control group (aged control, p = 0.006; aged hydrolysate, p = 0.002; aged hydrolysate with EPA/DHA, p < 0.001) (Figure 11D).
Actinobacteria (Figure 11E), Proteobacteria (Figure 11F), and Patescibacteria (Figure 11G) relative abundance was significantly increased by age (p = 0.05; p = 0.04, p = 0.005 respectively), while both supplementations reached the levels of Patescibacteria and Proteobacteria (Patescibacteria, aged hydrolysate, p = 0.01, aged hydrolysate with EPA/DHA, p = 0.01; Proteobacteria, aged hydrolysate, p = 0.004, aged hydrolysate with EPA/DHA, p < 0.001). Actinobacteria abundance was restored only in the aged hydrolysate group at the same level as in the adult control group (p = 0.01).
At genus level, we observed seven genera modulated by age and eight by the supplementations. Age increased the relative abundance of Parasutterella (p < 0.001), Helicobacter (p = 0.01), Odoribacter (p = 0.003), and Erysipelatoclostridum (p = 0.005) (Figure 11H) that was reversed by both supplementations to the same level as the adult control group (Parasutterella, aged hydrolysate, p < 0.001, aged hydrolysate with EPA/DHA, p = 0.001; Helicobacter, aged hydrolysate, p = 0.001, aged hydrolysate with EPA/DHA, p < 0.001; Odoribacter, aged hydrolysate, p = 0.001, aged hydrolysate with EPA/DHA, p = 0.002). Only the aged hydrolysate with EPA/DHA group restored the relative abundance of Erysipelatoclostridum to the same level as the adult control (p = 0.04)
Age decreased the relative abundance of Desulfovibrio (p = 0.04), Alloprevotella (p = 0.04), Dubosiella (p = 0.002), and Enterorhabdus (p = 0.03) (Figure 11I). The decrease in Desulfovibrio relative abundance was more important in the aged hydrolysate with EPA/DHA group compared to the adult control group (p < 0.001). No effect of supplementations was found on the relative abundance of Alloprevotella, Dubosiella, and Enterorhabdus.
No effect of aging was observed for the relative abundance of Muribaculum, Bifidobacterium, Lactobacillus, and Faecalibaculum (Figure 11J). However, the relative abundance of Muribaculum was significantly decreased in both supplemented groups as compared to the adult control group (aged hydrolysate, p < 0.001; aged hydrolysate with EPA/DHA, p < 0.001); and aged control group (aged hydrolysate, p = 0.05; aged hydrolysate with EPA/DHA, p = 0.04) (Figure 11J). The relative abundance of Bifidobacterium was decreased, while Lactobacillus abundance was increased in the aged hydrolysate group compared to the aged control group (Bifidobacterium, p = 0.01; Lactobacillus, p = 0.03). The relative abundance of Faecalibaculum was increased in the aged hydrolysate with EPA/DHA group compared to the adult control group (p = 0.002) and the aged control group (p = 0.001).

3.9. Preference for Social Novelty and Memory Performance Correlates with AUC of Corticosterone, Plasmatic Level of Kyn, Kyn/Trp Ratio, Gene Expression of Complex 1 of the Mitochondrial Respiratory Chain, and Gut Microbiota Composition

The index of social novelty preference was negatively correlated with the AUC of corticosterone, level of Kyn, Kyn/Trp ratio, and relative abundance of Erysipelatoclostridum (AUC of corticosterone, r = −0.43, p = 0.003; Kyn, r = −0.47, p < 0.001; Kyn/Trp ratio, r = −0.45, p = 0.002; Erysipelatoclostridum, r = −0.36, p = 0.02). Conversely, the index of social novelty preference was positively correlated with the expression of ND1, ND3, ND4, and ND6 and relative abundance of Verrucomicrobia (ND1, r = 0.30, p = 0.04; ND3, r = 0.32, p = 0.03; ND4, r = 0.31, p = 0.03; ND6, r = 0.28, p = 0.05; Verrucomicrobia, r = 0.38, p = 0.001). Moreover, the MWM index of recognition was positively correlated with the relative abundance of Verrucomicrobia (r = 0.38, p = 0.01). In contrast, the MWM index of recognition was negatively correlated with the relative abondance of Firmicutes (r = −0.42, p = 0.004) (Supplementary Materials Figure S1).

4. Discussion

As we previously demonstrated, supplementation with the fish hydrolysate prevented the age-related decline in spatial short-term memory and long-term memory and promoted an earlier use of spatial strategies in aged mice [31]. Here, we demonstrated that the same effect can be achieved with a lower dose of fish hydrolysate enriched with EPA/DHA or not.
The main finding of this study is that the fish hydrolysate and the fish hydrolysate enriched with EPA/DHA had a positive impact on age-induced social behavior alterations. Specifically, both supplementations improved preference for social novelty that was diminished by aging. These changes were associated with modulation of the gut microbiota that target different pathways, such as the stress response via the normalization of corticosterone levels, mitochondrial homeostasis via the modulation of the expression of genes involved in the mitochondrial respiratory chain, or the circadian rhythms. To our knowledge, our study is the first to evaluate the effect of a fish hydrolysate on sociability and social novelty preference. Recent research has shown that social behavior and relationships can change across the lifespan, a phenomenon referred to as ‘social aging’ [39,40]. Considering the significance of social integration for overall health and well-being, alterations in social behavior with age can influence how physical condition evolves over time. Our findings indicate that it was not the social interest that was altered during aging, but it was the social novelty preference, which confirmed recent reports [41,42]. Indeed, aged mice exhibited no preference for a novel foreign mouse. This loss of preference for social novelty may suggest a reduced ability to distinguish between individual mice, implying a social recognition deficit in aged mice. We demonstrated for the first time that fish hydrolysate supplementation can prevent the age-related effects on social novelty preference.
Understanding the molecular mechanisms involved in social preference and memory deficits is important to define the efficacy of fish hydrolysate supplementations to prevent age-related diseases. As (1) gut microbiota composition is modified during aging, (2) microbiota influence metabolism, and (3) communication axes exist between the gut microbiota and the brain, we investigated if the gut microbiota could be the hub that can explain behavioral changes during aging. We first analyzed the gut microbiota profile. Indeed, the gut microbiota play a crucial role in supporting healthy cognition and neurological functions of its host, including active participation in important aspects of brain aging. Gut microbial diversity decreases with aging [16,43,44,45,46]. This change has been associated with cognitive decline and social disturbances [21,47]. In our study, an NMDS analysis demonstrated that the gut flora profile of aged mice deviated from that of adult mice. Interestingly, we showed for the first time that fish hydrolysate supplementation restored the profiles of the intestinal flora in a way similar to the adult control group. Moreover, this restoration was associated with a rescue of cognitive and social behavior. Little is known about the effects of low-molecular-weight peptides present in the fish hydrolysate on microbiota, although a study reported that supplementation with small peptides from skipjack byproducts increases the diversity of the intestinal flora, which is in accordance with our results [48]. It should be interesting to analyze the metabolome induced by fish hydrolysate supplementations to better understand the observed effects.
Previous studies highlight a decline in bacteria phyla with age [16,43,44,45,46]. Compared with the control group, the abundance of Verrucomicrobia and Tenericutes was decreased in the aged group, while it was restored by both supplementations. The Spearman’s rank correlation analysis revealed that the level of Verrucomicrobia was positively correlated with the index of social novelty preference and the index of MWM recognition. A recent study reports that a lower abundance of Tenericutes has been observed in patients with cognitive impairment [49]. In addition, in healthy older adults, a positive correlation is found between the level of Verrucomicrobia and cognitive functions [50]. It has been reported that increased levels of Verrucomicrobia can suppress neurodegeneration [51] and reverse cognitive dysfunction, including improvements in impaired spatial working memory and recognition of new objects, while also restoring brain metabolism [52]. In various studies exploring cognition and gut microbiota in older adults, Verrucomicrobia have also been associated with better performance in tasks related to psychomotor processing speed, cognitive flexibility, and learning [50,53,54]. This suggests that the increase in both Verrucomicrobia and Tenericutes, induced by fish hydrolysate supplementations, can contribute to healthy aging by preventing cognitive dysfunction. Furthermore, we showed an increase in relative abundance of Proteobacteria in aged mice compared with the control group. This was rescued by both fish hydrolysate and fish hydrolysate with EPA + DHA supplementations. Proteobacteria, a major phylum of Gram-negative bacteria, are more abundant in older adults compared to younger adults. In previous studies, they have also been linked to increased gut inflammation and dysbiosis [55] and are negatively associated with executive function, learning, and memory [54].
At the genus level, our analysis revealed a significant increase in Parasutterella, Helicobacter, Odoribacter, and Erysipelatoclostridium in aged mice that was prevented by both supplementations. This result suggests that fish hydrolysate supplementations prevented dysbiosis observed during aging and could contribute to prevent cognitive dysfunction. Indeed, it has been reported that higher relative abundances of Parasutterella and Odoribacter are associated with cognitive and spatial learning impairments [42,56]. Helicobacter and Odoribacter are significantly increased in cognitive-altered db/db mice and in D-galactose-induced cognitive impairment mice [57,58]. Interestingly, supplementation with peptides derived from walnut in a model of aging induced by D-galactose injection improves cognitive impairment by regulating the composition of the microflora and notably preventing the increase in Helicobacter and Odoribacter [58].
It has been demonstrated that microbiota dysregulation is highly correlated with cognitive impairment and may influence social behavior and stress regulation [59,60,61,62]. Stress not only influences the composition of the gut microbiota, but the gut microbiota also impacts the stress response and brain neurochemistry [63,64]. Germ-free mice subjected to acute restraint stress exhibit an amplified reaction of the HPA axis, resulting in increased corticosterone levels. This dysfunction is rectified when germ-free mice are colonized with commensal bacteria [65]. In our study, aged mice had higher basal serum corticosterone levels and impaired HPA axis response to stressful stimuli compared with young mice. These findings confirm our previous study [31] and corroborate the results of Tronche et al. [66] reporting that the stress system of aged mice is not as controlled as that of young mice under normal physiological conditions and does not effectively respond to incoming stress compared with young mice. Moreover, the studies conducted by Knight and Durbin [67] and Puigoriol-Illamola et al. [68] have established a correlation between anxiety and memory capacity. They indicate that individuals with anxiety are more susceptible to experiencing memory deficits and that inhibiting the enzyme responsible for glucocorticoid synthesis can prevent cognitive impairment [67,68]. Our results indicate that fish hydrolysate supplementation restored basal corticosterone levels in aged mice and both supplementations decreased the stress reactivity. The Spearman’s rank correlation analysis revealed a negative correlation between the AUC of the corticosterone level and social behavior. Moreover, we also demonstrated that microbiota composition was highly correlated with social novelty preference suggesting that the fish hydrolysate supplementation enhanced social behavior by modulating the level of corticosterone and the microbiota profile.
Furthermore, gut microbiota also plays a role in shaping the host’s circadian rhythms that are also modified during aging [69,70]. A comparison between germ-free mice and specific pathogen-free mice has corroborated that microbiota significantly induce diurnal circadian rhythms within liver hepatocytes [71]. Our results suggest a decrease in the expression of two circadian genes, Bmal1 and Per1, with aging. Few studies have investigated the expression of clock genes on learning and memory processes in relation to aging. However, Bmal1 has been shown to play a significant role in aging-related pathology [72,73]. Indeed, Bmal1−/− mice exhibit impairments on hippocampus-dependent cognitive tasks, including the Morris water maze [74]. In addition, it has been shown that reducing Per1 mRNA levels in the hippocampus by 30% leads to impaired hippocampal learning in adult mice [75]. Conversely, when Per1 is overexpressed in the hippocampus of aged mice, it prevents age-related hippocampal memory deficits, indicating that Per1 plays a crucial and causal role in hippocampal memory processes. Taken together, these findings suggest that the upregulation of Per1 following learning contributes to the subsequent formation of long-term memories in the hippocampus [76]. By restoring the expression of Per1 and Bmal1 genes to the same level as in adult mice, fish hydrolysate therefore appeared to be an interesting candidate for preventing circadian clock alterations during aging.
In addition, previous studies have highlighted the essential role of mitochondria in the communication between the gut and brain [77,78]. The modulation of mitochondria, and especially a decrease in the activity of mitochondrial electron transfer complexes, is also associated with behavioral dysfunctions during aging [79,80]. Defects in complex I are associated with several human neurological disorders [81]. Deficits in the respiratory chain contribute to increased ROS production, resulting in age-dependent memory impairments and behavioral dysfunctions [79,80,82,83]. In our study, aging decreased the expression of mitochondrial complex 1 genes ND1, ND2, ND5, and ND6 and fish hydrolysate supplementation restored their expression to the same level as in adult mice. In addition, we showed for the first time, a positive correlation between the level of the mitochondrial respiratory chain gene expression and the index of social novelty preference, suggesting that the increased expression of the mitochondrial respiratory chain gene expression induced by the fish hydrolysate supplementation may enhance social behavior.
Finally, the addition of n-3 LC-PUFAs to the fish hydrolysate did not have an additional effect compared to the fish hydrolysate alone. The fish hydrolysate contained mainly low-molecular-weight peptides (2.9 mg/d) and a small amount of n-3 LC-PUFAs (130 µg/d). Our result suggests that the effect observed was only due to low-molecular-weight peptides as reported in two studies on the effect of peptides on gut microbiota and cognitive impairment or that the amount of n-3 LC-PUFAs contained in the fish hydrolysate was sufficient to produce an additional effect and improve gut microbiota and social behavior. The beneficial role of n-3 LC-PUFAs on microbiota is poorly described and only in adults. The long-term administration of a high dose of EPA/DHA (250 mg/d for 5 weeks) in female rats leads to restoration of the normal Firmicutes/Bacteroidetes phyla ratio and decreases the abundance of proinflammatory Proteobacteria phylum [84]. Short-term n-3 LC-PUFA supplementation (990 mg EPA + 990 mg DHA for 7 days) modulates microbiota in a mucosal simulator of the human intestinal microbial ecosystem [85]. But the major effects of EPA and DHA seems to be associated with their anti-inflammatory properties and may act on gut permeability [86]. To be sure that the effect of n-3 LC-PUFA in the fish hydrolysate is not sex-dependent, a novel study should be conducted on female mice.
Consequently, fish hydrolysate can be considered as a multipotent actor to prevent cognitive and social alteration during aging via a direct pathway on the HPA axis through a benzodiazepine-like effect [87] that contributes to the prevention of social alteration, and/or via an indirect pathway through the microbiota. Indeed, microbiota may impact hippocampal-dependent memory and social behavior mechanisms through different pathways [88]. Microbiota may activate the vagal afferent nerves that promote hippocampal spatial memory. Microbiota may also impact the HPA axis through modulating the levels of corticosterone that modulate hippocampal memory. Moreover, microbiota is able to produce signaling molecules, such as short-chain fatty acids, that have strong effects on memory through enhancing BDNF associated with neurogenesis that is highly decreased during aging. Finally, microbiota may influence the circadian rhythms as shown in our study and others [89]. Microbiota may also play an important role in the homeostasis of oxidative molecules that induce mitochondrial dysfunction as shown in our study and prevent alteration of social interaction. These pathways can overlap and interact and hence have to be considered altogether to depict a precise picture of the effect of fish hydrolysate.

5. Conclusions

In this study, we are the first to demonstrate a positive impact of fish hydrolysate with low-molecular-weight peptides and n-3 LC-PUFAs on social behavior and to confirm its interesting results on cognitive functions, anxiety-like behavior, and stress response in aged mice. The beneficial effects induced by the hydrolysate supplementation on gut microbiota, corticosterone levels, circadian clock, and mitochondrial respiratory chain reinforced the innovative character of this active ingredient on the prevention of age-related impairments. Finally, the addition of n-3 LC-PUFAs to the existing fish hydrolysate did not have an additional effect compared to fish hydrolysate alone, suggesting that it did not act synergistically with the fish hydrolysate. Our results highlight a new target to treat age-related behavioral alterations by acting on gut microbiota. Moreover, with a view to preventive and personalized nutrition, fish hydrolysate appears as a good candidate for preventing the alteration of memory performance and social behavior during aging.

Supplementary Materials

The following supporting information can be downloaded at: https://www.mdpi.com/article/10.3390/foods12234199/s1, Figure S1: Preference for social novelty and memory performance correlate with (A) AUC of corticosterone. (B) Plasmatic level of Kynurenine. (C) Kynurenine/Tryptophan ratio. (D) Gene expression of complex 1 of the mitochondrial respiratory chain and (E) Gut microbiota composition.

Author Contributions

Conceptualization, E.B., A.-L.D. and C.J.; Data curation, C.M. and M.C.; Formal analysis, C.M., M.C. and Q.L.; Funding acquisition, A.-L.D. and C.J.; Investigation, C.M. and C.L.; Methodology, C.L. and Q.L.; Project administration, A.-L.D. and C.J.; Supervision, V.P., S.L., E.B., A.-L.D. and C.J.; Visualization, V.P. and S.L.; Writing—original draft, C.M., A.-L.D. and C.J.; Writing—review and editing, E.B., A.-L.D. and C.J. All authors have read and agreed to the published version of the manuscript.

Funding

This work is part of the Optimyss project, which has been funded by the National Agency of Research (ANR France) and Abyss Ingredients in the context of the national French project “Plan de relance” (ANR 21-PRRD-0058-01).

Institutional Review Board Statement

The animal study was reviewed and approved by CE050 (Approval ID APAFIS#27756-2020102109422895 v3).

Data Availability Statement

Data is contained within the article or Supplementary Material.

Conflicts of Interest

Quentin Leyrolle, Céline Lucas, Sophie Laye, Véronique Pallet, Anne-Laure Dinel, and Corinne Joffre report no disclosures. Abyss Ingredients funds Camille Mougin, Mathilde Chataigner, and Elodie Bouvret. Mathilde Chataigner: employee of Abyss Ingredients; Elodie Bouvret: employee of Abyss Ingredients; This work is part of a collaborative project named Op-timyss which has been funded by the National Agency of Research (ANR France) and Abyss In-gredients in the context of national French project “Plan de relance”. Mathilde Chataigner and Elodie Bouvret work for Abyss Ingredients and provide the fish hydrolysate, described in the patent number FR3099339(B1) in which Mathilde Chataigner is cited as an inventor; Camile Mougin was recruited for this specific research program by NutriNeuro.

References

  1. Camfield, D.A.; Owen, L.; Scholey, A.B.; Pipingas, A.; Stough, C. Dairy Constituents and Neurocognitive Health in Ageing. Br. J. Nutr. 2011, 106, 159–174. [Google Scholar] [CrossRef]
  2. World Population Ageing, 2019 Highlights; United Nations, Department of Economic and Social Affairs, Population Division: New York, NY, USA, 2020; ISBN 978-92-1-148325-3.
  3. Gallagher, M.; Rapp, P.R. The Use of Animal Models to Study the Effects of Aging on Cognition. Annu. Rev. Psychol. 1997, 48, 339–370. [Google Scholar] [CrossRef]
  4. Wyss-Coray, T. Ageing, Neurodegeneration and Brain Rejuvenation. Nature 2016, 539, 180–186. [Google Scholar] [CrossRef]
  5. Deary, I.J.; Corley, J.; Gow, A.J.; Harris, S.E.; Houlihan, L.M.; Marioni, R.E.; Penke, L.; Rafnsson, S.B.; Starr, J.M. Age-Associated Cognitive Decline. Br. Med. Bull. 2009, 92, 135–152. [Google Scholar] [CrossRef]
  6. Sadoun, A.; Rosito, M.; Fonta, C.; Girard, P. Key Periods of Cognitive Decline in a Nonhuman Primate Model of Cognitive Aging, the Common Marmoset (Callithrix Jacchus). Neurobiol. Aging 2019, 74, 1–14. [Google Scholar] [CrossRef]
  7. McQuail, J.A.; Frazier, C.J.; Bizon, J.L. Molecular Aspects of Age-Related Cognitive Decline: The Role of GABA Signaling. Trends Mol. Med. 2015, 21, 450–460. [Google Scholar] [CrossRef]
  8. Arioli, M.; Crespi, C.; Canessa, N. Social Cognition through the Lens of Cognitive and Clinical Neuroscience. BioMed Res. Int. 2018, 2018, 4283427. [Google Scholar] [CrossRef]
  9. Yang, Y.C.; Boen, C.; Gerken, K.; Li, T.; Schorpp, K.; Harris, K.M. Social Relationships and Physiological Determinants of Longevity across the Human Life Span. Proc. Natl. Acad. Sci. USA 2016, 113, 578–583. [Google Scholar] [CrossRef]
  10. Charles, S.T.; Carstensen, L.L. Social and Emotional Aging. Annu. Rev. Psychol. 2010, 61, 383–409. [Google Scholar] [CrossRef]
  11. Ratsika, A.; Cruz Pereira, J.S.; Lynch, C.M.K.; Clarke, G.; Cryan, J.F. Microbiota-Immune-Brain Interactions: A Lifespan Perspective. Curr. Opin. Neurobiol. 2023, 78, 102652. [Google Scholar] [CrossRef]
  12. Sherwin, E.; Bordenstein, S.R.; Quinn, J.L.; Dinan, T.G.; Cryan, J.F. Microbiota and the Social Brain. Science 2019, 366, eaar2016. [Google Scholar] [CrossRef]
  13. O’Toole, P.W.; Jeffery, I.B. Gut Microbiota and Aging. Science 2015, 350, 1214–1215. [Google Scholar] [CrossRef]
  14. Saraswati, S.; Sitaraman, R. Aging and the Human Gut Microbiota—From Correlation to Causality. Front. Microbiol. 2015, 5, 764. [Google Scholar] [CrossRef]
  15. Sherwin, E.; Dinan, T.G.; Cryan, J.F. Recent Developments in Understanding the Role of the Gut Microbiota in Brain Health and Disease. Ann. N. Y. Acad. Sci. 2018, 1420, 5–25. [Google Scholar] [CrossRef]
  16. Ghosh, T.S.; Shanahan, F.; O’Toole, P.W. Toward an Improved Definition of a Healthy Microbiome for Healthy Aging. Nat. Aging 2022, 2, 1054–1069. [Google Scholar] [CrossRef]
  17. Li, Y.; Peng, Y.; Shen, Y.; Zhang, Y.; Liu, L.; Yang, X. Dietary Polyphenols: Regulate the Advanced Glycation End Products-RAGE Axis and the Microbiota-Gut-Brain Axis to Prevent Neurodegenerative Diseases. Crit. Rev. Food Sci. Nutr. 2022, 1–27. [Google Scholar] [CrossRef]
  18. Dinan, T.G.; Cryan, J.F. The Microbiome-Gut-Brain Axis in Health and Disease. Gastroenterol. Clin. N. Am. 2017, 46, 77–89. [Google Scholar] [CrossRef]
  19. Sharon, G.; Cruz, N.J.; Kang, D.-W.; Gandal, M.J.; Wang, B.; Kim, Y.-M.; Zink, E.M.; Casey, C.P.; Taylor, B.C.; Lane, C.J.; et al. Human Gut Microbiota from Autism Spectrum Disorder Promote Behavioral Symptoms in Mice. Cell 2019, 177, 1600–1618.e17. [Google Scholar] [CrossRef]
  20. Boehme, M.; Guzzetta, K.E.; Bastiaanssen, T.F.S.; van de Wouw, M.; Moloney, G.M.; Gual-Grau, A.; Spichak, S.; Olavarría-Ramírez, L.; Fitzgerald, P.; Morillas, E.; et al. Microbiota from Young Mice Counteracts Selective Age-Associated Behavioral Deficits. Nat. Aging 2021, 1, 666–676. [Google Scholar] [CrossRef]
  21. Mossad, O.; Nent, E.; Woltemate, S.; Folschweiller, S.; Buescher, J.M.; Schnepf, D.; Erny, D.; Staeheli, P.; Bartos, M.; Szalay, A.; et al. Microbiota-Dependent Increase in δ-Valerobetaine Alters Neuronal Function and Is Responsible for Age-Related Cognitive Decline. Nat. Aging 2021, 1, 1127–1136. [Google Scholar] [CrossRef]
  22. Sylvia, K.E.; Demas, G.E. A Gut Feeling: Microbiome-Brain-Immune Interactions Modulate Social and Affective Behaviors. Horm. Behav. 2018, 99, 41–49. [Google Scholar] [CrossRef]
  23. O’Toole, P.W.; Claesson, M.J. Gut Microbiota: Changes throughout the Lifespan from Infancy to Elderly. Int. Dairy J. 2010, 20, 281–291. [Google Scholar] [CrossRef]
  24. Jawhara, S. Healthy Diet and Lifestyle Improve the Gut Microbiota and Help Combat Fungal Infection. Microorganisms 2023, 11, 1556. [Google Scholar] [CrossRef]
  25. Ashaolu, T.J. Soy Bioactive Peptides and the Gut Microbiota Modulation. Appl. Microbiol. Biotechnol. 2020, 104, 9009–9017. [Google Scholar] [CrossRef]
  26. Tsafack, P.B.; Li, C.; Tsopmo, A. Food Peptides, Gut Microbiota Modulation, and Antihypertensive Effects. Molecules 2022, 27, 8806. [Google Scholar] [CrossRef]
  27. Fu, Y.; Wang, Y.; Gao, H.; Li, D.; Jiang, R.; Ge, L.; Tong, C.; Xu, K. Associations among Dietary Omega-3 Polyunsaturated Fatty Acids, the Gut Microbiota, and Intestinal Immunity. Mediat. Inflamm. 2021, 2021, 8879227. [Google Scholar] [CrossRef]
  28. Szklany, K.; Engen, P.A.; Naqib, A.; Green, S.J.; Keshavarzian, A.; Lopez Rincon, A.; Siebrand, C.J.; Diks, M.A.P.; van de Kaa, M.; Garssen, J.; et al. Dietary Supplementation throughout Life with Non-Digestible Oligosaccharides and/or n-3 Poly-Unsaturated Fatty Acids in Healthy Mice Modulates the Gut-Immune System-Brain Axis. Nutrients 2021, 14, 173. [Google Scholar] [CrossRef]
  29. Portela, N.D.; Galván, C.; Sanmarco, L.M.; Bergero, G.; Aoki, M.P.; Cano, R.C.; Pesoa, S.A. Omega-3-Supplemented Fat Diet Drives Immune Metabolic Response in Visceral Adipose Tissue by Modulating Gut Microbiota in a Mouse Model of Obesity. Nutrients 2023, 15, 1404. [Google Scholar] [CrossRef]
  30. Li, J.; Pora, B.L.R.; Dong, K.; Hasjim, J. Health Benefits of Docosahexaenoic Acid and Its Bioavailability: A Review. Food Sci. Nutr. 2021, 9, 5229–5243. [Google Scholar] [CrossRef]
  31. Chataigner, M.; Mortessagne, P.; Lucas, C.; Pallet, V.; Layé, S.; Mehaignerie, A.; Bouvret, E.; Dinel, A.L.; Joffre, C. Dietary Fish Hydrolysate Supplementation Containing N-3 LC-PUFAs and Peptides Prevents Short-Term Memory and Stress Response Deficits in Aged Mice. Brain. Behav. Immun. 2020, 91, 716–730. [Google Scholar] [CrossRef]
  32. Dellu, F.; Mayo, W.; Cherkaoui, J.; Le Moal, M.; Simon, H. A Two-Trial Memory Task with Automated Recording: Study in Young and Aged Rats. Brain Res. 1992, 588, 132–139. [Google Scholar] [CrossRef]
  33. Bensalem, J.; Servant, L.; Alfos, S.; Gaudout, D.; Layé, S.; Pallet, V.; Lafenetre, P. Dietary Polyphenol Supplementation Prevents Alterations of Spatial Navigation in Middle-Aged Mice. Front. Behav. Neurosci. 2016, 10, 9. [Google Scholar] [CrossRef]
  34. Morris, R. Developments of a Water-Maze Procedure for Studying Spatial Learning in the Rat. J. Neurosci. Methods 1984, 11, 47–60. [Google Scholar] [CrossRef]
  35. Boyer, F.; Jaouen, F.; Ibrahim, E.C.; Gascon, E. Deficits in Social Behavior Precede Cognitive Decline in Middle-Aged Mice. Front. Behav. Neurosci. 2019, 13, 55. [Google Scholar] [CrossRef]
  36. Dinel, A.-L.; André, C.; Aubert, A.; Ferreira, G.; Layé, S.; Castanon, N. Lipopolysaccharide-Induced Brain Activation of the Indoleamine 2,3-Dioxygenase and Depressive-like Behavior Are Impaired in a Mouse Model of Metabolic Syndrome. Psychoneuroendocrinology 2014, 40, 48–59. [Google Scholar] [CrossRef]
  37. Gohl, D.M.; Vangay, P.; Garbe, J.; MacLean, A.; Hauge, A.; Becker, A.; Gould, T.J.; Clayton, J.B.; Johnson, T.J.; Hunter, R.; et al. Systematic Improvement of Amplicon Marker Gene Methods for Increased Accuracy in Microbiome Studies. Nat. Biotechnol. 2016, 34, 942–949. [Google Scholar] [CrossRef]
  38. Bolyen, E.; Rideout, J.R.; Dillon, M.R.; Bokulich, N.A.; Abnet, C.C.; Al-Ghalith, G.A.; Alexander, H.; Alm, E.J.; Arumugam, M.; Asnicar, F.; et al. Reproducible, Interactive, Scalable and Extensible Microbiome Data Science Using QIIME 2. Nat. Biotechnol. 2019, 37, 852–857. [Google Scholar] [CrossRef]
  39. Machanda, Z.P.; Rosati, A.G. Shifting Sociality during Primate Ageing. Philos. Trans. R. Soc. Lond. B Biol. Sci. 2020, 375, 20190620. [Google Scholar] [CrossRef]
  40. Wrzus, C.; Hänel, M.; Wagner, J.; Neyer, F.J. Social Network Changes and Life Events across the Life Span: A Meta-Analysis. Psychol. Bull. 2013, 139, 53–80. [Google Scholar] [CrossRef]
  41. Shoji, H.; Miyakawa, T. Age-Related Behavioral Changes from Young to Old Age in Male Mice of a C57BL/6J Strain Maintained under a Genetic Stability Program. Neuropsychopharmacol. Rep. 2019, 39, 100–118. [Google Scholar] [CrossRef]
  42. Scott, K.A.; Ida, M.; Peterson, V.L.; Prenderville, J.A.; Moloney, G.M.; Izumo, T.; Murphy, K.; Murphy, A.; Ross, R.P.; Stanton, C.; et al. Revisiting Metchnikoff: Age-Related Alterations in Microbiota-Gut-Brain Axis in the Mouse. Brain. Behav. Immun. 2017, 65, 20–32. [Google Scholar] [CrossRef]
  43. Claesson, M.J.; Cusack, S.; O’Sullivan, O.; Greene-Diniz, R.; de Weerd, H.; Flannery, E.; Marchesi, J.R.; Falush, D.; Dinan, T.; Fitzgerald, G.; et al. Composition, Variability, and Temporal Stability of the Intestinal Microbiota of the Elderly. Proc. Natl. Acad. Sci. USA 2011, 108 (Suppl. S1), 4586–4591. [Google Scholar] [CrossRef]
  44. Claesson, M.J.; Jeffery, I.B.; Conde, S.; Power, S.E.; O’Connor, E.M.; Cusack, S.; Harris, H.M.B.; Coakley, M.; Lakshminarayanan, B.; O’Sullivan, O.; et al. Gut Microbiota Composition Correlates with Diet and Health in the Elderly. Nature 2012, 488, 178–184. [Google Scholar] [CrossRef]
  45. Ghosh, T.S.; Shanahan, F.; O’Toole, P.W. The Gut Microbiome as a Modulator of Healthy Ageing. Nat. Rev. Gastroenterol. Hepatol. 2022, 19, 565–584. [Google Scholar] [CrossRef]
  46. Wilmanski, T.; Diener, C.; Rappaport, N.; Patwardhan, S.; Wiedrick, J.; Lapidus, J.; Earls, J.C.; Zimmer, A.; Glusman, G.; Robinson, M.; et al. Gut Microbiome Pattern Reflects Healthy Ageing and Predicts Survival in Humans. Nat. Metab. 2021, 3, 274–286. [Google Scholar] [CrossRef]
  47. Boehme, M.; Guzzetta, K.E.; Wasén, C.; Cox, L.M. The Gut Microbiota Is an Emerging Target for Improving Brain Health during Ageing. Gut Microbiome 2023, 4, E2. [Google Scholar] [CrossRef]
  48. Wang, Z.; Ying, X.; Gao, P.; Wang, C.; Wang, Y.; Yu, X.; Chen, J.; Wang, B.; Luo, H. Anti-Inflammatory Activity of a Peptide from Skipjack (Katsuwonus Pelamis). Mar. Drugs 2019, 17, 582. [Google Scholar] [CrossRef]
  49. Zhang, Y.; Lu, S.; Yang, Y.; Wang, Z.; Wang, B.; Zhang, B.; Yu, J.; Lu, W.; Pan, M.; Zhao, J.; et al. The Diversity of Gut Microbiota in Type 2 Diabetes with or without Cognitive Impairment. Aging Clin. Exp. Res. 2021, 33, 589–601. [Google Scholar] [CrossRef]
  50. Manderino, L.; Carroll, I.; Azcarate-Peril, M.A.; Rochette, A.; Heinberg, L.; Peat, C.; Steffen, K.; Mitchell, J.; Gunstad, J. Preliminary Evidence for an Association Between the Composition of the Gut Microbiome and Cognitive Function in Neurologically Healthy Older Adults. J. Int. Neuropsychol. Soc. JINS 2017, 23, 700–705. [Google Scholar] [CrossRef]
  51. Wang, J.; Li, W.; Wang, C.; Wang, L.; He, T.; Hu, H.; Song, J.; Cui, C.; Qiao, J.; Qing, L.; et al. Enterotype Bacteroides Is Associated with a High Risk in Patients with Diabetes: A Pilot Study. J. Diabetes Res. 2020, 2020, 6047145. [Google Scholar] [CrossRef]
  52. Higarza, S.G.; Arboleya, S.; Arias, J.L.; Gueimonde, M.; Arias, N. Akkermansia Muciniphila and Environmental Enrichment Reverse Cognitive Impairment Associated with High-Fat High-Cholesterol Consumption in Rats. Gut Microbes 2021, 13, 1880240. [Google Scholar] [CrossRef]
  53. Anderson, J.R.; Carroll, I.; Azcarate-Peril, M.A.; Rochette, A.D.; Heinberg, L.J.; Peat, C.; Steffen, K.; Manderino, L.M.; Mitchell, J.; Gunstad, J. A Preliminary Examination of Gut Microbiota, Sleep, and Cognitive Flexibility in Healthy Older Adults. Sleep Med. 2017, 38, 104–107. [Google Scholar] [CrossRef]
  54. Verdi, S.; Jackson, M.A.; Beaumont, M.; Bowyer, R.C.E.; Bell, J.T.; Spector, T.D.; Steves, C.J. An Investigation into Physical Frailty as a Link Between the Gut Microbiome and Cognitive Health. Front. Aging Neurosci. 2018, 10, 398. [Google Scholar] [CrossRef]
  55. Rizzatti, G.; Lopetuso, L.R.; Gibiino, G.; Binda, C.; Gasbarrini, A. Proteobacteria: A Common Factor in Human Diseases. BioMed Res. Int. 2017, 2017, 9351507. [Google Scholar] [CrossRef]
  56. Yu, S.; Wang, L.; Jing, X.; Wang, Y.; An, C. Features of Gut Microbiota and Short-Chain Fatty Acids in Patients with First-Episode Depression and Their Relationship with the Clinical Symptoms. Front. Psychol. 2023, 14, 1088268. [Google Scholar] [CrossRef]
  57. Zhang, J.; Zhang, Y.; Yuan, Y.; Liu, L.; Zhao, Y.; Wang, X. Gut Microbiota Alteration Is Associated With Cognitive Deficits in Genetically Diabetic (Db/Db) Mice During Aging. Front. Aging Neurosci. 2022, 13, 815562. [Google Scholar] [CrossRef]
  58. Li, T.; Lin, L.; Li, C.; Zheng, J.; Chen, B.; Shen, Y.; Ren, D. Amelioration of Walnut-Derived Novel Peptides against D-Galactose-Induced Cognitive Impairment by Modulating the Gut Microbiota Composition. Food Funct. 2023, 14, 4228–4241. [Google Scholar] [CrossRef]
  59. Bondar, N.P.; Lepeshko, A.A.; Reshetnikov, V.V. Effects of Early-Life Stress on Social and Anxiety-Like Behaviors in Adult Mice: Sex-Specific Effects. Behav. Neurol. 2018, 2018, 1538931. [Google Scholar] [CrossRef]
  60. Jacobson, L. Hypothalamic-Pituitary-Adrenocortical Axis: Neuropsychiatric Aspects. Compr. Physiol. 2014, 4, 715–738. [Google Scholar] [CrossRef]
  61. Du, X.; Pang, T.Y. Is Dysregulation of the HPA-Axis a Core Pathophysiology Mediating Co-Morbid Depression in Neurodegenerative Diseases? Front. Psychiatry 2015, 6, 32. [Google Scholar] [CrossRef]
  62. Sriram, K.; Rodriguez-Fernandez, M.; Doyle, F.J. Modeling Cortisol Dynamics in the Neuro-Endocrine Axis Distinguishes Normal, Depression, and Post-Traumatic Stress Disorder (PTSD) in Humans. PLoS Comput. Biol. 2012, 8, e1002379. [Google Scholar] [CrossRef]
  63. Foster, J.A.; Rinaman, L.; Cryan, J.F. Stress & the Gut-Brain Axis: Regulation by the Microbiome. Neurobiol. Stress 2017, 7, 124–136. [Google Scholar] [CrossRef]
  64. Mackos, A.R.; Maltz, R.; Bailey, M.T. The Role of the Commensal Microbiota in Adaptive and Maladaptive Stressor-Induced Immunomodulation. Horm. Behav. 2017, 88, 70–78. [Google Scholar] [CrossRef]
  65. Sudo, N.; Chida, Y.; Aiba, Y.; Sonoda, J.; Oyama, N.; Yu, X.-N.; Kubo, C.; Koga, Y. Postnatal Microbial Colonization Programs the Hypothalamic-Pituitary-Adrenal System for Stress Response in Mice. J. Physiol. 2004, 558, 263–275. [Google Scholar] [CrossRef]
  66. Tronche, C.; Piérard, C.; Coutan, M.; Chauveau, F.; Liscia, P.; Béracochéa, D. Increased Stress-Induced Intra-Hippocampus Corticosterone Rise Associated with Memory Impairments in Middle-Aged Mice. Neurobiol. Learn. Mem. 2010, 93, 343–351. [Google Scholar] [CrossRef]
  67. Knight, B.G.; Durbin, K. Aging and the Effects of Emotion on Cognition: Implications for Psychological Interventions for Depression and Anxiety. PsyCh J. 2015, 4, 11–19. [Google Scholar] [CrossRef]
  68. Puigoriol-Illamola, D.; Griñán-Ferré, C.; Vasilopoulou, F.; Leiva, R.; Vázquez, S.; Pallàs, M. 11β-HSD1 Inhibition by RL-118 Promotes Autophagy and Correlates with Reduced Oxidative Stress and Inflammation, Enhancing Cognitive Performance in SAMP8 Mouse Model. Mol. Neurobiol. 2018, 55, 8904–8915. [Google Scholar] [CrossRef]
  69. Rijo-Ferreira, F.; Takahashi, J.S. Genomics of Circadian Rhythms in Health and Disease. Genome Med. 2019, 11, 82. [Google Scholar] [CrossRef]
  70. Versace, S.; Pellitteri, G.; Sperotto, R.; Tartaglia, S.; Da Porto, A.; Catena, C.; Gigli, G.L.; Cavarape, A.; Valente, M. A State-of-Art Review of the Vicious Circle of Sleep Disorders, Diabetes and Neurodegeneration Involving Metabolism and Microbiota Alterations. Int. J. Mol. Sci. 2023, 24, 10615. [Google Scholar] [CrossRef]
  71. Leone, V.; Gibbons, S.M.; Martinez, K.; Hutchison, A.L.; Huang, E.Y.; Cham, C.M.; Pierre, J.F.; Heneghan, A.F.; Nadimpalli, A.; Hubert, N.; et al. Effects of Diurnal Variation of Gut Microbes and High-Fat Feeding on Host Circadian Clock Function and Metabolism. Cell Host Microbe 2015, 17, 681–689. [Google Scholar] [CrossRef]
  72. Froy, O. The Circadian Clock and Metabolism. Clin. Sci. Lond. Engl. 1979 2011, 120, 65–72. [Google Scholar] [CrossRef]
  73. Duncan, M.J.; Prochot, J.R.; Cook, D.H.; Tyler Smith, J.; Franklin, K.M. Influence of Aging on Bmal1 and Per2 Expression in Extra-SCN Oscillators in Hamster Brain. Brain Res. 2013, 1491, 44–53. [Google Scholar] [CrossRef]
  74. Price, K.H.; Dziema, H.; Aten, S.; Loeser, J.; Norona, F.E.; Hoyt, K.; Obrietan, K. Modulation of Learning and Memory by the Targeted Deletion of the Circadian Clock Gene Bmal1 in Forebrain Circuits. Behav. Brain Res. 2016, 308, 222–235. [Google Scholar] [CrossRef]
  75. Kwapis, J.L.; Alaghband, Y.; Kramár, E.A.; López, A.J.; Vogel Ciernia, A.; White, A.O.; Shu, G.; Rhee, D.; Michael, C.M.; Montellier, E.; et al. Epigenetic Regulation of the Circadian Gene Per1 Contributes to Age-Related Changes in Hippocampal Memory. Nat. Commun. 2018, 9, 3323. [Google Scholar] [CrossRef]
  76. Al-Rawashdeh, S.Y.; Lennie, T.A.; Chung, M.L. The Association of Sleep Disturbances with Quality of Life in Heart Failure Patient-Caregiver Dyads. West. J. Nurs. Res. 2017, 39, 492–506. [Google Scholar] [CrossRef]
  77. Borbolis, F.; Mytilinaiou, E.; Palikaras, K. The Crosstalk between Microbiome and Mitochondrial Homeostasis in Neurodegeneration. Cells 2023, 12, 429. [Google Scholar] [CrossRef]
  78. Fehér, J.; Élő, Á.; István, L.; Nagy, Z.Z.; Radák, Z.; Scuderi, G.; Artico, M.; Kovács, I. Microbiota Mitochondria Disorders as Hubs for Early Age-Related Macular Degeneration. GeroScience 2022, 44, 2623–2653. [Google Scholar] [CrossRef]
  79. Navarro, A.; Gomez, C.; López-Cepero, J.M.; Boveris, A. Beneficial Effects of Moderate Exercise on Mice Aging: Survival, Behavior, Oxidative Stress, and Mitochondrial Electron Transfer. Am. J. Physiol. Regul. Integr. Comp. Physiol. 2004, 286, R505–R511. [Google Scholar] [CrossRef]
  80. Navarro, A.; Gómez, C.; Sánchez-Pino, M.-J.; González, H.; Bández, M.J.; Boveris, A.D.; Boveris, A. Vitamin E at High Doses Improves Survival, Neurological Performance, and Brain Mitochondrial Function in Aging Male Mice. Am. J. Physiol. Regul. Integr. Comp. Physiol. 2005, 289, R1392–R1399. [Google Scholar] [CrossRef]
  81. Papa, S.; De Rasmo, D. Complex I Deficiencies in Neurological Disorders. Trends Mol. Med. 2013, 19, 61–69. [Google Scholar] [CrossRef]
  82. Corral-Debrinski, M.; Horton, T.; Lott, M.T.; Shoffner, J.M.; Beal, M.F.; Wallace, D.C. Mitochondrial DNA Deletions in Human Brain: Regional Variability and Increase with Advanced Age. Nat. Genet. 1992, 2, 324–329. [Google Scholar] [CrossRef]
  83. Lin, M.T.; Simon, D.K.; Ahn, C.H.; Kim, L.M.; Beal, M.F. High Aggregate Burden of Somatic MtDNA Point Mutations in Aging and Alzheimer’s Disease Brain. Hum. Mol. Genet. 2002, 11, 133–145. [Google Scholar] [CrossRef]
  84. Pusceddu, M.M.; El Aidy, S.; Crispie, F.; O’Sullivan, O.; Cotter, P.; Stanton, C.; Kelly, P.; Cryan, J.F.; Dinan, T.G. N-3 Polyunsaturated Fatty Acids (PUFAs) Reverse the Impact of Early-Life Stress on the Gut Microbiota. PLoS ONE 2015, 10, e0139721. [Google Scholar] [CrossRef]
  85. Roussel, C.; Anunciação Braga Guebara, S.; Plante, P.-L.; Desjardins, Y.; Di Marzo, V.; Silvestri, C. Short-Term Supplementation with ω-3 Polyunsaturated Fatty Acids Modulates Primarily Mucolytic Species from the Gut Luminal Mucin Niche in a Human Fermentation System. Gut Microbes 2022, 14, 2120344. [Google Scholar] [CrossRef]
  86. Costantini, L.; Molinari, R.; Farinon, B.; Merendino, N. Impact of Omega-3 Fatty Acids on the Gut Microbiota. Int. J. Mol. Sci. 2017, 18, 2645. [Google Scholar] [CrossRef]
  87. Bernet, F.; Montel, V.; Noël, B.; Dupouy, J.P. Diazepam-like Effects of a Fish Protein Hydrolysate (Gabolysat PC60) on Stress Responsiveness of the Rat Pituitary-Adrenal System and Sympathoadrenal Activity. Psychopharmacology 2000, 149, 34–40. [Google Scholar] [CrossRef]
  88. Kuijer, E.J.; Steenbergen, L. The Microbiota-Gut-Brain Axis in Hippocampus-Dependent Learning and Memory: Current State and Future Challenges. Neurosci. Biobehav. Rev. 2023, 152, 105296. [Google Scholar] [CrossRef]
  89. Zielinski, M.R.; Gibbons, A.J. Neuroinflammation, Sleep, and Circadian Rhythms. Front. Cell. Infect. Microbiol. 2022, 12, 853096. [Google Scholar] [CrossRef]
Figure 1. Experimental design. Adult (5 months) and aged (15 months) mice were fed the control diet or the hydrolysate-enriched diets for 8 weeks. Behavioral tests were performed during the next 3 weeks. Total supplementation duration was 11 weeks. DHA: docosahexaenoic acid; EPA: eicosapentaenoic acid; ITI: inter-trial interval; QE: quadrant east, QN: quadrant north; QS: quadrant south; QW: quadrant west.
Foods 12 04199 g001
Figure 2. Categorization scheme of navigation paths. Representative navigation path patterns of “non-spatial” (in blue) and “spatial” (in yellow) strategies used to locate the platform.
Foods 12 04199 g002
Figure 3. Both supplementations promote social novelty preference in aged mice. (A) Time spent around the empty cage and the cage with stranger 1. *** p < 0.001 Familiar vs. Stranger. (B) Time spent around the cage containing stranger 1 and the cage containing stranger 2. * p < 0.05, *** p < 0.001 Stranger 1 vs. Stranger 2. n = 11–12 per group.
Foods 12 04199 g003
Figure 4. Both fish hydrolysate supplementations prevent short-term and long-term spatial memory deficits in aged mice. (A) Recognition index of the new arm after a 1 h ITI in adult and aged mice fed the control diet or the supplementations. The dotted line corresponds to chance level (33%) (* p < 0.05, ** p < 0.01 vs. chance level by one sample t-test). (B) Swim speed during learning (age effect: $$$ p < 0.001 by 2-way ANOVA with repeated measures). (C) Distance covered to reach the platform over the 4 consecutive days of spatial learning (day effect $ p < 0.05 by 2- way ANOVA with repeated measures). (D) Distance travelled during the cued learning. (E) Percentage of distance travelled in quadrants during the probe test. The dotted line represents chance level (25%) (* p < 0.05, ** p < 0.01 vs. chance level by one sample t-test). n = 11–12 per group.
Foods 12 04199 g004
Figure 5. Fish hydrolysate supplementation promotes an earlier use of spatial strategies during spatial learning. (A) Navigational strategies used during spatial learning for each group. (B) Percentage of spatial strategies used by each group for each day of spatial learning. $ p < 0.05, $$ p < 0.01 Adult Control vs. Aged Control; ## p < 0.01 Adult Control vs. Aged Hydrolysate; * p < 0.05 Aged Hydrolysate vs. Aged Control, n = 11–13 per group. NS: non-spatial strategies; S: spatial strategies.
Foods 12 04199 g005
Figure 6. Both supplementations decrease basal stress and modulate stress response consecutive to restraint stress in aged mice. (A) Plasmatic corticosterone levels at T0, T30, T60 and T90. (B) Area under the curve of corticosterone. $ p < 0.05, Adult Control vs. Aged Control; # p < 0.05, ## p < 0.01, ### p < 0.001 Adult Hydrolysate vs. Aged Control; * p < 0.05, ** p < 0.01, *** p < 0.001 Aged Hydrolysate with EPA/DHA vs. Aged Control. n = 11–12 per group.
Foods 12 04199 g006
Figure 7. Fish hydrolysate supplementation decreases the levels of plasmatic kynurenine in aged mice. (A) Plasmatic levels of Kynurenine (B) Plasmatic levels of Tryptophan (C) Kynurenine/Tryptophan ratio. * p < 0.05, ** p < 0.01 vs. Aged Control; # p < 0.05 vs. Adult Control; $ p < 0.05 vs. Aged Hydrolysate. n = 11–12 per group.
Foods 12 04199 g007
Figure 8. Both supplementations modulate gene expression changes associated with aging. (A) Mitochondrial respiratory Complex I. (B) Circadian clock. (C) Microglial neurodegenerative phenotype. (D) Antioxidant defenses. (E) beta-oxidation. (F) Neuroprotection. (G) Heat shock responses. (H) Oxylipins pathway. * p < 0.05, ** p < 0.01 vs. Aged Control; # p < 0.05, ## p < 0.01, ### p < 0.001 vs. Adult Control; $ p < 0.05 vs. Aged Hydrolysate. n = 11–12 per group.
Foods 12 04199 g008
Figure 9. Heatmap analysis combined with hierarchical clustering analysis. Each row represents one gene and each column represents one group. Yellow indicates higher expression and blue indicates lower expression. The global gene expression profiles were compared after the end of 11-week supplementation, while aged control group were used for the baseline gene expression.
Foods 12 04199 g009
Figure 10. Microbial diversity analysis. (A) NMDS (non-metric multidimensional scaling). The closer the distance, the higher is the similarity. (B) Chao1 index. (C) Shannon index. * p < 0.05 vs. Aged Control; # p < 0.05 vs. Adult Control. n = 11–12 per group.
Foods 12 04199 g010
Figure 11. Both fish hydrolysate supplementations prevent microbiota impairments in aged mice. (A) Relative abundance of gut microbiota at phylum level. Relative abundance of the phyla (B) Verrucomicrobia. (C) Tenericutes. (D) Deferribacteres. (E) Actinobacteria. (F) Proteobacteria. (G) Patescibacteria. Relative abundance of gut microbiota at genus level. (H) Parasutterella, Helicobacter, Odoribacter and Erysipelatoclostridium. (I) Desulfovibrio, Alloprevotella, Dubosiella and Enterorhabdus (J) Muribaculum, Bifidobacterium, Lactobacillus and Faecalibaculum. * p < 0.05, ** p < 0.01, *** p < 0.001 vs. Aged Control; # p < 0.05, ## p < 0.01, ### p < 0.001 vs. Adult Control; $ p < 0.05, $$$ p < 0.001 vs. Aged Hydrolysate. n = 11–12 per group.
Foods 12 04199 g011
Table 1. Composition of the control and hydrolysate-enriched diets.
ComponentsPercent (%)
Control DietHydrolysate-Enriched DietHydrolysate-Enriched Diet with EPA/DHA
Hydrochloric casein181818
Corn starch45.945.6945.69
Sucrose242424
Cellulose222
Peanut Oil554.91
Mineral Mix444
Vitamin Mix111
+DL methionine0.10.10.1
+Vitamin A 5 UI/g5 UI/g5 UI/g5 UI/g
Hydrolysate 00.210.21
EPA/DHA (4:1)000.09
Table 2. Genes significantly modulated by age and/or supplementations in hippocampus.
SymbolNameSequence (5′-3′)Pathway
ND1-FNADH dehydrogenase 1, mitochondrialGAGTTCCCCTACCAATACCACACCMitochondrial respiratory chain
ND1-RCGGCTCGTAAAGCTCCGAATAG
ND2-FNADH dehydrogenase 2, mitochondrialTTCATAGGGGCATGAGGAGGAC
ND2-RGTGAGGGATGGGTTGTAAGGAAG
ND5-FNADH dehydrogenase 5, mitochondrialGGAAGCATCTTTGCAGGATTTG
ND5-RCATGGTATTGTGAGGACTGGAATG
ND6-FNADH dehydrogenase 6, mitochondrialTGGTTTGGGAGATTGGTTGATG
ND6-RTATTGCCGCTACCCCAATCC
Bmal1-FBasic helix-loop-helix ARNT like 1CGCTACGAAGTCGATGGTTCAGCircadian clock
Bmal1-RTGTTAGCTGCGGGAAGGTTG
Per1-FPeriod circadian clock 1TGTCCTGCTGCGTTGCAAAC
Per1-RTTGAGACCTGAACCTGCAGAGG
SOD1-FSuperoxide dismutase 1TTGGCCGTACAATGGTGGTCAntioxidant defenses
SOD1-RGCAATCCCAATCACTCCACAG
APOE-FApolipoprotein ETGCGAAGATGAAGGCTCTGTGMicroglial neurodegenerative phenotype
APOE-RGGTTGGTTGCTTTGCCACTC
mTrem2-FTriggering receptor expressed on myeloid cells 2TGCTGGCAAAGGAAAGGTGC
mTrem2-RACATGACACCCTCAAGGACTGG
mCd68-FCluster of Differentiation 68TTCGGGCCATGTTTCTCTTG
mCd68-RATTGTCGTCTGCGGGTGATG
mClec7a-FC-Type Lectin Domain Containing 7ATGGGTGCCCTAGCATTTTGG
mClec7a-RTGATTCTGTGGGCTTGTGGTTC
mLgals3-FGalectin 3TATCCTGCTGCTGGCCCTTATG
mLgals3-RTGCGTTGGGTTTCACTGTGC
mCcl2-FC-C Motif Chemokine Ligand 2ACCAGCCAACTCTCACTGAAGC
mCcl2-RTGGGGCGTTAACTGCATCTG
Acox1-FPeroxisomal acyl-CoA oxidaseTCACTCGAAGCCAGCGTTACb-oxidation
Acox1-RTTGAGGCCAACAGGTTCCAC
BDNFIV-FBrain Derived Neurotrophic FactorCAGAGCAGCTGCCTTGATGTTNeuroprotection
BDNFIV-RGCCTTGTCCGTGGACGTTTA
HSP90-FHeat shock protein 90TTGGTGGACACAGGCATTGGAging
HSP90-RAATCCGACACCAAACTGCCC
HSF1-FHeat shock factor 1TGGCCATGAAGCACGAGAAC
HSF1-RTTTGCTGCTGGGCATGCTTC
Cmklr1-FChemerin Chemokine-Like Receptor 1AGTCACGCGCAGTAACAGACSynthesis of oxylipins
Cmklr1-RTCGTTGTAAGCGTCGTACTCC
ALXFPR2-FFormyl peptide receptor 2CATGAAGTCTGTGATAAGGGATGG
ALXFPR2-RCATAAGGTAAGGAAGGCAGAAGTG
12LOX-F12-lipoxygenaseGCTGTTGCCACCATGAGATG
12LOX-RAACGGATGTGTGGAACGAGG
Ptges-FProstaglandin E SynthaseATCAAGATGTACGCGGTGGC
Ptges-RATCCTCGGGGTTGGCAAAAG
Ptgs1-FProstaglandin-Endoperoxide Synthase 1ATCACCTGCGGCTCTTCAAG
Ptgs1-RATCAACACGGACGCCTGTTC
Disclaimer/Publisher’s Note: The statements, opinions and data contained in all publications are solely those of the individual author(s) and contributor(s) and not of MDPI and/or the editor(s). MDPI and/or the editor(s) disclaim responsibility for any injury to people or property resulting from any ideas, methods, instructions or products referred to in the content.

