1. Introduction
Diabetes mellitus (DM) is a chronic health disease. It is generally characterized by hyperglycemia and abnormal carbohydrate metabolism. There are two main types of DM, including type 1 diabetes and type 2 diabetes (T2DM). T2DM primarily occurs and develops due to β-cells in pancreatic cell abnormality and insulin resistance, with these leading to hyperglycemia (high sugar in blood) [
1]. High blood glucose levels have been found to play a crucial role in developing complications of T2DM [
2]. Therefore, to slow down T2DM progression, diabetics need their blood sugar to be maintained at an optimistic level. From other views, high body fat in obesity and T2DM are closely related. Although high body fat is known to be an important factor determining the increase in the risk of T2DM, the exact mechanism of their relationship is not yet clear. One of the therapeutic routes for controlling blood glucose levels involves the suppression or inhibition of α-amylase, dipeptidyl-peptidase 4 (DPP-4), and α-glucosidase activities [
3]. When food intake and physical exercise are not enough to control blood sugar, some people with T2DM turn to use synthetic drugs, for example, metformin, gliclazide, glimepiride, acarbose, and miglitol. However, metformin has common side effects, including feeling or being sick and diarrhea. In terms of other drugs, acarbose and miglitol exhibit excellent α-amylase and α-glucosidase inhibitory activities. However, they may result in abdominal distention, flatulence, vomiting, and diarrhea [
4]. To solve these issues, more and more research evidence shows that natural foods from plants can also help control blood sugar and the fat content in cells.
Coffee is a popular beverage that is enjoyed by many people around the world. It is made by brewing the roasted seeds of the Coffea plant, which are often referred to as “coffee beans”. There are a number of potential health benefits associated with drinking coffee. For example, many findings also suggest that coffee may help to reduce the risk of several serious health conditions, including Parkinson’s disease, type 2 diabetes, and certain types of cancer [
5,
6,
7]. In addition, coffee is also a good source of antioxidants, which can help to protect the body against the damaging effects of free radicals [
8,
9]. Polyphenols, quercetin, and CGA are among the most promising phytochemicals found in coffee beans, offering potential health benefits, such as combating obesity and DM [
10,
11]. In Thailand, the coffee industry has a long history and plays an important role in the country’s economy. The main coffee-growing regions in Thailand are located in the north of the country, with the main varieties being Arabica and Robusta [
12]. Coffee beans can vary significantly in terms of their flavor, aroma, and other characteristics. The geographical origin of the beans can be an important factor in these differences [
13]. Coffee is grown in many different countries around the world, and the specific conditions in each region can have a big impact on the flavor and quality of the beans. For example, coffee grown at high altitudes tends to be more flavorful and aromatic than coffee grown at lower altitudes [
13]. The type of soil, the climate, and other environmental factors can also play a role in the characteristics of the coffee beans [
14]. In addition, the processing method used and the roast level of the beans can impact the flavor and quality of the coffee [
15,
16]. As a result, it is common for coffee to be labeled by its origin, and many coffee lovers are interested in trying different processed types of coffee from different regions to compare the flavors and characteristics.
Coffee bean harvesting is the process of collecting the ripe coffee cherries from the coffee plant. There are three main methods of coffee bean harvesting: natural (dry), wash (wet), and honey (semidry) processing. First, the natural process is the cheapest, oldest, and simplest processing method. This processing uses only natural sunlight or a mechanical drier to dry whole coffee beans so that they fully absorb and maintain most of their various flavors and substances [
17]. Therefore, this postharvesting technique makes different characteristics from each cultivation area. Natural processed coffee provides a fruity flavor and sweeter seed. This process takes time because the entire coffee cherry takes some time to dry compared to the drying of coffee beans in the washed process. The coffee beans obtained by dry processing have a heavy body, softness and sweetness, and complex characteristics. Second, the washed process is the most popular type of postprocessing. It is a water-based process. Water is needed in large quantities (40 L/kg of dry coffee weight) to perform the washed process [
18]. This postprocessing was developed in an area where coffee beans cannot be dried in the sun like the natural process. During the process, green coffee beans show several enzymatic and metabolic activities [
19]. These biochemical changes are mainly caused by the germination process, and the stress metabolism causes significant differences in the chemical composition of green coffee beans and determines the quality of the coffee beans [
19]. By using water in processing, it has a clean taste with acidity and sourness in the style of coffee. Third, honey processing is an intermediate process between natural and wash processing. This processing has less body compared to naturally processed coffee beans. The quality of honey-processed coffee is bright and clean and is somewhat similar to wash-processed coffee beans. In addition to the aforementioned processes, there are many different, detailed methods in the world of coffee production due to each of the cultivation areas being slightly different in terms of geography and climate. For all the above-mentioned, coffee beans undergo various postharvest steps, and many metabolites that are related to the quality of coffee are affected and changed [
16,
20,
21]. Different processed coffee beans have a significant impact on the quality of the resulting coffee. Both the natural and washed methods of postharvest processing that are chosen can influence the flavor, aroma, body, and acidity of coffee. The choice of method depends on the desired metabolite composition. Coffee extracts can provide a rich source of information through metabolomics studies. Different methods of coffee processing can result in different levels of biologically active compounds in the final product. Metabolomics can be used to identify these differences and evaluate the potential health effects of different coffee processing methods. This could provide insight into the factors that contribute to the flavor and other characteristics of the coffee of the different processing techniques. Our research aims to identify the specific types and quantities of chemicals found in coffee following various postharvest processing methods, including natural and washed, within a designated coffee-growing region. Additionally, we are investigating their potential antidiabetic properties. In essence, this research seeks to advance our scientific comprehension of coffee chemistry, thereby shedding light on its multifaceted implications for sensory perception and health outcomes.
2. Materials and Methods
2.1. Sample Collection and Preparation
Arabica coffee beans were harvested from specific GI (Moo.6, Pa-Rai, Tepsadej, Doisaket, Chiang-Mai, Thailand) with geological coordination (18.920486, 99.356228), which is a coffee farmer’s field. The coffee beans were harvested between 13th and 27th February 2021. Coffee processing converts freshly collected coffee cherries into highly desirable green coffee beans ready for roasting. The coffee’s taste and qualities depend on the processing method. The intricate process begins with skilled harvesters selecting fully developed cherries with a brilliant red or deep purple color, indicating their optimal ripeness. Depulping then carefully removes the cherry’s exocarp or outer peel. Mechanical depulping or hand-cranking can remove coffee beans from cherries. They reveal the beans under mucilage, a sticky saccharine substance. Washing coffee involves carefully fermenting mucilage-coated beans in water-filled tanks or bins. This mechanism aids in the breakdown and removal of the mucilage layer. After fermentation, the beans are washed thoroughly to eliminate any leftover mucilage. After washing or depulping, the beans are carefully placed in thin layers on patios, elevated beds, or drying racks to dry naturally or mechanically. This crucial stage lasts several days until the beans reach an ideal moisture content of 10–12%. A specialized machine hulls desiccated beans to remove the parchment coating during washing. This fragile, paper-like coating encases the beans. Washed and natural processed beans, which retain some mucilage, are turned and raked during drying to facilitate equal drying and prevent mold growth. Washed and natural processed beans are milled to remove their skin, pulp, and parchment after drying. Dehydrated legumes, regardless of processing method, are carefully sorted to remove any defects, like discolored or damaged beans. Finally, the sorted beans are graded by size, weight, and appearance. This rigorous assessment is followed by meticulous bagging of the beans for export or distribution. It is important to remember that these processes, along with regional elements like climate, altitude, and soil composition, create coffee’s diverse flavor profiles. Thus, every processing method gives the final cup of coffee its own qualities, making coffee processing a critical step in the coffee production process.
For consistency in this experiment, the beans were sort based on their size. (Coefficient variation <20% was cut-off criteria.) The coffee beans with different postharvest processing techniques were ground in liquid nitrogen and extracted using hot water extraction (95 °C) for 20 min, with mixing at 200 rounds per minutes. The effect of both postharvested coffee beans on antidiabetic activities, including DPP4 and α-amylase activity, was determined. The phytochemical profiling of both postharvested coffee beans was also investigated using TLC and LC-MS/MS.
2.2. Batch Pilot Configurations for Coffee Bean Processing and Phytochemical Extraction
After the coffee beans were harvested and prepared as detailed in
Section 2.1, the coffee beans were extracted and processed in order to be used for brewing coffee. A total of 100 g of coffee beans was extracted and processed using in-house natural or washed processing methods. Briefly, for natural process, 100 g of coffee beans were left to dry in the sun on aluminum foil for 48 h, with the outer layers of the coffee beans still intact. After 48 h, the beans were dried and then hulled to remove the outer layer of the beans. For the washed process, the outer skin and mucilage of 100 g of coffee beans were roughly removed. The beans were put in the fermentation tank for removing outer skin and mucilage with a water stream for 24 h at 37 °C. For the final steps, the beans were dried under incubator for 48 h. Ten grams of both processed coffee methods were mechanically ground using a hand grinder.
To obtain the coffee extracts for experimental measurements, the ground coffee beans were then extracted in 100 mL of methanol (Sigma Aldrich Co., St. Louis, MO, USA) in 0.05% formic acid (Sigma Aldrich Co.) at −20 °C for 48 h. After that, C18 solid phase extraction (C18-SPE) (Waters Co., Milford, MA, USA) was conducted to clean up the samples. A total of 90 mL of methanolic fraction of both extracted coffee bean conditions was loaded on the equilibrated C18-SPE. The metabolites were absorbed on the C18 (solid material) and cleaned using 100 mL of deionized water. The elute solvent (95% acetonitrile in 0.1% formic acid) was loaded into C18-SPE and collected the fraction. The eluted fraction was dried using speed vacuum and subjected to enzyme-based experiments (DPP4 and α-amylase), cell-based experiments (cell cytotoxicity and lipid accumulation), and phytochemical profiling (TLC and LC-MS/MS).
2.3. DPP4 Activity Determination
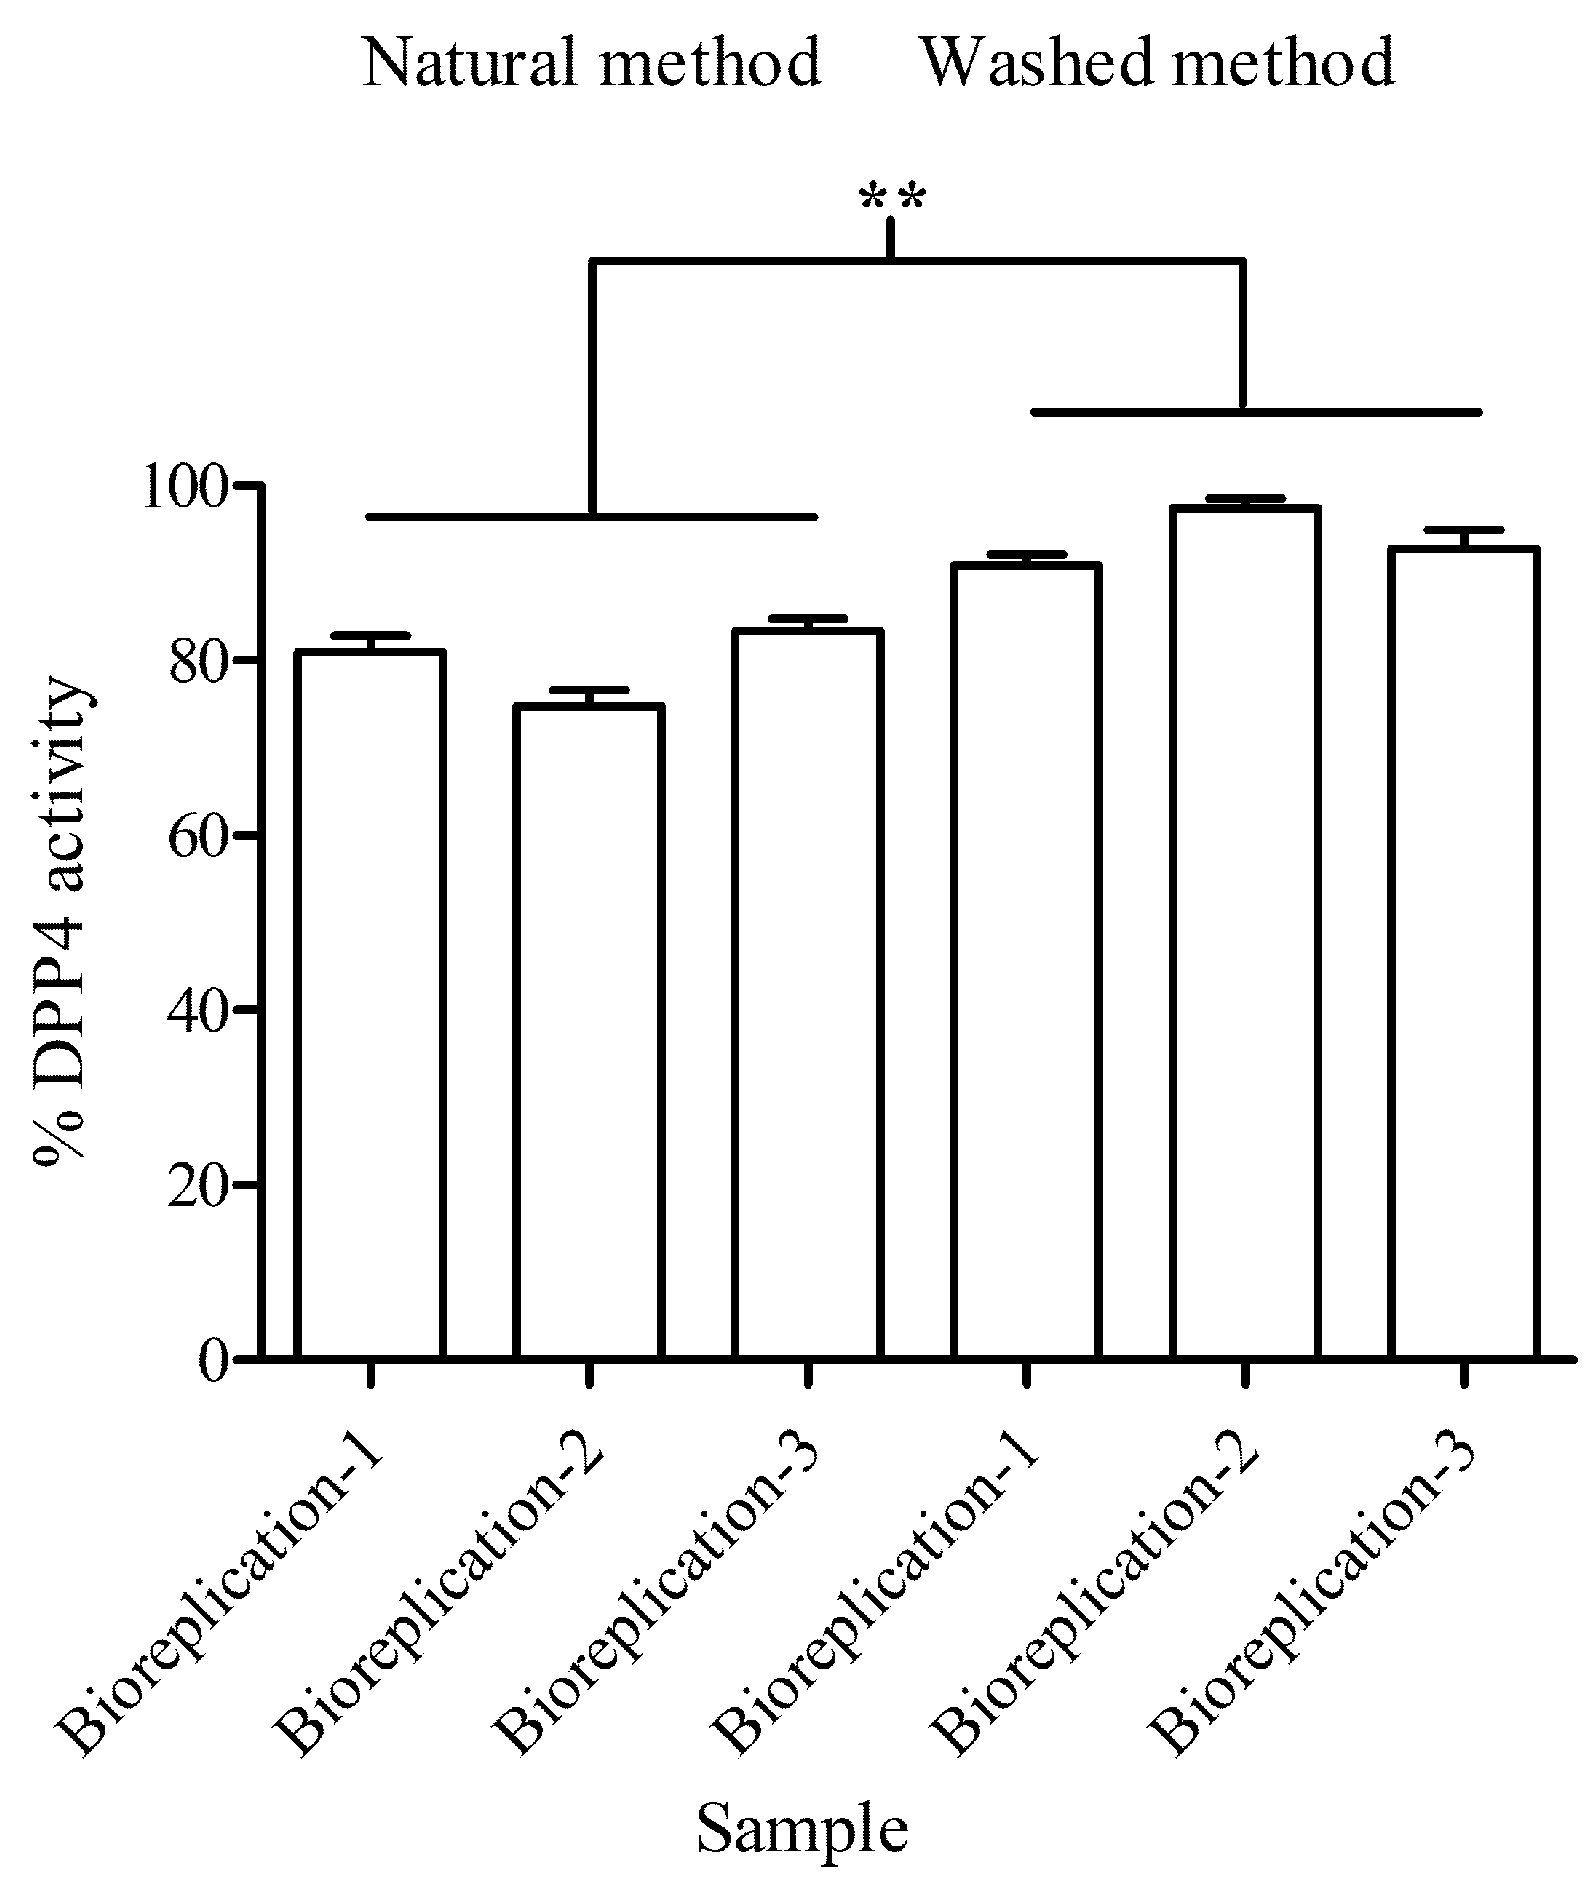
Effect of both processed coffee extracts on DPP4 activity was continually measured using fluorescence detection following manufacturer’s protocol (Cayman DPP IV screening kit) (Cayman Chemical, MI, USA) with slight modification. Briefly, the master mix of the reaction was prepared by mixing the DPP4 assay buffer and substrate (gly-pro-7-amino-4-methyl coumarin) at ratio 19:1 (
v/
v). The testing samples (natural and washed processed coffee beans) were diluted with deionized waters at ratio 1:10 (
v/
v) before the experiment. Then, 2 μL of testing samples and 2 μL of deionized water (blank) were added to each of the sample wells in 96-well flat-bottom plate. The master mix (40 μL) was added to each of the sample wells and incubated at 37 °C for 30 min. To control the reaction, sitagliptin was used as the standard inhibitor (composed of 10 μL of DPP4 assay buffer and 10 μL of sitagliptin). To estimate the DPP4 activity, the 96-well plate measured the fluorescence intensity (λ
ex = 360 and λ
em = 460 nm) using microplate reader (Multiskan Go, Thermo Scientific, Waltham, MA, USA). The percentage of DPP4 activity was calculated using following Equation (1):
where λ
em of blank is emission at 460 nm without testing samples, and λ
em of testing samples is emission at 540 nm in treatment with testing samples. The reaction was conducted with 3 biological replications and 3 technical replications.
2.4. α-Amylase Inhibitory Activity Determination
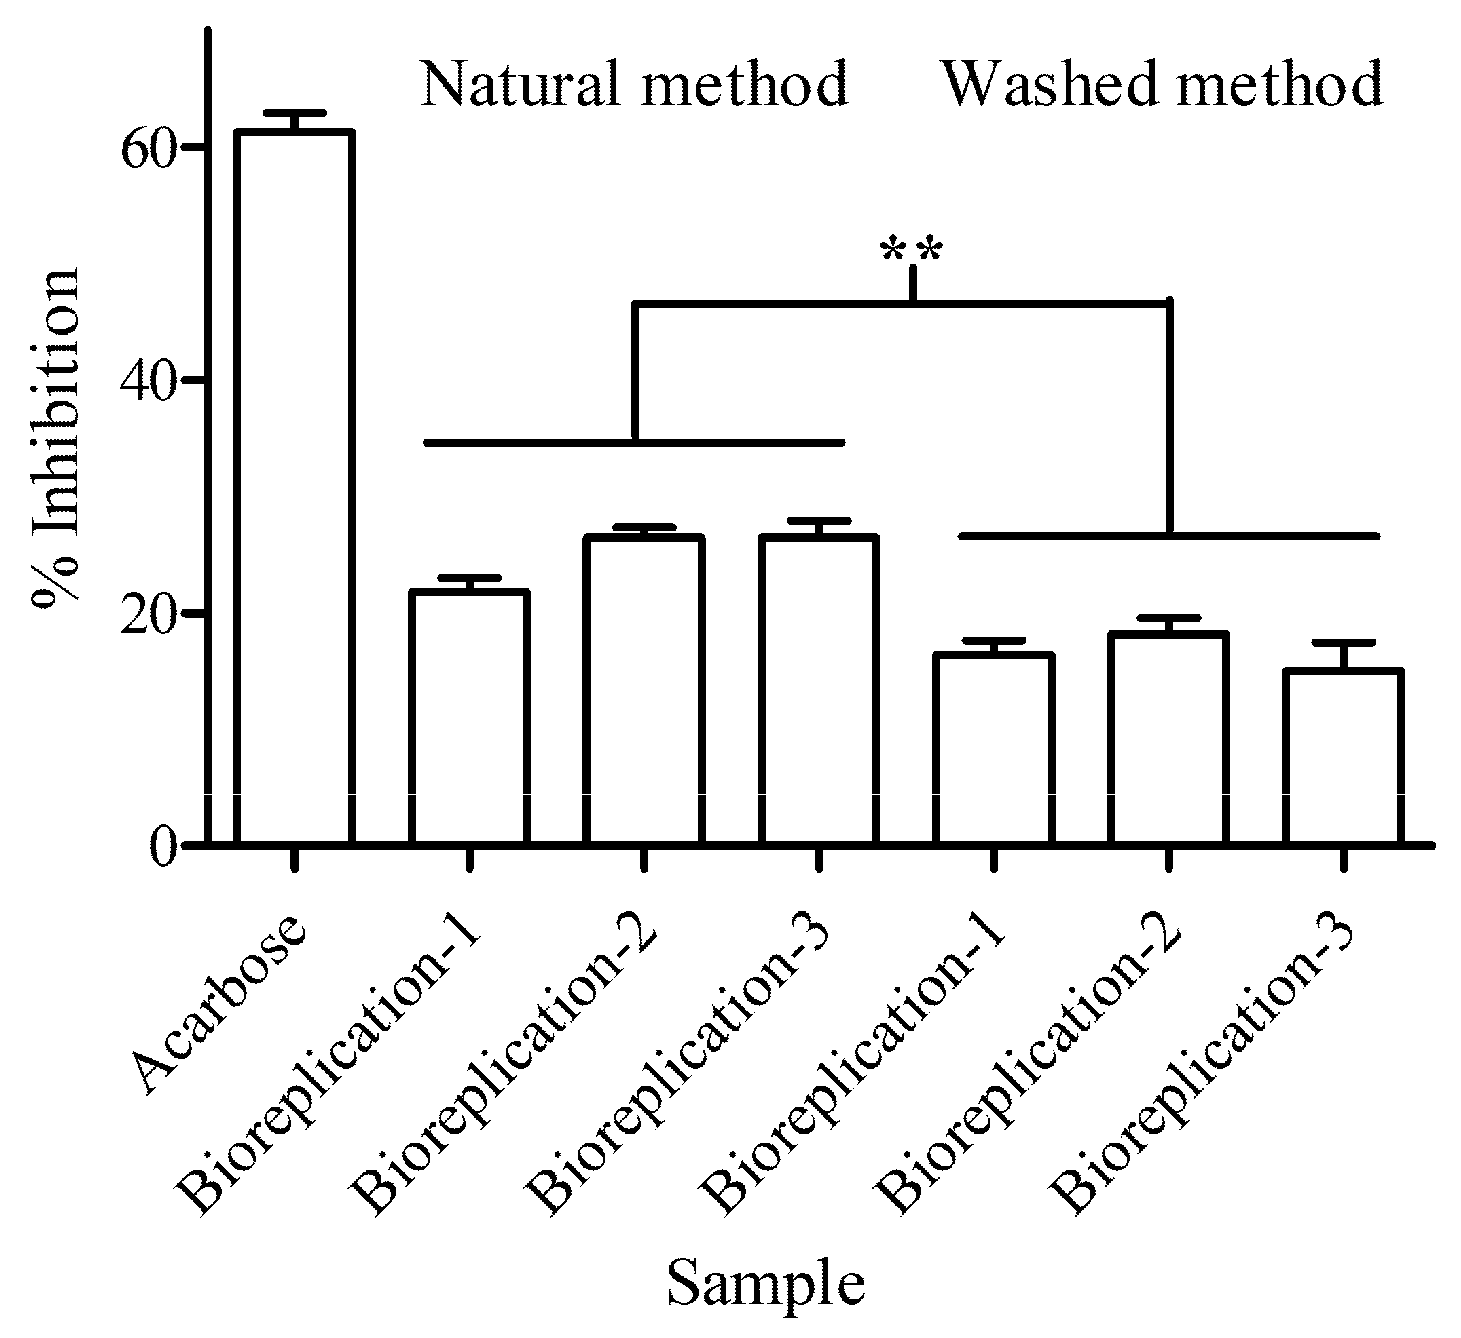
The pancreatic porcine α-amylase inhibition was determined using dinitro-salicylic acid (DNS) as described. Briefly, 1 mg of dried coffee bean extract in both processing conditions was solubilized in 10 mL of assay buffer (10 mM sodium phosphate buffer with 5 mM NaCl, pH 6.9) at 50 °C for 10 min. A total of 10 μL of extract in both processing conditions was added to 50 μL of α-amylase (0.5 U/mL) (Sigma Aldrich Co.). The reactions were incubated at 37 °C for 5 min, and 140 μL of 0.5% starch solution (prepared in the assay buffer) was added and incubated at 37 °C for 30 min. To stop the enzyme activity, the reaction was incubated at 95 °C for 10 min. After that, 0.9 mL of DNS was added. The reaction was diluted with deionized water at 1:5 (
v/
v) ratio. The absorbance was measured using microplate reader at 540 nm. Percentage of inhibition of enzyme activity was calculated as (2):
where λ
540 of blank is absorbance at 540 nm without testing samples, and λ
540 of testing samples is absorbance at 540 nm in treatment with testing samples. The known inhibitor (acarbose) at 10 μg/μL was used to control the reaction. The reaction was conducted with 3 biological replications and 3 well replications.
2.5. TLC Profiling of Different Processed Coffee
Phytochemical profiling was performed using precoated TLC plates (silica gel 60 F254, 20 × 20 cm, Merck Co., Darmstadt, Germany). A total of 0.1 microgram of the extracted samples was dissolved in DCM (Sigma Aldrich Co.) and applied onto the TLC plates (Sigma Aldrich Co.) using micropipette. An applied TLC plate was presaturated with the mixture of solvents with different mobile phases (
Table 1) in the glass chamber at room temperature.
After the solvent ran up to ~90% of total TLC plate height, the plate was air dried and stained with p-anisaldehyde, followed by heating of the plate. The developed TLC plate was scanned under visible light using image scanner software.
2.6. Sample Preparation and LC-MS/MS Setting for Untargeted Metabolomics Analysis
The dried processed coffee by natural and washed methods (as detailed in
Section 2.2) was reconstituted in 1000 μL methanol in 0.1% formic acid before being subjected to LC-MS/MS analysis. Metabolite profiling was analyzed using LC-MS/MS following previous protocol with minor modifications [
22]. Briefly, an analytical column, Hypersil GOLD™ column (Thermo Fisher Scientific, Waltham, MA, USA), held at 50 °C, was used during the analysis. A total of 2 µg (4 µL) sample injections (concentration = 0.5 µg/µL) was used at a flow rate of 0.35 mL/min. The mobile phase was composed of 80%/20% methanol/water with 0.1% formic acid (MP: A) and acetonitrile with 0.1% formic acid (MP: B) (LC-MS grade, Sigma). Gradient starting conditions were 99% MP: A and 1% MP: B. Starting conditions were held for 1 min before rising to 55% B over 18 min. The column was flushed with 99% MP: B for 6 min before returning to the starting conditions. The total time of each analysis was 35 min. MS was operated in a positive mode. A spray voltage of 3.8 kV in both positive, sheath gas, and auxiliary gas flow rates were set at 48 and 11 arbitrary units (AU), respectively. The capillary temperature was 350 °C. The MS analysis alternated between MS full scans and data-dependent MS/MS scans with dynamic exclusion. LC-MS for full MS: scan range, 60–700
m/
z; resolution 120,000; AGC target 3 × 10
6; max. IT 50 ms and LC-MS for full MS/MS:, resolution 30,000; AGC target 1 × 10
5; max. IT 100 ms. Up to ten ions with the most intense signal were fragmented. To prevent sample contamination, a blank sample (0.1% formic acid/water) was administered after every injection. All LC-MS runs were acquired using Xcalibur 3.1 software (Thermo Scientific).
2.7. Data Processing for Untargeted Metabolomics Analysis
The acquired raw MS files were processed using Compound Discoverer 3.1 (Thermo Fisher Scientific) to identify phytochemicals. Peak identification, peak alignment, and peak feature extraction were all conducted in a positive mode on the data. The retention time (RT) and
m/
z of different injections were conducted according to the retention time deviation of 0.5 min and the mass deviation of 5 ppm. Then, the peak extraction was performed according to the set information and adduct information: mass deviation = 5 ppm, signal strength deviation = 30%, signal-to-noise ratio = 2, and fine isotopic pattern matching >90% of the precursor and the characteristic product ions. Additionally, the peak area was quantified. The target
m/
z ions were then integrated to predict the molecular formula, which was compared to mzCloud (
https://www.mzcloud.org; accessed on 15 September 2023) and ChemSpider (
http://www.chemspider.com; accessed on 15 September 2023) online databases for the identification and confirmation of the compounds. Among candidate metabolites obtained from mzCloud and ChemSpider, the highest MS/MS coverage scores were selected for annotation. The PCA was conducted using Plotly version 2.0 (R package).
2.8. Absolute Quantifying of CGA Using LC-MS/MS
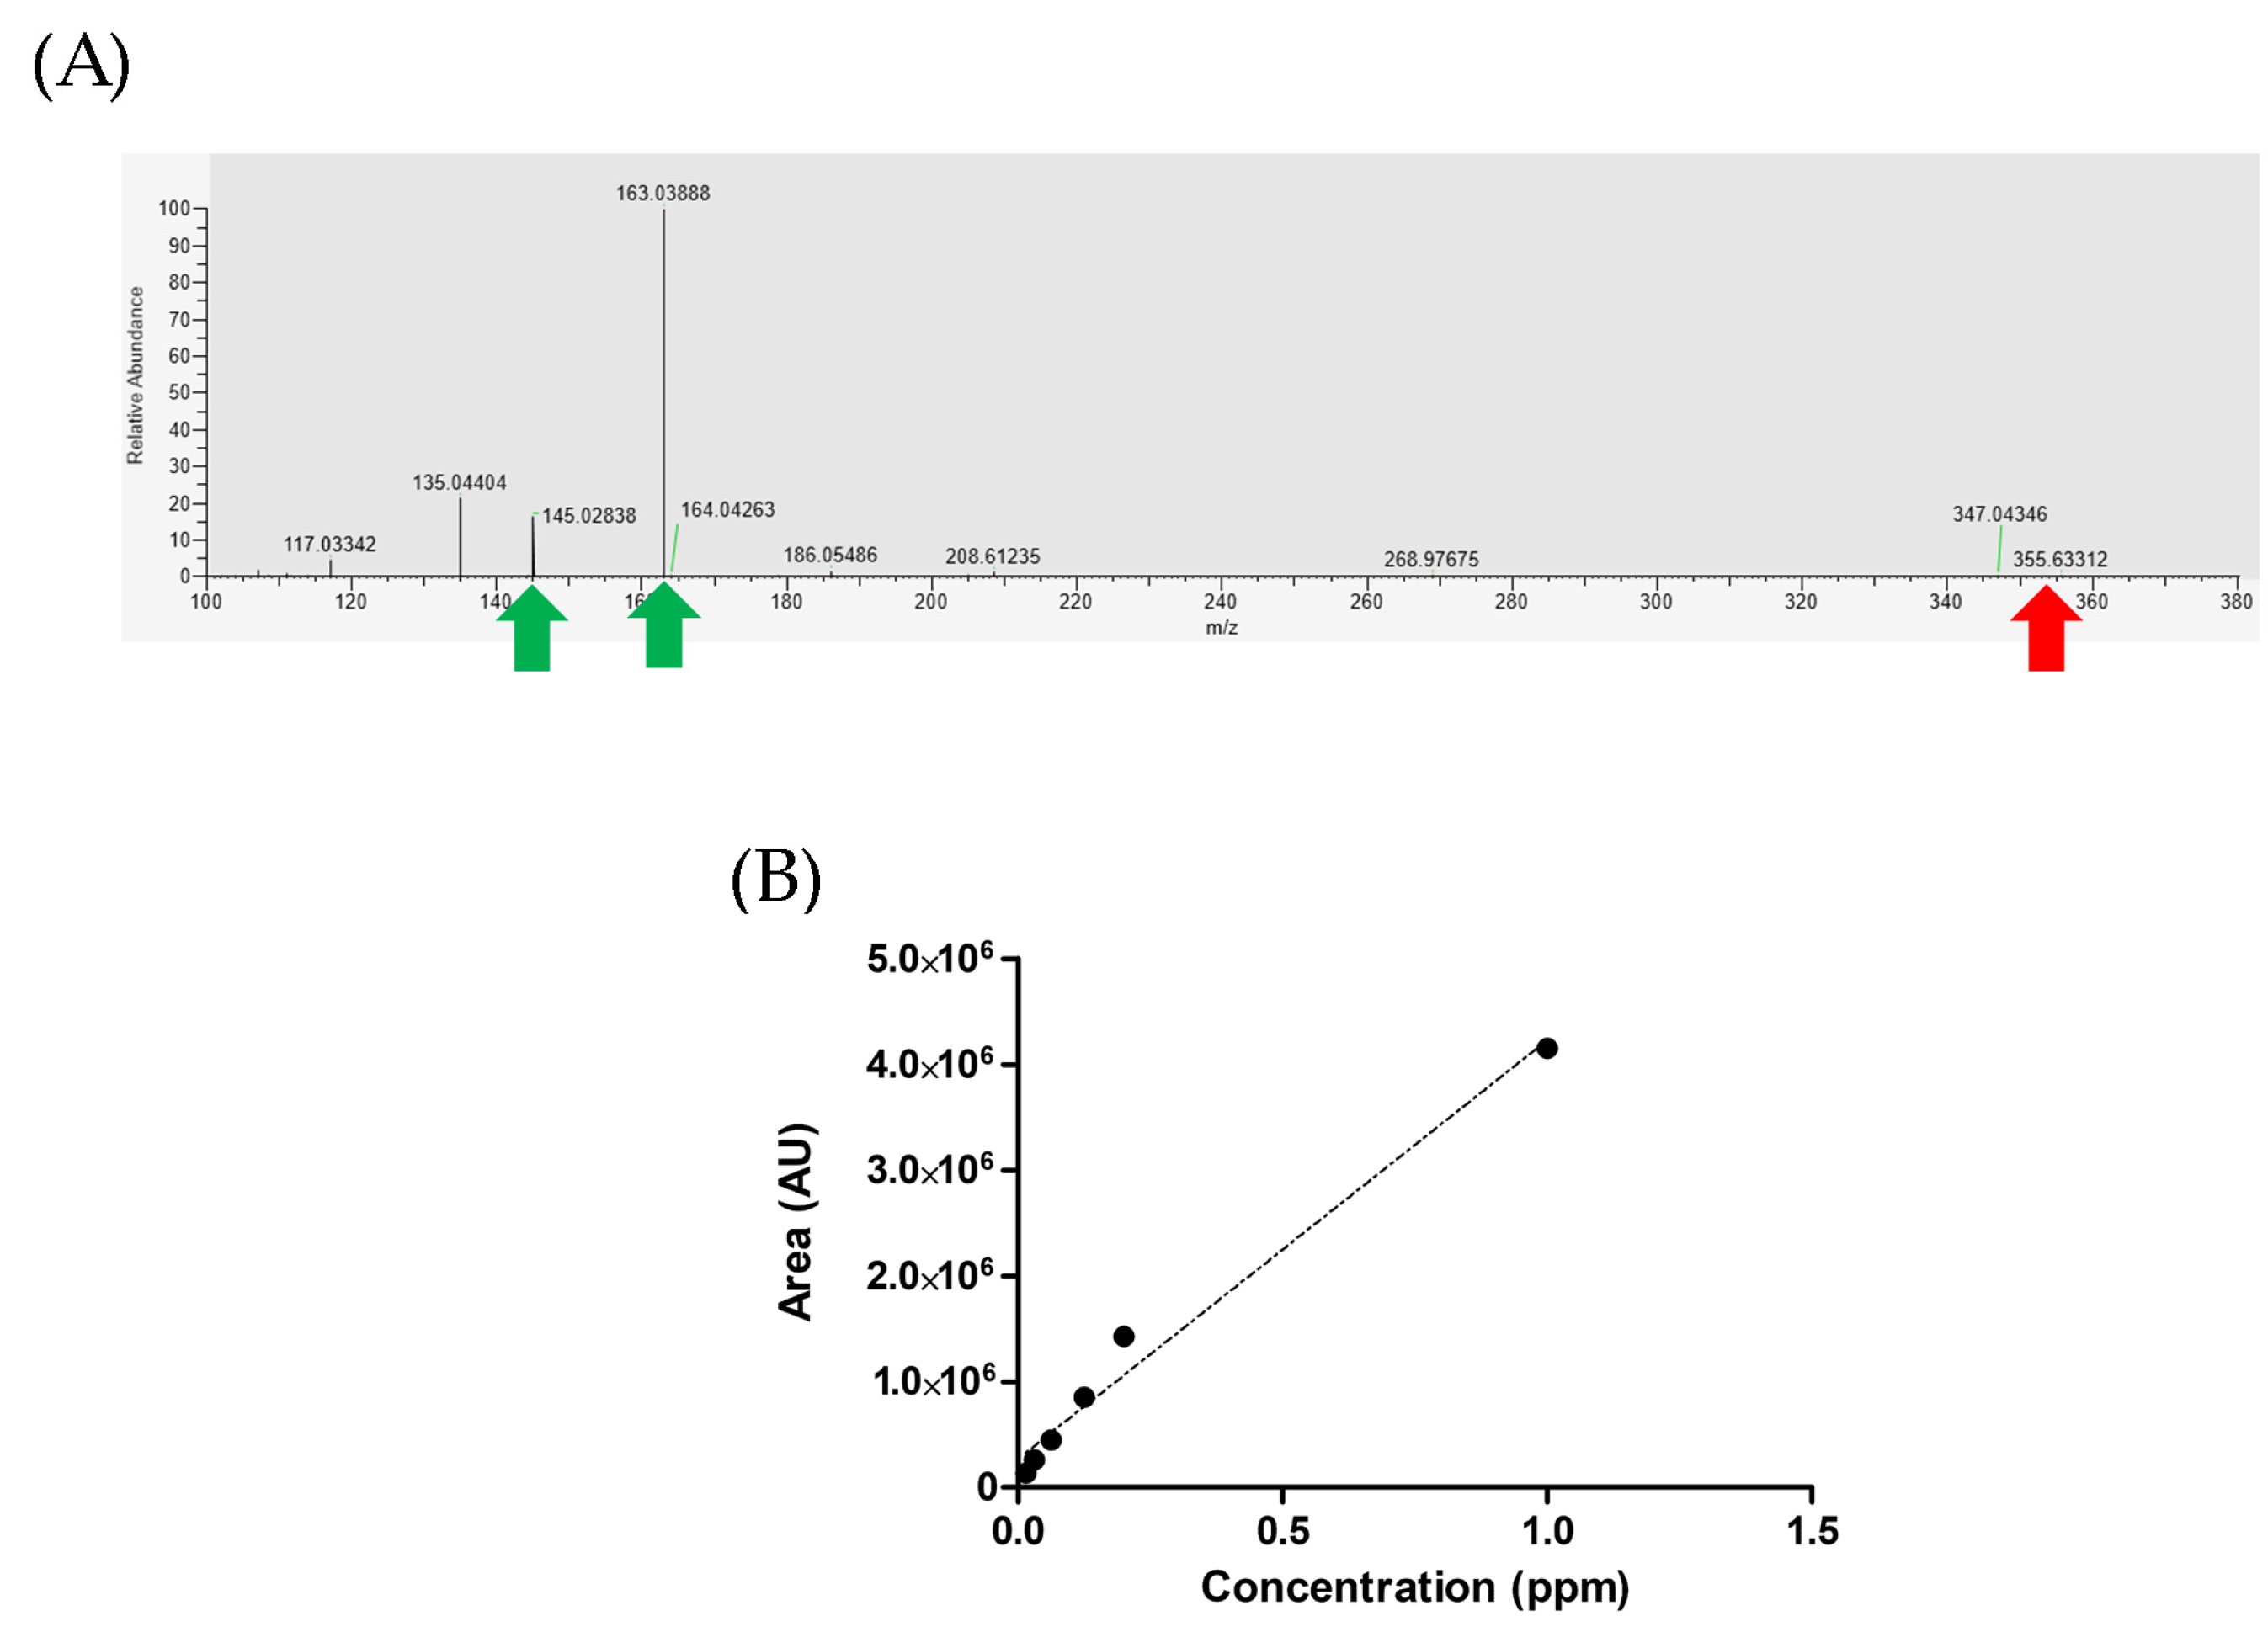
A stock solution of CGA (50 ppm or 0.05 mg/mL) (Sigma Aldrich Co.) was freshly prepared in methanol (LC-MS grade) using amber vials. Working solutions of these compounds were then prepared by diluting the above stock solution with 0.1% formic acid/methanol (v/v) for the purpose of analytical method validation and standard curve construction. The working solutions covered a concentration range from 1 ppm to 0.075 ppm. For the analytical method validation and standard curve construction, the stock solutions were appropriately diluted to obtain the working solutions within the specified concentration range. An aliquot of 3 µL from each working solution was injected into the LC-MS/MS analysis. Quantification was performed using LC-MS/MS. The LC conditions and settings were consistent with the configuration used for untargeted metabolomics analysis method. MS was operated in positive mode. LC-MS acquisitioned in parallel reaction monitoring (PRM) used the following settings: MS2 resolution 30,000; AGC target 2 × 10⁵; max. IT 150 ms. The precursor product ion used for PRM for each analyte was obtained at m/z = 355.10236 (C16H18O9) (NCE = 45) for chlorogenic acid. The samples were injected (n = 3) with above-mentioned parameter in LC-MS/MS. Standard curve of quercetin was constructed using the nominal known concentrations and was plotted against the corresponding peak areas. In order to absolutely quantify metabolites of CGA in the samples, the samples were reanalyzed in PRM acquisition mode. Each sample (natural and washed coffee beans) was quantitatively analyzed by comparing extracted ion chromatograms for each metabolite in Xcalibur 4.0 Quan Browser software (Thermo Fisher Scientific). The quantitation algorithm used suitable area of product ion spectra from the known metabolites’ standard concentration. The experiment was conducted with three biological replicates and three technical replicates, resulting in a total n = 9 samples per experimental group.
2.9. Statistical Analysis
All experiments were carried out with at least three independent replicates (n = 3), and all data were expressed as means ± standard deviation. The significance in differences was determined using Duncan’s multiple range test (p-values < 0.05). The absolute quantification of CGA is presented as the mean of duplicate extractions ± standard deviation.
4. Discussion
There have been several studies that have investigated the potential health benefits of coffee for people with T2DM. More research is crucially needed to fully understand the relationship between the compounds within coffee and T2DM. According to enzyme bioactivity testing, beans processed using the natural method significantly inhibited DPP4 and α-amylase functions. From a pharmaceutical aspect, these inhibition values showed a slight (10–20%) inhibition level. However, from a functional food aspect, coffee, as a beverage, is not a medicine or drug. For this reason, it is impossible to have great potential as a known drug. In addition, the slowing down of starch digestion by coffee extract is not dependent on decreasing enzymatic activity alone; the coffee extract is affected by perturbing the binding affinity at active sites of enzymes. There were reports that in moderate coffee consumption, the compounds in coffee extract can form complexes with α-amylase via a static quenching mechanism [
23]. From another perspective, drinking coffee may be beneficial for developing T2DM in people who already have the condition by, in part, the presence of dominant compounds such as chlorogenic acids [
24]. This suggested to us that the lower inhibition level may not reflect the realistic situation in our body. In addition, our coffee beans with a specific geographical origin and processing could be developed into a beverage with health benefits in term of health prevention and maintenance.
To screen the metabolites extracted from natural- and wash-processed beans, TLC profiling was performed. After developing with mobile phases (
Table 1) and dying with
p-anisaldehyde reagent, prominent purple spots were observed in the wash-processed bean extract but not found in the natural-processed bean extract. Furthermore, to identify the diverse metabolites present in the extract, LC-MS/MS analysis was performed. LC-MS/MS is the most acceptable approach for the identification of both polar and nonpolar metabolites. Our findings found differences in the metabolome profiling of processed coffee beans using natural and washed methods. As shown in
Figure 5A, the beans processed by natural methods are grouped in different regions in the XYZ coordinates. The sampling set near the group was highly correlated in terms of the metabolome profiling of each group, whereas the sample set distance was less correlated. The intragroup variations were slightly smaller than the intergroup variations, which may be due to the small sample size or largely uncontrollable factors, such as processing time variation and other factors pre- and postsample collection. Clustering using a hierarchical algorithm can visually demonstrate the difference in the metabolome in different processed beans. From a sensory perspective, organic acids and amino acids are the most important components of coffee. The amino acid profiling abundance is shown in
Table 2. It comprises a large fraction of the total mass, as much as 11% of the green and 6% of the roasted beans [
25]. The organic acids represent a large proportion of the total dried mass, with up to 11% of green coffee beans and 6% of roasted coffee beans [
26]. The amount of specific organic acids in coffee beans in roasted beans greatly influences the quality of the final cup [
27]. The most prominent components of green coffee are citric acid, malic acid, and quinic acid. Increasing any amount of organic acid will reduce the pH and increase titratable acidity. A deeper insight into the metabolome profiling among the various compounds of amino acids, along with the outstanding presence of seven dipeptides (GV, LP, GL, LL, LF, CG, and GC) and seven tripeptides (DPH, WQH, DPH, KKK, EKK, and glutathione), in coffee beans has never been described.
Owing to the favorable attributes associated with short peptides, they exhibit superior characteristics in relation to metabolism, absorption, and safety when contrasted with a range of drug-like compounds [
28,
29]. The evidence showed the correlation between short peptides and DPP4 activity [
30,
31]. In the BIOPEP-UWM database, it reported seven dipeptides, including QY, NY, EY, DR, EK, VL, and VG, reported as effective DPP-IV inhibitory peptides [
32]. In the context of structure–bioactivity relationships, DPP4 inhibitory peptides exhibit a preference for hydrophobic residues, notably valine, alanine, leucine, isoleucine, methionine, phenylalanine, tryptophan, and tyrosine, at their N-terminal region [
31,
33]. Notably, our findings revealed that six out of seven di-peptides displayed hydrophobic amino acids at their N-terminal regions, aligning with previous research. This observation suggests the potential for these peptides to bind to the binding sites of DPP4 and inhibit its functions. However, in order to confirm the inhibition of DPP4, it is necessary to validate the inhibitory effect and understand its mechanism using synthetic peptides.
In addition, we found high level of leucine, methionine, and tyrosine in beans processed with the washed method compared to the natural method. As the coffee beans were controlled in terms of the type of coffee plant and the growing conditions, they are only different in terms of the coffee processing method. Therefore, we suggest that the beans processed by natural and washed methods exhibited different short peptide and amino acid contents. Amino acids and organic acids are important aroma precursors in roasting process which will impact the coffee beverage final cup quality.
The previous evidence also suggested that naturally processed beans tend to have a higher concentration of volatile compounds than washed processed beans [
20]. However, our result found 1,2,4-trimethoxybenzene in washed processed beans at a significantly higher level than the naturally processed beans (
p-value = 3.3 × 10
−3). In terms of this contrary trend, we suggest that the natural and washed processed beans may be different in terms of processing steps, times, and equipment. In addition, an abundance of 1,2,4-trimethoxybenzene, which is the flavor of coffee, can vary depending on a number of factors, including the type of coffee bean, area, and the conditions under which the beans are harvested. These uncontrollable factors may contribute to the 1,2,4-trimethoxybenzene in washed processed beans exhibiting a higher level than in natural processed beans.
As mentioned above, the metabolome of processed beans collected from natural and washed methods may be obviously different. However, this study was limited to representing the overall differences between coffee beans samples. Different metabolites in coffee beans do not correspond to different nutritional values, aromas, or tastes. Moreover, the coffee beans should be collected with more biological replicates for the improvement of the accuracy of future research.
We utilized a known metabolite library to obtain accurate and reliable results. By comparing the unknown feature spectrum with its closest matches in the mzCloud library, we identified similarities in LC-MS spectrum information and characteristic fragmentation ions. In the MS2 spectrum of CGA, we observed distinct peaks at 163.03888 and 145.02838 (indicated by green arrows in
Figure 6A), corresponding to C
9H
7O
3+ and C
9H
5O
2+ ions, respectively. These findings are consistent with the information present in the database, confirming the reliability and accuracy of the CGA content in our experiment.

 ,
, 


