

Qualitative and Quantitative Detection of CRISPR-Associated Cas Gene in Gene-Edited Foods
 ,
, 

Abstract
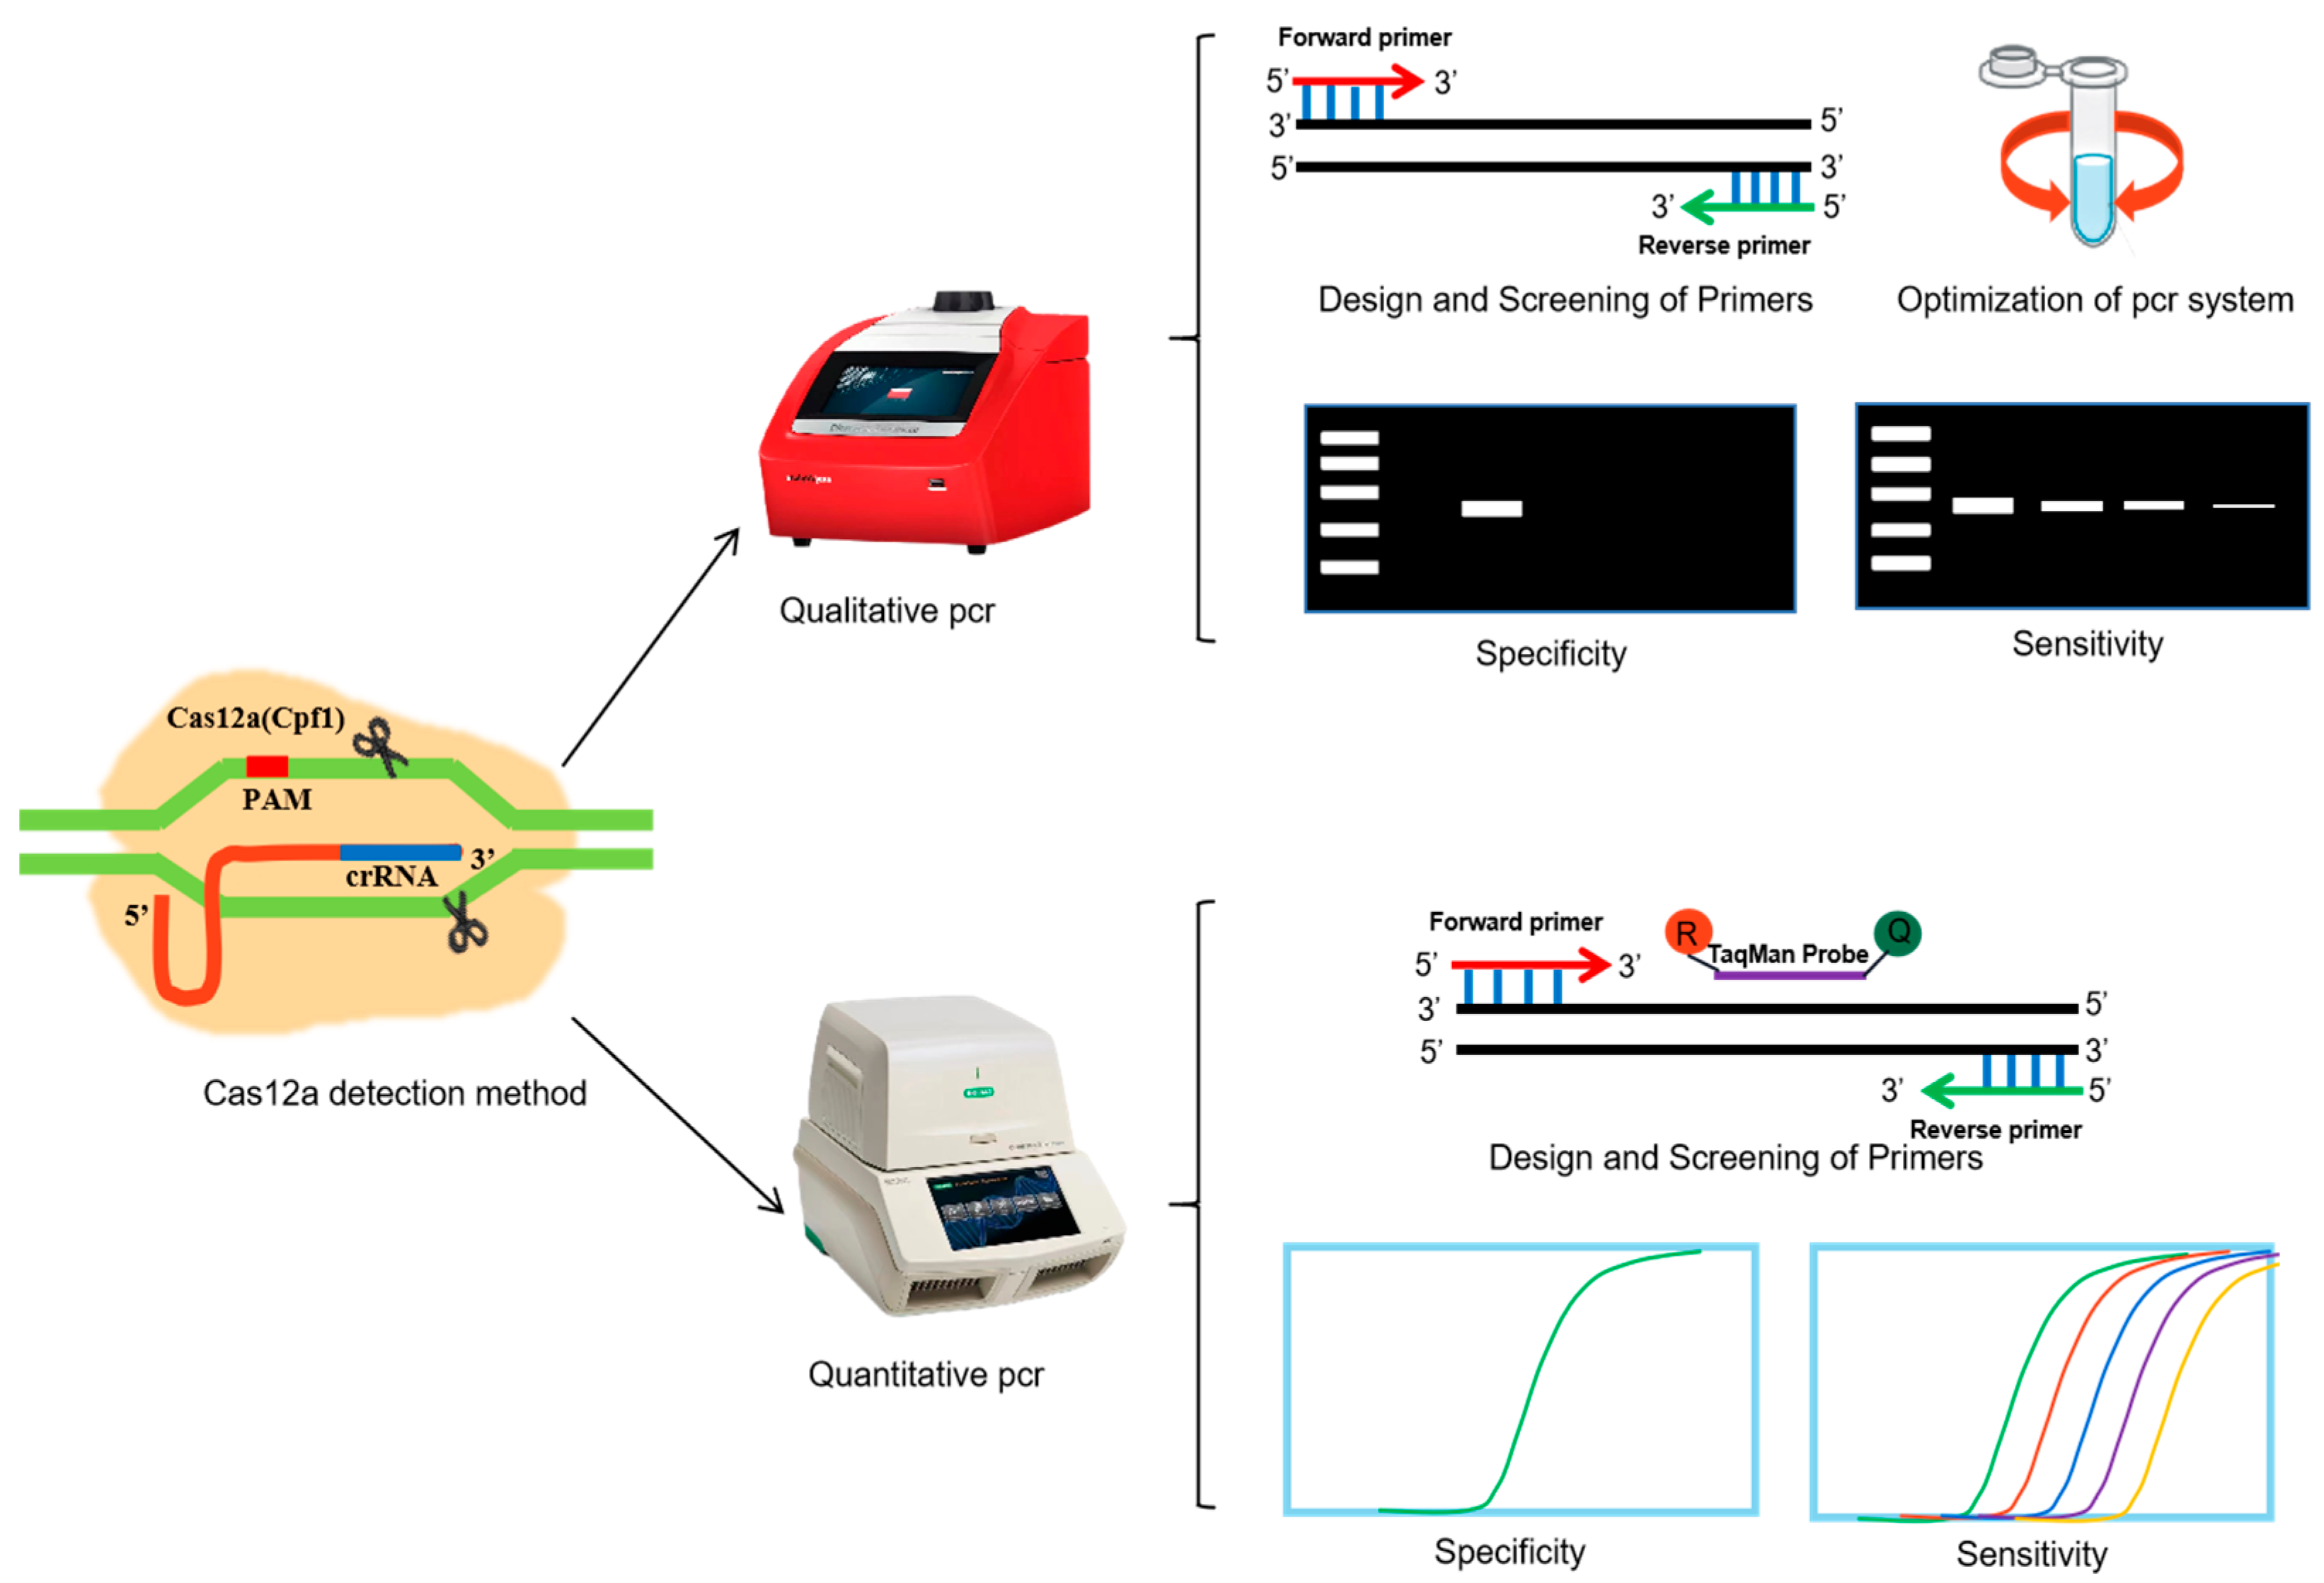
:1. Introduction
2. Materials and Methods
2.1. Materials
2.1.1. Experimental
2.1.2. Reagents
2.1.3. Apparatus
2.2. Methods
2.2.1. Preparation of Samples
2.2.2. DNA Extraction
2.2.3. PCR Amplification
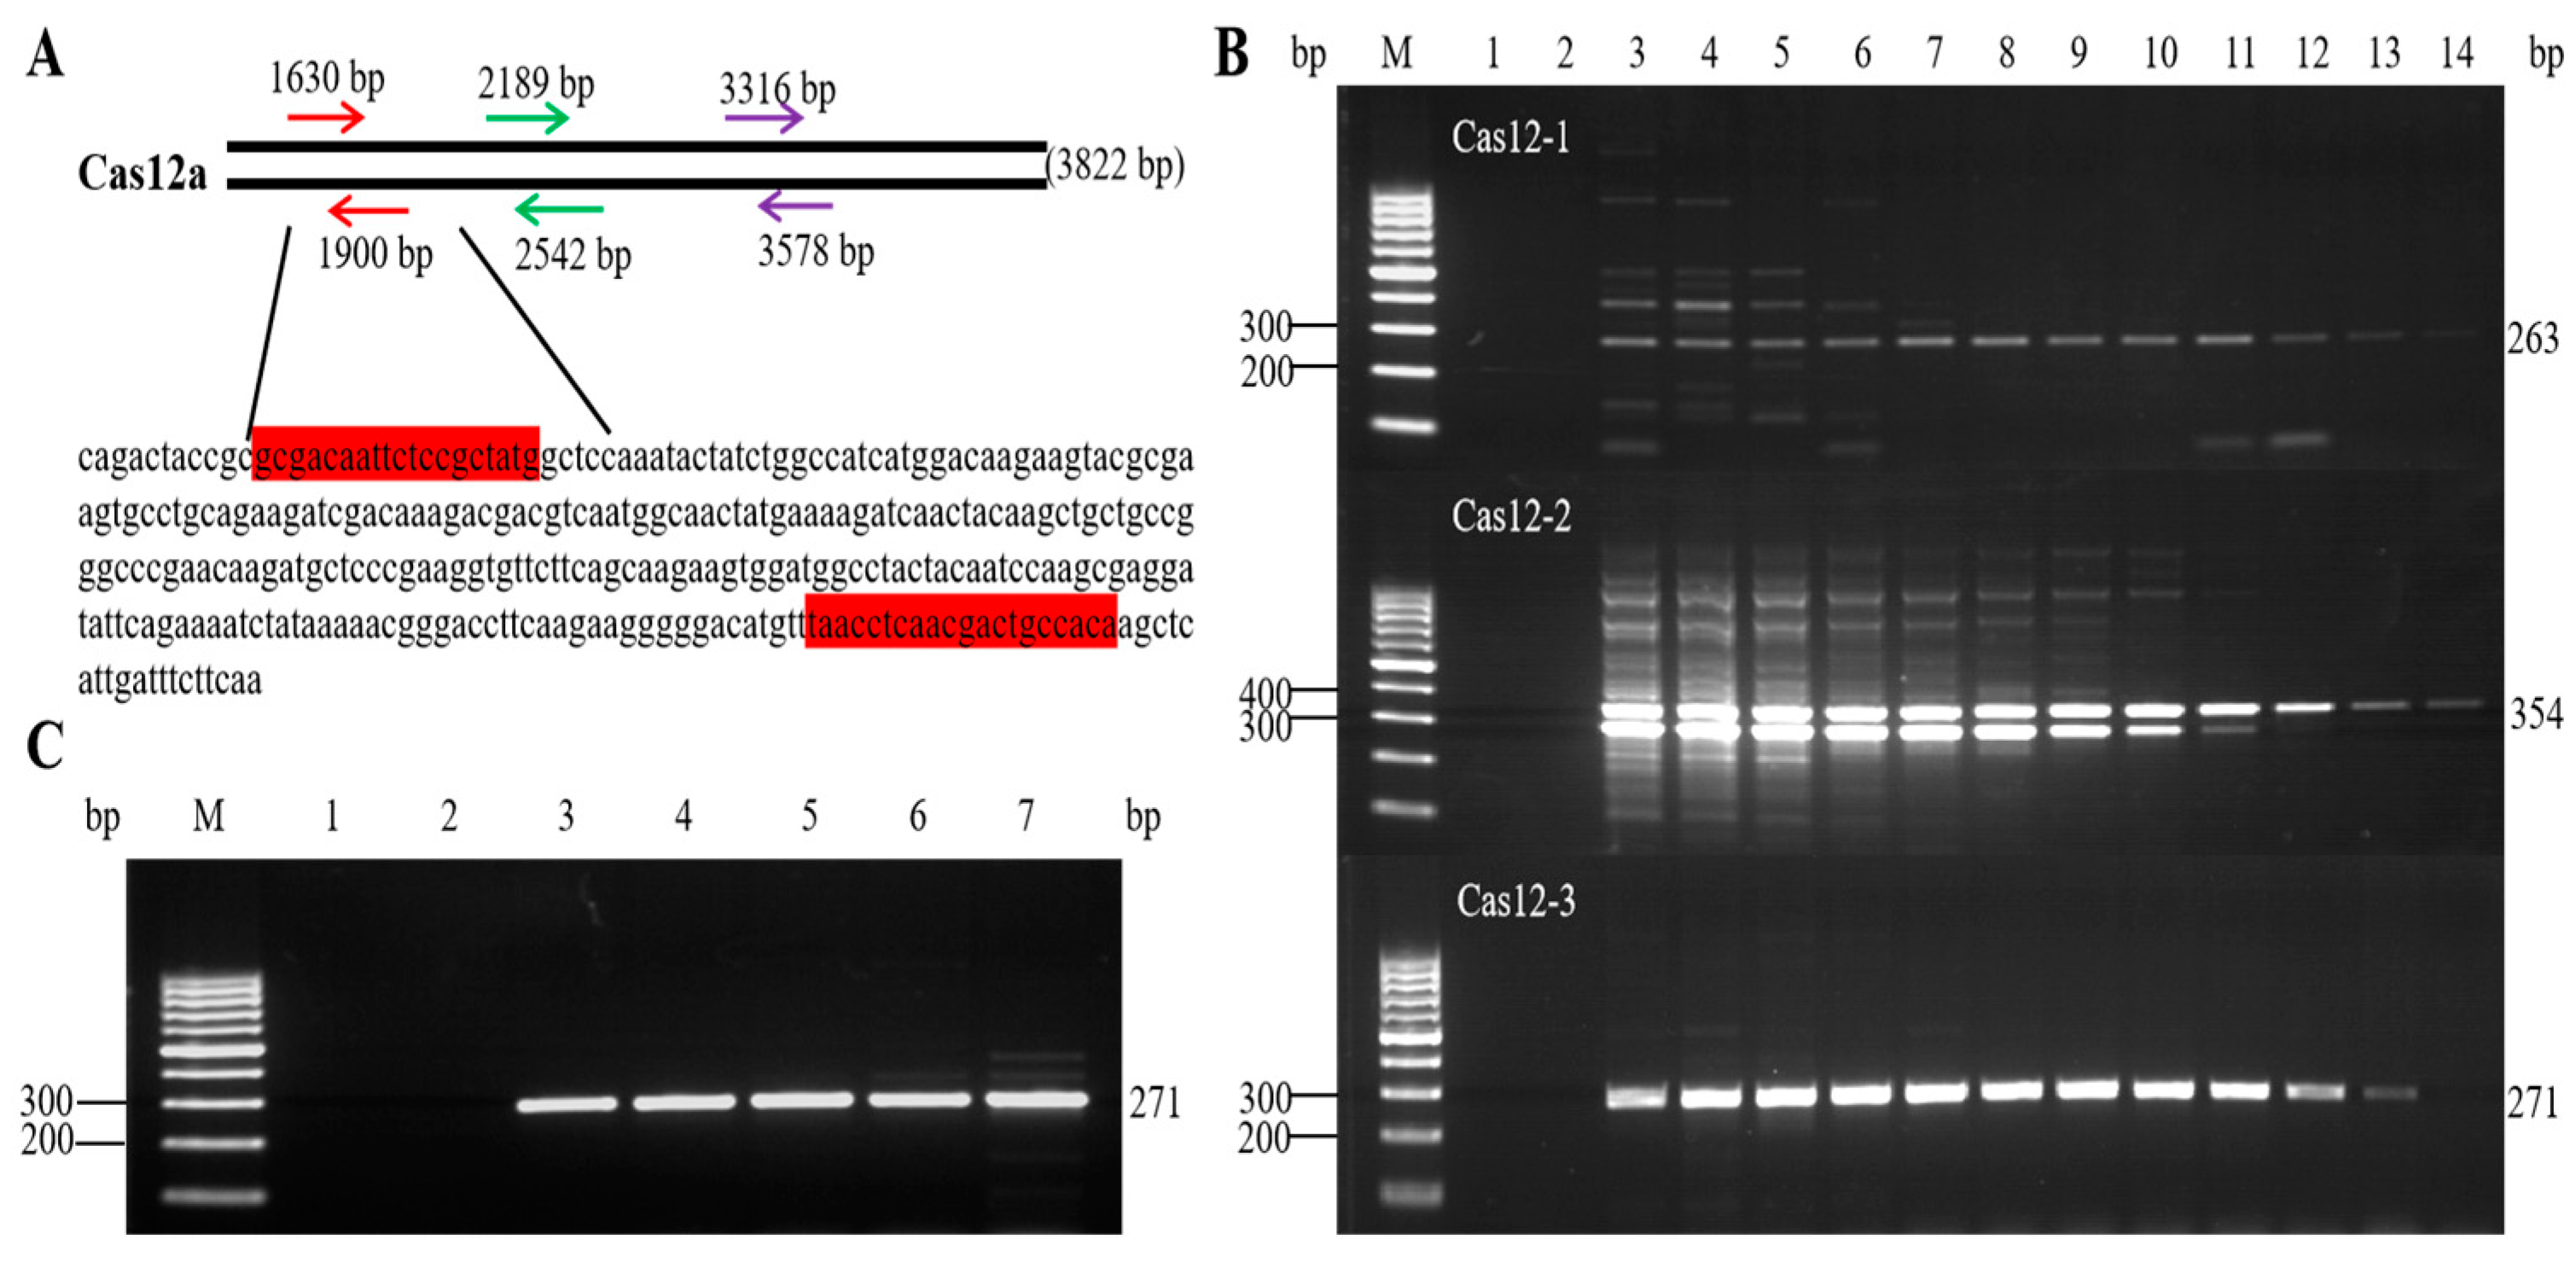
Primer Design and Screening
Qualitative PCR System Optimization
Specificity Analysis
Sensitivity Analysis
3. Results
3.1. Designing and Screening of Primers
3.2. Optimization of the Qualitative PCR Reaction System and Amplification Conditions
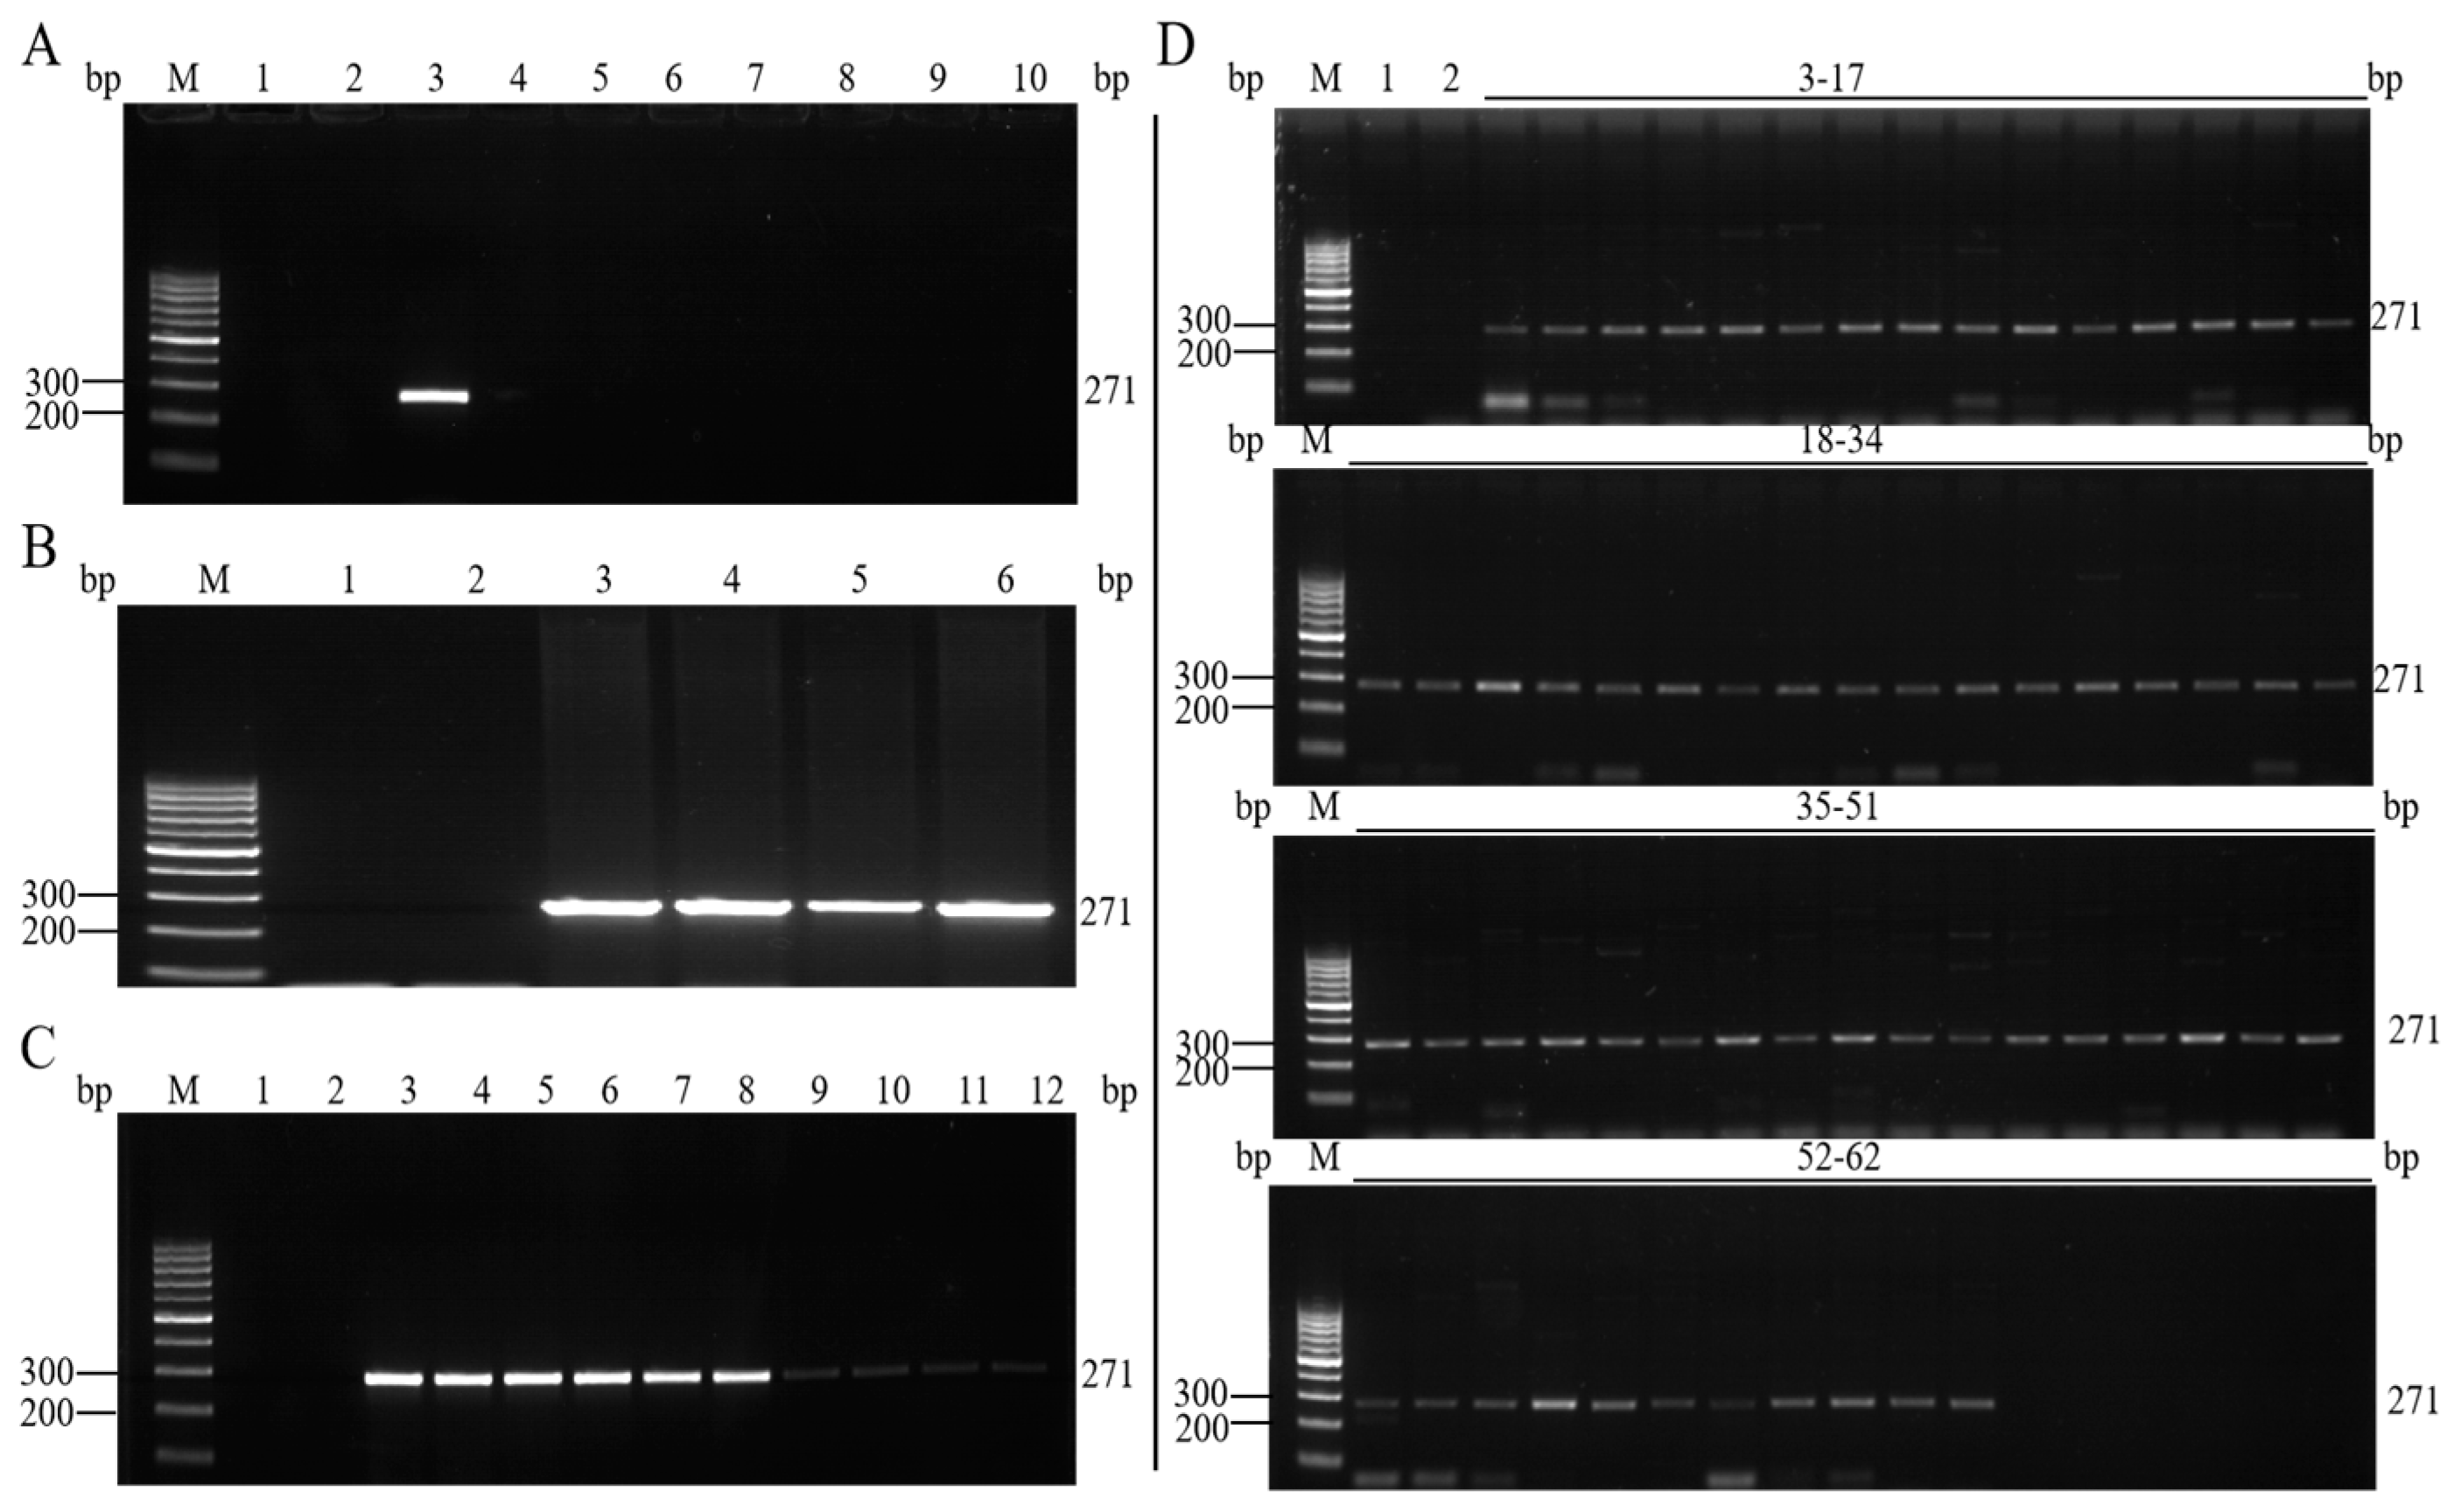
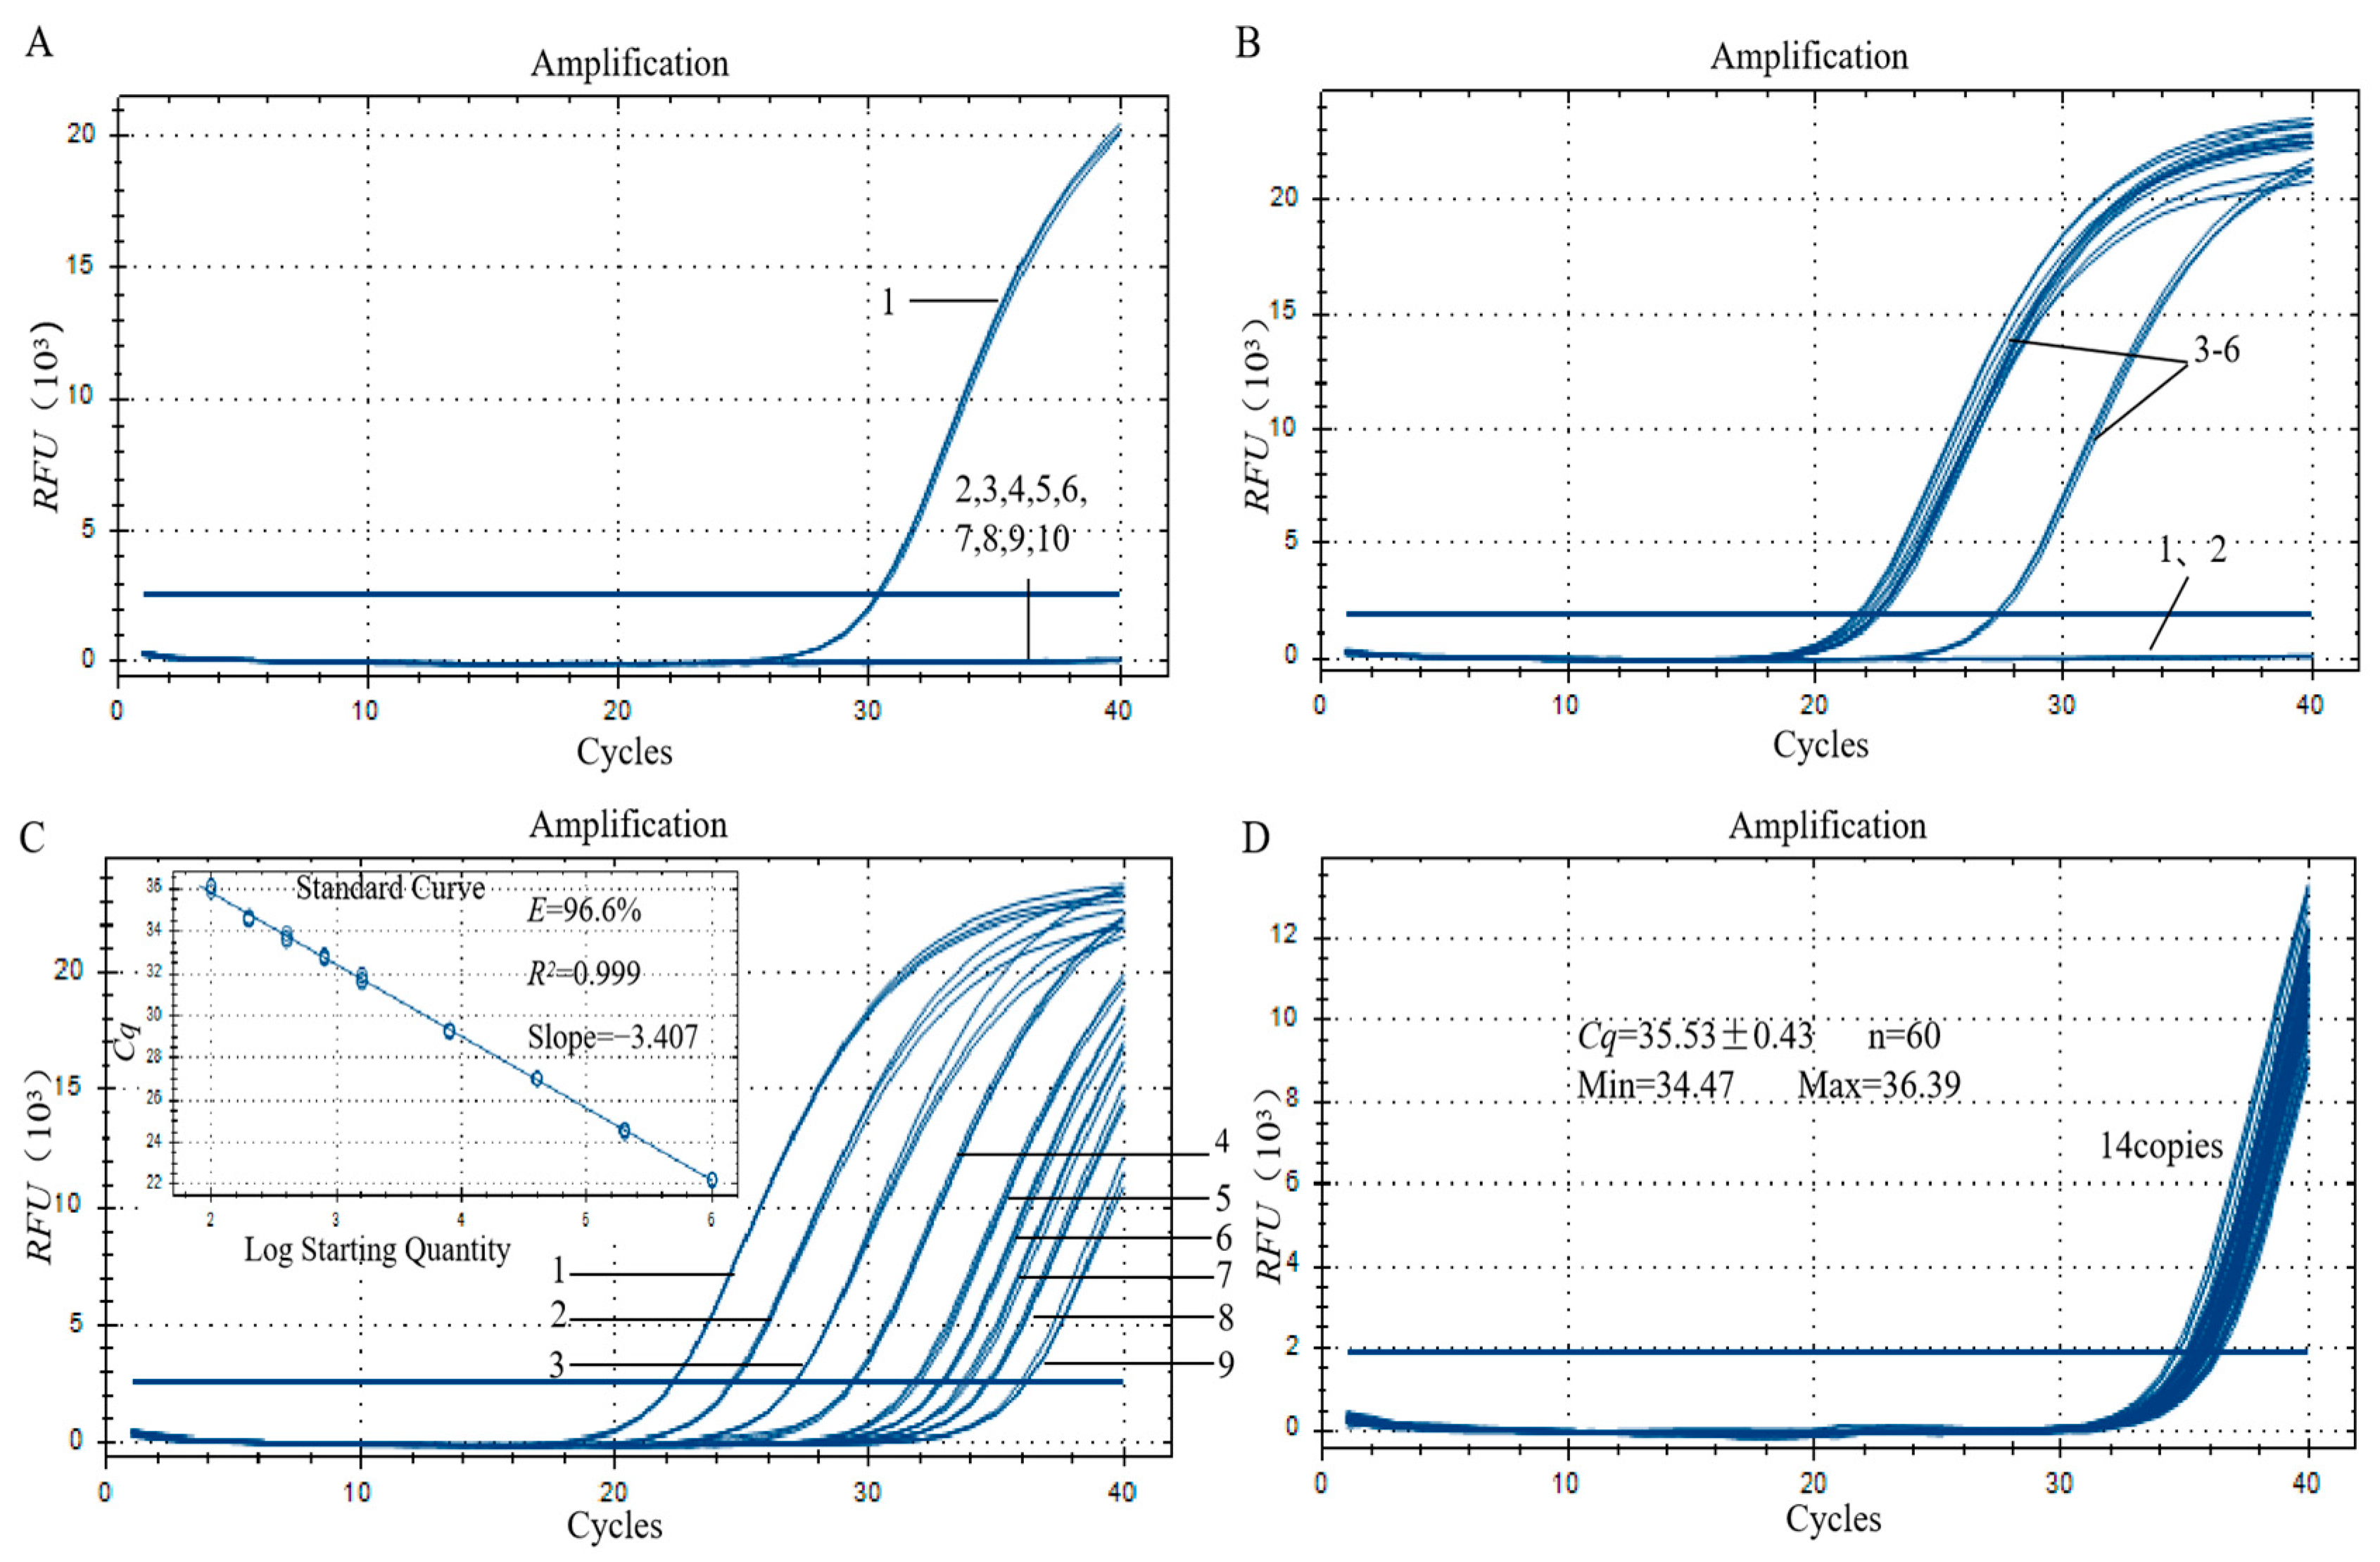
3.3. Specificity Analysis of the Qualitative PCR Method
3.4. Sensitivity Analysis of the Qualitative PCR Method
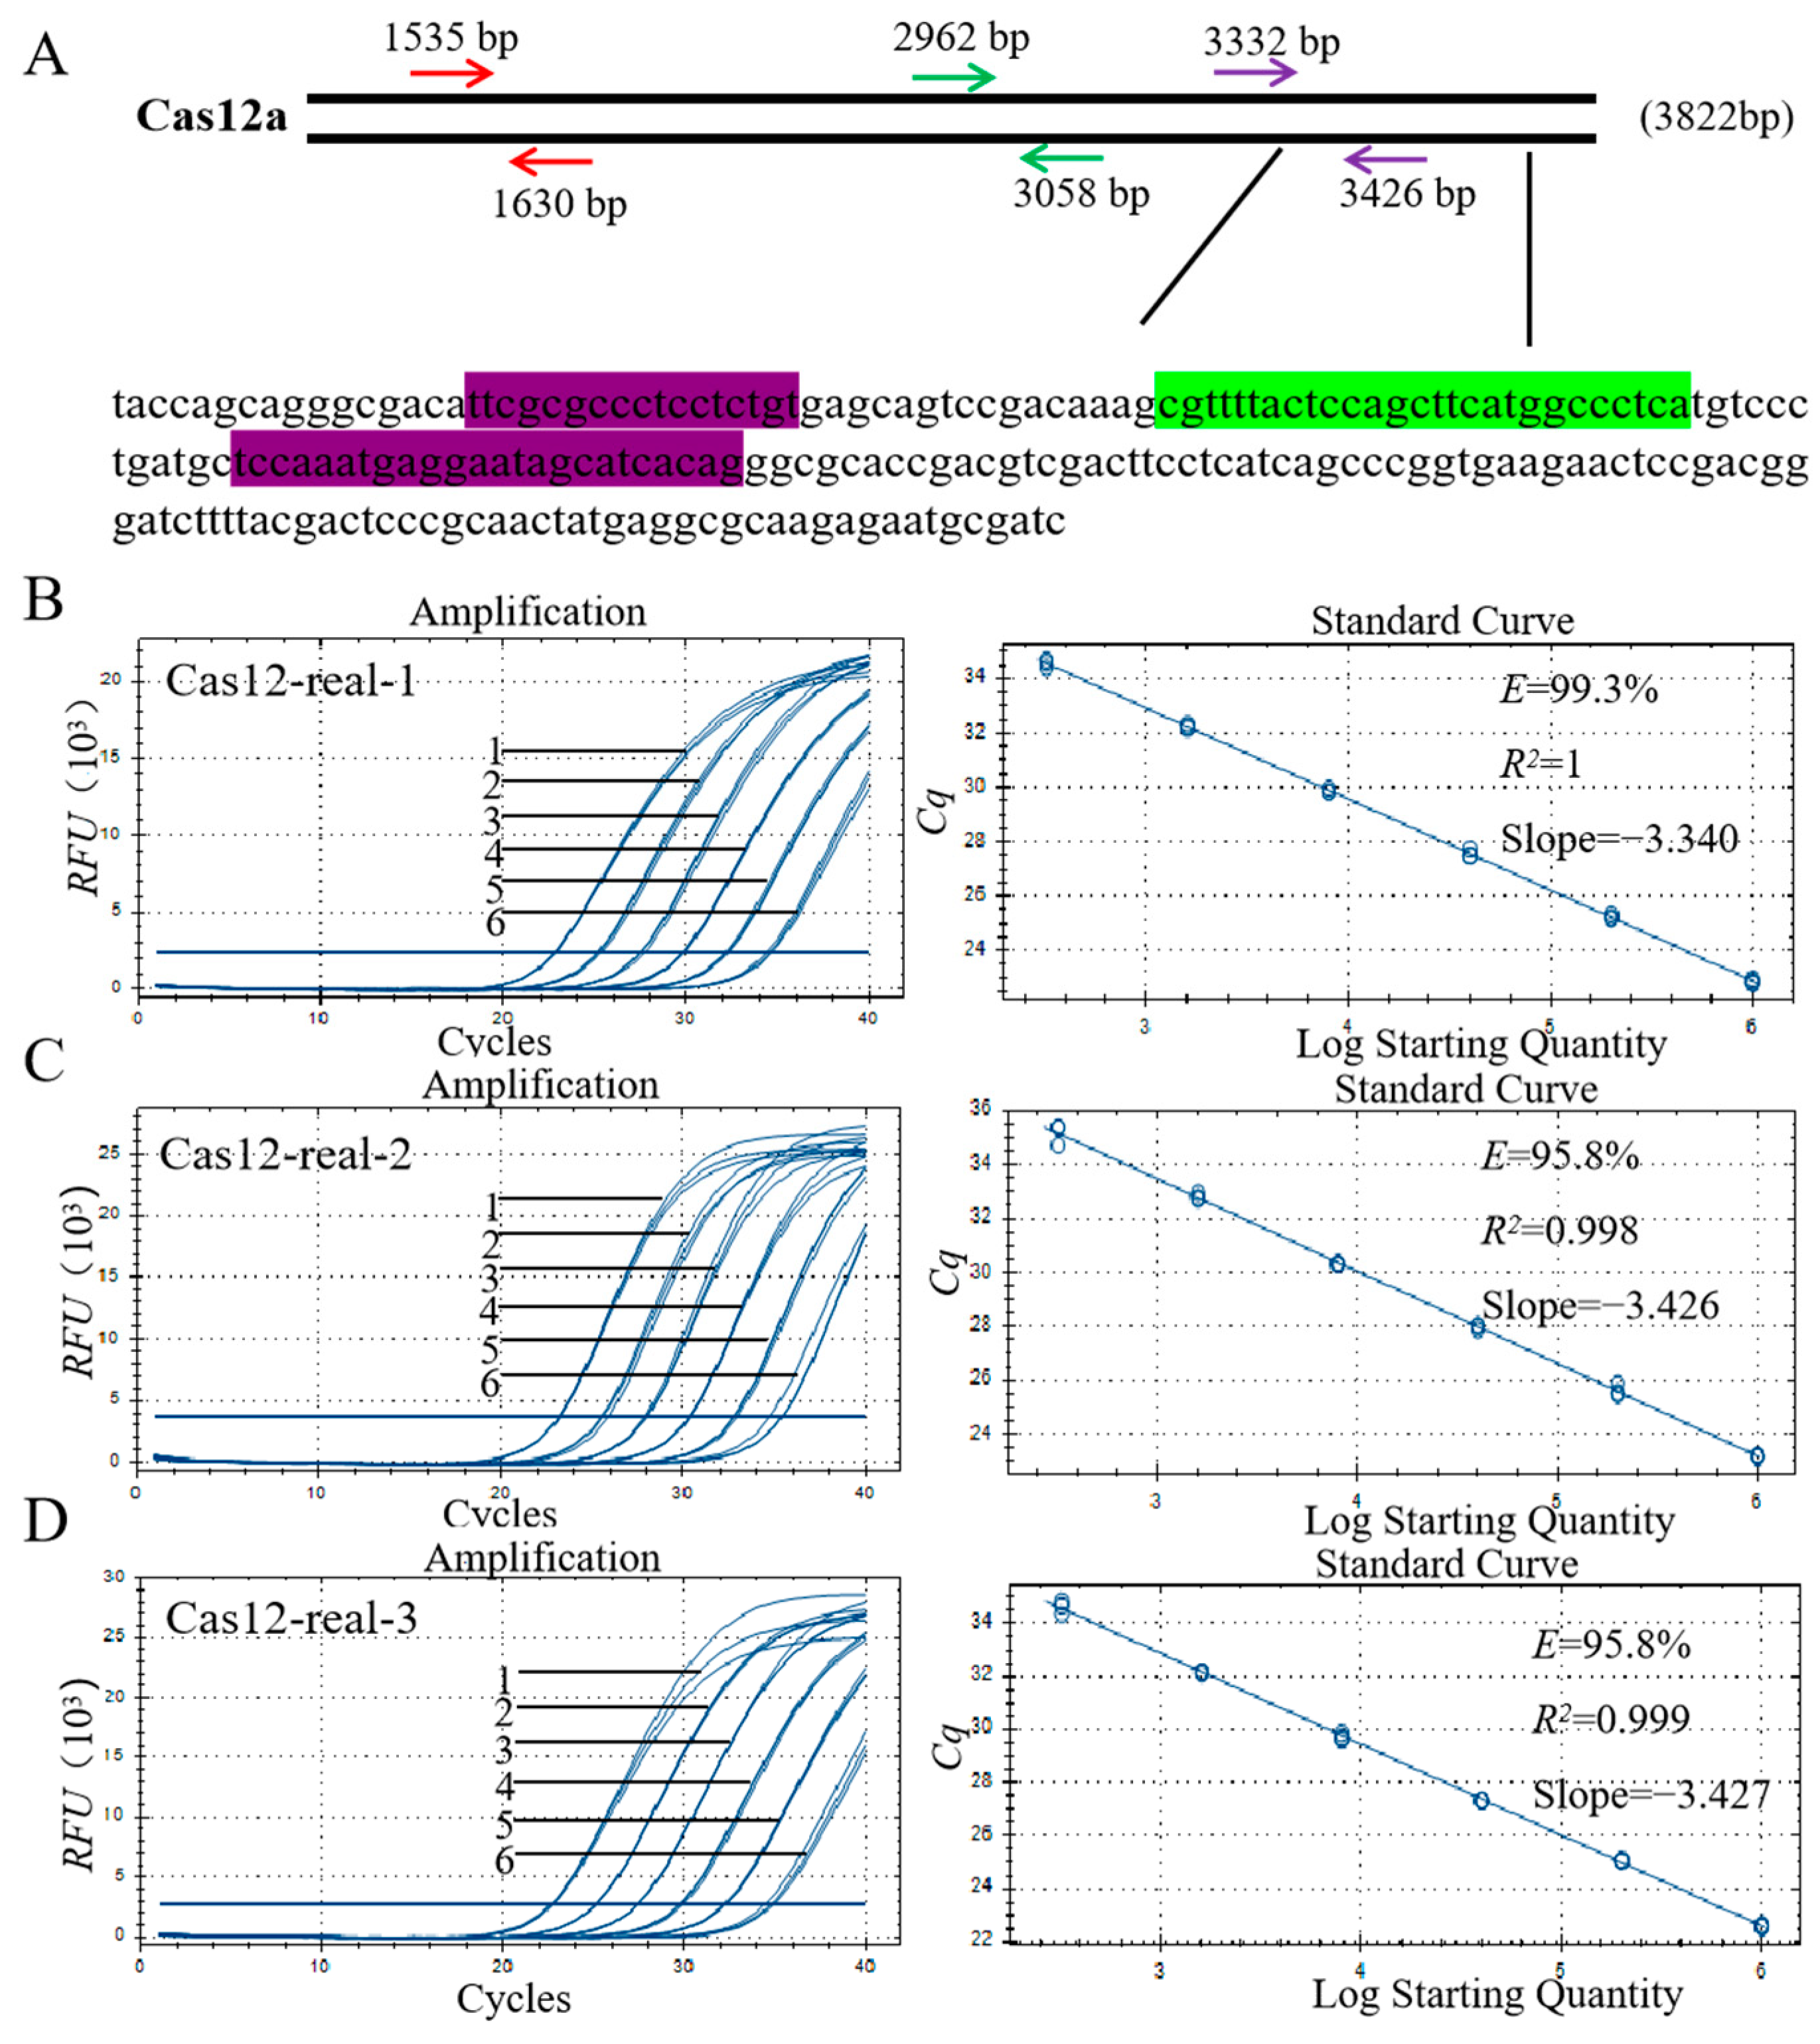
3.5. Primer Design and Screening for qPCR
3.6. Specificity Assay for the qPCR Method
3.7. Sensitivity Analysis of the qPCR Method
4. Discussion
5. Conclusions
Supplementary Materials
Author Contributions
Funding
Data Availability Statement
Acknowledgments
Conflicts of Interest
References
- Gasiunas, G.; Barrangou, R.; Horvath, P.; Siksnys, V. Cas9–crRNA ribonucleoprotein complex mediates specific DNA cleavage for adaptive immunity in bacteria. Proc. Natl. Acad. Sci. USA 2012, 109, E2579–E2586. [Google Scholar] [CrossRef] [PubMed]
- Cong, L.; Ran, F.A.; Cox, D.; Lin, S.; Barretto, R.; Habib, N.; Hsu, P.D.; Wu, X.; Jiang, W.; Marraffini, L.A.; et al. Multiplex Genome Engineering Using CRISPR/Cas Systems. Science 2013, 339, 819–823. [Google Scholar] [CrossRef] [PubMed]
- Terns, M.P.; Terns, R.M. CRISPR-based adaptive immune systems. Curr. Opin. Microbiol. 2011, 14, 321–327. [Google Scholar] [CrossRef] [PubMed]
- Ishino, Y.; Shinagawa, H.; Makino, K.; Amemura, M.; Nakata, A. Nucleotide Sequence of the iap Gene, Responsible for Alkaline Phosphatase Isozyme Conversion in Escherichia coli, and Identification of the Gene Product. J. Bacteriol. 1987, 169, 5429–5433. [Google Scholar] [CrossRef] [PubMed]
- Mojica, F.J.M.; Díez-Villaseñor, C.; Soria, E.; Juez, G. Biological significance of a family of regularly spaced repeats in the genomes of Archaea, Bacteria and mitochondria. Mol. Microbiol. 2000, 36, 244–246. [Google Scholar] [CrossRef]
- Gong, C.; Huang, S.; Song, R.; Qi, W. Comparative Study between the CRISPR/Cpf1 (Cas12a) and CRISPR/Cas9 Systems for Multiplex Gene Editing in Maize. Agriculture 2021, 11, 429. [Google Scholar] [CrossRef]
- Slaymaker, I.M.; Gao, L.; Zetsche, B.; Scott, D.A.; Yan, W.X.; Zhang, F. Rationally engineered Cas9 nucleases with improved specificity. Science 2016, 351, 84–88. [Google Scholar] [CrossRef]
- Shmakov, S.; Smargon, A.; Scott, D.; Cox, D.; Pyzocha, N.; Yan, W.; Abudayyeh, O.O.; Gootenberg, J.S.; Makarova, K.S.; Wolf, Y.I.; et al. Diversity and evolution of class 2 CRISPR–Cas systems. Nat. Rev. Microbiol. 2017, 15, 169–182. [Google Scholar] [CrossRef]
- Zetsche, B.; Heidenreich, M.; Mohanraju, P.; Fedorova, I.; Kneppers, J.; DeGennaro, E.M.; Winblad, N.; Choudhury, S.R.; Abudayyeh, O.O.; Gootenberg, J.S.; et al. Multiplex gene editing by CRISPR–Cpf1 using a single crRNA array. Nat. Biotechnol. 2017, 35, 31–34. [Google Scholar] [CrossRef]
- Swarts, D.C.; van der Oost, J.; Jinek, M. Structural Basis for Guide RNA Processing and Seed-Dependent DNA Targeting by CRISPR-Cas12a. Mol. Cell 2017, 66, 221–233. [Google Scholar] [CrossRef]
- Zetsche, B.; Gootenberg, J.S.; Abudayyeh, O.O.; Slaymaker, I.M.; Makarova, K.S.; Essletzbichler, P.; Volz, S.E.; Joung, J.; van der Oost, J.; Regev, A.; et al. Cpf1 is a single RNA-guided endonuclease of a class 2 CRISPR-Cas system. Cell 2015, 163, 759–771. [Google Scholar] [CrossRef]
- Gao, Z.; Fan, M.; Das, A.T.; Herrera-Carrillo, E.; Berkhout, B. Extinction of all infectious HIV in cell culture by the CRISPR-Cas12a system with only a single crRNA. Nucleic Acids Res. 2020, 48, 5527–5539. [Google Scholar] [CrossRef] [PubMed]
- Zaidi, S.S.-e.-A.; Mahfouz, M.M.; Mansoor, S. CRISPR-Cpf1: A New Tool for Plant Genome Editing. Trends Plant Sci. 2017, 22, 550–553. [Google Scholar] [CrossRef] [PubMed]
- Safari, F.; Zare, K.; Negahdaripour, M.; Barekati-Mowahed, M.; Ghasemi, Y. CRISPR Cpf1 proteins: Structure, function and implications for genome editing. Cell Biosci. 2019, 9, 36. [Google Scholar] [CrossRef] [PubMed]
- Modrzejewski, D.; Hartung, F.; Lehnert, H.; Sprink, T.; Kohl, C.; Keilwagen, J.; Wilhelm, R. Which Factors Affect the Occurrence of Off-Target Effects Caused by the Use of CRISPR/Cas: A Systematic Review in Plants. Front. Plant Sci. 2020, 11, 574959. [Google Scholar] [CrossRef] [PubMed]
- Wang, M.; Mao, Y.; Lu, Y.; Tao, X.; Zhu, J.K. Multiplex Gene Editing in Rice Using the CRISPR-Cpf1 System. Mol. Plant 2017, 10, 1011–1013. [Google Scholar] [CrossRef]
- Garcia-Doval, C.; Jinek, M. Molecular architectures and mechanisms of Class 2 CRISPR-associated nucleases. Curr. Opin. Struct. Biol. 2017, 47, 157–166. [Google Scholar] [CrossRef]
- Zhu, X.; Yang, H.; Wang, M.; Wu, M.; Khan, M.R.; Luo, A.; Deng, S.; Busquets, R.; He, G.; Deng, R. Label-Free Detection of Transgenic Crops Using an Isothermal Amplification Reporting CRISPR/Cas12 Assay. ACS Synth. Biol. 2022, 11, 317–324. [Google Scholar] [CrossRef]
- Wu, Y.; Dong, Y.; Shi, Y.; Yang, H.; Zhang, J.; Khan, M.R.; Deng, S.; He, G.; He, Q.; Lv, Y.; et al. CRISPR-Cas12-Based Rapid Authentication of Halal Food. J. Agric. Food Chem. 2021, 69, 10321–10328. [Google Scholar] [CrossRef]
- Zhang, T.; Li, H.T.; Xia, X.; Liu, J.; Lu, Y.; Khan, M.R.; Deng, S.; Busquets, R.; He, G.; He, Q.; et al. Direct Detection of Foodborne Pathogens via a Proximal DNA Probe-Based CRISPR-Cas12 Assay. J. Agric. Food Chem. 2021, 69, 12828–12836. [Google Scholar] [CrossRef]
- Huang, S.; Weigel, D.; Beachy, R.N.; Li, J. A proposed regulatory framework for genome-edited crops. Nat. Genet. 2016, 48, 109–111. [Google Scholar] [CrossRef] [PubMed]
- Ding, L.; Wang, H.; Zhang, M.; Wang, Y.; Wang, X.; Chen, X.; Xu, J.; Zhang, X.; Peng, C. Study of Qualitative and Quantitative Detection Methods for Exogenous Gene Cas9 in Gene Editing. J. Agric. Biotechnol. 2022, 30, 1855–1868. [Google Scholar] [CrossRef]
- Li, B.; Rui, H.; Li, Y.; Wang, Q.; Alariqi, M.; Qin, L.; Sun, L.; Ding, X.; Wang, F.; Zou, J.; et al. Robust CRISPR/Cpf1 (Cas12a)-mediated genome editing in allotetraploid cotton (Gossypium hirsutum). Plant Biotechnol. J. 2019, 17, 1862–1864. [Google Scholar] [CrossRef] [PubMed]
- Peng, C.; Wang, H.; Xu, X.; Wang, X.; Chen, X.; Wei, W.; Lai, Y.; Liu, G.; Godwin, I.D.; Li, J.; et al. High-throughput detection and screening of plants modified by gene editing using quantitative real-time polymerase chain reaction. Plant J. 2018, 95, 557–567. [Google Scholar] [CrossRef]
- Xu, J.F.; Wang, P.F.; Li, Y.Y.; Wang, X.F.; Chen, X.Y.; Peng, C.; Miao, Q.M. Comparison of Four Qualitative PCR- based Detection Methords of CaMV35S and tNOS Elements in Transgenic Plants. J. Agric. Biotechnol. 2015, 23, 397–407. [Google Scholar] [CrossRef]
- Wang, X.X.; Yang, J.L.; Song, Q.; Li, X.; Liu, Y.M.; Pan, L.W. Establishment of a Novel Event- specific Quantitative PCR Method for Genetically Modified Cotton (Gossypium sp.) GHB119 Detection. J. Agric. Biotechnol. 2014, 22, 380–388. [Google Scholar] [CrossRef]
- Wang, X.F.; Chen, X.Y.; Miao, Q.M.; Zhao, Z.B.; Liu, H.; Zhu, S.Q.; Xu, J.F. Analysis and Quality Control for the Detection of Transgenic in FAPAS Proficiency Tests. J. Chin. Inst. Food Sci. Technol. 2016, 16, 224–230. [Google Scholar] [CrossRef]
- Yang, H.; Peng, C.; Xiao, Y.; Wang, X.; Xu, J. Study of Conventional PCR and qRT- PCR Detection Methods for Genetically Modified Soybean (Glycine max) SHZD32-1. J. Agric. Biotechnol. 2018, 26, 492–501. [Google Scholar]
- Kim, H.; Kim, S.T.; Ryu, J.; Kang, B.C.; Kim, J.S.; Kim, S.G. CRISPR/Cpf1-mediated DNA-free plant genome editing. Nat. Commun. 2017, 8, 14406. [Google Scholar] [CrossRef]
- Xu, R.; Qin, R.; Li, H.; Li, D.; Li, L.; Wei, P.; Yang, J. Generation of targeted mutant rice using a CRISPR-Cpf1 system. Plant Biotechnol. J. 2017, 15, 713–717. [Google Scholar] [CrossRef]
- Wu, F.; Qiao, X.; Zhao, Y.; Zhang, Z.; Gao, Y.; Shi, L.; Du, H.; Wang, L.; Zhang, Y.J.; Zhang, Y.; et al. Targeted mutagenesis in Arabidopsis thaliana using CRISPR-Cas12b/C2c1. J. Integr. Plant Biol. 2020, 62, 1653–1658. [Google Scholar] [CrossRef] [PubMed]
- Vu, T.V.; Sivankalyani, V.; Kim, E.J.; Doan, D.T.H.; Tran, M.T.; Kim, J.; Sung, Y.W.; Park, M.; Kang, Y.J.; Kim, J.Y. Highly efficient homology-directed repair using CRISPR/Cpf1-geminiviral replicon in tomato. Plant Biotechnol. J. 2020, 18, 2133–2143. [Google Scholar] [CrossRef]
- Ferenczi, A.; Pyott, D.E.; Xipnitou, A.; Molnar, A. Efficient targeted DNA editing and replacement in Chlamydomonas reinhardtii using Cpf1 ribonucleoproteins and single-stranded DNA. Proc. Natl. Acad. Sci. USA 2017, 114, 13567–13572. [Google Scholar] [CrossRef] [PubMed]
- Jia, H.; Orbovic, V.; Wang, N. CRISPR-LbCas12a-mediated modification of citrus. Plant Biotechnol. J. 2019, 17, 1928–1937. [Google Scholar] [CrossRef] [PubMed]
- Barka, E.A.; Vatsa, P.; Sanchez, L.; Gaveau-Vaillant, N.; Jacquard, C.; Klenk, H.-P.; Clément, C.; Ouhdouch, Y.; van Wezel, G.P. Taxonomy, Physiology, and Natural Products of Actinobacteria. Microbiol. Mol. Biol. Rev. 2016, 80, 1–43. [Google Scholar] [CrossRef] [PubMed]
- Li, Q.; Chen, J.; Minton, N.P.; Zhang, Y.; Wen, Z.; Liu, J.; Yang, H.; Zeng, Z.; Ren, X.; Yang, J.; et al. CRISPR-based genome editing and expression control systems in Clostridium acetobutylicum and Clostridium beijerinckii. Biotechnol. J. 2016, 11, 961–972. [Google Scholar] [CrossRef] [PubMed]
- Zhou, Y.; Liu, X.; Wu, J.; Zhao, G.; Wang, J. CRISPR-Cas12a-Assisted Genome Editing in Amycolatopsis mediterranei. Front. Bioeng. Biotechnol. 2020, 8, 698. [Google Scholar] [CrossRef] [PubMed]
- Zhang, X.; Wang, J.; Cheng, Q.; Zheng, X.; Zhao, G. Multiplex gene regulation by CRISPR-ddCpf1. Cell Discov. 2017, 3, 17018. [Google Scholar] [CrossRef]
- Jiang, Y.; Qian, F.; Yang, J.; Liu, Y.; Dong, F.; Xu, C.; Sun, B.; Chen, B.; Xu, X.; Li, Y.; et al. CRISPR-Cpf1 assisted genome editing of Corynebacterium glutamicum. Nat. Commun. 2017, 8, 15179. [Google Scholar] [CrossRef]
- Tsukamoto, T.; Sakai, E.; Iizuka, S.; Taracena-Gándara, M.; Sakurai, F.; Mizuguchi, H. Generation of the Adenovirus Vector-Mediated CRISPR/Cpf1 System and the Application for Primary Human Hepatocytes Prepared from Humanized Mice with Chimeric Liver. Biol. Pharm. Bull. 2018, 41, 1089–1095. [Google Scholar] [CrossRef]
- Zhang, Y.; Long, C.Z.; Li, H.; McAnally, J.R.; Baskin, K.K.; Shelton, J.M.; Bassel-Duby, R.; Olson, E.N. CRISPR-Cpf1 correction of muscular dystrophy mutations in human cardiomyocytes and mice. Sci. Adv. 2017, 3, e1602814. [Google Scholar] [CrossRef] [PubMed]
- Wu, H.; Liu, Q.; Shi, H.; Xie, J.; Zhang, Q.; Ouyang, Z.; Li, N.; Yang, Y.; Liu, Z.; Zhao, Y.; et al. Engineering CRISPR/Cpf1 with tRNA promotes genome editing capability in mammalian systems. Cell. Mol. Life Sci. 2018, 75, 3593–3607. [Google Scholar] [CrossRef] [PubMed]
- Li, S.Y.; Cheng, Q.X.; Wang, J.M.; Li, X.Y.; Zhang, Z.L.; Gao, S.; Cao, R.B.; Zhao, G.P.; Wang, J. CRISPR-Cas12a-assisted nucleic acid detection. Cell Discov. 2018, 4, 20. [Google Scholar] [CrossRef] [PubMed]
Disclaimer/Publisher’s Note: The statements, opinions and data contained in all publications are solely those of the individual author(s) and contributor(s) and not of MDPI and/or the editor(s). MDPI and/or the editor(s) disclaim responsibility for any injury to people or property resulting from any ideas, methods, instructions or products referred to in the content. |
© 2023 by the authors. Licensee MDPI, Basel, Switzerland. This article is an open access article distributed under the terms and conditions of the Creative Commons Attribution (CC BY) license (https://creativecommons.org/licenses/by/4.0/).
Share and Cite
Ding, L.; Xu, X.; Wang, X.; Chen, X.; Lu, Y.; Xu, J.; Peng, C. Qualitative and Quantitative Detection of CRISPR-Associated Cas Gene in Gene-Edited Foods. Foods 2023, 12, 3681. https://doi.org/10.3390/foods12193681
Ding L, Xu X, Wang X, Chen X, Lu Y, Xu J, Peng C. Qualitative and Quantitative Detection of CRISPR-Associated Cas Gene in Gene-Edited Foods. Foods. 2023; 12(19):3681. https://doi.org/10.3390/foods12193681
Chicago/Turabian StyleDing, Lin, Xiaoli Xu, Xiaofu Wang, Xiaoyun Chen, Yuwen Lu, Junfeng Xu, and Cheng Peng. 2023. "Qualitative and Quantitative Detection of CRISPR-Associated Cas Gene in Gene-Edited Foods" Foods 12, no. 19: 3681. https://doi.org/10.3390/foods12193681
APA StyleDing, L., Xu, X., Wang, X., Chen, X., Lu, Y., Xu, J., & Peng, C. (2023). Qualitative and Quantitative Detection of CRISPR-Associated Cas Gene in Gene-Edited Foods. Foods, 12(19), 3681. https://doi.org/10.3390/foods12193681