
Effects of Table Grape Cultivars on Fruit Quality and Aroma Components


Abstract
:1. Introduction
2. Materials and Methods
2.1. Samples
2.2. Physical–Chemical Analysis
2.3. Nutritional Quality Analysis
2.4. Aroma Compounds Determined Using Gas Chromatography–Mass Spectrometry
2.5. Sensory Evaluation Analysis
2.6. Statistical Analysis
3. Results and Discussion
3.1. Basic Physical and Chemical Quality of Different Table Grape Varieties
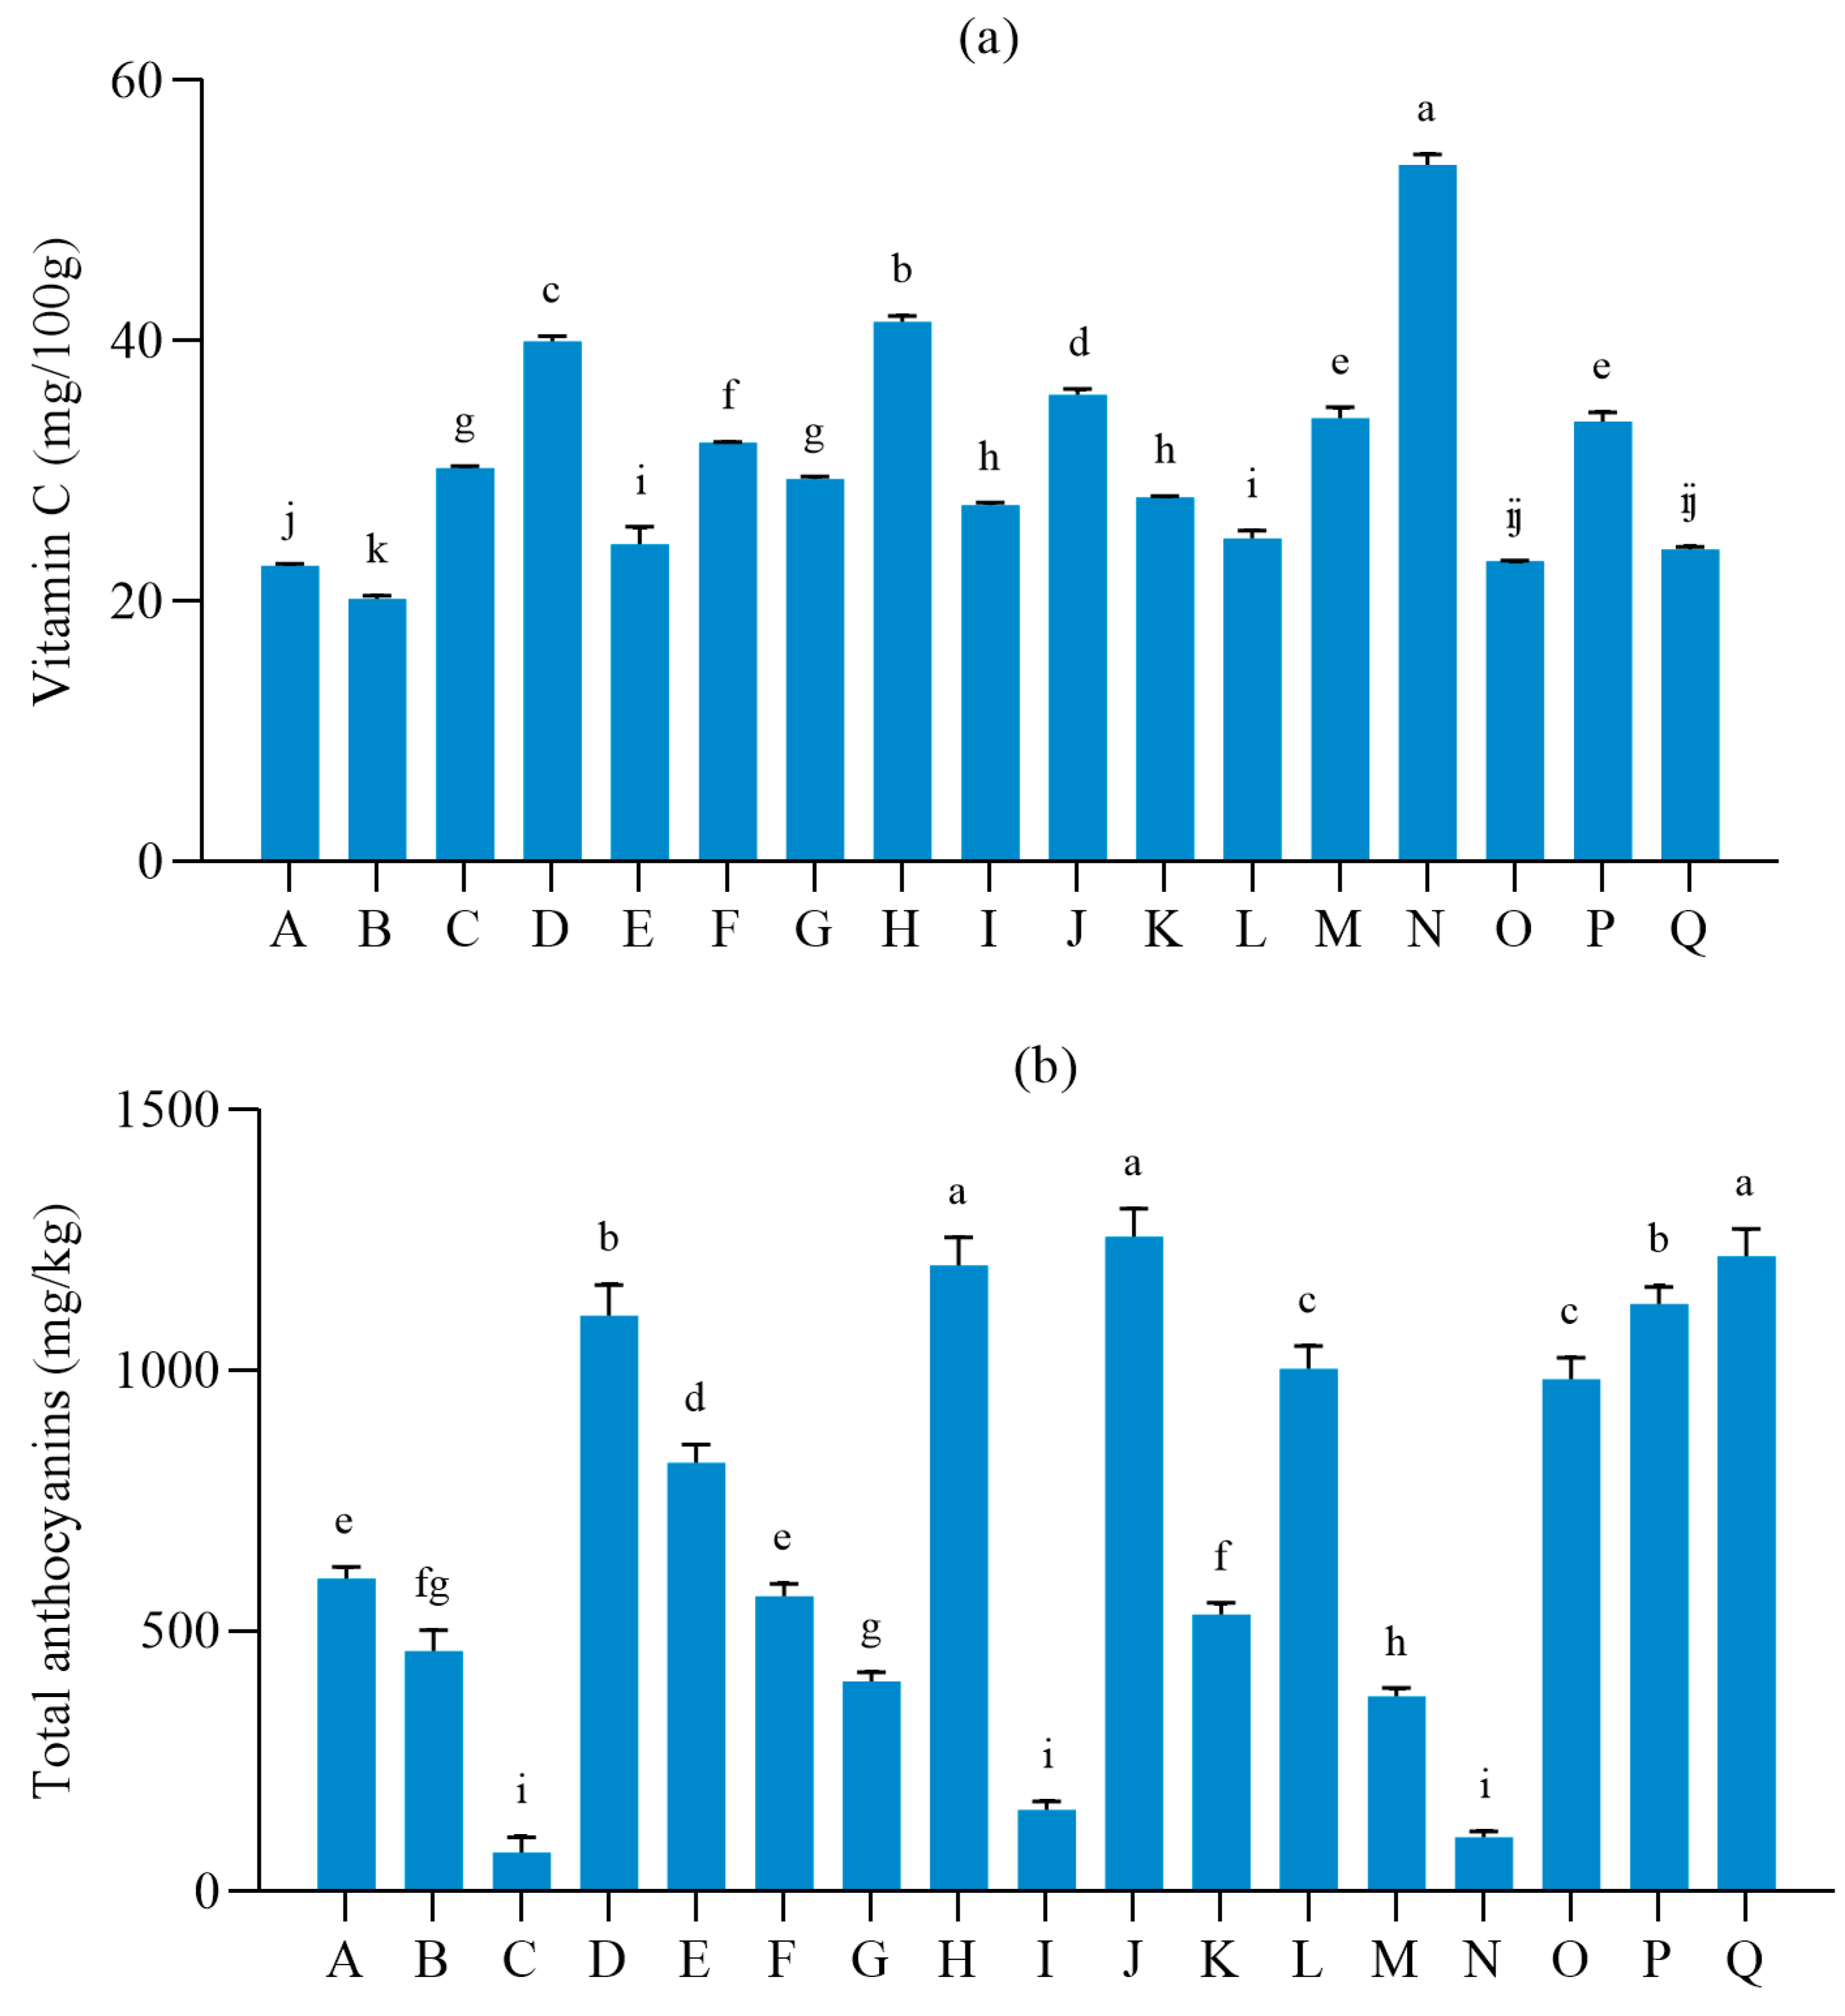
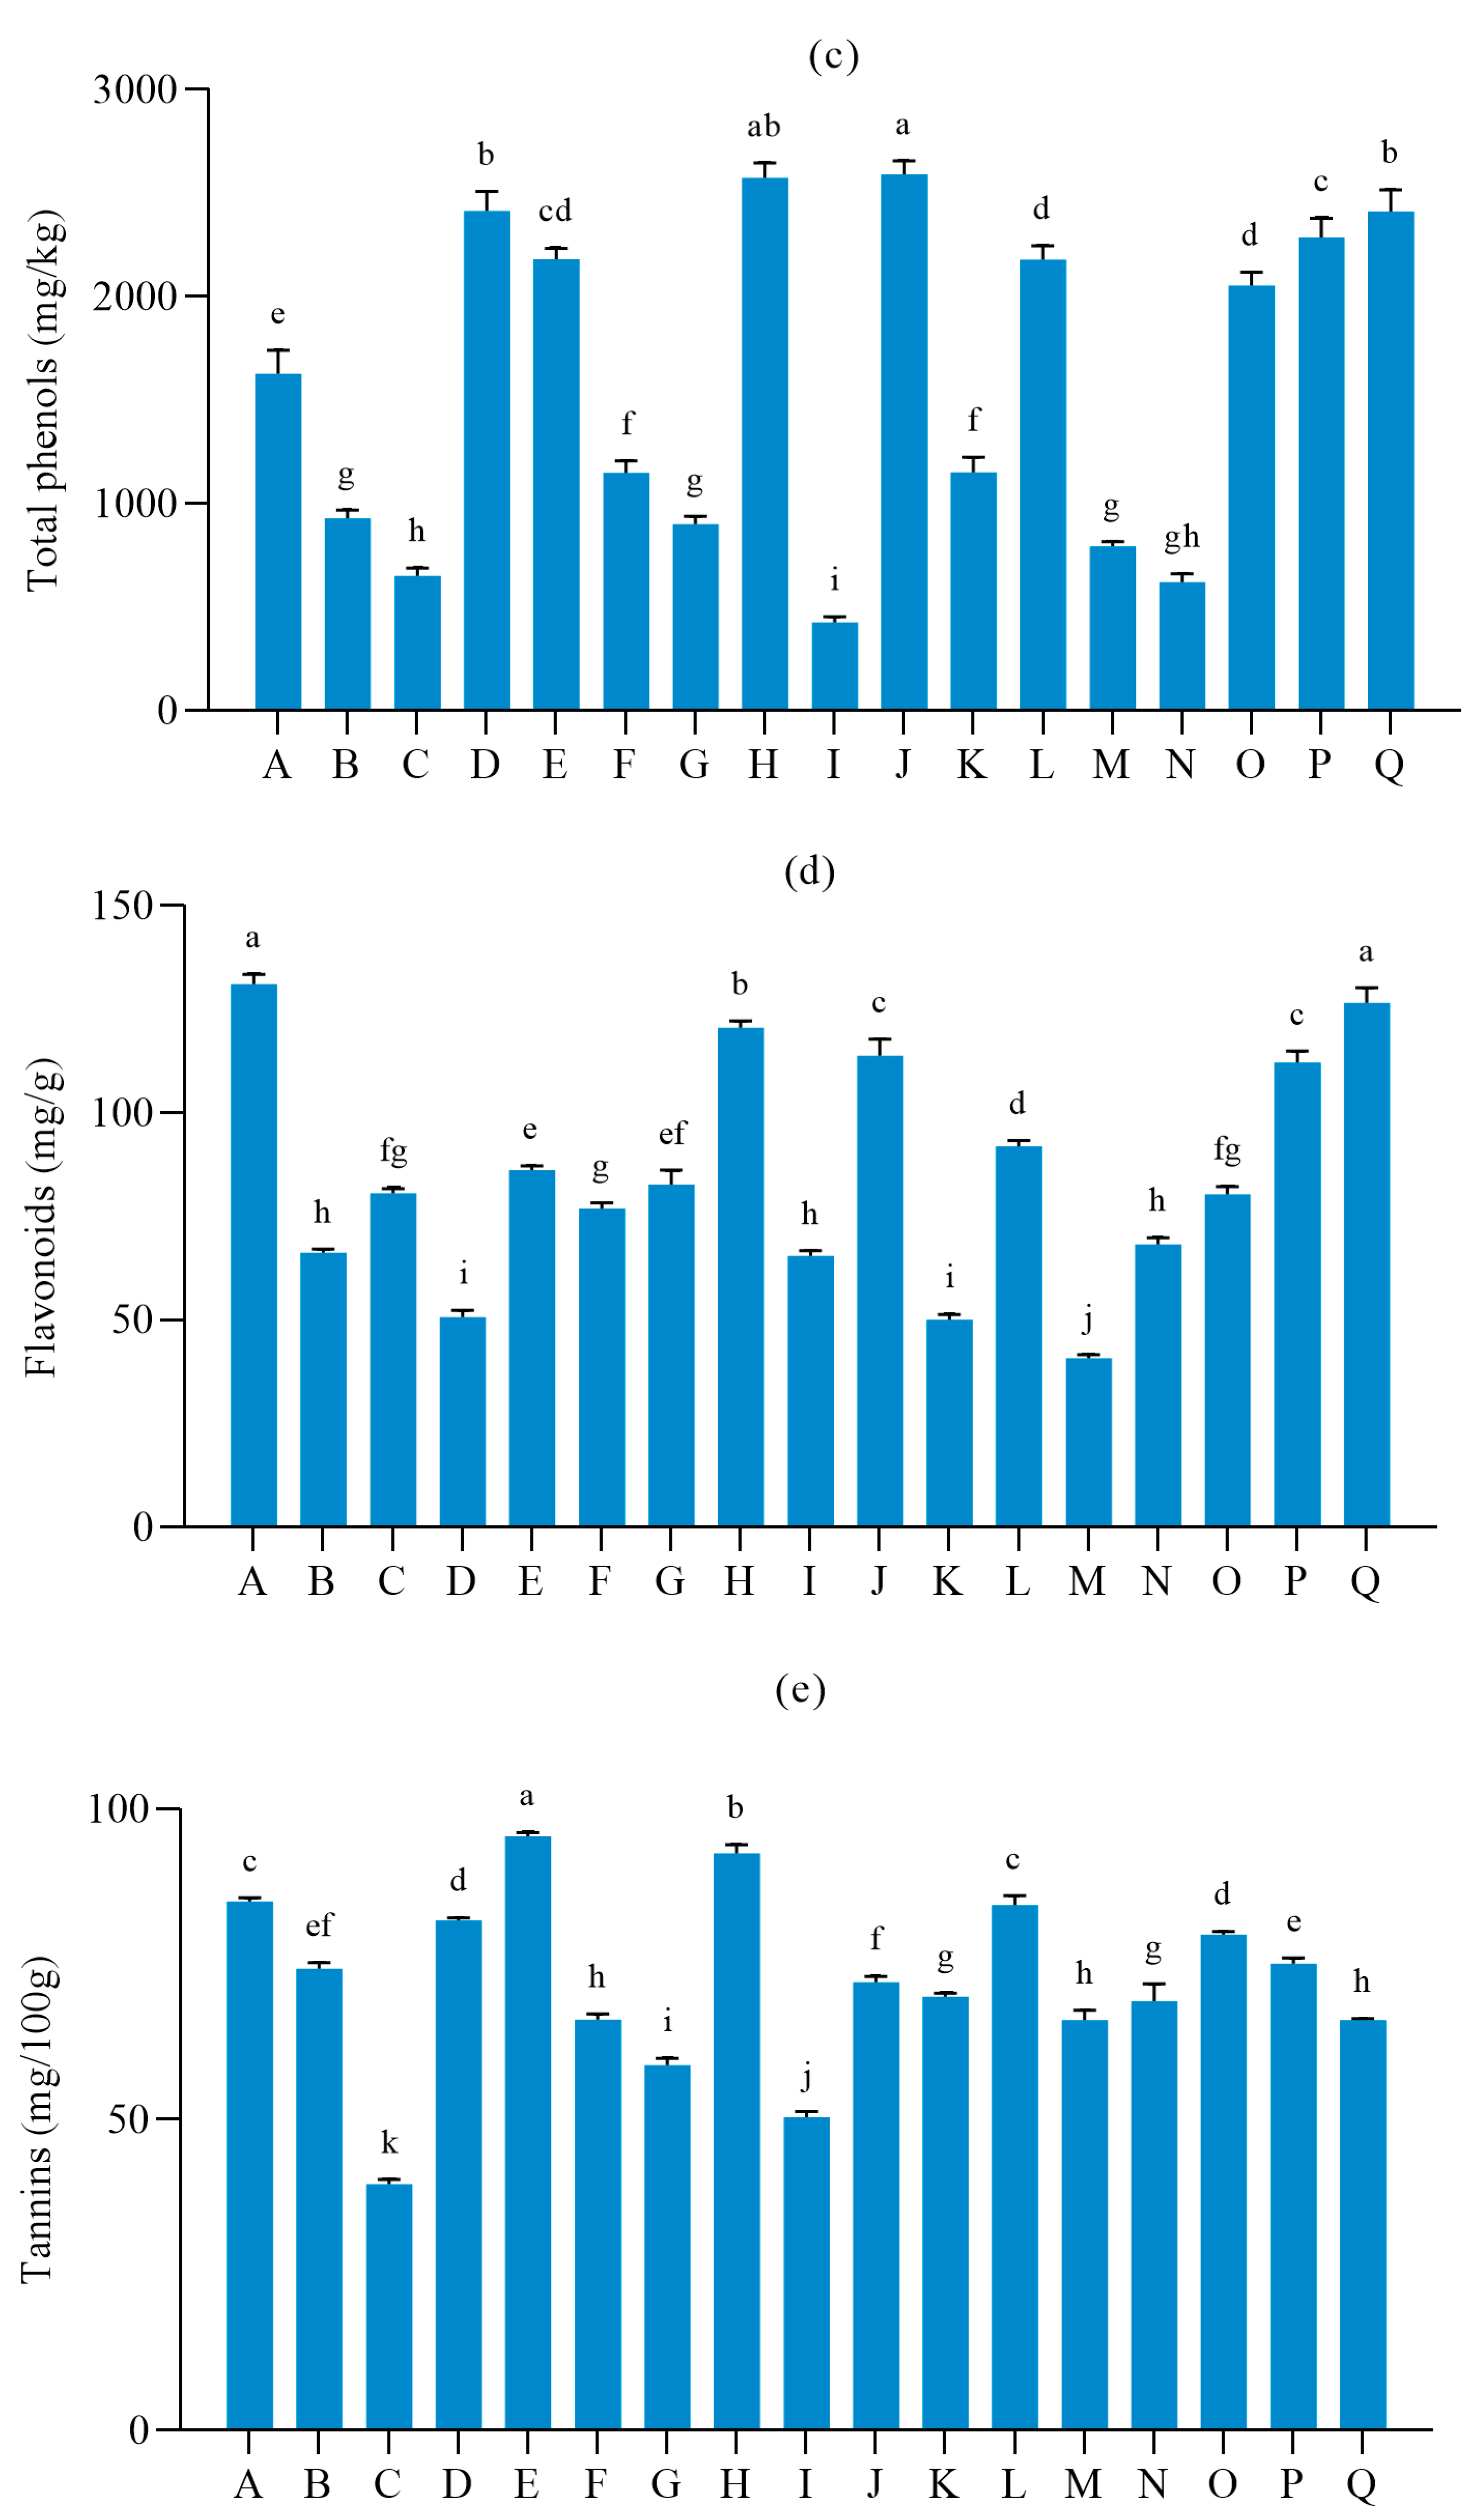
3.2. Nutritional Quality of Different Table Grape Varieties
3.3. Aroma Profiles of Different Table Grape Varieties
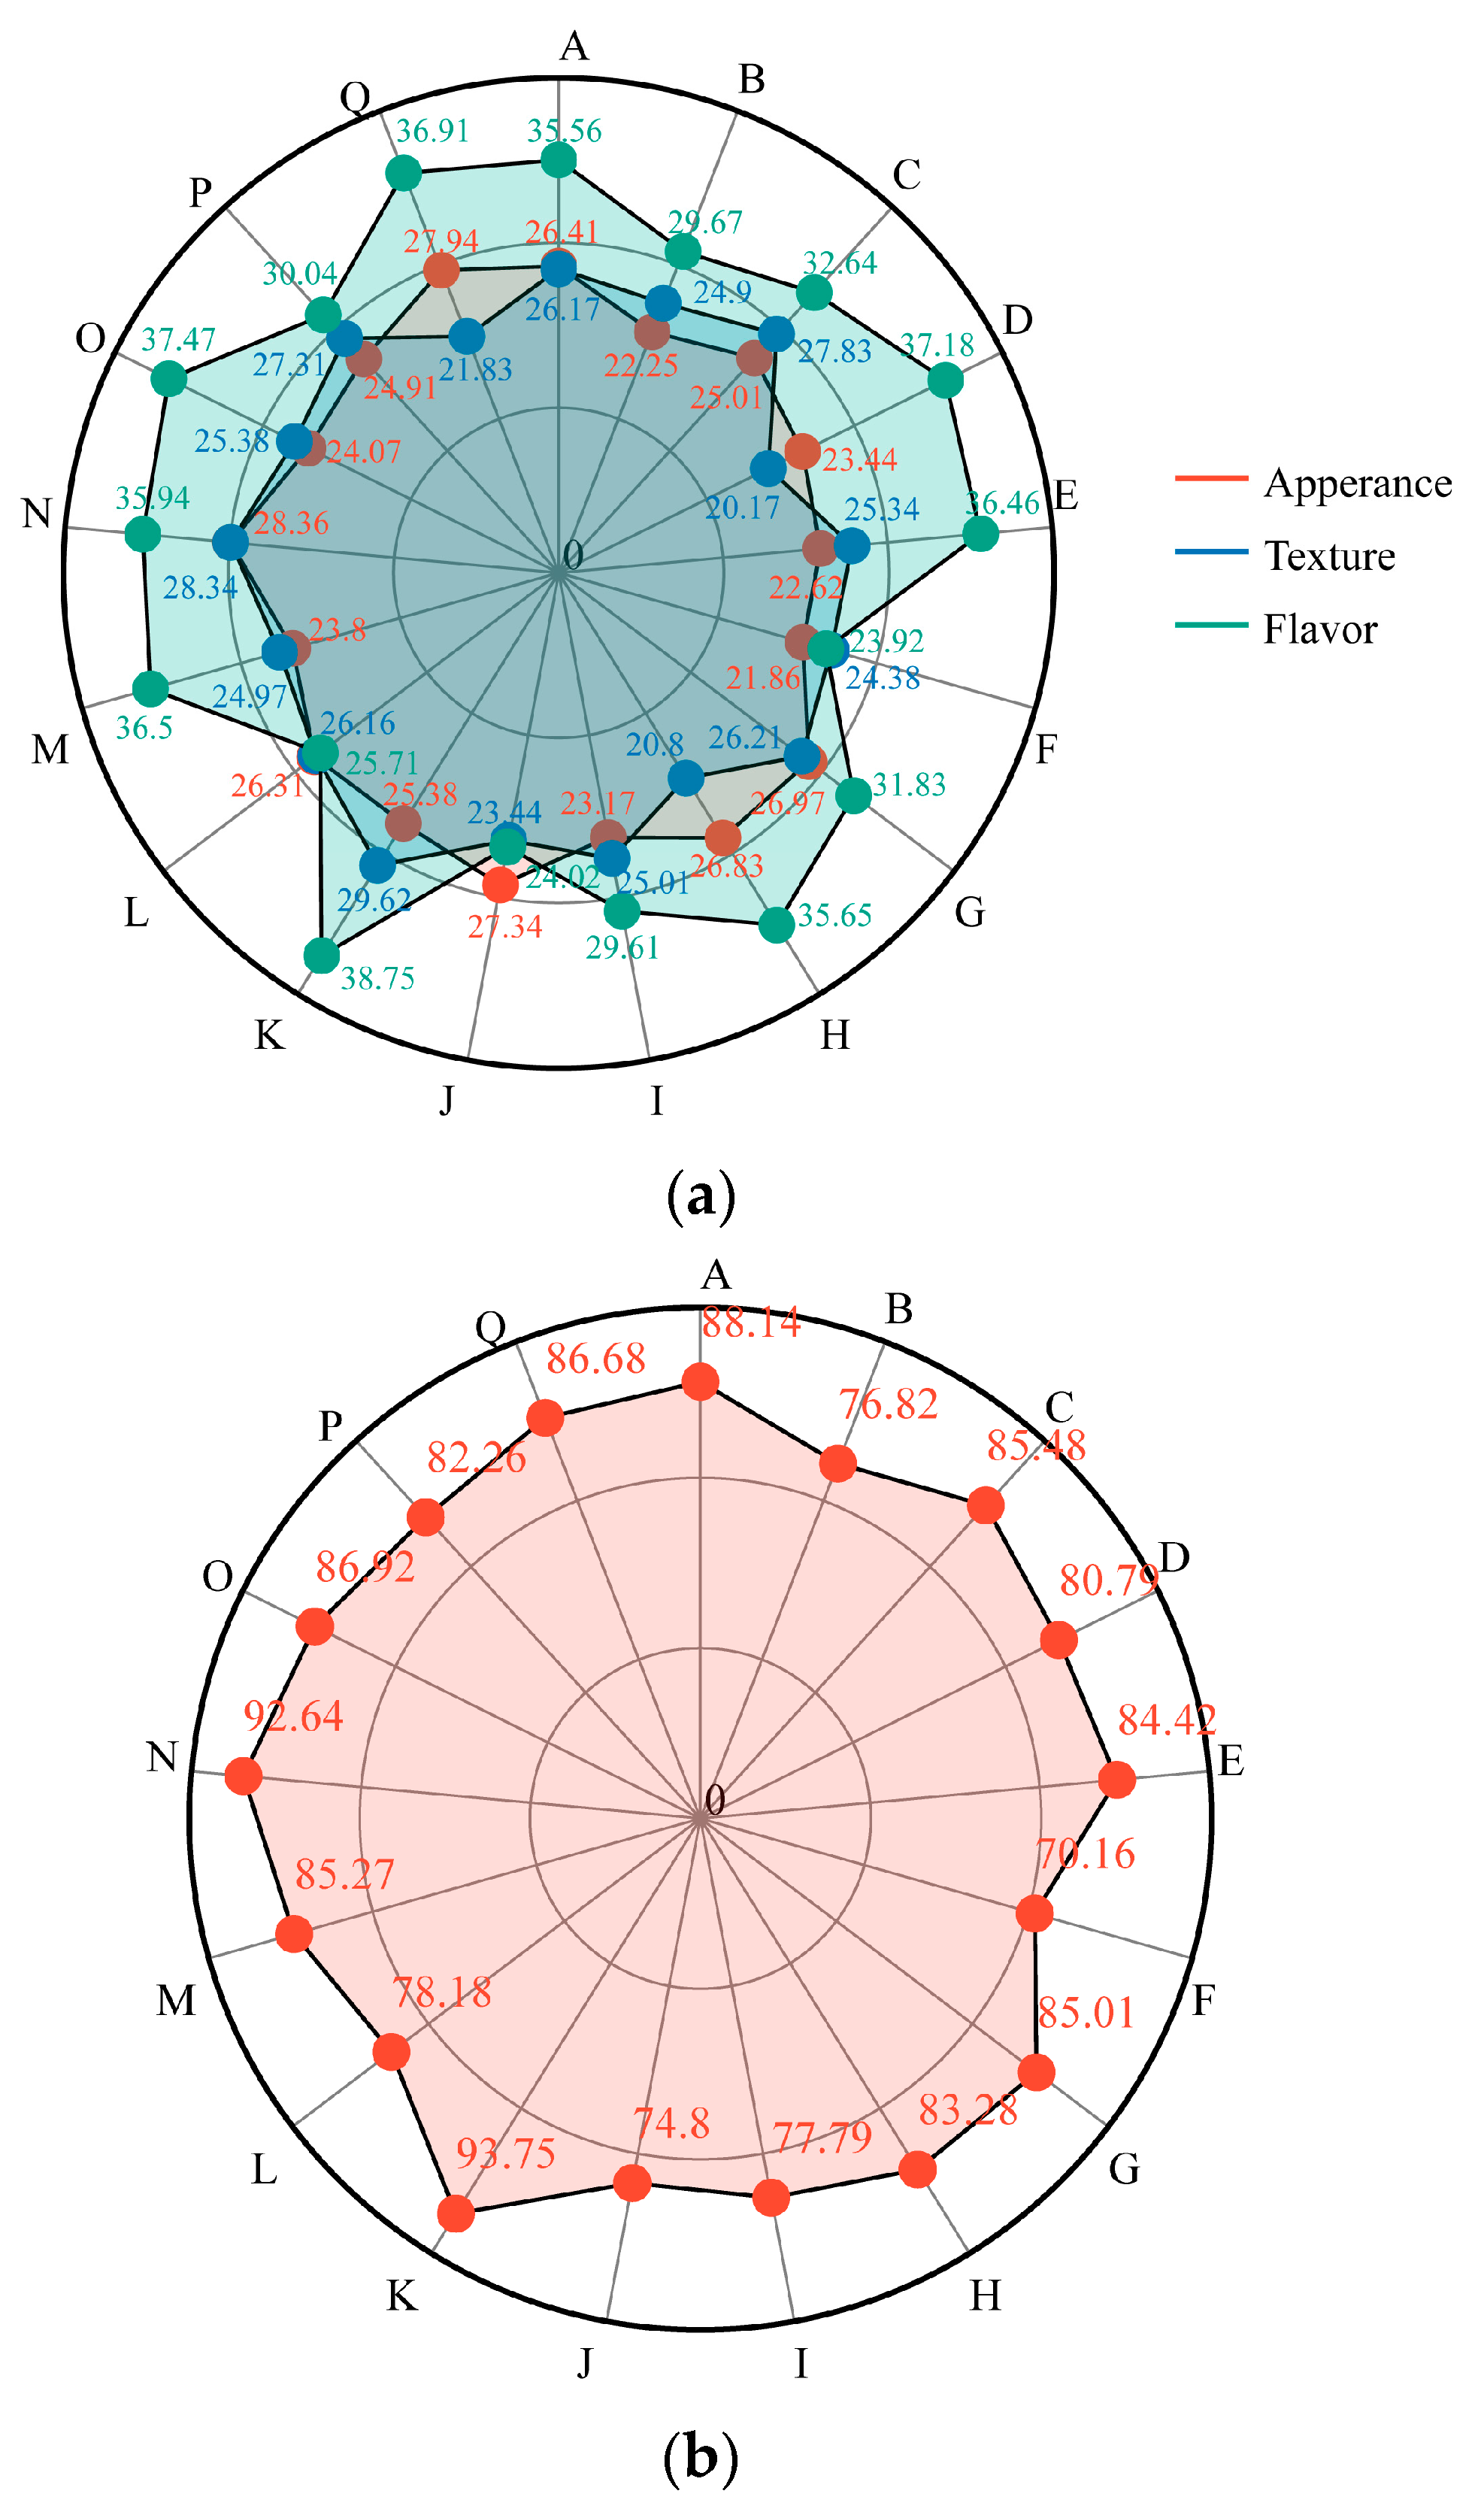
3.4. Sensory Evaluation of Different Table Grape Varieties
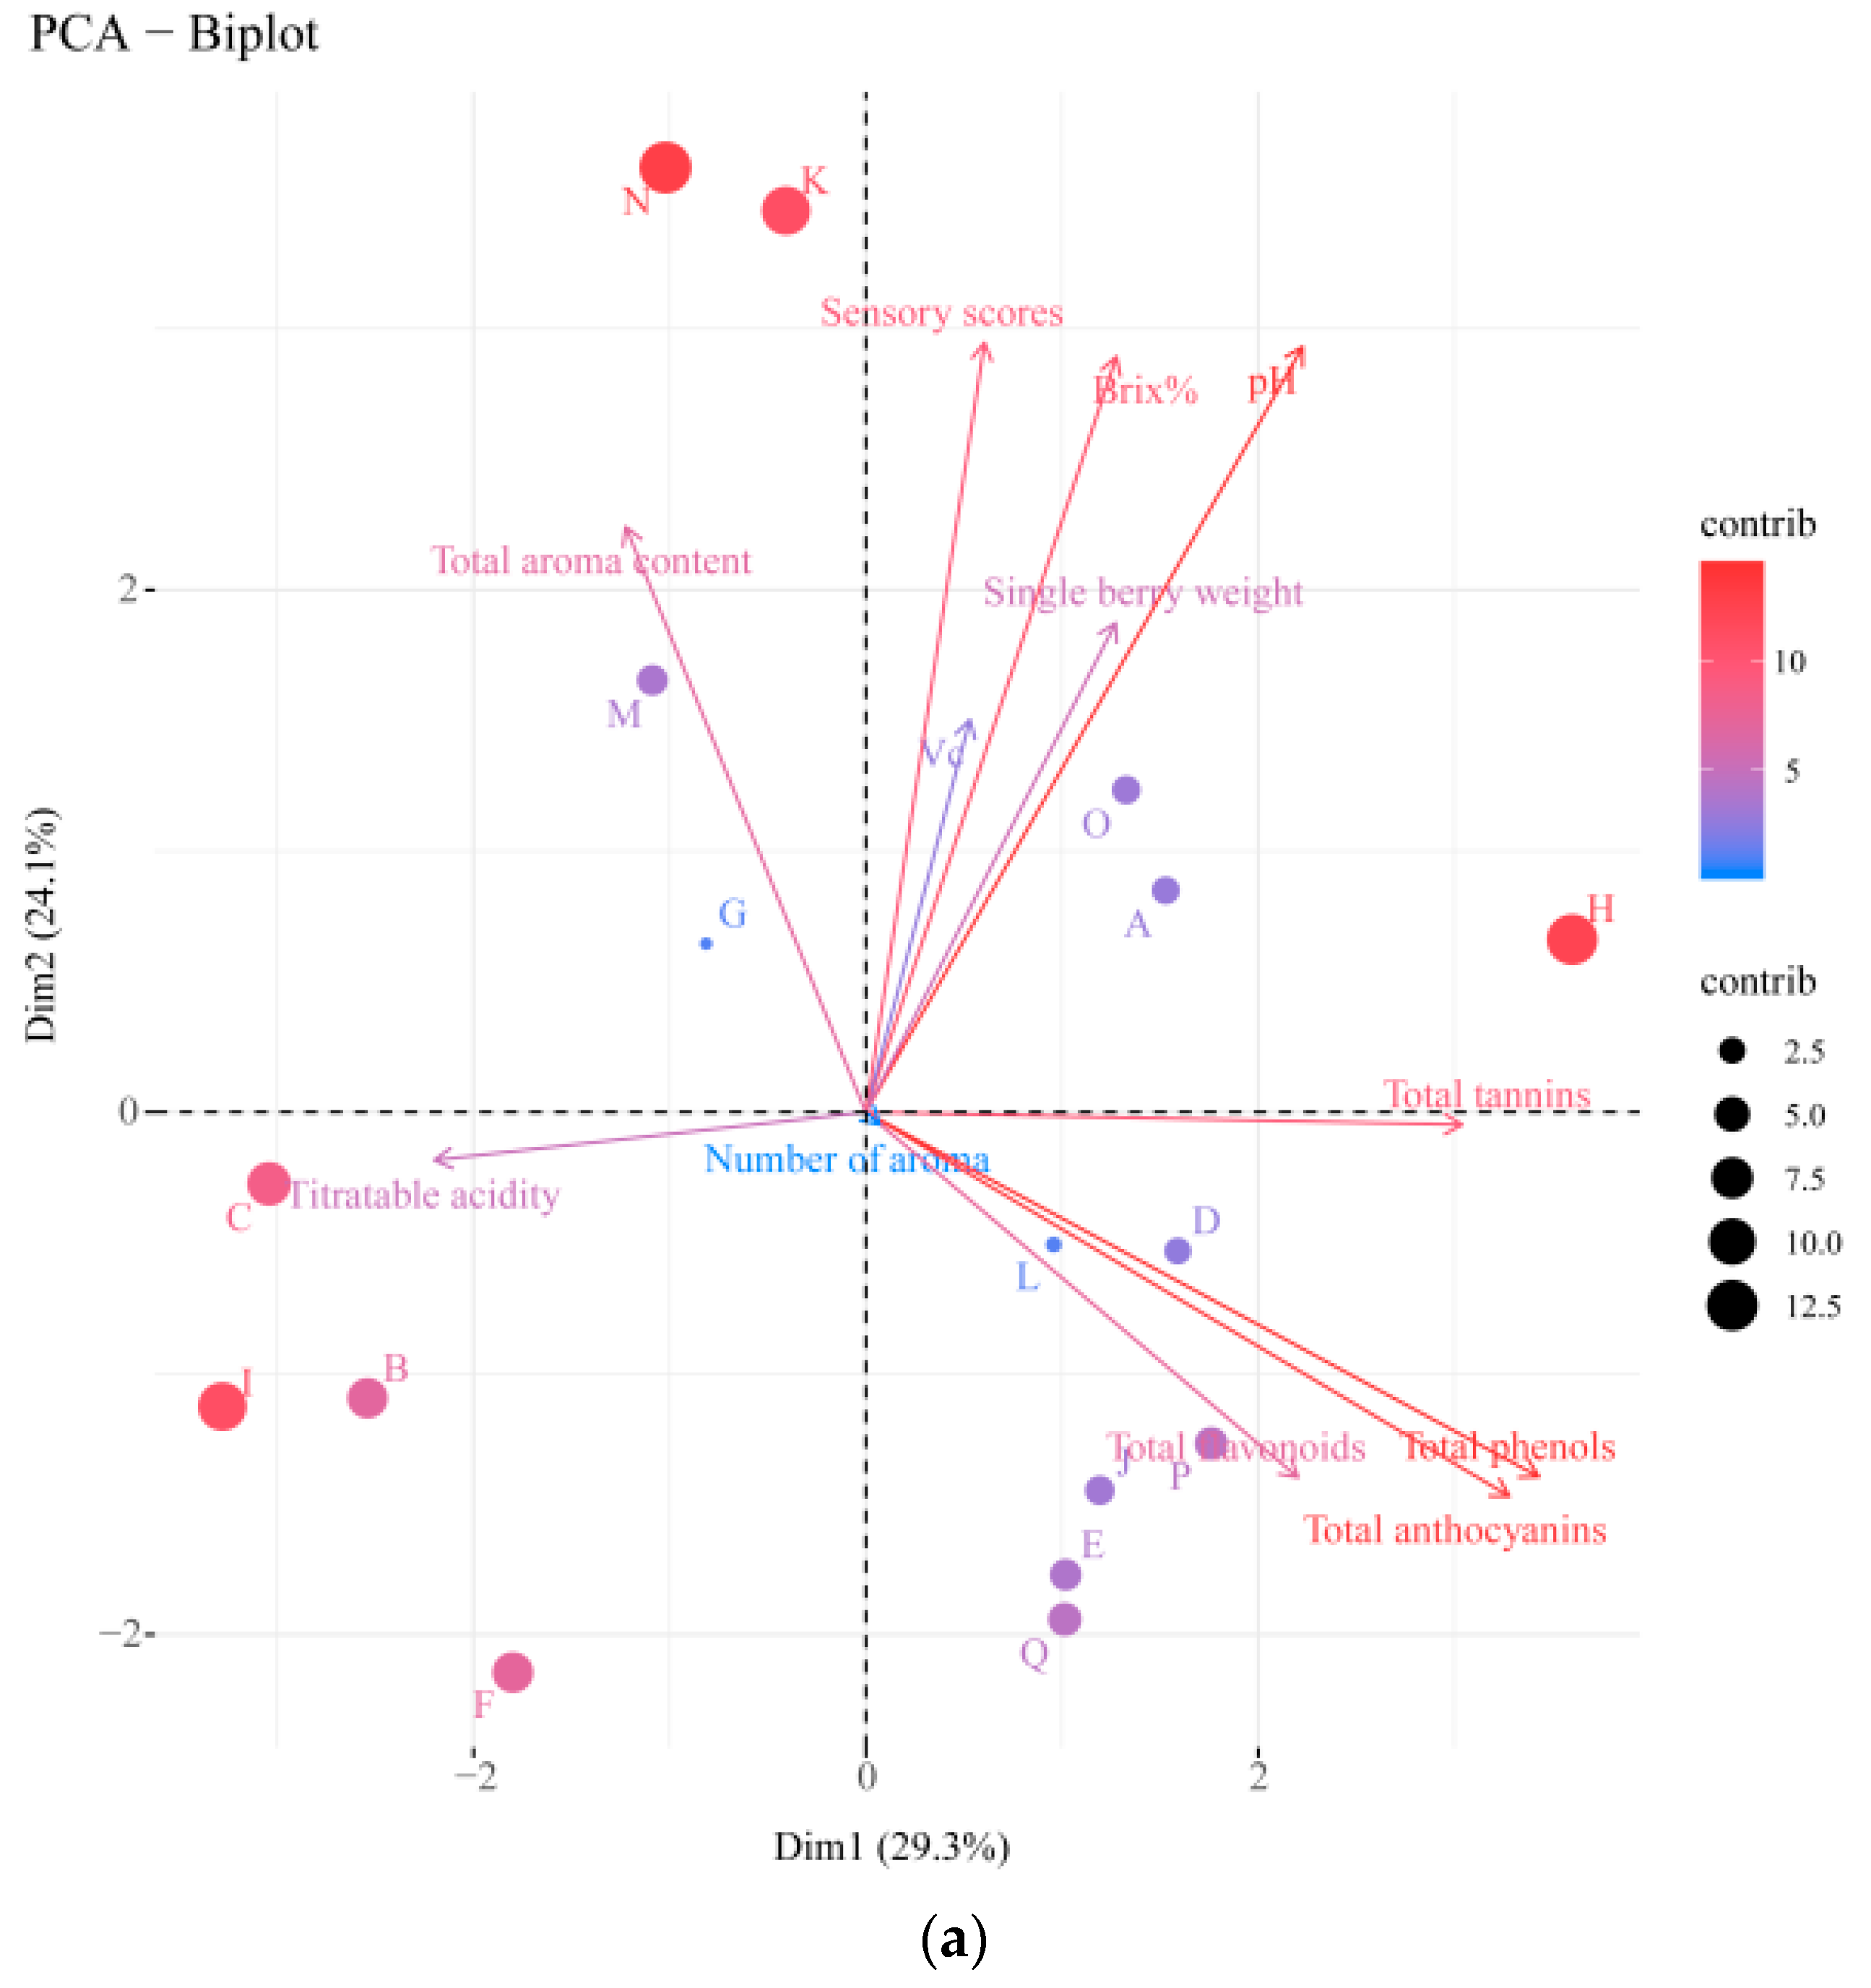
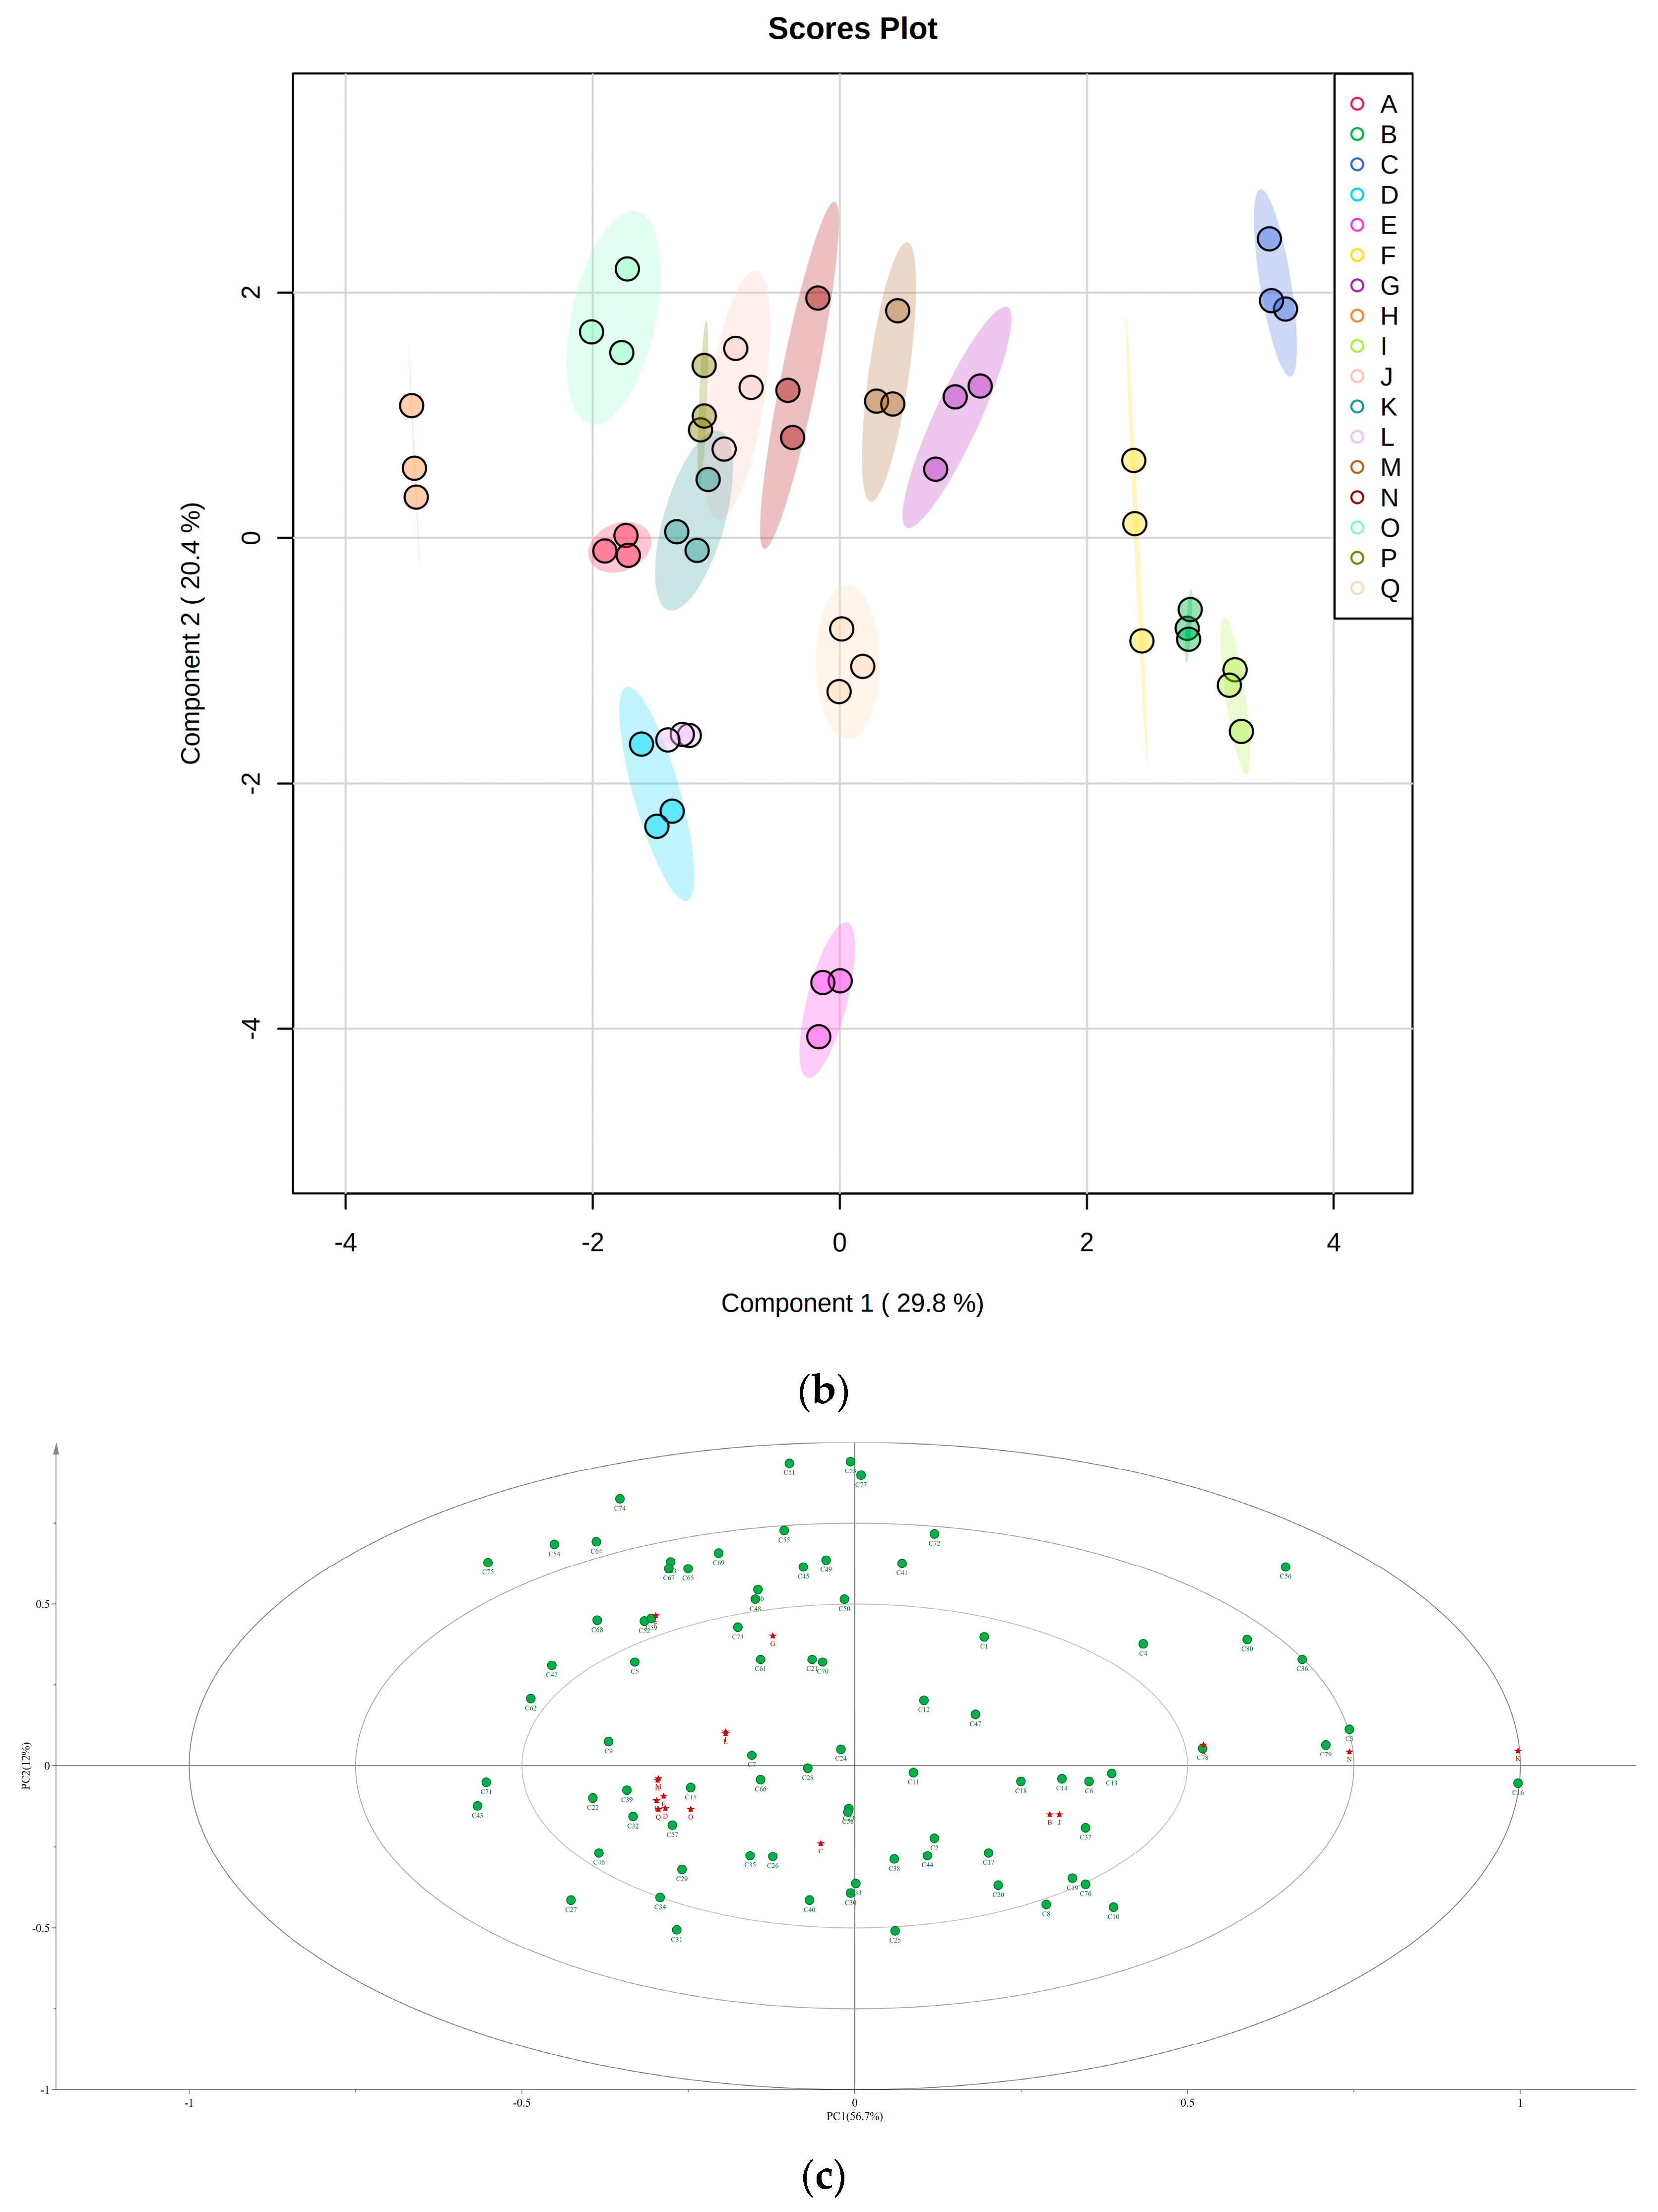
3.5. Principal Component Analysis (PCA) and PLS-DA of Different Table Grape Varieties
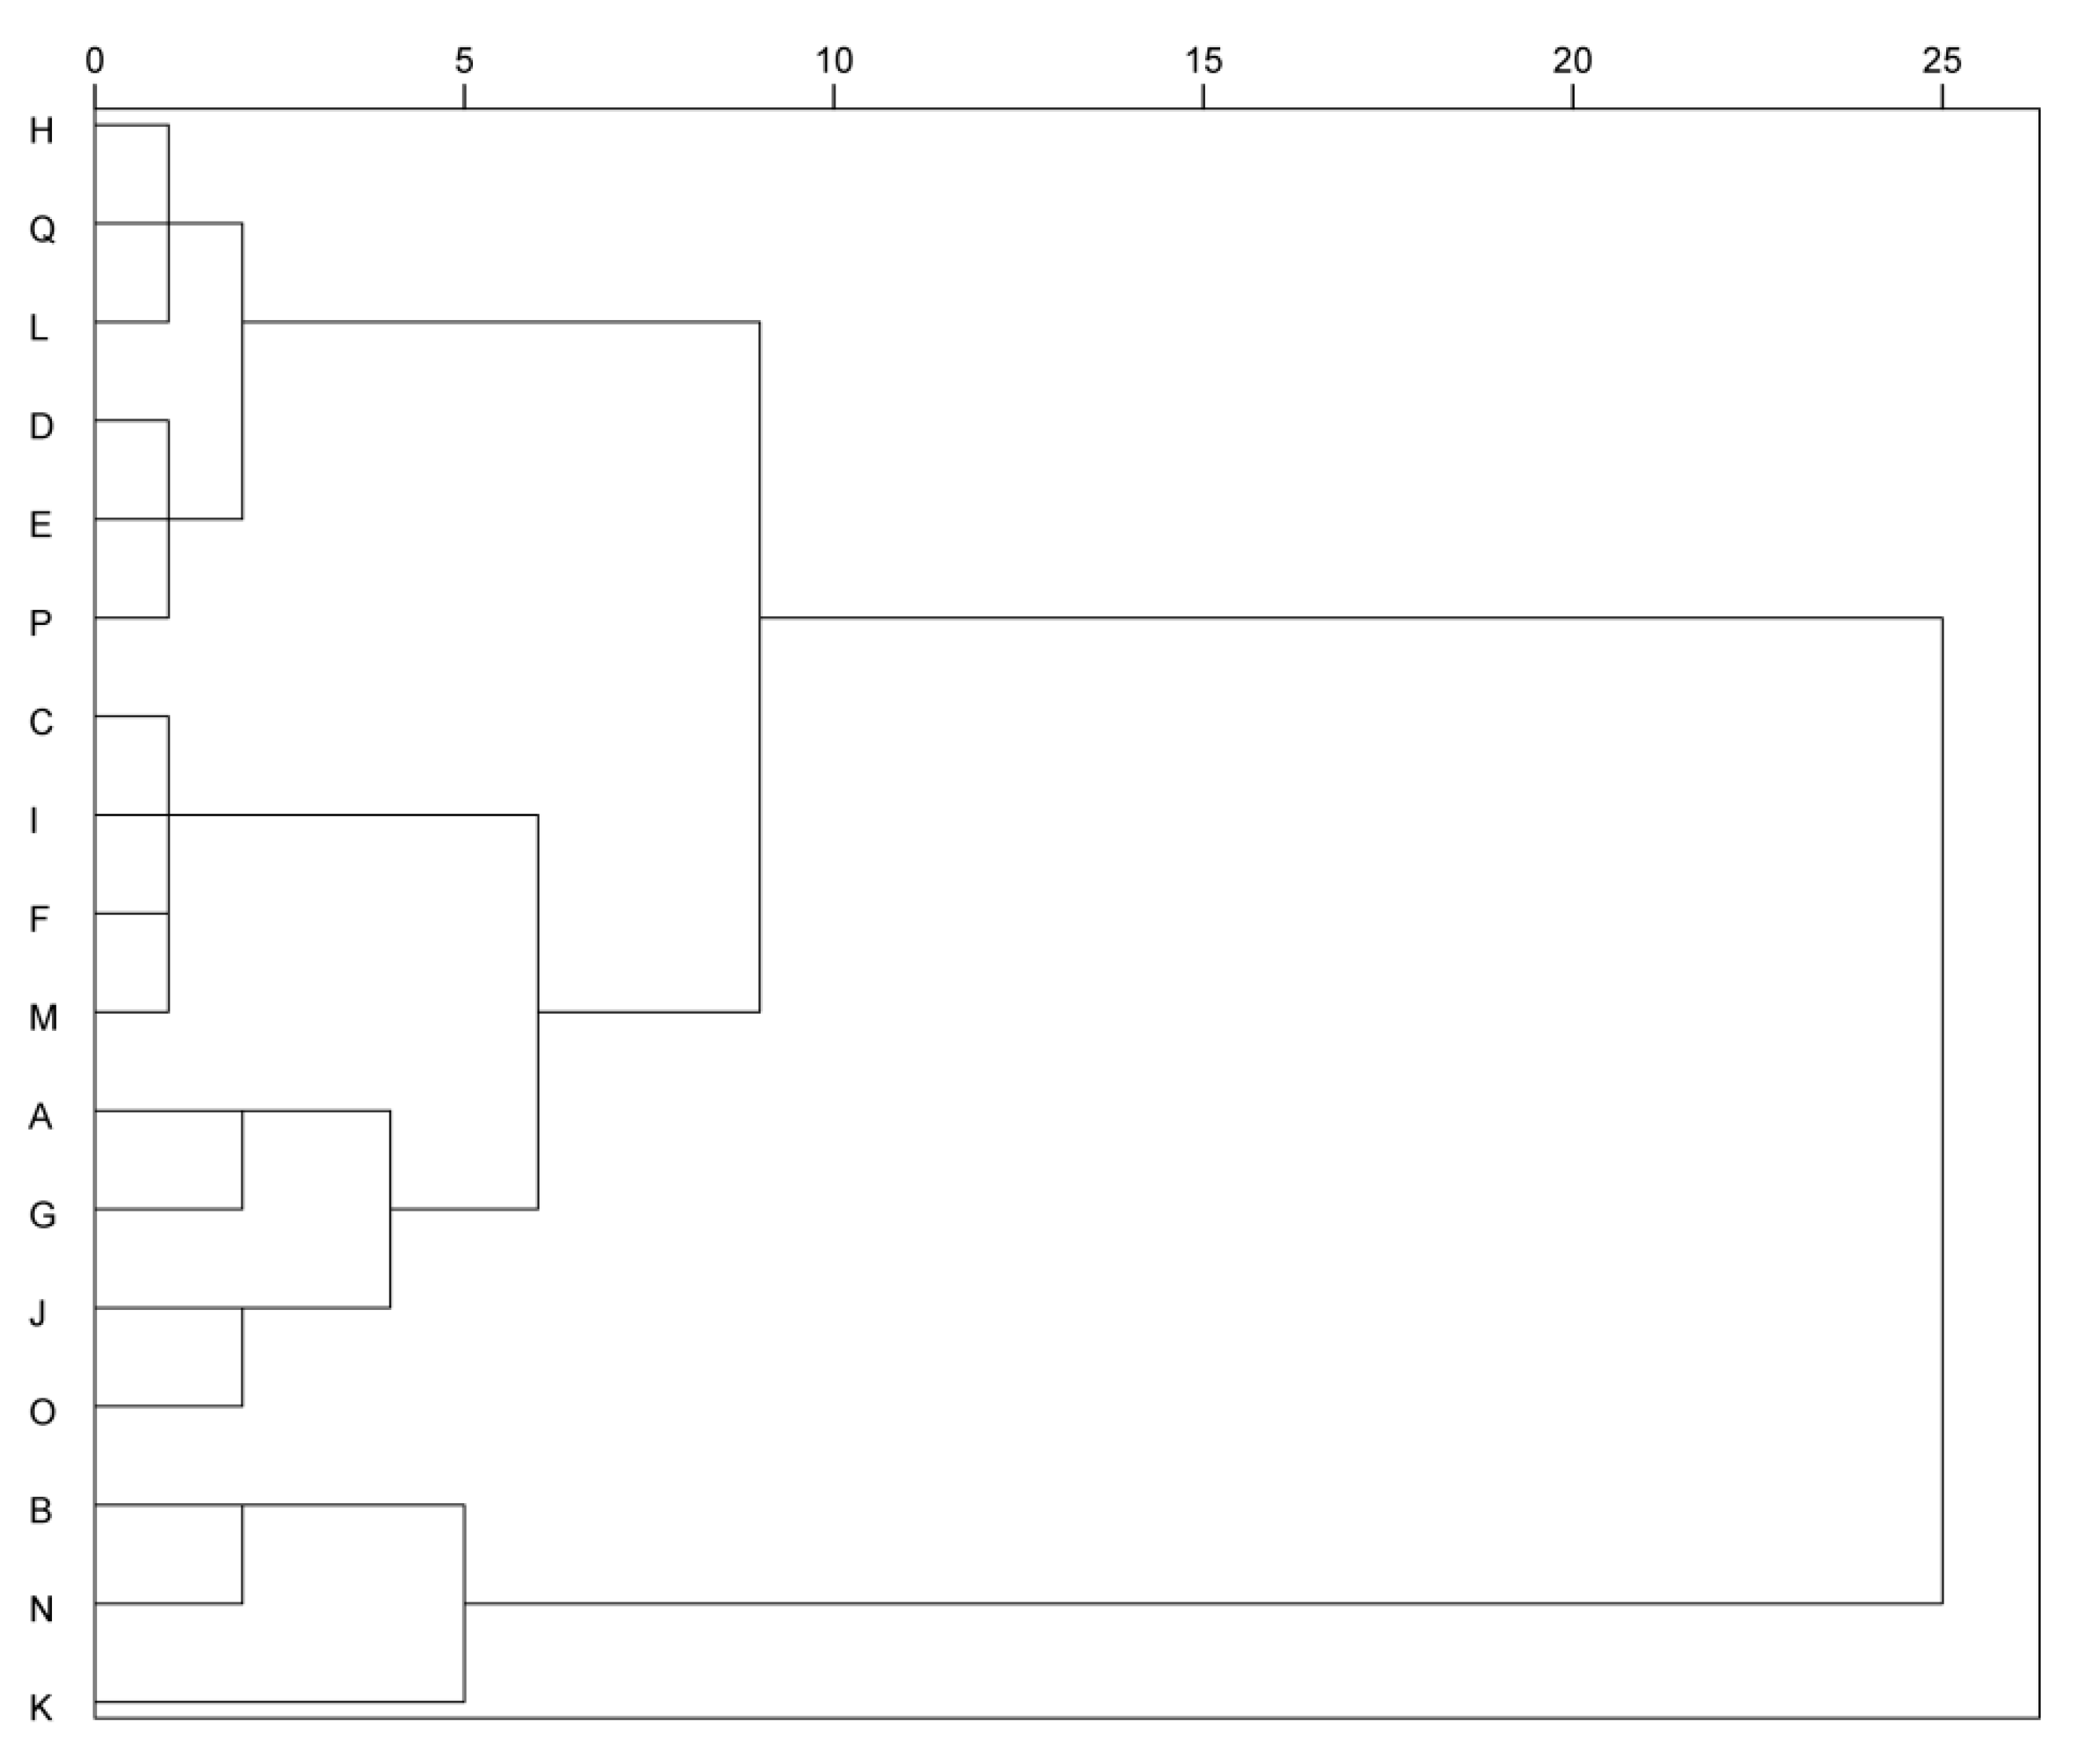
3.6. Cluster Analysis of Different Table Grape Varieties
4. Conclusions
Supplementary Materials
Author Contributions
Funding
Informed Consent Statement
Data Availability Statement
Conflicts of Interest
References
- Khan, N.; Fahad, S.; Naushad, M.; Faisal, S. Grape Production Critical Review in the World; Elsevier: Amsterdam, The Netherlands, 2020; SSRN 3595842. [Google Scholar]
- Wu, Y.; Duan, S.; Zhao, L.; Gao, Z.; Luo, M.; Song, S.; Xu, W.; Zhang, C.; Ma, C.; Wang, S. Aroma characterization based on aromatic series analysis in table grapes. Sci. Rep. 2016, 6, 31116. [Google Scholar] [CrossRef] [PubMed]
- Farvid, M.S.; Barnett, J.B.; Spence, N.D. Fruit and vegetable consumption and incident breast cancer: A systematic review and meta-analysis of prospective studies. Br. J. Cancer 2021, 125, 284–298. [Google Scholar] [CrossRef] [PubMed]
- Castelli, V.; Grassi, D.; Bocale, R.; d’Angelo, M.; Antonosante, A.; Cimini, A.; Ferri, C.; Desideri, G. Diet and brain health: Which role for polyphenols? Curr. Pharm. Des. 2018, 24, 227–238. [Google Scholar] [CrossRef] [PubMed]
- Perestrelo, R.; Silva, C.; Pereira, J.; Câmara, J.S. Healthy effects of bioactive metabolites from Vitis vinifera L. grapes: A review. In Grapes: Production, Phenolic Composition and Potential Biomedical Effects; Câmara, J.S., Ed.; Nova Science Technology: New York, NY, USA, 2014; pp. 305–338. [Google Scholar]
- Vieira, A.R.; Abar, L.; Vingeliene, S.; Chan, D.S.M.; Aune, D.; Navarro-Rosenblatt, D.; Norat, T. Fruits, vegetables and lung cancer risk: A systematic review and meta-analysis. Ann. Oncol. 2016, 27, 81–96. [Google Scholar] [CrossRef]
- Tyagi, K.; Maoz, I.; Lapidot, O.; Kochanek, B.; Butnaro, Y.; Shlisel, M.; Lerno, L.; Ebeler, S.E.; Lichter, A. Effects of gibberellin and cytokinin on phenolic and volatile composition of Sangiovese grapes. Sci. Hortic. 2022, 295, 110860. [Google Scholar] [CrossRef]
- Blanch, G.P.; Reglero, G.; Herraiz, M. A comparison of different extraction methods for the volatile components of grape juice. J. Chromatogr. Sci. 2011, 29, 11–15. [Google Scholar] [CrossRef]
- Kennedy, J.A. Grape and wine phenolics: Observations and recent findings. Cienc. Investig. Agrar. 2008, 35, 107–120. [Google Scholar] [CrossRef]
- Maoz, I.; Kaplunov, T.; Raban, E.; Dynkin, I.; Degani, O.; Lewinsohn, E.; Lichter, A. Insights into the chemosensory basis of flavor in table grapes. J. Sci. Food Agric. 2020, 100, 1405–1417. [Google Scholar] [CrossRef]
- Lee, S.K.; Kader, A.A. Preharvest and postharvest factors influencing vitamin C content of horticultural crops. Postharvest Biol. Technol. 2000, 20, 207–220. [Google Scholar] [CrossRef]
- Alem, H.; Rigou, P.; Schneider, R.; Ojeda, H.; Torregrosa, L. Impact of agronomic practices on grape aroma composition: A review. J. Sci. Food Agric. 2019, 99, 975–985. [Google Scholar] [CrossRef]
- Chen, T.C.; Xu, T.; Shen, L.Y.; Zhang, T.Y.; Wang, L.R.; Chen, Z.H.; Wu, Y.Y.; Yang, J. Effects of girdling and foliar fertilization with K on physicochemical parameters, phenolic and volatile composition in ‘Hanxiangmi’ table grape. Horticulturae 2022, 8, 388. [Google Scholar] [CrossRef]
- Wu, Y.S.; Zhang, W.W.; Yu, W.J.; Zhao, L.P.; Song, S.R.; Xu, W.P.; Zhang, C.X.; Ma, C.; Wang, L.; Wang, S.P. Study on the volatile composition of table grapes of three aroma types. LWT-Food Sci. Technol. 2019, 115, 108450. [Google Scholar] [CrossRef]
- Mateo, J.J.; Jiménez, M. Monoterpenes in grape juice and wines. J. Chromatogr. A 2000, 881, 557–567. [Google Scholar] [CrossRef] [PubMed]
- Karkabounas, S.; Kostoula, O.K.; Daskalou, T.; Veltsistas, P.; Karamouzis, M.; Zelovitis, I.; Metsios, A.; Lekkas, P.; Evangelou, A.M.; Kotsis, N.; et al. Anticarcinogenic and antiplatelet effects of carvacrol. Exp. Oncol. 2006, 28, 121–125. [Google Scholar] [PubMed]
- Thoppil, R.J.; Bishayee, A. Terpenoids as potential chemopreventive and therapeutic agents in liver cancer. World J. Hepatol. 2011, 3, 228–249. [Google Scholar] [CrossRef]
- Feng, M.X.; Jin, X.Q.; Yao, H.; Zhu, T.Y.; Guo, S.H.; Li, S.; Lei, Y.L.; Xing, Z.G.; Zhao, X.H.; Xu, T.F.; et al. Evolution of volatile profile and aroma potential of ‘Gold Finger’ table grapes during berry ripening. J. Sci. Food Agric. 2022, 102, 291–298. [Google Scholar] [CrossRef]
- Eyiz, V.; Tontul, I.; Turker, S. Optimization of green extraction of phytochemicals from red grape pomace by homogenizer assisted extraction. J. Food Meas. Charact. 2020, 14, 39–47. [Google Scholar] [CrossRef]
- Singleton, V.; Rossi, J.A. Colorimetry of total phenolics with phosphomolybdic-phosphotungstic acid reagents. Am. J. Enol. Vitic. 1965, 16, 144–158. [Google Scholar] [CrossRef]
- Nia, A.E.; Taghipour, S.; Siahmansour, S. Pre-harvest application of chitosan and postharvest Aloe vera gel coating enhances quality of table grape (Vitis vinifera L. cv. ‘Yaghouti’) during postharvest period. Food Chem. 2021, 347, 129012. [Google Scholar]
- Atlabachew, M.; Chandravanshi, B.S.; Redi, M. Selected secondary metabolites and antioxidant activity of khat (Catha edulis Forsk) chewing leaves extract. Int. J. Food Prop. 2014, 17, 45–64. [Google Scholar] [CrossRef]
- Sun, L.; Zhu, B.Q.; Zhang, X.Y.; Wang, H.L.; Yan, A.L.; Zhang, G.J.; Wang, X.Y.; Xu, H.Y. The accumulation profiles of terpene metabolites in three Muscat table grape cultivars through HS-SPME-GCMS. Sci. Data 2020, 7, 5. [Google Scholar] [CrossRef] [PubMed]
- Lan, Y.B.; Qian, X.; Yang, Z.J.; Xiang, X.F.; Yang, W.X.; Liu, T.; Zhu, B.Q.; Pan, Q.H.; Duan, C.Q. Striking changes in volatile profiles at sub-zero temperatures during over-ripening of ‘Beibinghong’ grapes in Northeastern China. Food Chem. 2016, 212, 172–182. [Google Scholar] [CrossRef]
- Li, X.Y.; Wen, Y.Q.; Meng, N.; Qian, X.; Pan, Q.H. Monoterpenyl glycosyltransferases differentially contribute to production of monoterpenyl glycosides in two aromatic Vitis vinifera varieties. Front. Plant Sci. 2017, 8, 1226–1239. [Google Scholar] [CrossRef] [PubMed]
- Song, C.Z.; Zuo, L.L.; Shi, P.B.; Meng, J.F.; Wang, Y.J.; Zhang, Z.W.; Xi, Z.M. Aroma characterization of Chinese Hutai-8 wines: Comparing with Merlot and Cabernet Sauvignon wines. Sci. Hortic. 2015, 194, 237–245. [Google Scholar] [CrossRef]
- Lu, S.W.; Wang, J.Y.; Zhuge, Y.X.; Zhang, M.W.; Liu, C.; Jia, H.F.; Fang, J.G. Integrative analyses of metabolomes and transcriptomes provide insights into flavonoid variation in grape berries. J. Agric. Food Chem. 2021, 69, 12354–12367. [Google Scholar] [CrossRef] [PubMed]
- Schreier, P. Chromatographic Studies of Biogenesis of Plant Volatiles; Hüthig: Heideberg, Germany, 1984. [Google Scholar]
- Aubert, C.; Chalot, G. Chemical composition, bioactive compounds, and volatiles of six table grape varieties (Vitis vinifera L.). Food Chem. 2017, 240, 524–533. [Google Scholar] [CrossRef]
- Sanz, C.; Olias, J.M.; Perez, A.G. Aroma biochemistry of fruits and vegetables. In Proceedings of the Phytochemical Society of Europe; Oxford University Press Inc.: Murcia, Spain, 1996; Volume 41, pp. 125–156. [Google Scholar]
- Yao, H.; Jin, X.Q.; Feng, M.X.; Xu, G.Q.; Zhang, P.; Fang, Y.L.; Xu, T.F.; Meng, J.F. Evolution of volatile profile and aroma potential of table grape Hutai-8 during berry ripening. Food Res. Int. 2021, 143, 110330. [Google Scholar] [CrossRef]
- Matijasevic, S.; Popovic-Djordjevic, J.; Ristic, R.; Cirkovic, D.; Cirkovic, B.; Popovic, T. Volatile aroma compounds of brandy ‘Lozovaa’ produced from Muscat table grapevine cultivars (Vitis vinifera L.). Molecules 2019, 24, 2485. [Google Scholar] [CrossRef]
- Höferl, M.; Krist, S.; Buchbauer, G. Chirality influences the effects of linalool on physiological parameters of stress. Planta Medica 2006, 72, 1188–1192. [Google Scholar] [CrossRef]
- Polo, M.P.; DeBravo, M.G. Effect of geraniol on fatty-acid and mevalonate metabolism in the human hepatoma cell line Hep G2. Biochem. Cell Biol. 2006, 84, 102–111. [Google Scholar] [CrossRef]
- Petretto, G.L.; Mercenaro, L.; Urgeghe, P.P.; Fadda, C.; Valentoni, A.; Del Caro, A. Grape and wine composition in Vitis vinifera L. cv. Cannonau explored by GC-MS and sensory analysis. Foods 2021, 10, 101. [Google Scholar] [CrossRef] [PubMed]
- Roessner, U.; Luedemann, A.; Brust, D.; Fiehn, O.; Linke, T.; Willmitzer, L.; Fernie, A.R. Metabolic profiling allows comprehensive phenotyping of genetically or environmentally modified plant systems. Plant Cell 2001, 13, 11–29. [Google Scholar] [CrossRef] [PubMed]
- Tikunov, Y.; Lommen, A.; de Vos, C.H.R.; Verhoeven, H.A.; Bino, R.J.; Hall, R.D.; Bovy, A.G. A novel approach for nontargeted data analysis for metabolomics. Large-scale profiling of tomato fruit volatiles. Plant Physiol. 2005, 139, 1125–1137. [Google Scholar] [CrossRef] [PubMed]

| Number | pH | Single Berry Weight (g) | Soluble Solids | Titratable Acid | Longitudinal Diameter | Transverse Diameter |
|---|---|---|---|---|---|---|
| A | 4.13 ± 0.02 e | 7.07 ± 0.19 d | 20.41 ± 0.58 b | 7.64 ± 0.07 k | 2.59 ± 0.67 cd | 1.68 ± 0.03 ef |
| B | 3.04 ± 0.01 m | 5.59 ± 0.25 e | 16.73 ± 0.24 fg | 6.77 ± 0.01 a | 2.28 ± 0.11 de | 2.04 ± 0.13 bc |
| C | 3.13 ± 0.02 l | 7.75 ± 0.24 cd | 17.08 ± 0.03 f | 8.63 ± 0.02 b | 2.65 ± 0.08 bd | 2.55 ± 0.09 a |
| D | 4.20 ± 0.02 d | 3.90 ± 0.22 f | 18.53 ± 0.12 d | 8.16 ± 0.03 l | 1.96 ± 0.15 e | 1.87 ± 0.11 ce |
| E | 3.76 ± 0.01 h | 3.76 ± 0.16 f | 16.28 ± 0.25 ge | 7.99 ± 0.02 i | 1.45 ± 0.09 i | 1.34 ± 0.08 df |
| F | 3.22 ± 0.03 k | 5.76 ± 0.31 e | 16.04 ± 0.09 e | 8.55 ± 0.13 c | 2.37 ± 0.31 ce | 2.12 ± 0.31 bc |
| G | 4.02 ± 0.03 f | 6.93 ± 0.36 d | 18.02 ± 0.12 de | 7.77 ± 0.14 j | 3.08 ± 0.11 ab | 1.73 ± 0.26 def |
| H | 4.45 ± 0.02 b | 10.87 ± 1.24 a | 19.61 ± 0.06 c | 7.92 ± 0.02 i | 2.27 ± 0.15 de | 2.15 ± 0.12 bc |
| I | 3.34 ± 0.03 j | 4.15 ± 0.24 f | 16.75 ± 0.12 fg | 8.02 ± 0.12 b | 1.76 ± 0.11 hi | 1.54 ± 0.10 ef |
| J | 3.90 ± 0.01 g | 8.82 ± 0.36 bc | 15.89 ± 0.21 e | 8.41 ± 0.01 e | 3.11 ± 0.18 a | 2.03 ± 0.11 bcd |
| K | 4.37 ± 0.01 b | 7.90 ± 0.07 cd | 21.17 ± 0.13 a | 8.21 ± 0.02 h | 2.42 ± 0.10 cd | 1.64 ± 0.12 de |
| L | 4.02 ± 0.05 f | 7.33 ± 0.18 cd | 20.34 ± 0.29 b | 8.36 ± 0.06 f | 1.93 ± 0.07 e | 1.57 ± 0.09 ef |
| M | 3.85 ± 0.02 g | 10.37 ± 0.70 a | 17.70 ± 0.19 e | 7.37 ± 0.04 f | 2.36 ± 0.13 ce | 2.13 ± 0.18 bc |
| N | 4.31 ± 0.03 a | 8.53 ± 0.24 bc | 19.29 ± 0.25 c | 8.44 ± 0.02 b | 2.52 ± 0.20 cd | 2.25 ± 0.19 ab |
| O | 4.10 ± 0.02 c | 9.28 ± 0.14 b | 20.92 ± 0.11 ab | 7.49 ± 0.01 d | 2.54 ± 0.08 cd | 2.59 ± 0.32 a |
| P | 3.84 ± 0.01 g | 8.67 ± 0.32 bc | 16.91 ± 0.15 f | 8.03 ± 0.08 i | 2.63 ± 0.26 bd | 2.26 ± 0.13 ab |
| Q | 3.53 ± 0.03 i | 7.27 ± 0.19 d | 15.71 ± 0.29 e | 8.30 ± 0.02 g | 2.21 ± 0.06 d | 1.76 ± 0.04 de |
| Aroma Compounds (μg/L) | Aroma Type | Grape Varieties | |||||
|---|---|---|---|---|---|---|---|
| Meixiangbao | Italy | Zaoheibao | Manicure Finger | Aishenmeigui | Zhengyanwuhe | ||
| C6 Compounds | |||||||
| Hexanal | 654.29 ± 0.21 b | 468.03 ± 1.56 d | 547.30 ± 0.06 cd | 803.41 ± 2.13 a | 237.52 ± 0.04 i | 414.01 ± 0.35 de | |
| Hexanol | Fruity | 41.56 ± 0.16 j | 230.94 ± 9.62 a | 77.14 ± 0.37 g | 139.65 ± 1.63 e | 90.01 ± 3.34 f | 52.60 ± 2.60 i |
| 3-Hexanal | Fruity | 7.02 ± 0.98 c | 0.35 ± 0.01 h | 0.32 ± 0.13 h | 6.62 ± 0.68 d | 6.84 ± 0.03 c | 2.13 ± 0.03 e |
| (E)-2-Hexanal | 856.07 ± 7.09 e | 1190.67 ± 5.15 a | 758.47 ± 18.43 fh | 985.13 ± 5.09 c | 988.43 ± 10.68 c | 970.02 ± 16.58 d | |
| (E)-3-Hexanol | 5.51 ± 0.42 d | 4.96 ± 0.06 f | 9.22 ± 0.98 g | 1.96 ± 0.05 h | - | 7.89 ± 0.44 a | |
| (E)-2-Hexanol | Grass | 221.83 ± 11.73 f | 217.75 ± 7.45 eg | 105.52 ± 8.61 h | 281.29 ± 9.60 d | 361.92 ± 7.82 a | 98.76 ± 0.38 eh |
| (Z)-3-Hexanol | 0.51 ± 0.02 d | - | 0.34 ± 0.11 e | - | - | 1.57 ± 0.09 a | |
| Subtotal | 1786.79 ± 21.57 b | 2112.7 ± 39.66 a | 1498.31 ± 18.40 e | 2218.06 ± 37.84 a | 1684.72 ± 20.35 c | 1546.98 ± 44.29 cd | |
| Alcohols | |||||||
| Heptanol | Sweet wine | 0.23 ± 0.04 f | - | - | - | - | 0.59 ± 0.17 d |
| Octanol | Nutty | 0.76 ± 0.01 c | - | 0.94 ± 0.24 a | 0.41 ± 0.03 e | - | 0.89 ± 0.02 a |
| Nonanol | - | 0.95 ± 0.28 a | - | - | - | - | |
| Benzyl alcohol | 0.57 ± 0.03 e | - | 0.61 ± 0.05 d | - | - | 0.71 ± 0.01 c | |
| Phenylethyl alcohol | Flower | 16.01 ± 1.41 c | 6.22 ± 0.06 g | 24.32 ± 3.62 a | 3.08 ± 0.77 k | 4.28 ± 0.08 i | 7.12 ± 1.23 e |
| 2-Heptanol | - | - | - | - | - | 1.28 ± 0.06 b | |
| 1-Octen-3-ol | 0.44 ± 0.02 e | 0.99 ± 0.15 a | 0.39 ± 0.06 e | - | - | 0.73 ± 0.02 cd | |
| 2-Ethyl hexanol | Flower | 2.31 ± 0.01 de | 3.11 ± 0.62 d | 2.89 ± 0.38 e | 2.72 ± 0.85 e | 5.08 ± 0.04 a | 3.01 ± 0.71 d |
| Subtotal | 20.72 ± 3.28 c | 11.38 ± 0.49 f | 29.20 ± 0.61 b | 6.38 ± 1.07 k | 9.36 ± 2.23 h | 14.43 ± 1.25 e | |
| Esters | |||||||
| Etnyl acetate | Vegetable oil | 3056.59 ± 22.14 d | 2716.64 ± 50.08 e | 347.97 ± 6.72 jk | 986.28 ± 22.13 k | 473.34 ± 17.09 l | 1031.81 ± 35.61 f |
| Ethyl propionate | Pineapple | 10.01 ± 0.29 b | - | - | 3.91 ± 0.03 g | - | 0.85 ± 0.01 i |
| Propyl acetate | 0.36 ± 0.07 e | - | 0.57 ± 0.03 bc | - | - | 0.45 ± 0.06 c | |
| Ethyl butyrate | Apple; Banana | 209.94 ± 10.30 b | 210.73 ± 8.46 bc | 96.36 ± 5.14 l | 163.41 ± 7.54 d | 142.21 ± 10.71 ef | 30.53 ± 4.08 j |
| Butyl acetate | Fruity | 0.84 ± 0.06 a | 0.49 ± 0.09 c | - | 0.39 ± 0.01 d | 0.52 ± 0.12 c | 0.63 ± 0.23 b |
| Ethyl pentanoate | 3.08 ± 0.71 a | - | 1.54 ± 0.02 c | 2.91 ± 0.15 ab | - | - | |
| Methyl hexanoate | 1.24 ± 0.06 d | - | 4.01 ± 1.21 a | - | - | 0.82 ± 0.01 e | |
| Ethyl hexanoate | 23.14 ± 2.37 ab | - | - | 22.34 ± 3.61 b | - | - | |
| Hexyl acetate | - | 3.23 ± 0.06 b | 1.82 ± 0.02 d | - | - | 3.91 ± 0.62 a | |
| Ethyl heptanoate | Rose | 9.04 ± 2.31 a | 1.52 ± 0.58 cde | - | 2.06 ± 0.49 b | 0.54 ± 0.01 g | 0.74 ± 0.11 g |
| Ethyl octanoate | 2.21 ± 0.05 c | - | - | - | - | - | |
| Ethyl isobutyrate | Strawberry | - | 7.23 ± 0.14 c | 1.39 ± 0.25 g | 4.45 ± 0.81 e | - | 0.88 ± 0.04 |
| Benzoic acid ethyl ester | - | 3.98 ± 0.28 d | 0.24 ± 0.01 j | 3.92 ± 0.76 d | 3.06 ± 0.39 e | - | |
| Methyl salicylate | - | 9.13 ± 1.02 b | 0.17 ± 0.02 i | - | - | - | |
| Methyl anthranilate | 4.37 ± 0.25 bc | 5.45 ± 0.31 b | 0.23 ± 0.02 j | 0.53 ± 0.06 i | - | 0.61 ± 0.21 hi | |
| Ethyl-2-methylbutanoate | Fruity | 3.05 ± 0.17 d | - | - | - | - | - |
| Ethyl-3-methylbutanoate | 0.31 ± 0.01 j | - | 1.79 ± 0.36 g | 6.73 ± 0.28 b | - | 0.13 ± 0.01 j | |
| (Z)-2-Butenoic acid, ethyl ester | 8.06 ± 1.32 b | 9.19 ± 1.46 ab | - | 2.78 ± 0.57 f | - | - | |
| 2-Hexenoic acid, ethyl ester | 3.36 ± 0.58 c | - | - | - | 1.34 ± 0.01 e | 0.92 ± 0.15 ef | |
| Ethyl-3-hydroxybutyrate | Wine | 1.75 ± 0.07 d | 3.26 ± 0.02 c | 0.83 ± 0.11 f | - | - | 0.95 ± 0.03 f |
| Subtotal | 3336.24 ± 56.71 b | 2970.93 ± 34.28 cd | 456.94 ± 7.06 n | 1199.71 ± 24.29 hij | 621.01 ± 12.51 km | 1073.23 ± 23.64 j | |
| Acids | - | - | - | - | - | - | |
| Hexanoic acid | - | - | - | 1.31 ± 0.03 c | - | 1.59 ± 0.21 b | |
| Nonanoic acid | - | 0.55 ± 0.01 c | - | 0.75 ± 0.12 b | - | 0.53 ± 0.01 c | |
| 2-Hexenoic | 1.24 ± 0.03 d | - | - | - | - | 1.36 ± 0.05 d | |
| Subtotal | 1.24 ± 0.03 d | 0.55 ± 0.01 f | 0 | 2.06 ± 0.21 c | 0 | 3.48 ± 0.34 a | |
| Aldehydes | |||||||
| Pentanal | - | 5.21 ± 0.35 a | - | 3.98 ± 0.61 c | 1.05 ± 0.02 g | - | |
| Heptanal | Herb | 0.44 ± 0.09 k | 13.07 ± 1.22 bc | 2.40 ± 0.09 h | 1.53 ± 0.25 i | - | 0.67 ± 0.01 jk |
| Octanal | - | - | 4.66 ± 1.07 c | - | - | - | |
| Nonanal | 1.09 ± 0.51 g | 3.91 ± 0.37 cd | 5.80 ± 0.62 a | 6.46 ± 0.47 a | - | 0.57 ± 0.03 h | |
| Decanal | Citrus peel | - | - | - | - | 2.51 ± 0.31 e | 3.15 ± 1.01 d |
| Benzaldehyde | 8.93 ± 1.42 a | 0.36 ± 0.02 h | 8.02 ± 0.09 ab | - | - | - | |
| Phenylacetaldehyde | Hyacinth | 4.65 ± 0.26 f | - | 9.24 ± 1.51 c | 4.07 ± 0.02 fg | 1.59 ± 0.34 i | 7.94 ± 1.63 d |
| (Z)-2-hepental | - | - | - | - | 8.51 ± 2.30 c | - | |
| (E)-2-nonenal | - | 9.18 ± 0.76 a | - | 7.85 ± 0.05 bc | 1.65 ± 0.81 j | 6.29 ± 1.45 cd | |
| Subtotal | 15.11 ± 1.68 j | 31.66 ± 0.91 cd | 30.12 ± 1.60 def | 24.31 ± 0.09 e | 15.31 ± 3.24 ij | 18.62 ± 3.06 i | |
| Terpenes | - | - | - | - | - | - | |
| α-Pinene | Resin | - | 8.02 ± 0.24 i | - | 80.23 ± 11.08 bc | 0.65 ± 0.02 l | 44.81 ± 5.67 g |
| β-Pinene | Resin | 5.14 ± 0.57 ijkl | 13.26 ± 1.08 ef | 96.36 ± 12.51 a | - | 5.72 ± 2.08 ijk | 19.28 ± 3.11 d |
| Eucalyptol | 6.27 ± 0.03 jkl | 8.76 ± 1.12 jk | - | 55.35 ± 2.45 ab | 25.18 ± 3.51 def | 27.20 ± 0.59 de | |
| Nerol ooxide | - | 2.93 ± 0.06 l | 79.69 ± 4.71 bc | 76.57 ± 6.83 c | 9.14 ± 0.04 k | 14.86 ± 0.24 i | |
| Linalool | 38.09 ± 5.62 ij | 27.81 ± 3.02 k | 155.89 ± 12.97 a | 94.06 ± 10.55 fg | 139.53 ± 8.65 bc | - | |
| Neral | Grass | - | 4.01 ± 0.06 n | 58.34 ± 4.51 d | 75.80 ± 6.59 a | 11.78 ± 0.56 k | 16.27 ± 0.34 j |
| Geranial cis-Linalool oxide | Rose | 4.61 ± 0.51 l | 17.74 ± 0.94 i | 44.01 ± 5.77 e | 61.18 ± 5.90 c | 10.86 ± 2.81 j | 49.98 ± 0.46 e |
| Citral Linalool oxide | 7.93 ± 1.32 jk | 14.93 ± 2.08 ijk | 78.45 ± 4.89 de | 32.25 ± 6.34 f | 6.72 ± 1.06 jkl | 5.12 ± 0.91 l | |
| Citronellol | - | 7.35 ± 1.22 m | 562.71 ± 33.40 c | 380.55 ± 19.67 e | 19.25 ± 0.05 k | 4.29 ± 1.07 klm | |
| Geranic acid | Vegetables | 213.16 ± 12.64 b | 18.44 ± 3.19 l | 56.92 ± 3.51 j | 72.53 ± 7.12 i | 262.30 ± 22.61 a | 115.94 ± 8.59 g |
| α-Phellandrene | 14.55 ± 3.21 f | 9.83 ± 1.75 h | - | - | 7.54 ± 0.07 j | 29.23 ± 2.34 d | |
| α-Terpinene | - | - | 1.21 ± 0.05 l | 66.39 ± 4.55 b | 34.87 ± 4.35 e | 20.40 ± 3.63 h | |
| α-Terpineol | Flowers | - | 14.62 ± 0.24 j | - | 88.82 ± 5.06 c | - | 41.16 ± 5.29 g |
| β-Myrcene | Grass | 3.49 ± 0.02 l | 9.88 ± 0.33 i | 0.51 ± 0.01 mn | 37.36 ± 2.48 e | 3.34 ± 0.52 l | 49.58 ± 10.51 cd |
| β-Ocimene | - | - | 20.08 ± 3.43 bcd | 21.53 ± 3.49 bc | 24.50 ± 3.42 b | - | |
| (Z)-Limonene | - | 4.82 ± 2.51 hijk | 99.34 ± 11.59 a | - | 5.79 ± 0.80 hi | 57.87 ± 12.69 de | |
| γ-Terpinene | Lemon | 5.61 ± 1.32 jk | 4.01 ± 0.02 kl | 46.78 ± 4.56 d | 57.54 ± 7.51 a | 34.03 ± 5.62 cd | 8.81 ± 0.03 j |
| 4-Terpinene | - | - | 83.55 ± 7.03 a | - | 11.63 ± 1.13 j | - | |
| o-Cymene | 15.13 ± 2.62 bc | 7.09 ± 0.34 g | - | - | 13.26 ± 0.21 cde | 49.34 ± 0.06 a | |
| m-Cymene | 8.12 ± 0.04 i | 5.85 ± 0.02 j | 71.43 ± 3.25 b | 1.68 ± 0.03 l | 6.91 ± 0.44 i | 37.73 ± 3.18 e | |
| Terpinolene | Nutty | - | 15.06 ± 1.71 fgh | 59.05 ± 0.47 bc | 1.02 ± 0.01 hi | 24.96 ± 2.61 f | 69.16 ± 5.51 b |
| Eugenol | Lilac | - | 11.68 ± 2.09 g | 91.95 ± 2.36 a | - | - | 31.80 ± 0.72 d |
| Hotrienol | 3.68 ± 0.47 hi | - | 34.51 ± 3.21 bc | 1.43 ± 0.07 h | 36.66 ± 3.49 b | 7.56 ± 0.05 g | |
| Myrtenol | Mint | - | 14.37 ± 1.53 gh | - | 36.67 ± 1.22 c | 28.66 ± 0.51 cde | - |
| Isogeraniol | 9.78 ± 2.05 i | - | 15.60 ± 1.46 hi | 56.32 ± 6.05 cd | 8.94 ± 0.12 jk | 43.79 ± 2.37 efg | |
| E-Nerolidol | - | 13.41 ± 1.51 gh | 35.82 ± 2.34 de | - | 6.73 ± 0.61 j | 12.16 ± 0.72 ghi | |
| cis-β-Ocimene | 0.42 ± 0.02 k | 18.62 ± 2.34 h | 74.76 ± 6.21 b | 82.14 ± 4.59 a | 15.42 ± 0.32 h | 53.59 ± 0.81 d | |
| trans-β-Ocimene | Citrus | - | 7.83 ± 0.21 j | 28.14 ± 3.76 g | 69.76 ± 5.32 d | 20.06 ± 2.27 h | 24.56 ± 2.65 g |
| cis-Rose oxide | Roses | 41.29 ± 3.54 b | 3.55 ± 0.34 e | - | - | 31.51 ± 4.15 c | - |
| trans-Rose oxide | Litchi | 12.06 ± 2.11 l | 6.18 ± 3.15 m | 67.06 ± 7.54 e | 96.35 ± 12.31 c | 13.40 ± 0.04 l | 31.36 ± 2.16 i |
| Subtotal | 389.87 ± 18.54 mn | 270.45 ± 21.01 p | 1864.32 ± 32.65 de | 995.42 ± 21.83 hi | 819.69 ± 22.51 k | 871.79 ± 33.41 ijk | |
| C13-Norisoprenoids | - | - | - | - | - | - | |
| β-Damascenone | Honey | 0.24 ± 0.02 f | 0.64 ± 0.06 ef | 0.96 ± 0.03 cd | - | 1.86 ± 0.21 a | - |
| β-Ionone | Violets | - | 0.51 ± 0.03 cd | 0.34 ± 0.02 e | 0.92 ± 0.06 b | 1.43 ± 0.02 ab | 0.44 ± 0.03 de |
| Geranylacetone | Flowers | - | 0.81 ± 0.05 c | 0.95 ± 0.13 b | 0.87 ± 0.06 c | 1.14 ± 0.01 b | - |
| Subtotal | 0.45 ± 0.05 i | 1.96 ± 0.03 e | 2.25 ± 0.15 de | 1.79 ± 0.02 e | 4.43 ± 0.31 a | 1.18 ± 0.12 efg | |
| TOTAL | 7548.73 ± 46.51 b | 5397.12 ± 123.17 de | 3878.89 ± 84.06 ij | 4995.88 ± 79.31 efg | 3150.27 ± 36.12 j | 3525.05 ± 84.49 ij | |
| Aroma Compounds (μg/L) | Aroma Type | Grape Varieties | |||||
| Heibaladuo | Ruby Seedless | Ruiduwuheyi | Sweet Sapphire | Shaoxing 1 Hao | |||
| C6 Compounds | |||||||
| Hexanal | 307.41 ± 6.71 gh | 462.23 ± 1.08 cd | 413.55 ± 0.54 e | 655.13 ± 3.65 b | 374.01 ± 2.80 f | ||
| Hexanol | Fruity | 156.82 ± 0.52 d | 157.49 ± 2.49 d | 52.14 ± 5.74 i | 42.40 ± 2.23 j | 62.93 ± 5.74 h | |
| 3-Hexanal | Fruity | 9.04 ± 0.16 a | 9.71 ± 1.17 a | 1.67 ± 0.05 f | 7.86 ± 0.67 b | 1.59 ± 0.02 f | |
| (E)-2-Hexanal | 1124.60 ± 13.48 a | 1025.27 ± 8.44 b | 969.56 ± 9.51 d | 856.91 ± 13.14 e | 836.57 ± 9.30 ef | ||
| (E)-3-Hexanol | - | - | 7.43 ± 1.15 b | 6.35 ± 0.03 c | 5.46 ± 0.65 e | ||
| (E)-2-Hexanol | Grass | 329.68 ± 8.43 c | 370.35 ± 6.12 a | 98.30 ± 7.54 h | 222.67 ± 8.62 g | 356.45 ± 12.73 b | |
| (Z)-3-Hexanol | - | - | 1.11 ± 0.03 c | 1.35 ± 0.21 b | - | ||
| Subtotal | 1927.55 ± 28.12 bc | 2085.06 ± 15.77 b | 1546.52 ± 10.12 ef | 1787.63 ± 12.06 d | 1408.27 ± 17.32 f | ||
| Alcohols | |||||||
| Heptanol | Sweet wine | - | 0.70 ± 0.01 b | - | 1.07 ± 0.23 a | 0.63 ± 0.11 cd | |
| Octanol | Nutty | - | 0.67 ± 0.04 cd | 0.40 ± 0.01 e | 0.31 ± 0.02 efg | 0.82 ± 0.03 b | |
| Nonanol | 0.52 ± 0.02 bc | 1.19 ± 0.33 a | 0.46 ± 0.05 bc | - | - | ||
| Benzyl alcohol | - | - | 0.25 ± 0.04 e | 1.41 ± 0.22 a | - | ||
| Phenylethyl alcohol | Flower | 8.49 ± 0.12 d | 9.16 ± 1.21 d | 6.63 ± 0.65 f | 16.85 ± 2.09 b | 10.08 ± 0.43 d | |
| 2-Heptanol | 0.17 ± 0.01 fg | - | 0.82 ± 0.04 a | - | - | ||
| 1-Octen-3-ol | 0.59 ± 0.02 efg | 1.26 ± 0.02 a | 0.27 ± 0.01 i | 1.28 ± 0.14 a | 1.14 ± 0.02 b | ||
| 2-Ethyl hexanol | Flower | 2.04 ± 0.35 cd | 2.71 ± 0.07 bc | 2.65 ± 0.21 c | 3.55 ± 0.32 b | 0.93 ± 0.03 h | |
| Subtotal | 11.84 ± 1.26 j | 12.51 ± 1.27 g | 13.97 ± 2.35 f | 21.56 ± 3.87 abc | 12.07 ± 5.76 gh | ||
| Esters | |||||||
| Etnyl acetate | Vegetable oil | 2006.28 ± 19.51 f | 5086.95 ± 26.87 a | 1031.35 ± 10.71 g | 3057.43 ± 23.10 c | 2517.36 ± 15.46 de | |
| Ethyl propionate | Pineapple | - | - | 0.31 ± 0.02 fg | 2.18 ± 0.65 a | 0.49 ± 0.04 f | |
| Propyl acetate | - | 0.36 ± 0.06 d | - | - | - | ||
| Ethyl butyrate | Apple; banana | 136.54 ± 2.98 cd | 141.21 ± 8.75 c | 30.07 ± 4.81 jk | 210.77 ± 15.06 a | 37.54 ± 0.27 ij | |
| Butyl acetate | Fruity | 0.77 ± 0.02 e | 1.44 ± 0.16 c | - | 1.68 ± 0.15 b | - | |
| Ethyl pentanoate | - | - | - | 3.92 ± 0.07 c | - | ||
| Methyl hexanoate | - | - | 0.36 ± 0.05 e | 2.08 ± 0.62 b | - | ||
| Ethyl hexanoate | 0.17 ± 0.02 k | 0.74 ± 0.23 gh | - | 23.49 ± 3.12 a | 0.82 ± 0.02 g | ||
| Hexyl acetate | 0.52 ± 0.04 e | 1.19 ± 0.51 c | 3.45 ± 0.62 a | - | - | ||
| Ethyl heptanoate | Rose | - | 0.67 ± 0.02 f | 0.28 ± 0.03 f | 9.84 ± 1.34 b | - | |
| Ethyl octanoate | 0.37 ± 0.02 gh | 1.04 ± 0.08 g | - | 3.51 ± 0.62 e | 12.13 ± 1.65 a | ||
| Ethyl isobutyrate | Strawberries | 0.28 ± 0.03 j | 0.95 ± 0.05 i | 0.42 ± 0.01 ij | - | 8.77 ± 0.53 cd | |
| Benzoic acid ethyl ester | 0.84 ± 0.16 c | 1.51 ± 0.19 a | - | - | - | ||
| Methyl salicylate | - | - | - | - | 20.35 ± 2.26 c | ||
| Methyl anthranilate | - | 0.75 ± 0.01 i | 0.15 ± 0.01 k | 5.21 ± 0.12 fg | 7.13 ± 1.04 d | ||
| Ethyl 2-methylbutanoate | Fruity | 2.58 ± 0.51 ab | 2.99 ± 0.16 a | - | - | - | |
| Ethyl 3-methylbutanoate | 0.57 ± 0.05 d | 0.94 ± 0.04 c | - | - | - | ||
| (Z)-2-Butenoic acid, ethyl ester | - | - | - | 8.09 ± 0.07 c | 9.49 ± 1.56 b | ||
| 2-Hexenoic acid, ethyl ester | 0.48 ± 0.04 d | 0.95 ± 0.06 b | - | - | - | ||
| Ethyl-3-hydroxybutyrate | Wine | 0.55 ± 0.05 g | 1.22 ± 0.13 e | 0.49 ± 0.02 gh | 2.59 ± 0.64 de | 6.44 ± 1.27 b | |
| Subtotal | 2131.25 ± 76.42 h | 5731.92 ± 45.89 b | 2970.93 ± 62.71 fg | 3337.08 ± 15.02 f | 784.61 ± 20.82 jk | ||
| Acids | |||||||
| Hexanoic acid | 2.39 ± 0.05 e | 3.06 ± 0.24 d | 1.13 ± 0.45 g | - | 0.72 ± 0.02 j | ||
| Nonanoic acid | 0.81 ± 0.02 g | 1.48 ± 0.12 f | - | - | - | ||
| 2-Hexenoic | - | - | 0.91 ± 0.05 d | 2.08 ± 0.56 c | 0.43 ± 0.02 d | ||
| Subtotal | 3.20 ± 0.51 d | 3.87 ± 0.64 bc | 3.04 ± 0.92 de | 2.08 ± 0.56 f | 3.62 ± 1.54 c | ||
| Aldehydes | |||||||
| Pentanal | - | - | - | - | 6.76 ± 1.03 b | ||
| Heptanal | Herb | 4.87 ± 0.76 b | 5.54 ± 1.04 a | 0.21 ± 0.02 f | 1.28 ± 0.06 e | 0.51 ± 0.04 f | |
| Octanal | 0.66 ± 0.02 d | 1.33 ± 0.05 b | - | - | - | ||
| Nonanal | - | - | - | 1.93 ± 0.62 f | 4.65 ± 0.61 d | ||
| Decanal | Citrus Peel | - | - | 2.69 ± 0.74 c | - | - | |
| Benzaldehyde | 3.45 ± 0.07 h | 4.12 ± 0.60 g | - | 9.77 ± 1.25 c | 5.96 ± 0.03 f | ||
| Phenylacetaldehyde | Hyacinth | 1.05 ± 0.02 ij | 1.72 ± 0.43 i | 7.48 ± 0.22 b | 5.49 ± 1.01 d | 4.19 ± 0.05 ef | |
| (Z)-2-hepental | 0.21 ± 0.01 d | 0.88 ± 0.01 c | - | - | - | ||
| (E)-2-nonenal | 5.65 ± 0.92 b | 6.32 ± 0.33 a | 5.83 ± 0.07 b | - | 4.68 ± 0.16 e | ||
| Subtotal | 15.89 ± 1.43 f | 16.56 ± 2.01 e | 18.16 ± 2.17 d | 15.95 ± 3.50 f | 27.31 ± 4.51 b | ||
| Terpenes | - | - | |||||
| α-Pinene | Resin | 11.07 ± 0.47 efg | 11.74 ± 1.32 ef | 44.35 ± 5.64 a | - | 12.99 ± 0.85 e | |
| β-Pinene | Resin | 17.08 ± 1.20 ab | 18.75 ± 2.16 a | 8.82 ± 0.59 de | 5.98 ± 0.04 g | 7.10 ± 1.03 ef | |
| Eucalyptol | 15.38 ± 0.54 cd | 16.05 ± 0.22 c | 36.74 ± 2.17 b | 7.11 ± 0.42 hi | 5.42 ± 0.06 i | ||
| Nerol ooxide | 14.39 ± 0.32 ab | 15.06 ± 0.54 a | 13.04 ± 0.02 b | - | - | ||
| Linalool | 10.04 ± 1.58 e | 10.71 ± 0.02 e | - | 38.93 ± 2.40 a | - | ||
| Neral | Grass | 17.51 ± 1.22 a | - | 15.81 ± 1.55 c | - | - | |
| Geranial cis-Linalool oxide | Rose | 1.44 ± 0.04 j | 2.11 ± 0.08 j | 49.52 ± 3.40 a | 5.45 ± 0.08 g | 7.62 ± 0.37 f | |
| Citral Linalool oxide | 12.50 ± 1.33 e | 15.17 ± 2.21 d | 4.66 ± 0.05 i | 8.77 ± 0.21 g | 25.86 ± 2.20 b | ||
| Citronellol | 415.77 ± 33.41 cd | 616.44 ± 15.84 a | - | - | 84.58 ± 8.71 g | ||
| Geranic acid | Vegetables | 10.58 ± 0.91 h | 11.25 ± 0.49 h | 105.48 ± 7.34 d | 214.00 ± 3.01 a | 18.13 ± 0.06 f | |
| α-Phellandrene | 3.19 ± 1.43 k | 6.86 ± 0.72 hij | 28.77 ± 2.31 c | 15.39 ± 0.31 ef | 8.84 ± 0.95 h | ||
| α-Terpinene | 4.40 ± 0.02 e | 5.65 ± 1.01 d | 19.94 ± 0.55 a | - | 3.06 ± 0.30 e | ||
| α-Terpineol | Flower | 3.73 ± 0.01 g | 4.24 ± 0.05 g | 40.71 ± 1.62 b | - | - | |
| β-Myrcene | Grass | 10.26 ± 0.03 c | 12.93 ± 1.43 b | - | 4.33 ± 0.65 f | 2.94 ± 0.02 gh | |
| β-Ocimene | - | 8.31 ± 0.10 e | - | - | 19.15 ± 1.76 a | ||
| (Z)-Limonene | - | 5.41 ± 0.16 fg | - | - | 14.20 ± 3.04 c | ||
| γ-Terpinene | Lemon | 1.41 ± 0.03 gh | 2.08 ± 0.06 g | 8.35 ± 0.06 bc | 6.45 ± 1.03 d | - | |
| 4-Terpinene | - | - | - | - | - | ||
| o-Cymene | 4.83 ± 0.54 g | 8.50 ± 1.22 f | 48.88 ± 3.02 a | 15.97 ± 0.06 d | 10.42 ± 1.15 e | ||
| m-Cymene | - | 1.71 ± 0.53 gh | 37.27 ± 2.19 b | 8.96 ± 0.29 ef | 4.80 ± 0.04 g | ||
| Terpinolene | Nutty | - | - | - | - | 22.23 ± 2.07 b | |
| Eugenol | Lilac | 8.07 ± 0.09 c | 8.74 ± 0.35 b | 0.34 ± 0.06 j | - | - | |
| Hotrienol | 13.45 ± 1.27 cd | 17.12 ± 0.04 bc | 7.10 ± 0.05 g | 4.52 ± 0.31 h | 16.95 ± 1.41 c | ||
| Myrtenol | Mint | - | 0.67 ± 0.01 h | - | - | 7.24 ± 0.05 a | |
| Isogeraniol | - | 18.88 ± 1.34 g | 43.33 ± 2.15 d | 10.62 ± 1.43 hi | - | ||
| E-Nerolidol | 12.13 ± 1.72 d | 12.80 ± 0.56 d | 11.67 ± 0.94 de | - | 16.22 ± 0.65 c | ||
| cis-β-Ocimene | - | - | 53.13 ± 4.62 b | 1.26 ± 0.03 f | - | ||
| trans-β-Ocimene | Citrus | - | - | 24.10 ± 3.47 d | - | 10.50 ± 2.07 g | |
| cis-Rose oxide | Rose | 17.15 ± 1.89 g | 17.82 ± 1.23 g | - | 42.13 ± 3.14 c | 20.97 ± 0.51 f | |
| trans-Rose oxide | Litchi | 18.91 ± 2.52 g | 29.58 ± 4.61 e | 30.91 ± 3.62 e | 13.44 i | - | |
| Subtotal | 679.50 ± 22.64 ef | 800.17 ± 20.05 d | 571.33 ± 44.72 g | 390.71 ± 15.23 ij | 300.45 ± 8.32 k | ||
| C13-Norisoprenoids | - | - | |||||
| β-Damascenone | Honey | - | 2.24 ± 0.24 a | - | 1.08 ± 0.03 d | 0.72 ± 0.07 de | |
| β-Ionone | Violets | 1.65 ± 0.05 d | 2.32 ± 0.07 c | - | 1.05 ± 0.06 f | - | |
| Geranylacetone | Flower | 1.41 ± 0.03 c | 2.08 ± 0.01 b | - | - | - | |
| Subtotal | 4.63 ± 0.11 bc | 6.64 ± 1.05 a | 0 | 1.29 ± 0.10 f | 0.72 ± 0.07 fg | ||
| TOTAL | 5839.03 ± 54.91 de | 8766.91 ± 122.41 a | 3524.59 ± 22.51 ijk | 5549.57 ± 72.82 e | 2836.64 ± 22.26 k | ||
| Aroma Compounds (μg/L) | Aroma Type | Grape Varieties | |||||
| Jumeigui | Shine-Muscat | Hutai 8 Hao | Heisetiancai | Zitianwuhe | Sunmmer Black | ||
| C6 Compounds | |||||||
| Hexanal | 237.52 ± 3.17 i | 307.41 ± 7.48 gh | 276.51 ± 1.05 hi | 354.71 ± 12.36 f | 286.51 ± 0.12 h | 167.15 ± 0.91 jk | |
| Hexanol | Fruity | 90.01 ± 0.16 f | 156.82 ± 4.20 d | 201.28 ± 7.91 b | 72.71 ± 0.90 g | 190.28 ± 4.63 c | 159.82 ± 3.23 d |
| 3-Hexanal | Fruity | 6.84 ± 0.09 cd | 9.04 ± 0.96 a | - | 1.19 ± 0.13 g | - | 0.12 ± 0.01 j |
| (E)-2-Hexanal | 988.43 ± 9.23 c | 1124.60 ± 7.57 a | 863.19 ± 5.00 e | 726.65 ± 3.16 i | 813.19 ± 8.91 fg | 703.91 ± 16.32 ijk | |
| (E)-3-Hexanol | - | - | 0.25 ± 0.01 h | 5.06 ± 0.24 d | - | - | |
| (E)-2-Hexanol | Grass | 361.92 ± 10.51 a | 329.68 ± 6.33 c | 83.81 ± 0.22 i | 357.45 ± 15.62 b | 63.85 ± 4.72 j | 243.60 ± 3.52 e |
| (Z)-3-Hexanol | - | - | - | - | - | - | |
| Subtotal | 1684.72 ± 44.81 d | 1927.55 ± 36.02 b | 1425.16 ± 22.75 e | 1498.17 ± 46.75 e | 1354.25 ± 29.03 f | 1252.31 ± 30.40 g | |
| Alcohols | |||||||
| Heptanol | Sweet wine | - | - | 0.37 ± 0.01 e | 0.63 ± 0.03 bcd | 0.71 ± 0.04 b | - |
| Octanol | Nutty | - | - | 0.65 ± 0.02 d | 0.82 ± 0.11 b | 0.64 ± 0.02 d | 1.25 ± 0.02 b |
| Nonanol | - | 0.52 ± 0.12 c | - | - | 0.42 ± 0.04 d | - | |
| Benzyl alcohol | - | - | - | - | - | - | |
| Phenylethyl alcohol | Flower | 4.08 ± 0.55 gh | 8.49 ± 0.34 b | 9.19 ± 0.62 a | 8.01 ± 0.55 bc | 6.53 ± 0.74 e | 4.95 ± 0.61 g |
| 2-Heptanol | - | 0.17 ± 0.01 e | - | - | - | - | |
| 1-Octen-3-ol | - | 0.59 ± 0.02 c | - | 0.81 ± 0.03 a | 0.62 ± 0.06 c | - | |
| 2-Ethyl hexanol | Flower | 5.08 ± 0.07 b | 1.84 ± 0.01 f | 2.07 ± 0.03 f | 3.93 ± 0.05 e | 1.47 ± 0.12 g | 6.20 ± 0.35 a |
| Subtotal | 9.54 ± 1.21 g | 11.84 ± 1.25 de | 12.40 ± 2.31 d | 14.40 ± 0.59 b | 10.45 ± 0.26 f | 11.42 ± 0.49 e | |
| Esters | |||||||
| Etnyl acetate | Vegetable oil | 473.34 ± 15.66 l | 686.28 ± 22.40 i | 540.97 ± 15.39 k | 470.53 ± 10.54 kl | 541.28 ± 20.13 k | 490.91 ± 13.47 jk |
| Ethyl propionate | Pineapple | - | - | 2.18 ± 0.03 bc | - | 2.49 ± 0.02 b | 1.36 ± 0.03 f |
| Ethyl butyrate | Banana | 142.21 ± 2.46 c | 140.54 ± 3.08 c | 157.27 ± 1.67 b | 57.59 ± 2.02 j | 137.58 ± 1.80 cd | 105.42 ± 2.31 g |
| Butyl acetate | Fruity | 0.52 ± 0.02 i | 0.77 ± 0.03 g | - | 0.91 ± 0.03 d | 0.98 ± 0.02 c | 1.13 ± 0.01 c |
| Ethyl pentanoate | - | - | 0.67 ± 0.01 d | - | - | 0.82 ± 0.02 c | |
| Methyl hexanoate | - | - | 6.05 ± 0.36 ab | - | 6.46 ± 0.41 a | 3.41 ± 0.13 e | |
| Ethyl hexanoate | - | 0.17 ± 0.01 g | 15.06 ± 0.02 b | - | 11.37 ± 0.75 d | - | |
| Hexyl acetate | - | 0.52 ± 0.02 h | - | - | 1.03 ± 0.03 f | 0.74 ± 0.11 g | |
| Ethyl heptanoate | Rose | 0.54 ± 0.01 i | - | 5.81 ± 0.65 b | - | 6.12 ± 0.83 b | - |
| Ethyl octanoate | - | 0.37 ± 0.02 k | - | 12.13 ± 0.19 a | - | - | |
| Ethyl isobutyrate | Strawberries | - | - | 13.09 ± 1.06 b | 8.77 ± 0.07 f | 8.40 ± 0.31 f | 10.26 ± 1.09 d |
| Benzoic acid ethyl ester | 3.06 ± 0.13 d | 0.84 ± 0.02 h | - | - | - | - | |
| Methyl salicylate | - | 5.06 ± 0.70 e | - | 10.02 ± 0.40 b | - | - | |
| Methyl anthranilate | - | - | - | 6.91 ± 0.05 f | - | 12.51 ± 0.23 c | |
| Ethyl 2-methylbutanoate | Fruity | - | - | 10.58 ± 1.10 a | - | - | 6.35 ± 0.63 f |
| Ethyl 3-methylbutanoate | Fruity | - | 0.57 ± 0.03 j | 13.42 ± 0.61 c | - | 10.03 ± 0.26 de | - |
| (Z)-2-Butenoic acid, ethyl ester | - | 4.21 ± 0.05 g | - | 9.16 ± 0.06 c | - | - | |
| 2-Hexenoic acid, ethyl ester | 1.34 ± 0.04 i | 0.28 ± 0.02 k | 12.81 ± 1.42 ab | - | 13.12 ± 0.03 a | - | |
| Ethyl-3-hydroxybutyrate | Wine | - | 0.55 ± 0.01 i | - | 8.31 ± 1.05 c | - | 5.77 ± 0.41 e |
| Subtotal | 561.01 ± 12.10 hi | 773.25 ± 22.43 d | 698.01 ± 10.65 ef | 584.33 ± 8.70 h | 724.32 ± 15.91 de | 534.61 ± 7.49 ij | |
| Acids | |||||||
| Hexanoic acid | - | 2.39 ± 0.03 a | - | 0.57 ± 0.01 f | - | - | |
| Nonanoic acid | - | 0.81 ± 0.01 f | 1.06 ± 0.02 e | - | 1.37 ± 0.02 d | - | |
| 2-Hexenoic | - | - | - | 2.11 ± 0.01 d | - | - | |
| Subtotal | 0 | 3.20 ± 0.21 a | 1.06 ± 0.02 e | 2.68 ± 0.04 b | 1.37 ± 0.02 e | 0 | |
| Aldehydes | |||||||
| Pentanal | 1.05 ± 0.02 f | - | - | 6.76 ± 0.15 a | - | 1.13 ± 0.12 f | |
| Heptanal | Herb | - | 4.87 ± 0.32 fg | 15.07 ± 0.36 b | 0.51 ± 0.01 j | 15.52 ± 0.07 b | 0.25 ± 0.03 j |
| Octanal | - | 0.66 ± 0.02 d | - | - | - | - | |
| Nonanal | - | - | 2.73 ± 0.05 e | 4.77 ± 0.52 b | - | 0.63 ± 0.08 | |
| Decanal | Citrus Peel | 2.51 ± 0.03 c | - | 1.99 ± 0.12 d | - | 2.07 ± 0.12 d | - |
| Benzaldehyde | - | 3.45 ± 0.16 fh | 8.74 ± 1.10 c | 2.94 ± 0.06 i | 6.25 ± 0.61 de | 4.27 ± 0.30 f | |
| Phenylacetaldehyde | Hyacinth | 1.59 ± 0.02 e | 1.05 ± 0.33 ef | - | 4.19 ± 0.31 c | - | - |
| (Z)-2-hepental | 8.51 ± 0.17 a | 0.21 ± 0.01 j | 2.92 ± 0.13 e | - | 3.23 ± 0.02 e | 0.61 ± 0.04 i | |
| (E)-2-nonenal | 1.65 ± 0.08 e | 5.65 ± 0.31 b | - | 4.68 ± 0.22 c | 0.31 ± 0.02 j | - | |
| Subtotal | 15.31 ± 1.46 i | 15.89 ± 1.22 i | 31.59 ± 3.24 a | 23.85 ± 2.45 d | 21.90 ± 1.97 e | 6.41 ± 0.41 k | |
| Terpenes | |||||||
| α-Pinene | Resin | - | 11.07 ± 0.26 f | 16.98 ± 1.05 c | 5.97 ± 0.14 i | 10.29 ± 1.22 f | 1.93 ± 0.04 i |
| β-Pinene | Resin | 5.72 ± 0.64 f | 18.08 ± 0.13 a | - | 7.19 ± 0.25 e | 8.26 ± 0.38 e | - |
| Eucalyptol | 25.18 ± 3.19 a | 15.38 ± 0.25 c | 4.13 ± 0.05 gf | 3.44 ± 0.09 g | 5.64 ± 1.04 f | 2.25 ± 0.21 h | |
| Nerol ooxide | 9.14 ± 1.30 b | - | 4.34 ± 0.12 e | - | 7.65 ± 0.01 c | 1.30 ± 0.02 g | |
| Linalool | 139.53 ± 0.15 e | 10.04 ± 1.05 h | 19.82 ± 1.30 f | - | 20.13 ± 0.22 f | - | |
| Neral | Grass | 11.78 ± 1.36 de | 17.51 ± 1.11 c | - | - | - | 5.48 ± 0.06 h |
| Geranial cis-Linalool oxide | Rose | 10.86 ± 0.24 f | 1.44 ± 0.03 j | 6.72 ± 0.20 h | 17.67 ± 1.32 d | 7.03 ± 0.06 g | 1.91 ± 0.01 j |
| Citral Linalool oxide | 6.72 ± 0.15 h | 14.50 ± 1.06 c | 10.04 ± 0.49 d | 15.39 ± 0.24 b | 10.85 ± 0.31 d | 8.71 ± 0.15 g | |
| Citronellol | 19.25 ± 0.34 h | 615.77 ± 5.72 a | - | 71.63 ± 3.79 e | 5.75 ± 0.03 i | 106.37 ± 2.31 c | |
| Geranic acid | Vegetables | 262.30 ± 6.97 a | 10.58 ± 0.04 j | 80.85 ± 5.37 c | 18.13 ± 1.00 i | 91.16 ± 2.35 b | 55.41 ± 3.06 g |
| α-Phellandrene | 7.54 ± 0.30 d | 6.19 ± 0.62 e | 4.13 ± 0.04 j | 8.84 ± 0.06 c | - | - | |
| α-Terpinene | 34.84 ± 2.16 a | 4.98 ± 0.71 g | 10.80 ± 1.21 e | 3.06 ± 0.12 h | 11.21 ± 1.07 e | - | |
| α-Terpineol | Flower | - | 3.73 ± 0.45 f | 3.91 ± 0.03 f | 0.89 ± 0.02 g | - | 10.83 ± 0.64 c |
| β-Myrcene | Grass | 3.34 ± 0.05 j | 12.26 ± 0.82 e | - | 3.91 ± 0.21 j | 19.97 ± 1.20 d | 13.65 ± 1.28 e |
| β-Ocimene | 24.50 ± 1.33 b | 7.64 ± 0.93 g | 18.92 ± 1.36 c | - | 11.23 ± 0.39 f | 7.26 ± 0.06 g | |
| (Z)-Limonene | - | 4.79 ± 0.80 g | - | 14.20 ± 1.30 d | - | - | |
| γ-Terpinene | Lemon | 34.03 ± 0.62 a | 1.41 ± 0.03 i | - | - | 9.49 ± 0.23 e | 7.43 ± 0.67 f |
| 4-Terpinene | 11.63 ± 1.50 c | - | - | 0.21 ± 0.01 g | - | 0.95 ± 0.03 g | |
| o-Cymene | 13.26 ± 0.06 d | - | 4.31 ± 0.45 j | 11.49 ± 1.04 d | 7.62 ± 0.26 h | 6.80 ± 0.11 i | |
| m-Cymene | - | 1.04 ± 0.02 g | - | 3.53 ± 0.03 e | - | - | |
| Terpinolene | Nutty | 24.96 ± 2.08 a | - | 1.87 ± 0.38 h | 4.21 ± 0.55 g | 2.18 ± 0.17 h | - |
| Eugenol | Lilac | 0.47 ± 0.02 h | 8.02 ± 0.30 d | - | 12.52 ± 1.08 c | - | - |
| Hotrienol | 36.66 ± 1.59 a | 16.45 ± 1.11 d | 3.11 ± 0.22 h | - | 4.82 ± 0.23 g | 13.51 ± 0.16 d | |
| Myrtenol | Mint | - | - | 12.58 ± 0.01 f | 27.28 ± 1.21 b | 14.89 ± 0.35 e | 20.63 ± 1.22 c |
| Isogeraniol | 8.94 ± 0.05 f | 18.21 ± 0.57 c | - | - | - | - | |
| E-Nerolidol | 6.73 ± 0.12 f | 12.13 ± 0.84 c | 5.35 ± 0.16 g | 14.29 ± 0.40 b | 9.66 ± 0.50 e | 0.95 ± 0.07 k | |
| cis-β-Ocimene | 15.40 ± 0.06 b | - | - | 3.54 ± 0.06 f | - | 8.42 ± 0.31 d | |
| trans-β-Ocimene | Citrus | 20.06 ± 0.21 a | - | 17.26 ± 1.07 b | 13.05 ± 0.89 e | - | 12.39 ± 1.10 e |
| cis-Rose oxide | Rose | 31.51 ± 2.13 a | 17.15 ± 1.62 c | - | 16.91 ± 1.73 cd | - | - |
| trans-Rose oxide | Litchi | 13.30 ± 0.66 e | 28.91 ± 2.15 a | 19.24 ± 1.26 c | - | 19.55 ± 0.34 c | 11.62 ± 0.51 f |
| Subtotal | 719.69 ± 15.41 d | 879.50 ± 22.37 c | 301.14 ± 10.55 h | 225.89 ± 5.16 i | 421.45 ± 8.19 g | 253.25 ± 5.21 hi | |
| C13-Norisoprenoids | |||||||
| β-Damascenone | Honey | 1.86 ± 0.03 a | 1.07 ± 0.02 b | - | 0.62 ± 0.10 f | - | - |
| β-Ionone | Violets | 1.43 ± 0.15 ab | 1.65 ± 0.08 a | 0.47 ± 0.05 e | - | 0.78 ± 0.01 cd | 0.91 ± 0.04 c |
| Geranylacetone | Flower | 1.10 ± 0.02 c | 1.41 ± 0.11 b | - | - | - | 0.27 ± 0.02 f |
| Subtotal | 3.43 ± 0.21 c | 4.63 ± 0.30 a | 0.47 ± 0.05 fg | 0.62 ± 0.10 ef | 0.96 ± 0.01 e | 1.18 ± 0.07 d | |
| TOTAL | 4150.27 ± 23.46 h | 6566.03 ± 57.19 c | 2558.30 ± 26.20 k | 2046.64 ± 18.85 kl | 3121.05 ± 30.02 i | 2719.55 ± 38.41 k | |
Disclaimer/Publisher’s Note: The statements, opinions and data contained in all publications are solely those of the individual author(s) and contributor(s) and not of MDPI and/or the editor(s). MDPI and/or the editor(s) disclaim responsibility for any injury to people or property resulting from any ideas, methods, instructions or products referred to in the content. |
© 2023 by the authors. Licensee MDPI, Basel, Switzerland. This article is an open access article distributed under the terms and conditions of the Creative Commons Attribution (CC BY) license (https://creativecommons.org/licenses/by/4.0/).
Share and Cite
Wang, W.-N.; Qian, Y.-H.; Liu, R.-H.; Liang, T.; Ding, Y.-T.; Xu, X.-L.; Huang, S.; Fang, Y.-L.; Ju, Y.-L. Effects of Table Grape Cultivars on Fruit Quality and Aroma Components. Foods 2023, 12, 3371. https://doi.org/10.3390/foods12183371
Wang W-N, Qian Y-H, Liu R-H, Liang T, Ding Y-T, Xu X-L, Huang S, Fang Y-L, Ju Y-L. Effects of Table Grape Cultivars on Fruit Quality and Aroma Components. Foods. 2023; 12(18):3371. https://doi.org/10.3390/foods12183371
Chicago/Turabian StyleWang, Wan-Ni, Yun-Hui Qian, Ruo-Han Liu, Tao Liang, Yin-Ting Ding, Xue-Lei Xu, Shan Huang, Yu-Lin Fang, and Yan-Lun Ju. 2023. "Effects of Table Grape Cultivars on Fruit Quality and Aroma Components" Foods 12, no. 18: 3371. https://doi.org/10.3390/foods12183371
APA StyleWang, W.-N., Qian, Y.-H., Liu, R.-H., Liang, T., Ding, Y.-T., Xu, X.-L., Huang, S., Fang, Y.-L., & Ju, Y.-L. (2023). Effects of Table Grape Cultivars on Fruit Quality and Aroma Components. Foods, 12(18), 3371. https://doi.org/10.3390/foods12183371