
Protein Quality and Protein Digestibility of Vegetable Creams Reformulated with Microalgae Inclusion
 ,
,  , , ,
, , ,
Abstract
:1. Introduction
2. Material and Methods
2.1. Material and Preparation Procedure of Vegetable Creams
2.2. In Vitro Simulated Digestion
2.3. Measurements and Analysis
2.3.1. Optical Microscopy
2.3.2. Total Amino Acids
2.3.3. Protein Content
2.3.4. Degree of Protein Hydrolysis (DH%)
2.3.5. Statistical Analysis
3. Results and Discussion
3.1. Microalgae Protein Characterization
3.1.1. Appearance of Microalgal Cells
3.1.2. Protein Content and Amino Acid Composition
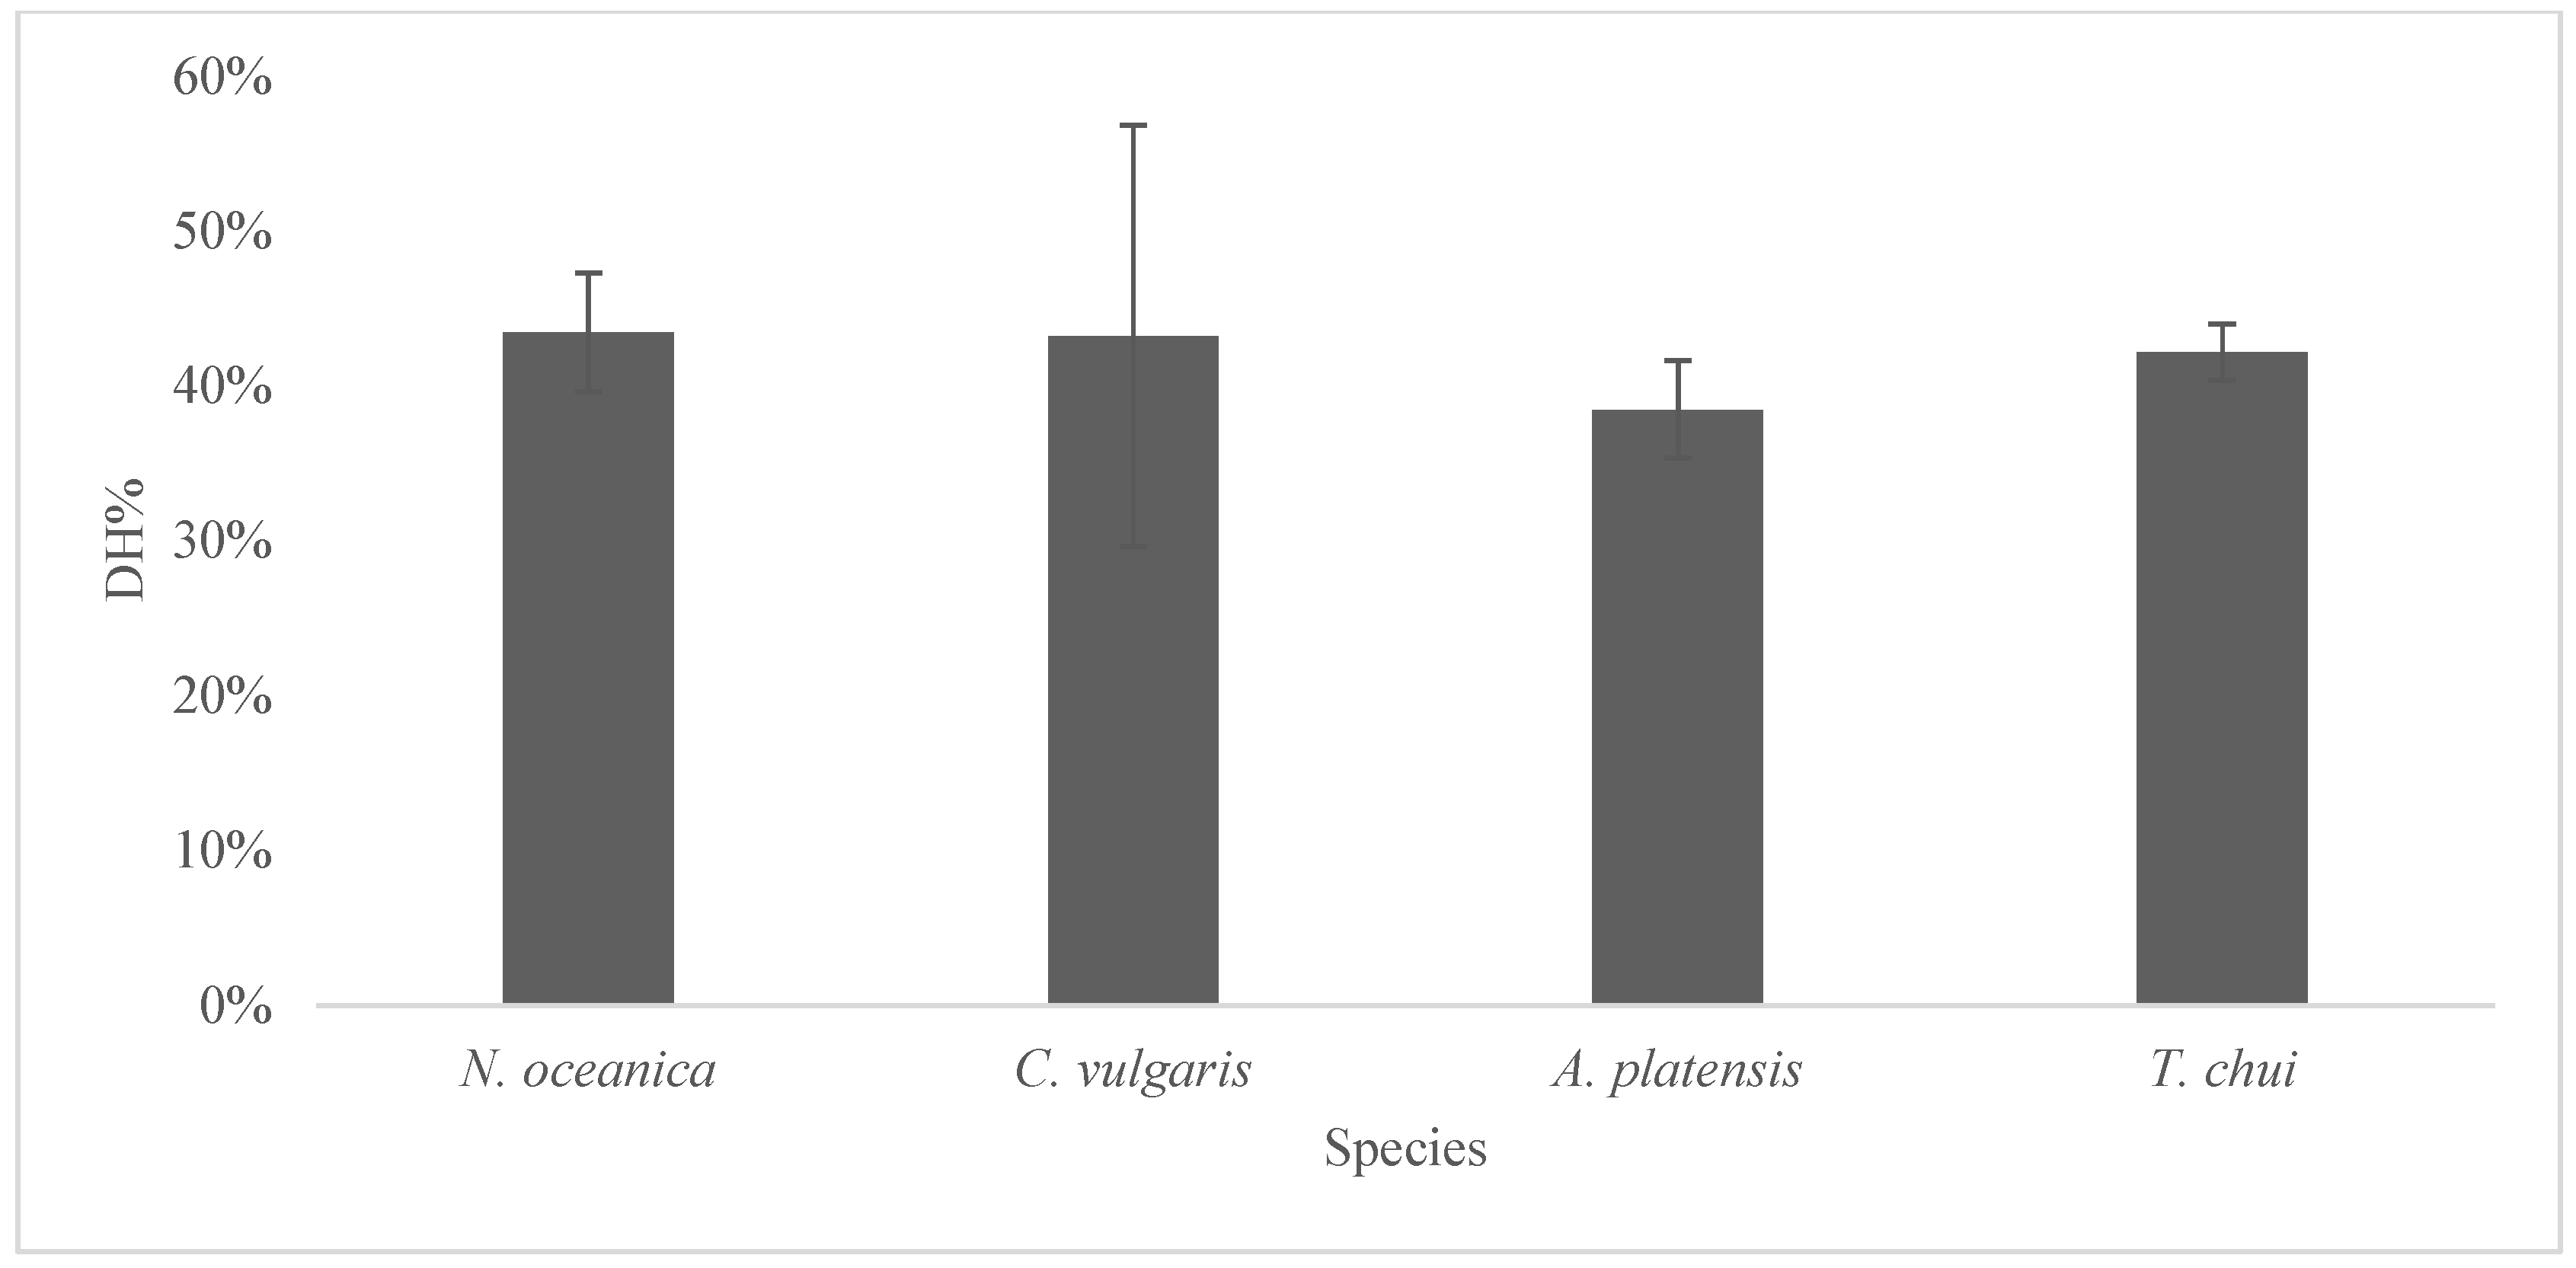
3.1.3. Protein in Vitro Digestibility
3.2. Effect of Microalgae Incorporation on Protein Composition of Vegetable Creams
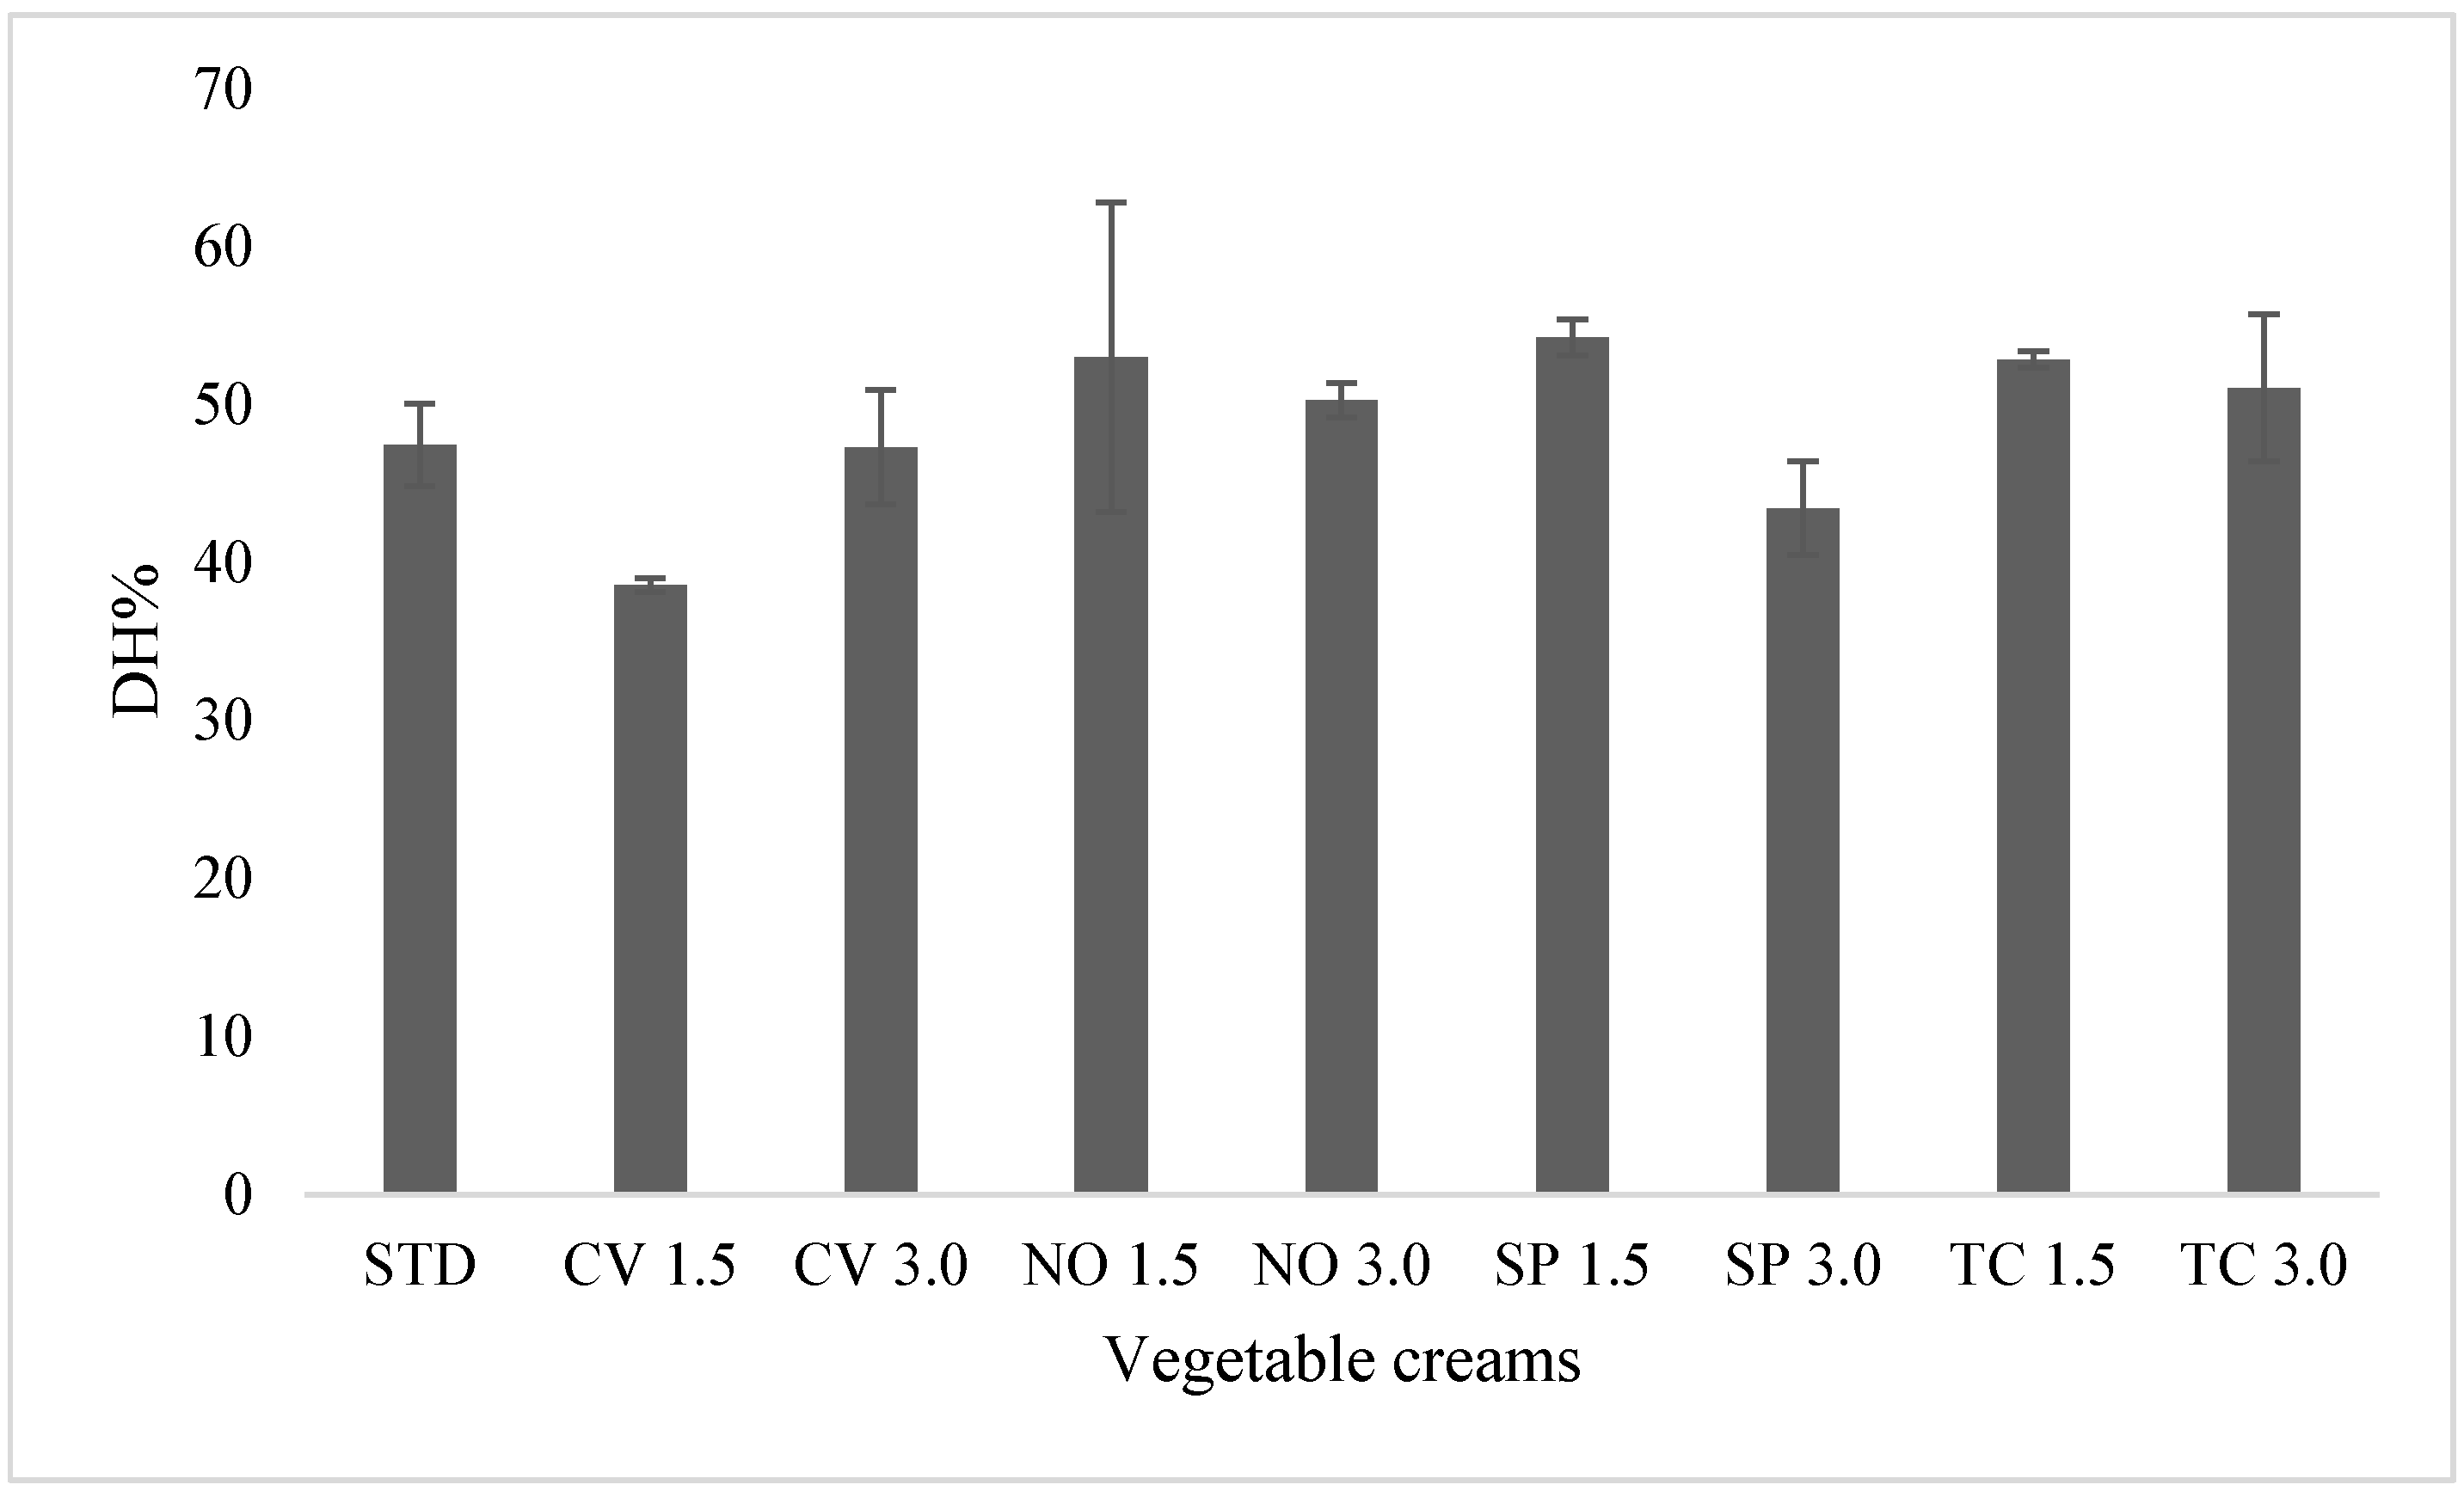
3.3. Effect of Microalgae Incorporation on Protein Digestibility of Vegetable Creams
4. Conclusions
Supplementary Materials
Author Contributions
Funding
Data Availability Statement
Acknowledgments
Conflicts of Interest
References
- Koyande, A.K.; Chew, K.W.; Rambabu, K.; Tao, Y.; Chu, D.T.; Show, P.L. Microalgae: A Potential Alternative to Health Supplementation for Humans. Food Sci. Hum. Wellness 2019, 8, 16–24. [Google Scholar] [CrossRef]
- Araújo, R.; Vázquez Calderón, F.; Sánchez López, J.; Azevedo, I.C.; Bruhn, A.; Fluch, S.; Garcia Tasende, M.; Ghaderiardakani, F.; Ilmjärv, T.; Laurans, M.; et al. Current Status of the Algae Production Industry in Europe: An Emerging Sector of the Blue Bioeconomy. Front. Mar. Sci. 2021, 7, 1247. [Google Scholar] [CrossRef]
- United Nations Transforming Our World: The 2030 Agenda for Sustainable Development. Department of Economic and Social Affairs. Available online: https://sdgs.un.org/2030agenda (accessed on 27 January 2022).
- You, X.; Yang, L.; Zhou, X.; Zhang, Y. Sustainability and Carbon Neutrality Trends for Microalgae-Based Wastewater Treatment: A Review. Environ. Res. 2022, 209, 112860. [Google Scholar] [CrossRef]
- Tandon, P.; Jin, Q.; Huang, L. A Promising Approach to Enhance Microalgae Productivity by Exogenous Supply of Vitamins. Microb. Cell Factories 2017, 16, 219. [Google Scholar] [CrossRef] [Green Version]
- Onyeaka, H.; Miri, T.; Obileke, K.; Hart, A.; Anumudu, C.; Al-Sharify, Z.T. Minimizing Carbon Footprint via Microalgae as a Biological Capture. Carbon Capture Sci. Technol. 2021, 1, 100007. [Google Scholar] [CrossRef]
- Nethravathy, M.U.; Mehar, J.G.; Mudliar, S.N.; Shekh, A.Y. Recent Advances in Microalgal Bioactives for Food, Feed, and Healthcare Products: Commercial Potential, Market Space, and Sustainability. Compr. Rev. Food Sci. Food Saf. 2019, 18, 1882–1897. [Google Scholar] [CrossRef] [Green Version]
- Conde, T.A.; Neves, B.F.; Couto, D.; Melo, T.; Neves, B.; Costa, M.; Silva, J.; Domingues, P.; Domingues, M.R. Microalgae as Sustainable Bio-Factories of Healthy Lipids: Evaluating Fatty Acid Content and Antioxidant Activity. Mar. Drugs 2021, 19, 357. [Google Scholar] [CrossRef]
- Kumar, G.; Shekh, A.; Jakhu, S.; Sharma, Y.; Kapoor, R.; Sharma, T.R. Bioengineering of Microalgae: Recent Advances, Perspectives, and Regulatory Challenges for Industrial Application. Front. Bioeng. Biotechnol. 2020, 8, 914. [Google Scholar] [CrossRef]
- Schmid, B.; Navalho, S.; Schulze, P.S.C.; Van De Walle, S.; Van Royen, G.; Schüler, L.M.; Maia, I.B.; Bastos, C.R.V.; Baune, M.-C.; Januschewski, E.; et al. Drying Microalgae Using an Industrial Solar Dryer: A Biomass Quality Assessment. Foods 2022, 11, 1873. [Google Scholar] [CrossRef]
- Boukid, F.; Rosell, C.M.; Rosene, S.; Bover-Cid, S.; Castellari, M. Non-Animal Proteins as Cutting-Edge Ingredients to Reformulate Animal-Free Foodstuffs: Present Status and Future Perspectives. Crit. Rev. Food Sci. Nutr. 2021, 137, 1–31. [Google Scholar] [CrossRef]
- Caporgno, M.P.; Mathys, A. Trends in Microalgae Incorporation into Innovative Food Products with Potential Health Benefits. Front. Nutr. 2018, 5, 58. [Google Scholar] [CrossRef] [PubMed]
- Boukid, F.; Castellari, M. Food and Beverages Containing Algae and Derived Ingredients Launched in the Market from 2015 to 2019: A Front-of-Pack Labeling Perspective with a Special Focus on Spain. Foods 2021, 10, 173. [Google Scholar] [CrossRef] [PubMed]
- Khemiri, S.; Khelifi, N.; Nunes, M.C.; Ferreira, A.; Gouveia, L.; Smaali, I.; Raymundo, A. Microalgae Biomass as an Additional Ingredient of Gluten-Free Bread: Dough Rheology, Texture Quality and Nutritional Properties. Algal Res. 2020, 50, 101998. [Google Scholar] [CrossRef]
- Lafarga, T.; Acién-Fernández, F.G.; Castellari, M.; Villaró, S.; Bobo, G.; Aguiló-Aguayo, I. Effect of Microalgae Incorporation on the Physicochemical, Nutritional, and Sensorial Properties of an Innovative Broccoli Soup. LWT 2019, 111, 167–174. [Google Scholar] [CrossRef]
- Agustini, T.; Ma’Ruf, W.; Widayat, S.; Hadiyanto, B. Application of Spirulina Platensis on Ice Cream and Soft Cheese with Respect to Their Nutritional and Sensory Perspectives. J. Teknol. 2016, 78, 245–251. [Google Scholar] [CrossRef] [Green Version]
- EU Commission List of Authorisations under the Former Novel Food Regulation. Available online: https://ec.europa.eu/food/safety/novel-food/authorisations/list-authorisations-under-former-novel-food-regulation_de (accessed on 28 November 2021).
- Thirumdas, R.; Brnčić, M.; Brnčić, S.R.; Barba, F.J.; Gálvez, F.; Zamuz, S.; Lacomba, R.; Lorenzo, J.M. Evaluating the Impact of Vegetal and Microalgae Protein Sources on Proximate Composition, Amino Acid Profile, and Physicochemical Properties of Fermented Spanish “Chorizo” Sausages. J. Food Process. Preserv. 2018, 42, e13817. [Google Scholar] [CrossRef]
- Gorissen, S.H.M.; Crombag, J.J.R.; Senden, J.M.G.; Waterval, W.A.H.; Bierau, J.; Verdijk, L.B.; Van Loon, L.J.C. Protein Content and Amino Acid Composition of Commercially Available Plant-Based Protein Isolates. Amino Acids 2018, 50, 1685–1695. [Google Scholar] [CrossRef] [Green Version]
- Rodríguez-Miranda, E.; Guzmán, J.L.; Acién, F.G.; Berenguel, M.; Visioli, A. Indirect Regulation of Temperature in Raceway Reactors by Optimal Management of Culture Depth. Biotechnol. Bioeng. 2021, 118, 1186–1198. [Google Scholar] [CrossRef]
- Sui, Y.; Vlaeminck, S.E. Effects of Salinity, PH and Growth Phase on the Protein Productivity by Dunaliella Salina. J. Chem. Technol. Biotechnol. 2019, 94, 1032–1040. [Google Scholar] [CrossRef]
- Ermis, H.; Altinbas, M. Effect of Salinity on Mixed Microalgae Grown in Anaerobic Liquid Digestate. Water Environ. J. 2020, 34, 820–830. [Google Scholar] [CrossRef]
- Van De Walle, S.; Broucke, K.; Baune, M.-C.; Terjung, N.; Van Royen, G.; Boukid, F. Microalgae Protein Digestibility: How to Crack Open the Black Box? Food Sci. Nutr. 2023, 1–23. [Google Scholar] [CrossRef]
- Niccolai, A.; Chini Zittelli, G.; Rodolfi, L.; Biondi, N.; Tredici, M.R. Microalgae of Interest as Food Source: Biochemical Composition and Digestibility. Algal Res. 2019, 42, 101617. [Google Scholar] [CrossRef]
- Tibbetts, S.M.; Whitney, C.G.; MacPherson, M.J.; Bhatti, S.; Banskota, A.H.; Stefanova, R.; McGinn, P.J. Biochemical Characterization of Microalgal Biomass from Freshwater Species Isolated in Alberta, Canada for Animal Feed Applications. Algal Res. 2015, 11, 435–447. [Google Scholar] [CrossRef] [Green Version]
- Kose, A.; Oncel, S.S. Properties of Microalgal Enzymatic Protein Hydrolysates: Biochemical Composition, Protein Distribution and FTIR Characteristics. Biotechnol. Rep. 2015, 6, 137–143. [Google Scholar] [CrossRef] [PubMed] [Green Version]
- Teuling, E.; Schrama, J.W.; Gruppen, H.; Wierenga, P.A. Effect of Cell Wall Characteristics on Algae Nutrient Digestibility in Nile Tilapia (Oreochromis Niloticus) and African Catfish (Clarus Gariepinus). Aquaculture 2017, 479, 490–500. [Google Scholar] [CrossRef]
- Agboola, J.O.; Teuling, E.; Wierenga, P.A.; Gruppen, H.; Schrama, J.W. Cell Wall Disruption: An Effective Strategy to Improve the Nutritive Quality of Microalgae in African Catfish (Clarias Gariepinus). Aquac. Nutr. 2019, 25, 783–797. [Google Scholar] [CrossRef] [Green Version]
- Boukid, F.; Comaposada, J.; Ribas-Agustí, A.; Castellari, M. Development of High-Protein Vegetable Creams by Using Single-Cell Ingredients from Some Microalgae Species. Foods 2021, 10, 2550. [Google Scholar] [CrossRef] [PubMed]
- Brodkorb, A.; Egger, L.; Alminger, M.; Alvito, P.; Assunção, R.; Ballance, S.; Bohn, T.; Bourlieu-Lacanal, C.; Boutrou, R.; Carrière, F.; et al. INFOGEST Static in Vitro Simulation of Gastrointestinal Food Digestion. Nat. Protoc. 2019, 14, 991–1014. [Google Scholar] [CrossRef]
- Prandi, B.; Zurlini, C.; Maria, C.I.; Cutroneo, S.; Di Massimo, M.; Bondi, M.; Brutti, A.; Sforza, S.; Tedeschi, T. Targeting the Nutritional Value of Proteins from Legumes By-Products Through Mild Extraction Technologies. Front. Nutr. 2021, 8, 446. [Google Scholar] [CrossRef]
- Broucke, K.; Van Poucke, C.; Duquenne, B.; De Witte, B.; Baune, M.C.; Lammers, V.; Terjung, N.; Ebert, S.; Gibis, M.; Weiss, J.; et al. Ability of (Extruded) Pea Protein Products to Partially Replace Pork Meat in Emulsified Cooked Sausages. Innov. Food Sci. Emerg. Technol. 2022, 78, 102992. [Google Scholar] [CrossRef]
- Mariotti, F.; Tomé, D.; Mirand, P.P. Converting Nitrogen into Protein—Beyond 625 and Jones’ Factors. Crit. Rev. Food Sci. Nutr. 2008, 48, 177–184. [Google Scholar] [CrossRef] [PubMed]
- Anzani, C.; Prandi, B.; Tedeschi, T.; Baldinelli, C.; Sorlini, G.; Wierenga, P.A.; Dossena, A.; Sforza, S. Degradation of Collagen Increases Nitrogen Solubilisation During Enzymatic Hydrolysis of Fleshing Meat. Waste Biomass Valorizat. 2018, 9, 1113–1119. [Google Scholar] [CrossRef]
- Bongiovani, N.; Virginia Sanchez-Puerta, M.; Popovich, C.; Leonardi, P. Molecular and Phylogenetic Identification of an Oil-Producing Strain of Nannochloropsis oceanica (Eustigmatophyceae) Isolated from the Southwestern Atlantic Coast (Argentina). Rev. Biol. Mar. Oceanogr. 2014, 49, 615–623. [Google Scholar] [CrossRef] [Green Version]
- Cao, S.; Zhang, X.; Fan, X.; Qiao, H.; Liang, C.; Xu, D.; Mou, S.; Wang, W.; Ye, N. Phylogeny and Characterisation of Nannochloropsis oceanica Var. Sinensis Var. Nov. (Eustigmatophyceae), a New Oleaginous Alga from China. Phycologia 2019, 52, 573–577. [Google Scholar] [CrossRef]
- Safi, C.; Zebib, B.; Merah, O.; Pontalier, P.Y.; Vaca-Garcia, C. Morphology, Composition, Production, Processing and Applications of Chlorella vulgaris: A Review. Renew. Sustain. Energy Rev. 2014, 35, 265–278. [Google Scholar] [CrossRef] [Green Version]
- Nicoletti, M. Microalgae Nutraceuticals. Foods 2016, 5, 54. [Google Scholar] [CrossRef]
- Weber, S.; Grande, P.M.; Blank, L.M.; Klose, H. Insights into Cell Wall Disintegration of Chlorella vulgaris. PLoS ONE 2022, 17, e0262500. [Google Scholar] [CrossRef]
- Cavonius, L.R.; Albers, E.; Undeland, I. In Vitro Bioaccessibility of Proteins and Lipids of PH-Shift Processed Nannochloropsis Oculata Microalga. Food Funct. 2016, 7, 2016–2024. [Google Scholar] [CrossRef] [Green Version]
- Scholz, M.J.; Weiss, T.L.; Jinkerson, R.E.; Jing, J.; Roth, R.; Goodenough, U.; Posewitz, M.C.; Gerken, H.G. Ultrastructure and Composition of the Nannochloropsis Gaditana Cell Wall. Eukaryot. Cell 2014, 13, 1450–1464. [Google Scholar] [CrossRef] [Green Version]
- Anjos, L.; Estêvão, J.; Infante, C.; Mantecón, L.; Power, D.M. Extracting Protein from Microalgae (Tetraselmis chuii) for Proteome Analysis. MethodsX 2022, 9, 101637. [Google Scholar] [CrossRef]
- Saharan, V.; Jood, S. Effect of Storage on Spirulina Platensis Powder Supplemented Breads. J. Food Sci. Technol. 2021, 58, 978–984. [Google Scholar] [CrossRef] [PubMed]
- Santos, T.D.; De Freitas, B.C.B.; Moreira, J.B.; Zanfonato, K.; Costa, J.A.V. Development of Powdered Food with the Addition of Spirulina for Food Supplementation of the Elderly Population. Innov. Food Sci. Emerg. Technol. 2016, 37, 216–220. [Google Scholar] [CrossRef]
- Qazi, W.M.; Ballance, S.; Kousoulaki, K.; Uhlen, A.K.; Kleinegris, D.M.M.; Skjånes, K.; Rieder, A. Protein Enrichment of Wheat Bread with Microalgae: Microchloropsis gaditana, Tetraselmis chui and Chlorella vulgaris. Foods 2021, 10, 3078. [Google Scholar] [CrossRef] [PubMed]
- Du Preez, R.; Majzoub, M.E.; Thomas, T.; Panchal, S.K.; Brown, L. Nannochloropsis oceanica as a Microalgal Food Intervention in Diet-Induced Metabolic Syndrome in Rats. Nutrients 2021, 13, 3991. [Google Scholar] [CrossRef] [PubMed]
- Ribeiro, D.M.; Bandarrinha, J.; Nanni, P.; Alves, S.P.; Martins, C.F.; Bessa, R.J.B.; Falcão-e-Cunha, L.; Almeida, A.M. The Effect of Nannochloropsis oceanica Feed Inclusion on Rabbit Muscle Proteome. J. Proteom. 2020, 222, 103783. [Google Scholar] [CrossRef] [PubMed]
- Boukid, F. Chickpea (Cicer arietinum L.) Protein as a Prospective Plant-Based Ingredient: A Review. Int. J. Food Sci. Technol. 2021, 56, 5435–5444. [Google Scholar] [CrossRef]
- Boukid, F.; Pasqualone, A. Lupine (Lupinus Spp.) Proteins: Characteristics, Safety and Food Applications. Eur. Food Res. Technol. 2021, 1, 3. [Google Scholar] [CrossRef]
- Boukid, F. Oat Proteins as Emerging Ingredients for Food Formulation: Where We Stand? Eur. Food Res. Technol. 2021, 247, 535–544. [Google Scholar] [CrossRef]
- Su, M.; Dell’orto, M.; Scaglia, B.; D’imporzano, G.; Bani, A.; Adani, F. Growth Performance, Biochemical Composition and Nutrient Recovery Ability of Twelve Microalgae Consortia Isolated from Various Local Organic Wastes Grown on Nano-Filtered Pig Slurry. Molecules 2022, 27, 422. [Google Scholar] [CrossRef]
- Safi, C.; Charton, M.; Pignolet, O.; Silvestre, F.; Vaca-Garcia, C.; Pontalier, P.Y. Influence of Microalgae Cell Wall Characteristics on Protein Extractability and Determination of Nitrogen-to-Protein Conversion Factors. J. Appl. Phycol. 2013, 25, 523–529. [Google Scholar] [CrossRef] [Green Version]
- Baviera, M.B.; Ferrús Pérez, M.A.; Font Pérez, G.; Hardisson De La Torre, A.; Herrera, A.; Che, M.; Toledano, L.; Ascensión, M.; Sánchez, A.; Marti Del Moral, M.; et al. Report of the Scientific Committee of the Spanish Agency for Food Safety and Nutrition on a Request for Initial Assessment for Marketing of the Marine Microalgae Tetraselmis Chuii under Regulation (EC) No 258/97 on Novel Foods and Novel Food Ingredients Scientific Committee Members. Rev. Com. Científico AESAN 2013, 18, 11–28. [Google Scholar]
- Lupatini, A.L.; De Oliveira Bispo, L.; Colla, L.M.; Costa, J.A.V.; Canan, C.; Colla, E. Protein and Carbohydrate Extraction from S. Platensis Biomass by Ultrasound and Mechanical Agitation. Food Res. Int. 2017, 99, 1028–1035. [Google Scholar] [CrossRef]
- Ballesteros-Torres, J.M.; Samaniego-Moreno, L.; Gomez-Flores, R.; Tamez-Guerra, R.S.; Rodríguez-Padilla, C.; Tamez-Guerra, P. Amino Acids and Acylcarnitine Production by Chlorella vulgaris and Chlorella sorokiniana Microalgae from Wastewater Culture. PeerJ 2019, 2019, e7977. [Google Scholar] [CrossRef] [PubMed] [Green Version]
- Wells, M.L.; Potin, P.; Craigie, J.S.; Raven, J.A.; Merchant, S.S.; Helliwell, K.E.; Smith, A.G.; Camire, M.E.; Brawley, S.H. Algae as Nutritional and Functional Food Sources: Revisiting Our Understanding. J. Appl. Phycol. 2017, 29, 949–982. [Google Scholar] [CrossRef] [PubMed]
- Pereira, H.; Silva, J.; Santos, T.; Gangadhar, K.N.; Raposo, A.; Nunes, C.; Coimbra, M.A.; Gouveia, L.; Barreira, L.; Varela, J. Nutritional Potential and Toxicological Evaluation of Tetraselmis Sp. CTP4 Microalgal Biomass Produced in Industrial Photobioreactors. Molecules 2019, 24, 3192. [Google Scholar] [CrossRef] [Green Version]
- Pereira, A.M.; Lisboa, C.R.; Santos, T.D.; Costa, J.A.V. Bioactive Stability of Microalgal Protein Hydrolysates under Food Processing and Storage Conditions. J. Food Sci. Technol. 2019, 56, 4543–4551. [Google Scholar] [CrossRef]
- Wild, K.J.; Steingaß, H.; Rodehutscord, M. Variability in Nutrient Composition and in Vitro Crude Protein Digestibility of 16 Microalgae Products. J. Anim. Physiol. Anim. Nutr. 2018, 102, 1306–1319. [Google Scholar] [CrossRef] [PubMed]
- Boisen, S.; Fernández, J.A. Prediction of the Total Tract Digestibility of Energy in Feedstuffs and Pig Diets by in Vitro Analyses. Anim. Feed Sci. Technol. 1997, 68, 277–286. [Google Scholar] [CrossRef]
- Niccolai, A.; Venturi, M.; Galli, V.; Pini, N.; Rodolfi, L.; Biondi, N.; D’Ottavio, M.; Batista, A.P.; Raymundo, A.; Granchi, L.; et al. Development of New Microalgae-Based Sourdough “Crostini”: Functional Effects of Arthrospira Platensis (Spirulina) Addition. Sci. Rep. 2019, 9, 19433. [Google Scholar] [CrossRef] [Green Version]
- Tibbetts, S.M.; Milley, J.E.; Lall, S.P. Chemical Composition and Nutritional Properties of Freshwater and Marine Microalgal Biomass Cultured in Photobioreactors. J. Appl. Phycol. 2015, 27, 1109–1119. [Google Scholar] [CrossRef] [Green Version]
- Tibbetts, S.M.; MacPherson, T.; McGinn, P.J.; Fredeen, A.H. In Vitro Digestion of Microalgal Biomass from Freshwater Species Isolated in Alberta, Canada for Monogastric and Ruminant Animal Feed Applications. Algal Res. 2016, 19, 324–332. [Google Scholar] [CrossRef] [Green Version]
- Cerri, R.; Niccolai, A.; Cardinaletti, G.; Tulli, F.; Mina, F.; Daniso, E.; Bongiorno, T.; Chini Zittelli, G.; Biondi, N.; Tredici, M.R.; et al. Chemical Composition and Apparent Digestibility of a Panel of Dried Microalgae and Cyanobacteria Biomasses in Rainbow Trout (Oncorhynchus Mykiss). Aquaculture 2021, 544, 737075. [Google Scholar] [CrossRef]
- Gohara-Beirigo, A.K.; Matsudo, M.C.; Cezare-Gomes, E.A.; De Carvalho, J.C.M.; Danesi, E.D.G. Microalgae Trends toward Functional Staple Food Incorporation: Sustainable Alternative for Human Health Improvement. Trends Food Sci. Technol. 2022, 125, 185–199. [Google Scholar] [CrossRef]
- FAO. Expert Consultation Dietary Protein Quality Evaluation in Human Nutrition. Chapter 4: Findings and Recommendations of the 2011 FAO Expert Consultation on Protein Quality Evaluation in Human Nutrition. 2013. Available online: https://www.fao.org/3/i3124e/i3124e.pdf (accessed on 1 February 2023).
- Batista, A.P.; Niccolai, A.; Bursic, I.; Sousa, I.; Raymundo, A.; Rodolfi, L.; Biondi, N.; Tredici, M.R. Microalgae as Functional Ingredients in Savory Food Products: Application to Wheat Crackers. Foods 2019, 8, 611. [Google Scholar] [CrossRef] [PubMed] [Green Version]
- Fradinho, P.; Niccolai, A.; Soares, R.; Rodolfi, L.; Biondi, N.; Tredici, M.R.; Sousa, I.; Raymundo, A. Effect of Arthrospira Platensis (Spirulina) Incorporation on the Rheological and Bioactive Properties of Gluten-Free Fresh Pasta. Algal Res. 2020, 45, 101743. [Google Scholar] [CrossRef]
- Batista, A.P.; Niccolai, A.; Fradinho, P.; Fragoso, S.; Bursic, I.; Rodolfi, L.; Biondi, N.; Tredici, M.R.; Sousa, I.; Raymundo, A. Microalgae Biomass as an Alternative Ingredient in Cookies: Sensory, Physical and Chemical Properties, Antioxidant Activity and in Vitro Digestibility. Algal Res. 2017, 26, 161–171. [Google Scholar] [CrossRef]
- Khemiri, S.; Nunes, M.C.; Bessa, R.J.B.; Alves, S.P.; Smaali, I.; Raymundo, A. Technological Feasibility of Couscous-Algae-Supplemented Formulae: Process Description, Nutritional Properties and In Vitro Digestibility. Foods 2021, 10, 3159. [Google Scholar] [CrossRef]


| CV | NO | SP | TC | ||
|---|---|---|---|---|---|
| Gly | *** | 1.85 ± 0.08 a | 2.65 ± 0.01 c | 3.29 ± 0.06 d | 2.06 ± 0.03 b |
| Ala | *** | 2.36 ± 0.07 | 2.95 ± 0.12 | 4.12 ± 0.11 | 2.50 ± 0.06 |
| Ser | *** | 1.18 ± 0.03 a | 1.60 ± 0.01 b | 2.57 ± 0.06 c | 1.17 ± 0.05 a |
| Pro | *** | 2.09 ± 0.08 b | 2.21 ± 0.02 c | 2.43 ± 0.01 d | 2.02 ± 0.02 a |
| Val | *** | 1.50 ± 0.09 a | 2.50 ± 0.01 b | 3.36 ± 0.15 c | 1.75 ± 0.07 a |
| Thr | *** | 1.15 ± 0.03 a | 2.23 ± 0.01 c | 2.93 ± 0.04 d | 1.68 ± 0.02 b |
| Ile | *** | 0.89 ± 0.07 a | 1.88 ± 0.03 c | 3.08 ± 0.14 d | 1.20 ± 0.06 b |
| Leu | *** | 1.92 ± 0.07 a | 3.20 ± 0.04 c | 3.94 ± 0.11 d | 2.30 ± 0.10 b |
| Asp | *** | 3.71 ± 0.14 a | 4.93 ± 0.02 b | 6.58 ± 0.10 c | 5.16 ± 0.10 b |
| Lys | *** | 3.24 ± 0.11 c | 2.67 ± 0.01 b | 2.99 ± 0.22 b c | 1.86 ± 0.01 a |
| Glu | *** | 3.51 ± 0.14 a | 4.78 ± 0.03 b | 8.46 ± 0.02 c | 4.80 ± 0.08 b |
| His | *** | 0.58 ± 0.02 a | 0.77 ± 0.01 b | 0.88 ± 0.04 c | 0.55 ± 0.01 a |
| Phe | *** | 0.94 ± 0.02 a | 2.27 ± 0.23 c | 2.61 ± 0.12 c | 1.61 ± 0.06 b |
| Arg | *** | 2.71 ± 0.14 a | 2.60 ± 0.01 a | 3.98 ± 0.01 c | 3.75 ± 0.01 b |
| Tyr | *** | 0.74 ± 0.03 a | 1.32 ± 0.03 c | 2.28 ± 0.02 d | 0.95 ± 0.01 b |
| Met | *** | 0.65 ± 0.05 a | 0.98 ± 0.01 c | 1.39 ± 0.01 d | 0.81 ± 0.06 b |
| Cys | ns | 0.32 ± 0.01 | 0.26 ± 0.05 | 0.46 ± 0.15 | 0.48 ± 0.03 |
| EAA | *** | 10.85 ± 0.21 a | 16.50 ± 0.28 b | 21.20 ± 0.80 c | 11.75 ± 0.21 a |
| NAA | *** | 18.50 ± 0.70 a | 23.30 ± 0.01 b | 34.20 ± 0.10 c | 22.90 ± 0.01 b |
| AA | *** | 29.35 ± 0.90 a | 39.80 ± 0.20 c | 55.35 ± 0.60 d | 34.65 ± 0.20 b |
| Significance | STD | CV1.5 | NO1.5 | SP1.5 | TC1.5 | CV3 | NO3 | SP3 | TC3 | |
|---|---|---|---|---|---|---|---|---|---|---|
| Gly | * | 0.61 ± 0.01 | 0.68 ± 0.03 | 0.62 ± 0.18 | 0.78 ± 0.01 | 0.74 ± 0.00 | 0.72 ± 0.01 | 0.80 ± 0.00 | 0.85 ± 0.01 | 0.81 ± 0.01 |
| Ala | *** | 0.72 ± 0.03 | 0.82 ± 0.13 | 0.86 ± 0.04 | 0.96 ± 0.04 | 0.83 ± 0.02 | 0.94 ± 0.02 | 0.96 ± 0.01 | 1.14 ± 0.03 | 0.96 ± 0.03 |
| Ser | ns | 0.93 ± 0.03 | 0.93 ± 0.03 | 1.03 ± 0.19 | 1.01 ± 0.01 | 0.94 ± 0.02 | 0.92 ± 0.03 | 0.97 ± 0.01 | 1.09 ± 0.01 | 1.01 ± 0.02 |
| Pro | ** | 0.73 ± 0.01 | 0.83 ± 0.06 | 0.82 ± 0.01 | 0.84 ± 0.02 | 0.81 ± 0.03 | 0.86 ± 0.02 | 0.87 ± 0.00 | 0.88 ± 0.02 | 0.86 ± 0.02 |
| Val | ** | 0.64 ± 0.03 | 0.69 ± 0.03 | 0.71 ± 0.05 | 0.79 ± 0.05 | 0.74 ± 0.01 | 0.74 ± 0.02 | 0.75 ± 0.02 | 0.86 ± 0.03 | 0.74 ± 0.01 |
| Thr | *** | 0.69 ± 0.02 | 0.74 ± 0.04 | 0.77 ± 0.07 | 0.82 ± 0.01 | 0.76 ± 0.02 | 0.76 ± 0.02 | 0.82 ± 0.01 | 0.94 ± 0.00 | 0.83 ± 0.00 |
| Ile | *** | 0.53 ± 0.03 | 0.54 ± 0.01 | 0.57 ± 0.03 | 0.66 ± 0.05 | 0.58 ± 0.01 | 0.57 ± 0.03 | 0.61 ± 0.01 | 0.74 ± 0.03 | 0.59 ± 0.01 |
| Leu | *** | 1.11 ± 0.04 | 1.14 ± 0.05 | 1.22 ± 0.03 | 1.33 ± 0.06 | 1.21 ± 0.02 | 1.22 ± 0.04 | 1.33 ± 0.01 | 1.43 ± 0.00 | 1.29 ± 0.03 |
| Asp | * | 1.53 ± 0.08 | 1.60 ± 0.28 | 1.83 ± 0.08 | 1.92 ± 0.04 | 1.69 ± 0.09 | 1.81 ± 0.08 | 1.92 ± 0.09 | 2.02 ± 0.03 | 1.98 ± 0.05 |
| Lys | ns | 0.59 ± 0.23 | 0.54 ± 0.18 | 0.49 ± 0.01 | 0.46 ± 0.05 | 0.42 ± 0.04 | 0.55 ± 0.01 | 0.54 ± 0.00 | 0.51 ± 0.02 | 0.52 ± 0.04 |
| Glu | * | 2.22 ± 0.06 | 2.42 ± 0.42 | 2.52 ± 0.05 | 2.75 ± 0.12 | 2.38 ± 0.10 | 2.52 ± 0.07 | 2.60 ± 0.09 | 2.97 ± 0.05 | 2.77 ± 0.02 |
| His | ns | 0.41 ± 0.12 | 0.38 ± 0.03 | 0.39 ± 0.06 | 0.37 ± 0.05 | 0.36 ± 0.01 | 0.24 ± 0.00 | 0.32 ± 0.01 | 0.35 ± 0.00 | 0.31 ± 0.03 |
| Phe | ns | 0.76 ± 0.01 | 0.77 ± 0.04 | 0.78 ± 0.05 | 0.86 ± 0.06 | 0.82 ± 0.00 | 0.79 ± 0.04 | 0.82 ± 0.04 | 0.85 ± 0.03 | 0.83 ± 0.03 |
| Arg | ns | 1.15 ± 0.55 | 0.90 ± 0.13 | 0.81 ± 0.12 | 0.89 ± 0.01 | 0.86 ± 0.02 | 0.87 ± 0.03 | 0.78 ± 0.01 | 0.93 ± 0.03 | 1.00 ± 0.09 |
| Tyr | * | 0.44 ± 0.01 | 0.46 ± 0.03 | 0.48 ± 0.05 | 0.57 ± 0.04 | 0.48 ± 0.00 | 0.46 ± 0.03 | 0.50 ± 0.02 | 0.58 ± 0.01 | 0.49 ± 0.03 |
| Met | ns | 0.27 ± 0.01 | 0.30 ± 0.01 | 0.31 ± 0.00 | 0.34 ± 0.01 | 0.29 ± 0.01 | 0.29 ± 0.01 | 0.33 ± 0.05 | 0.33 ± 0.04 | 0.37 ± 0.07 |
| Cys | ** | 0.16 ± 0.01 | 0.23 ± 0.02 | 0.18 ± 0.02 | 0.18 ± 0.01 | 0.23 ± 0.00 | 0.19 ± 0.02 | 0.18 ± 0.01 | 0.22 ± 0.00 | 0.24 ± 0.01 |
| Trp | ns | 0.07 ± 0.00 | 0.07 ± 0.01 | 0.09 ± 0.02 | 0.09 ± 0.01 | 0.08 ± 0.01 | 0.08 ± 0.02 | 0.10 ± 0.01 | 0.09 ± 0.01 | 0.09 ± 0.01 |
| EAA | ** | 5.07 ± 0.29 | 5.19 ± 0.28 | 5.33 ± 0.29 | 5.71 ± 0.10 | 5.27 ± 0.03 | 5.25 ± 0.17 | 5.62 ± 0.04 | 6.10 ± 0.08 | 5.58 ± 0.17 |
| NAA | * | 8.50 ± 0.42 | 8.86 ± 1.04 | 9.15 ± 0.71 | 9.91 ± 0.12 | 8.96 ± 0.23 | 9.29 ± 0.31 | 9.58 ± 0.20 | 10.68 ± 0.06 | 10.12 ± 0.01 |
| AA | * | 13.57 ± 0.72 | 14.06 ± 1.31 | 14.48 ± 1.00 | 15.62 ± 0.22 | 14.23 ± 0.26 | 14.54 ± 0.48 | 15.21 ± 0.23 | 16.78 ± 0.02 | 15.70 ± 0.15 |
| Microalgae Species (S) | Level of Addition (LA) | The Interaction (S × LA) | ||||
|---|---|---|---|---|---|---|
| SS% | Significance | SS% | Significance | SS% | Significance | |
| Gly | 42 | * | 45 | ns | 13 | ns |
| Ala | 48 | *** | 50 | ** | 2 | ns |
| Ser | 3 | ns | 69 | ns | 28 | ns |
| Pro | 80 | ** | 15 | ns | 5 | ns |
| Val | 19 | * | 75 | ** | 6 | ns |
| Thr | 31 | ** | 60 | *** | 8 | ns |
| Ile | 10 | * | 84 | *** | 6 | ns |
| Leu | 30 | *** | 70 | *** | 1 | ns |
| Asp | 39 | * | 51 | ns | 9 | ns |
| Lys | 37 | ns | 48 | ns | 16 | ns |
| Glu | 27 | * | 62 | * | 11 | ns |
| His | 59 | * | 16 | ns | 26 | ns |
| Phe | 7 | ns | 81 | ns | 12 | ns |
| Arg | 6 | ns | 64 | ns | 30 | ns |
| Tyr | 2 | ns | 98 | ** | 0 | ns |
| Met | 17 | ns | 38 | ns | 45 | ns |
| Cys | 1 | ns | 68 | ** | 31 | ns |
| Trp | 19 | ns | 78 | ns | 3 | ns |
| EAA | 21 | * | 75 | ** | 5 | ns |
| NAA | 35 | * | 58 | * | 6 | ns |
| AA | 31 | * | 64 | * | 5 | ns |
| TPC | 22 | *** | 75 | *** | 2 | *** |
| Age Group | His | Ile | Leu | Lys | SAA | AAA | Thr | Trp | Val |
|---|---|---|---|---|---|---|---|---|---|
| Scoring Pattern mg/g Protein Requirement | |||||||||
| Infant (birth to 6 months) | 21 | 55 | 96 | 69 | 33 | 94 | 44 | 17 | 55 |
| Child (6 months to 3 year) | 20 | 32 | 66 | 57 | 27 | 52 | 31 | 8.5 | 43 |
| Older child, adolescent, adult | 16 | 30 | 61 | 48 | 23 | 41 | 25 | 6.6 | 40 |
| Scoring pattern (birth to 6 months) | |||||||||
| Formulation | His | Ile | Leu | Lys | SAA | AAA | Thr | Trp | Val |
| STD | 1.44 | 0.71 | 0.85 | 0.63 | 0.95 | 0.94 | 1.16 | 0.32 | 0.86 |
| CV1.5 | 1.43 | 0.77 | 0.93 | 0.61 | 1.24 | 1.02 | 1.31 | 0.34 | 0.98 |
| NO1.5 | 1.47 | 0.83 | 1.02 | 0.57 | 1.18 | 1.07 | 1.40 | 0.43 | 1.04 |
| SP1.5 | 1.38 | 0.94 | 1.09 | 0.53 | 1.24 | 1.19 | 1.47 | 0.40 | 1.13 |
| TC1.5 | 1.36 | 0.84 | 0.99 | 0.48 | 1.24 | 1.09 | 1.35 | 0.37 | 1.05 |
| CV3 | 0.97 | 0.87 | 1.07 | 0.67 | 1.23 | 1.12 | 1.45 | 0.39 | 1.13 |
| NO3 | 1.32 | 0.96 | 1.20 | 0.68 | 1.36 | 1.21 | 1.62 | 0.49 | 1.18 |
| SP3 | 1.43 | 1.15 | 1.27 | 0.63 | 1.41 | 1.29 | 1.81 | 0.45 | 1.33 |
| TC3 | 1.23 | 0.89 | 1.13 | 0.63 | 1.53 | 1.17 | 1.58 | 0.44 | 1.13 |
| Scoring pattern (child 6 months to 3 year) | |||||||||
| Formulation | His | Ile | Leu | Lys | SAA | AAA | Thr | Trp | Val |
| STD | 1.51 | 1.22 | 1.24 | 0.76 | 1.17 | 1.70 | 1.64 | 0.64 | 1.10 |
| CV1.5 | 1.50 | 1.32 | 1.35 | 0.74 | 1.52 | 1.85 | 1.86 | 0.68 | 1.26 |
| NO1.5 | 1.54 | 1.43 | 1.48 | 0.69 | 1.44 | 1.93 | 1.99 | 0.86 | 1.33 |
| SP1.5 | 1.45 | 1.62 | 1.59 | 0.64 | 1.52 | 2.16 | 2.08 | 0.79 | 1.44 |
| TC1.5 | 1.43 | 1.44 | 1.44 | 0.58 | 1.51 | 1.96 | 1.92 | 0.74 | 1.35 |
| CV3 | 1.02 | 1.49 | 1.55 | 0.81 | 1.51 | 2.02 | 2.06 | 0.78 | 1.45 |
| NO3 | 1.38 | 1.65 | 1.74 | 0.82 | 1.66 | 2.19 | 2.29 | 0.97 | 1.51 |
| SP3 | 1.51 | 1.97 | 1.84 | 0.76 | 1.72 | 2.34 | 2.57 | 0.90 | 1.70 |
| TC3 | 1.29 | 1.53 | 1.64 | 0.77 | 1.87 | 2.12 | 2.25 | 0.88 | 1.45 |
| Scoring pattern (Older child, adolescent, adult) | |||||||||
| Formulation | His | Ile | Leu | Lys | SAA | AAA | Thr | Trp | Val |
| STD | 1.89 | 1.30 | 1.34 | 0.90 | 1.37 | 2.16 | 2.04 | 0.83 | 1.19 |
| CV1.5 | 1.88 | 1.41 | 1.46 | 0.88 | 1.78 | 2.34 | 2.30 | 0.87 | 1.35 |
| NO1.5 | 1.93 | 1.53 | 1.60 | 0.82 | 1.69 | 2.45 | 2.47 | 1.10 | 1.43 |
| SP1.5 | 1.81 | 1.73 | 1.72 | 0.76 | 1.78 | 2.73 | 2.58 | 1.02 | 1.55 |
| TC1.5 | 1.78 | 1.53 | 1.56 | 0.68 | 1.78 | 2.49 | 2.38 | 0.95 | 1.45 |
| CV3 | 1.28 | 1.59 | 1.68 | 0.97 | 1.77 | 2.56 | 2.56 | 1.01 | 1.56 |
| NO3 | 1.73 | 1.76 | 1.89 | 0.97 | 1.95 | 2.78 | 2.84 | 1.25 | 1.63 |
| SP3 | 1.88 | 2.11 | 2.00 | 0.90 | 2.02 | 2.96 | 3.19 | 1.16 | 1.83 |
| TC3 | 1.61 | 1.64 | 1.77 | 0.91 | 2.19 | 2.69 | 2.79 | 1.14 | 1.56 |
Disclaimer/Publisher’s Note: The statements, opinions and data contained in all publications are solely those of the individual author(s) and contributor(s) and not of MDPI and/or the editor(s). MDPI and/or the editor(s) disclaim responsibility for any injury to people or property resulting from any ideas, methods, instructions or products referred to in the content. |
© 2023 by the authors. Licensee MDPI, Basel, Switzerland. This article is an open access article distributed under the terms and conditions of the Creative Commons Attribution (CC BY) license (https://creativecommons.org/licenses/by/4.0/).
Share and Cite
Prandi, B.; Boukid, F.; Van De Walle, S.; Cutroneo, S.; Comaposada, J.; Van Royen, G.; Sforza, S.; Tedeschi, T.; Castellari, M. Protein Quality and Protein Digestibility of Vegetable Creams Reformulated with Microalgae Inclusion. Foods 2023, 12, 2395. https://doi.org/10.3390/foods12122395
Prandi B, Boukid F, Van De Walle S, Cutroneo S, Comaposada J, Van Royen G, Sforza S, Tedeschi T, Castellari M. Protein Quality and Protein Digestibility of Vegetable Creams Reformulated with Microalgae Inclusion. Foods. 2023; 12(12):2395. https://doi.org/10.3390/foods12122395
Chicago/Turabian StylePrandi, Barbara, Fatma Boukid, Simon Van De Walle, Sara Cutroneo, Josep Comaposada, Geert Van Royen, Stefano Sforza, Tullia Tedeschi, and Massimo Castellari. 2023. "Protein Quality and Protein Digestibility of Vegetable Creams Reformulated with Microalgae Inclusion" Foods 12, no. 12: 2395. https://doi.org/10.3390/foods12122395
APA StylePrandi, B., Boukid, F., Van De Walle, S., Cutroneo, S., Comaposada, J., Van Royen, G., Sforza, S., Tedeschi, T., & Castellari, M. (2023). Protein Quality and Protein Digestibility of Vegetable Creams Reformulated with Microalgae Inclusion. Foods, 12(12), 2395. https://doi.org/10.3390/foods12122395