
Rapid and High-Throughput Determination of Sixteen β-agonists in Livestock Meat Using One-Step Solid-Phase Extraction Coupled with UHPLC-MS/MS


Abstract
1. Introduction
2. Materials and Methods
2.1. Chemicals and Reagents
2.2. Sample Collection
2.3. Standard Solution Preparation
2.4. UHPLC-MS/MS Instrumentation and Operating Conditions
2.5. Sample Preparation
2.6. Method Validation
2.6.1. Matrix Effect Evaluation
2.6.2. Determination of Linearity, Limit of Detection, and Limit of Quantification
2.6.3. Recovery and Precision Test
2.7. Analysis of Actual Sample
2.8. Data Analysis
3. Results and Discussion
3.1. Optimization of UHPLC-MS/MS Conditions
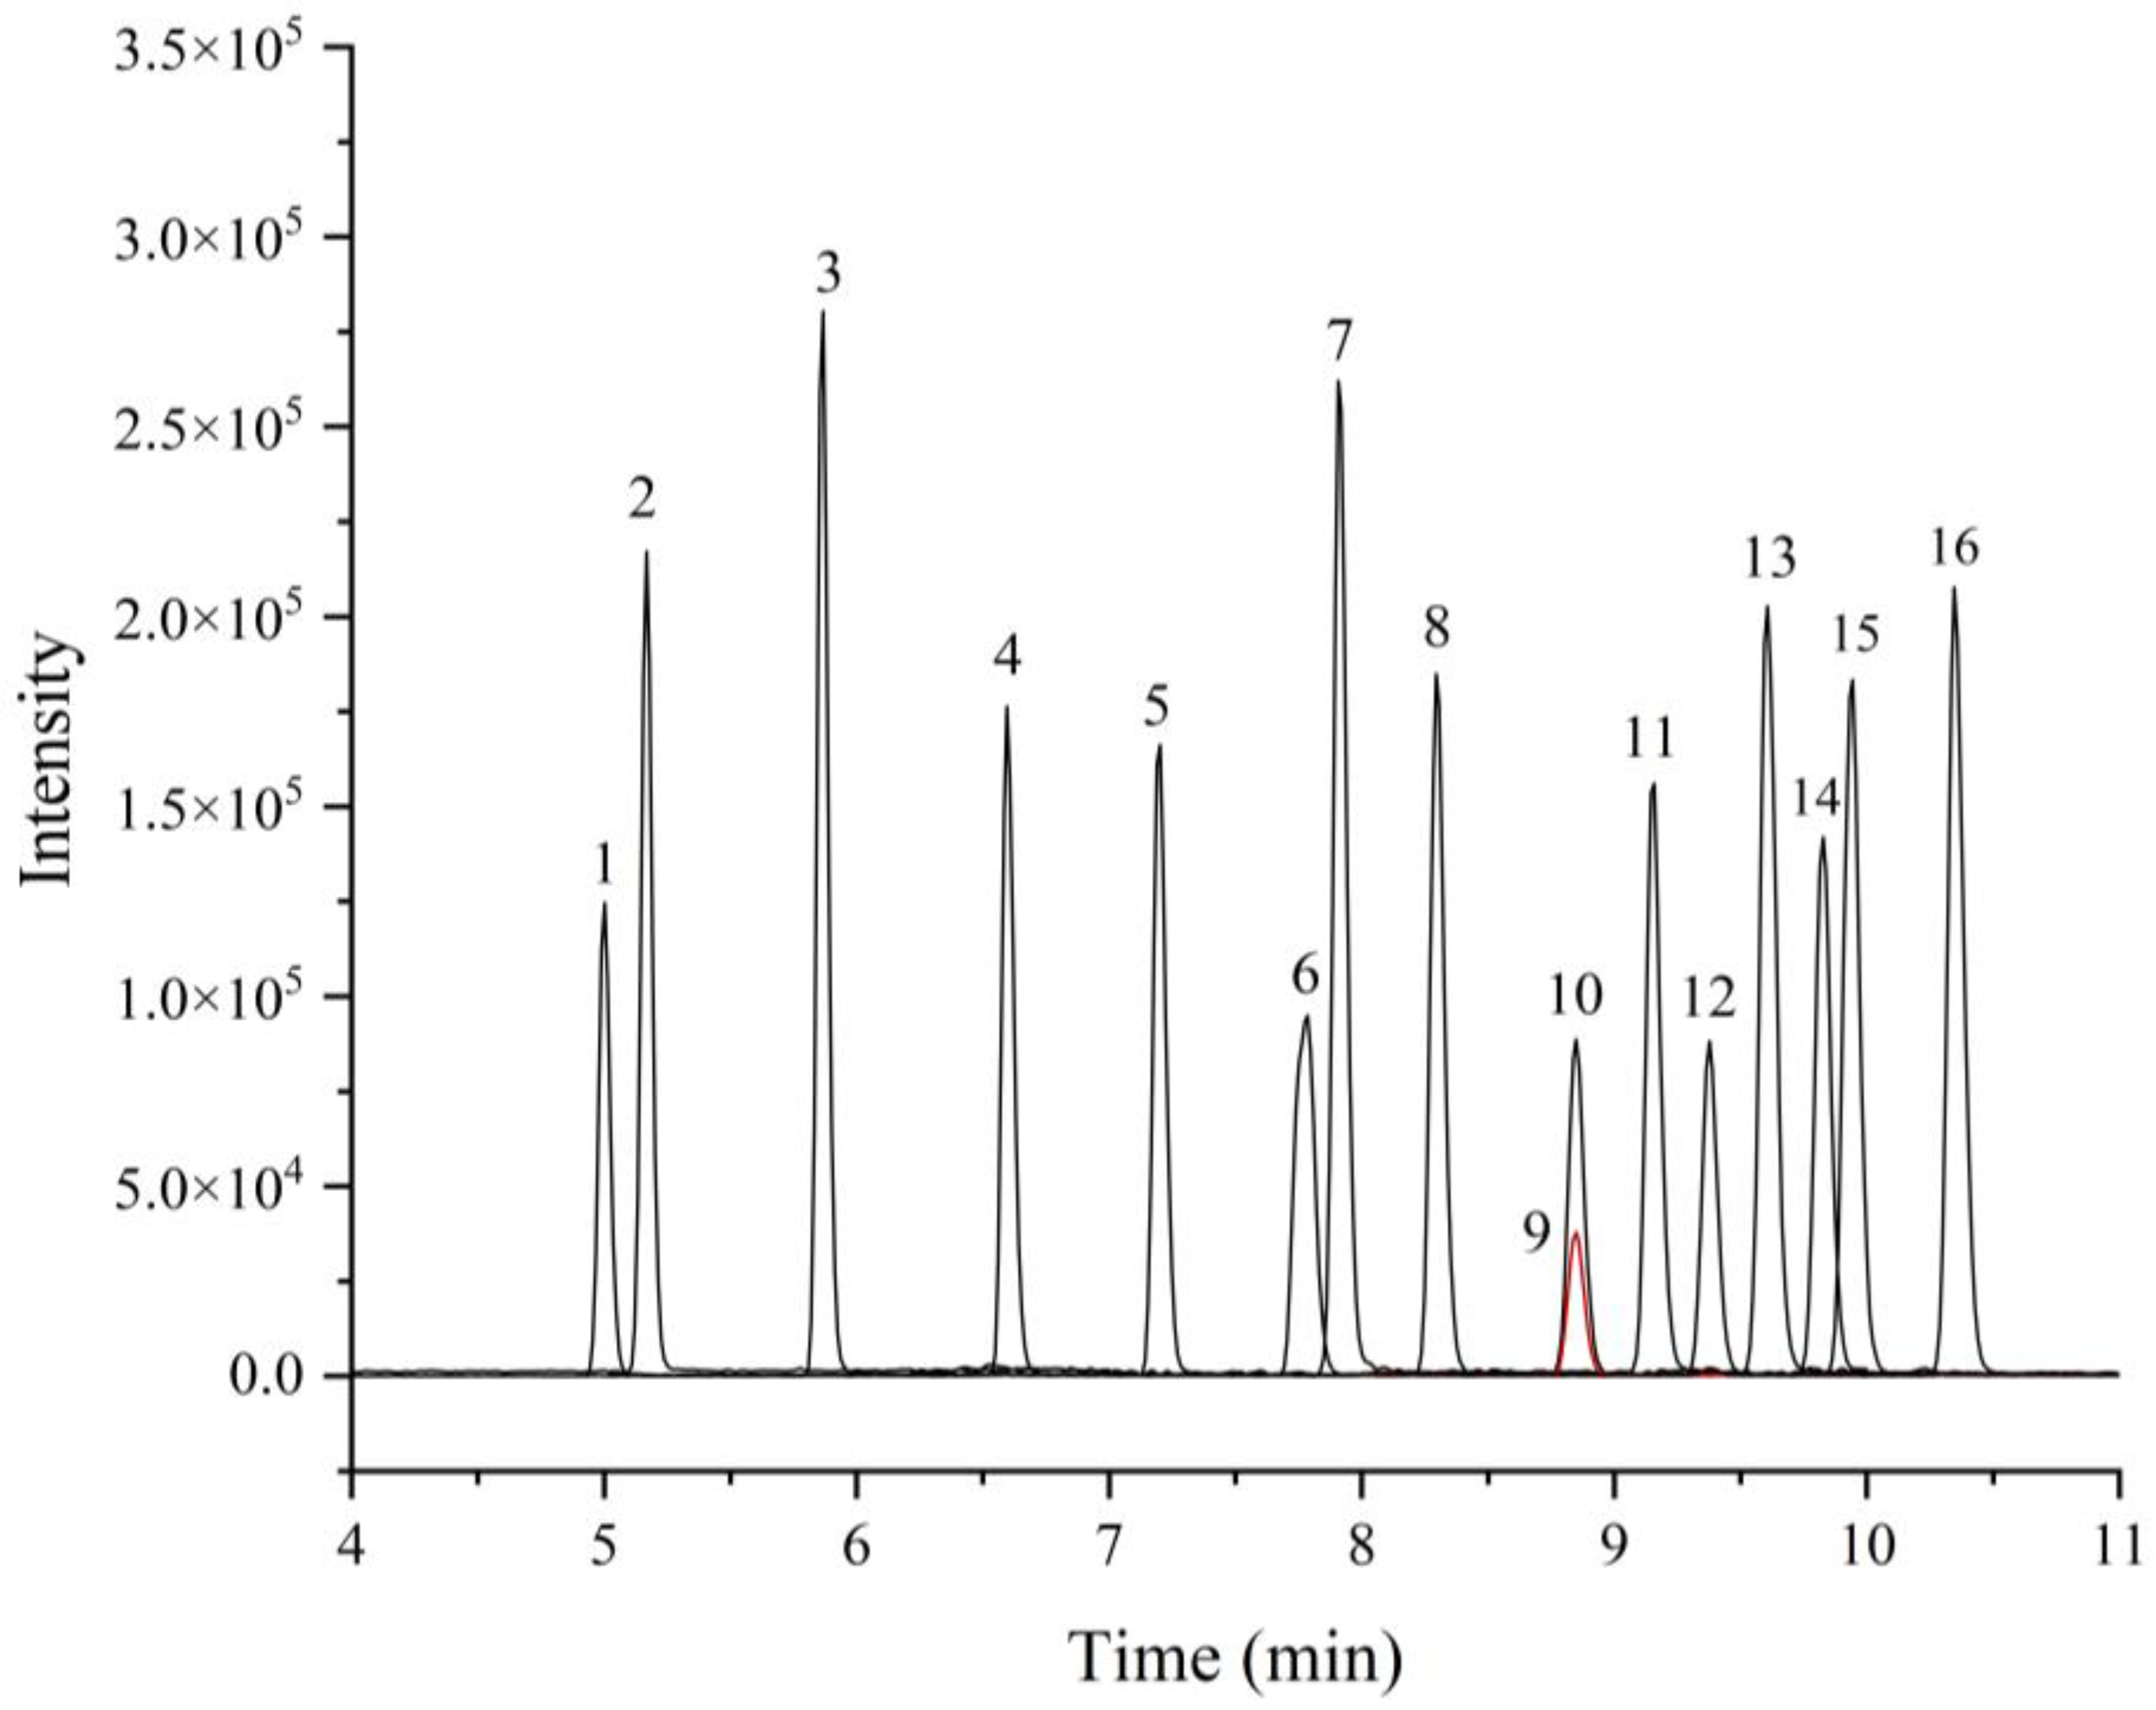
3.1.1. Optimization of Chromatographic Condition
3.1.2. Optimization of Mass Spectrometry Condition
3.2. Optimization of Pretreatment Conditions
3.2.1. Optimization of Enzymatic Condition
3.2.2. Optimization of Extraction Solvent
3.2.3. Optimization of Solid-Phase Extraction Column
3.2.4. Optimization of Redissolved Solution
3.3. Validation of Analytical Methods
3.3.1. Matrix Effect Evaluation and Elimination
3.3.2. Linearity of the Standards Curves, LODs and LOQs
3.3.3. Recovery and Precision
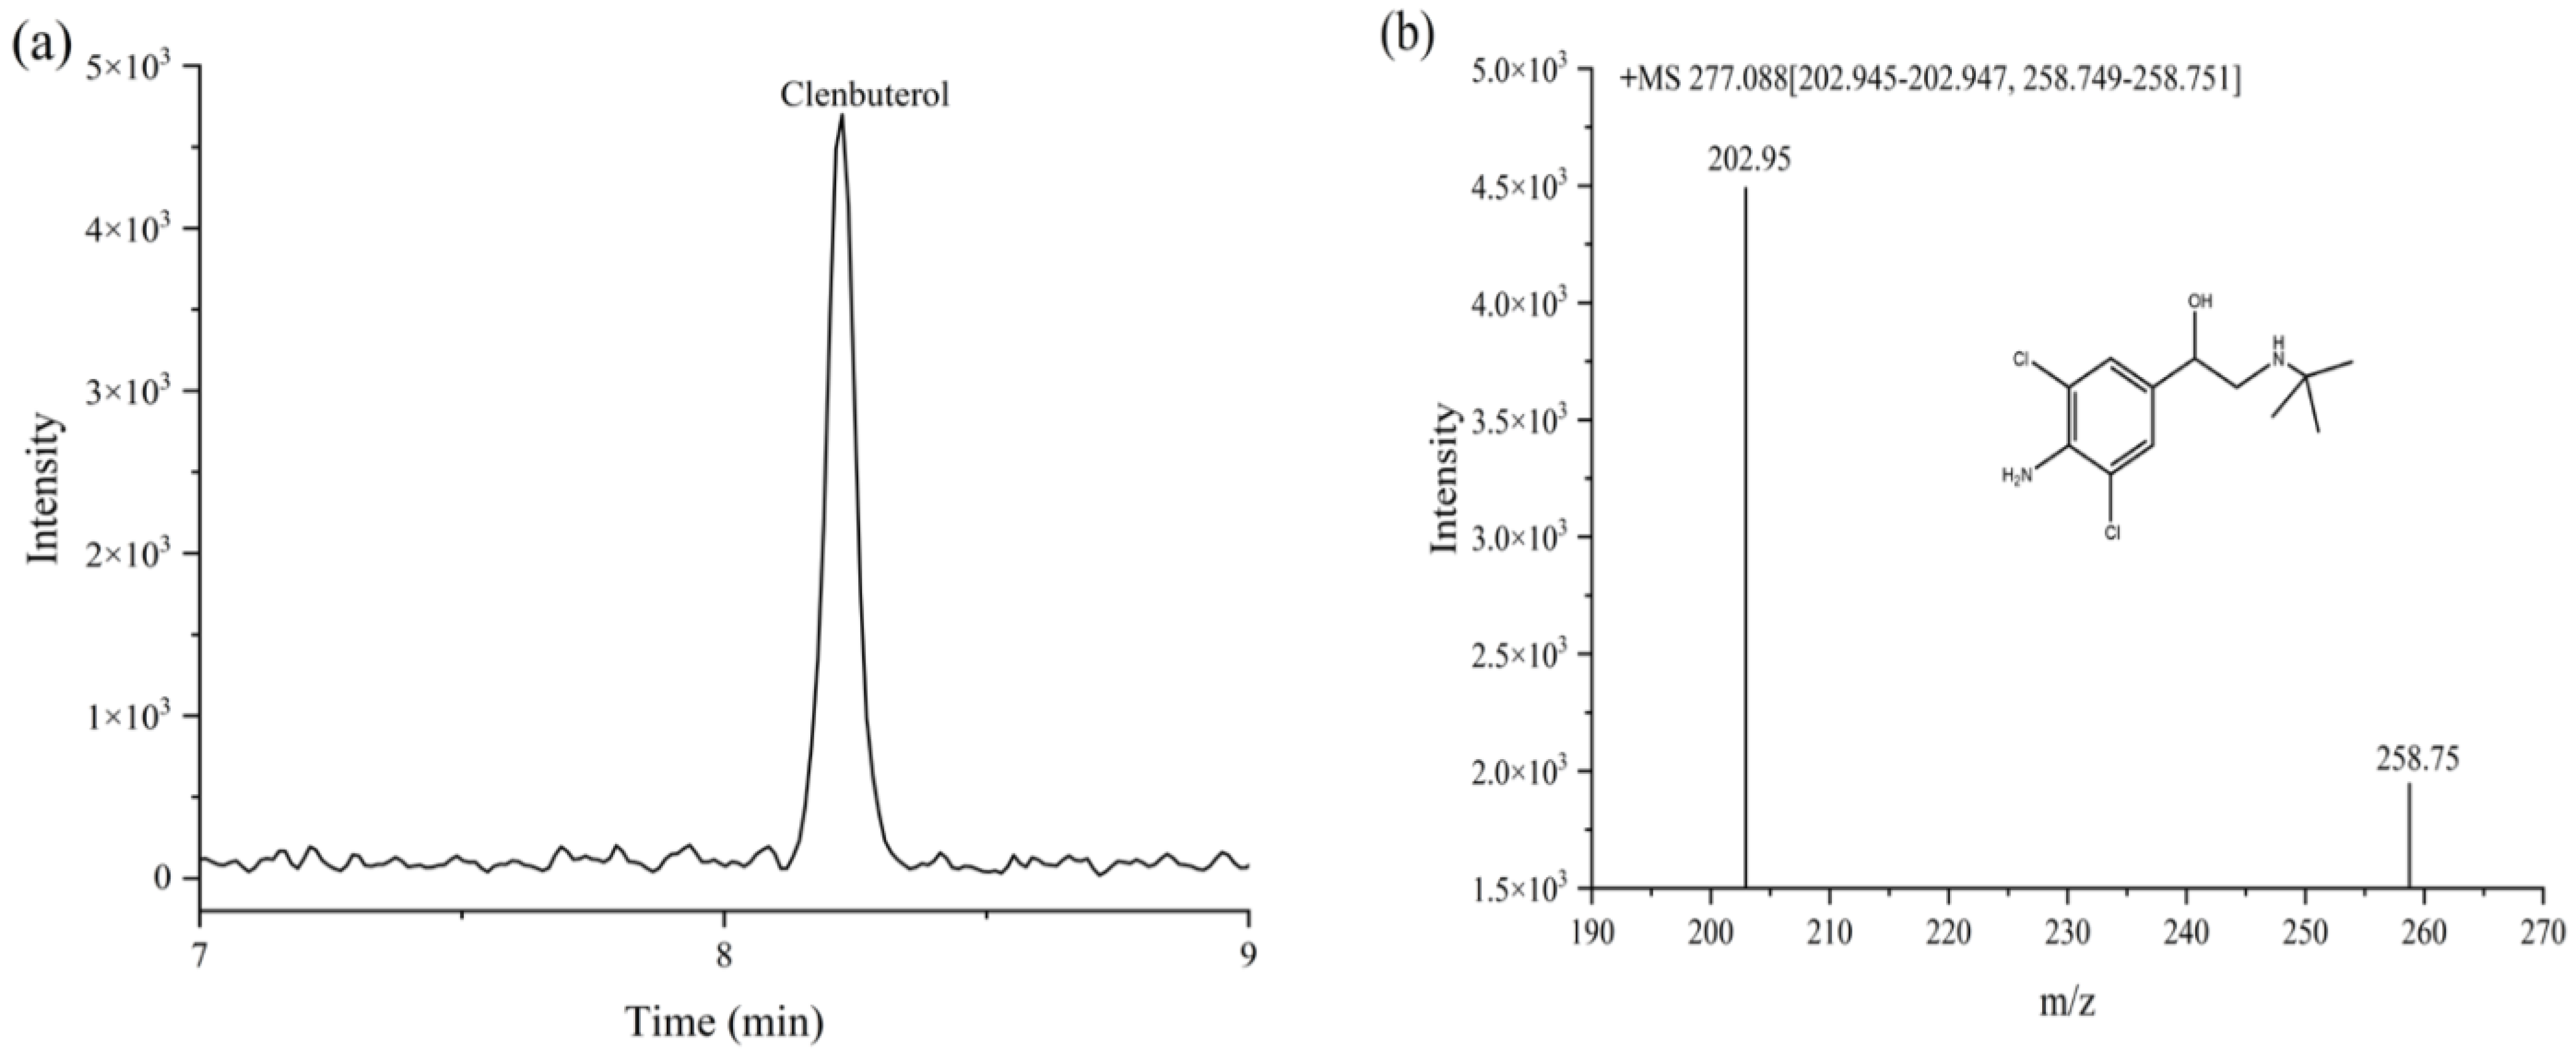
3.4. Analyses of Actual Sample
4. Conclusions
Author Contributions
Funding
Institutional Review Board Statement
Data Availability Statement
Acknowledgments
Conflicts of Interest
Appendix A

| Compound | Added Level (μg/kg) | Batch | Average Recovery (%) | Intraday RSD (%) | Interday RSD (%) |
|---|---|---|---|---|---|
| BAM | 0.5 | 1 | 98.80 | 3.42 | 9.79 |
| 2 | 82.98 | 8.73 | |||
| 3 | 82.26 | 5.33 | |||
| 1.0 | 1 | 93.86 | 9.88 | 9.81 | |
| 2 | 83.68 | 9.70 | |||
| 3 | 87.02 | 8.40 | |||
| 5.0 | 1 | 97.53 | 2.99 | 9.33 | |
| 2 | 79.72 | 5.10 | |||
| 3 | 80.77 | 4.66 | |||
| PEA | 0.5 | 1 | 85.95 | 9.92 | 8.19 |
| 2 | 92.50 | 6.50 | |||
| 3 | 89.43 | 7.86 | |||
| 1.0 | 1 | 79.45 | 7.17 | 9.27 | |
| 2 | 70.47 | 4.56 | |||
| 3 | 87.70 | 6.44 | |||
| 5.0 | 1 | 79.85 | 6.25 | 9.09 | |
| 2 | 79.80 | 8.53 | |||
| 3 | 91.06 | 8.27 | |||
| FOM | 0.5 | 1 | 87.48 | 5.04 | 8.55 |
| 2 | 76.42 | 5.03 | |||
| 3 | 71.37 | 5.91 | |||
| 1.0 | 1 | 74.94 | 9.37 | 7.54 | |
| 2 | 66.83 | 7.01 | |||
| 3 | 69.83 | 4.03 | |||
| 5.0 | 1 | 68.86 | 7.83 | 5.20 | |
| 2 | 64.18 | 3.77 | |||
| 3 | 66.88 | 1.79 | |||
| CLP | 0.5 | 1 | 80.57 | 4.79 | 6.50 |
| 2 | 89.33 | 7.74 | |||
| 3 | 87.17 | 3.30 | |||
| 1.0 | 1 | 85.06 | 9.66 | 9.63 | |
| 2 | 88.17 | 6.08 | |||
| 3 | 72.04 | 3.07 | |||
| 5.0 | 1 | 73.08 | 7.55 | 9.03 | |
| 2 | 85.28 | 4.68 | |||
| 3 | 68.60 | 4.40 | |||
| CLB | 0.5 | 1 | 83.50 | 8.38 | 8.47 |
| 2 | 78.50 | 8.84 | |||
| 3 | 78.98 | 8.79 | |||
| 1.0 | 1 | 83.88 | 6.41 | 7.81 | |
| 2 | 76.88 | 8.49 | |||
| 3 | 72.04 | 3.07 | |||
| 5.0 | 1 | 86.24 | 7.15 | 7.03 | |
| 2 | 78.68 | 2.95 | |||
| 3 | 73.17 | 2.15 | |||
| CLO | 0.5 | 1 | 78.08 | 6.80 | 7.90 |
| 2 | 67.33 | 5.70 | |||
| 3 | 71.08 | 7.86 | |||
| 1.0 | 1 | 73.50 | 4.31 | 5.62 | |
| 2 | 67.88 | 5.63 | |||
| 3 | 64.92 | 3.38 | |||
| 5.0 | 1 | 76.57 | 5.49 | 7.71 | |
| 2 | 66.65 | 6.52 | |||
| 3 | 62.62 | 2.39 | |||
| RAC | 0.5 | 1 | 77.42 | 7.84 | 9.32 |
| 2 | 75.20 | 8.81 | |||
| 3 | 86.33 | 8.54 | |||
| 1.0 | 1 | 84.75 | 9.59 | 8.41 | |
| 2 | 92.90 | 5.88 | |||
| 3 | 82.82 | 6.72 | |||
| 5.0 | 1 | 82.67 | 9.13 | 8.85 | |
| 2 | 86.16 | 6.59 | |||
| 3 | 75.08 | 7.91 | |||
| RIT | 0.5 | 1 | 92.65 | 6.34 | 9.28 |
| 2 | 78.67 | 2.52 | |||
| 3 | 75.38 | 6.68 | |||
| 1.0 | 1 | 81.92 | 9.30 | 9.59 | |
| 2 | 96.42 | 7.77 | |||
| 3 | 89.79 | 6.29 | |||
| 5.0 | 1 | 90.89 | 8.63 | 8.08 | |
| 2 | 101.61 | 3.09 | |||
| 3 | 91.06 | 6.91 | |||
| MAB | 0.5 | 1 | 91.83 | 9.67 | 9.77 |
| 2 | 80.30 | 6.72 | |||
| 3 | 82.50 | 9.79 | |||
| 1.0 | 1 | 96.19 | 7.68 | 8.58 | |
| 2 | 95.30 | 6.59 | |||
| 3 | 84.08 | 6.21 | |||
| 5.0 | 1 | 90.98 | 5.91 | 9.84 | |
| 2 | 92.14 | 8.06 | |||
| 3 | 74.79 | 1.91 | |||
| H-CLB | 0.5 | 1 | 96.48 | 5.78 | 8.43 |
| 2 | 87.50 | 7.95 | |||
| 3 | 91.17 | 9.81 | |||
| 1.0 | 1 | 79.76 | 6.09 | 6.25 | |
| 2 | 78.13 | 7.50 | |||
| 3 | 81.08 | 5.83 | |||
| 5.0 | 1 | 72.68 | 6.17 | 9.61 | |
| 2 | 88.24 | 8.01 | |||
| 3 | 74.37 | 6.06 | |||
| SAL | 0.5 | 1 | 70.42 | 5.72 | 5.54 |
| 2 | 66.62 | 4.74 | |||
| 3 | 68.00 | 5.97 | |||
| 1.0 | 1 | 71.75 | 2.97 | 4.37 | |
| 2 | 67.85 | 5.22 | |||
| 3 | 72.10 | 4.25 | |||
| 5.0 | 1 | 71.75 | 5.04 | 7.43 | |
| 2 | 75.18 | 7.53 | |||
| 3 | 80.72 | 7.49 | |||
| TEB | 0.5 | 1 | 99.50 | 7.81 | 8.81 |
| 2 | 97.58 | 9.44 | |||
| 3 | 94.25 | 9.86 | |||
| 1.0 | 1 | 97.88 | 7.15 | 8.67 | |
| 2 | 97.58 | 7.39 | |||
| 3 | 84.67 | 3.67 | |||
| 5.0 | 1 | 94.76 | 4.62 | 7.72 | |
| 2 | 88.02 | 3.34 | |||
| 3 | 78.28 | 2.33 | |||
| TUL | 0.5 | 1 | 110.58 | 6.22 | 7.63 |
| 2 | 100.08 | 5.29 | |||
| 3 | 101.33 | 7.24 | |||
| 1.0 | 1 | 112.83 | 5.37 | 8.23 | |
| 2 | 113.46 | 3.34 | |||
| 3 | 101.63 | 9.16 | |||
| 5.0 | 1 | 115.93 | 3.92 | 5.22 | |
| 2 | 115.49 | 2.54 | |||
| 3 | 108.03 | 4.83 | |||
| CIB | 0.5 | 1 | 80.67 | 7.32 | 6.85 |
| 2 | 77.03 | 8.01 | |||
| 3 | 76.08 | 5.26 | |||
| 1.0 | 1 | 82.28 | 7.45 | 6.73 | |
| 2 | 80.13 | 7.20 | |||
| 3 | 73.96 | 1.35 | |||
| 5.0 | 1 | 81.30 | 9.61 | 7.74 | |
| 2 | 77.04 | 5.46 | |||
| 3 | 70.13 | 2.34 | |||
| BRM | 0.5 | 1 | 86.67 | 3.20 | 7.62 |
| 2 | 85.42 | 9.68 | |||
| 3 | 81.50 | 8.73 | |||
| 1.0 | 1 | 82.27 | 6.89 | 8.15 | |
| 2 | 72.38 | 8.23 | |||
| 3 | 83.17 | 4.97 | |||
| 5.0 | 1 | 77.70 | 7.95 | 9.65 | |
| 2 | 83.80 | 9.89 | |||
| 3 | 93.07 | 3.47 | |||
| ISS | 0.5 | 1 | 74.50 | 8.11 | 8.08 |
| 2 | 76.82 | 3.72 | |||
| 3 | 84.00 | 9.15 | |||
| 1.0 | 1 | 77.36 | 5.01 | 8.06 | |
| 2 | 83.88 | 8.98 | |||
| 3 | 82.08 | 9.37 | |||
| 5.0 | 1 | 70.48 | 8.09 | 9.34 | |
| 2 | 84.86 | 6.03 | |||
| 3 | 68.48 | 1.69 |
| Compound | Added Level (μg/kg) | Batch | Average Recovery (%) | Intraday RSD (%) | Interday RSD (%) |
|---|---|---|---|---|---|
| BAM | 0.5 | 1 | 99.92 | 8.01 | 8.10 |
| 2 | 99.83 | 9.68 | |||
| 3 | 91.08 | 1.83 | |||
| 1.0 | 1 | 69.00 | 3.11 | 7.07 | |
| 2 | 81.50 | 7.18 | |||
| 3 | 73.96 | 3.73 | |||
| 5.0 | 1 | 69.23 | 1.35 | 3.92 | |
| 2 | 67.06 | 2.60 | |||
| 3 | 73.39 | 4.35 | |||
| PEA | 0.5 | 1 | 68.83 | 8.64 | 8.16 |
| 2 | 77.17 | 9.11 | |||
| 3 | 73.70 | 5.15 | |||
| 1.0 | 1 | 77.33 | 5.87 | 8.89 | |
| 2 | 87.56 | 9.08 | |||
| 3 | 79.13 | 8.97 | |||
| 5.0 | 1 | 78.54 | 7.92 | 9.23 | |
| 2 | 92.04 | 5.66 | |||
| 3 | 76.04 | 4.12 | |||
| FOM | 0.5 | 1 | 68.42 | 7.17 | 8.91 |
| 2 | 80.22 | 3.25 | |||
| 3 | 84.58 | 6.35 | |||
| 1.0 | 1 | 70.71 | 7.98 | 8.33 | |
| 2 | 75.46 | 6.63 | |||
| 3 | 77.46 | 9.97 | |||
| 5.0 | 1 | 64.20 | 4.04 | 4.72 | |
| 2 | 67.71 | 3.70 | |||
| 3 | 67.83 | 5.96 | |||
| CLP | 0.5 | 1 | 75.92 | 4.26 | 5.97 |
| 2 | 75.00 | 5.46 | |||
| 3 | 66.92 | 3.77 | |||
| 1.0 | 1 | 83.75 | 2.62 | 8.25 | |
| 2 | 72.25 | 8.13 | |||
| 3 | 75.26 | 8.55 | |||
| 5.0 | 1 | 69.72 | 5.11 | 5.00 | |
| 2 | 71.73 | 3.09 | |||
| 3 | 69.44 | 6.76 | |||
| CLB | 0.5 | 1 | 94.50 | 1.55 | 4.74 |
| 2 | 99.08 | 6.56 | |||
| 3 | 95.50 | 4.12 | |||
| 1.0 | 1 | 65.54 | 4.43 | 9.16 | |
| 2 | 75.13 | 3.64 | |||
| 3 | 83.34 | 7.88 | |||
| 5.0 | 1 | 63.08 | 1.72 | 5.49 | |
| 2 | 61.35 | 1.24 | |||
| 3 | 71.57 | 5.13 | |||
| CLO | 0.5 | 1 | 75.25 | 5.28 | 6.86 |
| 2 | 78.50 | 5.07 | |||
| 3 | 87.08 | 4.12 | |||
| 1.0 | 1 | 67.79 | 1.33 | 4.30 | |
| 2 | 64.54 | 2.82 | |||
| 3 | 68.13 | 6.62 | |||
| 5.0 | 1 | 65.74 | 1.85 | 6.66 | |
| 2 | 66.65 | 2.45 | |||
| 3 | 77.81 | 5.74 | |||
| RAC | 0.5 | 1 | 89.00 | 5.31 | 8.64 |
| 2 | 99.88 | 4.74 | |||
| 3 | 82.92 | 5.11 | |||
| 1.0 | 1 | 66.17 | 1.88 | 9.52 | |
| 2 | 83.76 | 5.96 | |||
| 3 | 69.71 | 7.84 | |||
| 5.0 | 1 | 66.48 | 7.94 | 6.63 | |
| 2 | 68.79 | 5.70 | |||
| 3 | 65.39 | 6.83 | |||
| RIT | 0.5 | 1 | 84.00 | 7.91 | 8.29 |
| 2 | 94.00 | 3.55 | |||
| 3 | 98.17 | 5.58 | |||
| 1.0 | 1 | 91.88 | 7.18 | 8.69 | |
| 2 | 83.13 | 7.37 | |||
| 3 | 83.27 | 9.52 | |||
| 5.0 | 1 | 67.05 | 2.60 | 2.65 | |
| 2 | 64.88 | 1.52 | |||
| 3 | 68.52 | 2.60 | |||
| MAB | 0.5 | 1 | 90.93 | 4.68 | 7.65 |
| 2 | 88.17 | 8.26 | |||
| 3 | 86.07 | 9.72 | |||
| 1.0 | 1 | 90.00 | 3.16 | 9.29 | |
| 2 | 85.51 | 9.82 | |||
| 3 | 77.75 | 9.72 | |||
| 5.0 | 1 | 69.78 | 3.36 | 9.23 | |
| 2 | 84.46 | 7.30 | |||
| 3 | 76.25 | 9.76 | |||
| H-CLB | 0.5 | 1 | 81.68 | 8.33 | 8.21 |
| 2 | 86.10 | 9.17 | |||
| 3 | 88.50 | 6.84 | |||
| 1.0 | 1 | 68.75 | 4.61 | 6.66 | |
| 2 | 77.39 | 5.23 | |||
| 3 | 65.83 | 3.95 | |||
| 5.0 | 1 | 65.21 | 3.80 | 7.75 | |
| 2 | 75.69 | 8.60 | |||
| 3 | 63.40 | 3.21 | |||
| SAL | 0.5 | 1 | 67.92 | 4.93 | 3.95 |
| 2 | 66.67 | 3.76 | |||
| 3 | 68.17 | 3.61 | |||
| 1.0 | 1 | 63.08 | 2.34 | 5.23 | |
| 2 | 66.58 | 4.71 | |||
| 3 | 72.80 | 2.71 | |||
| 5.0 | 1 | 65.13 | 3.93 | 4.03 | |
| 2 | 67.72 | 1.97 | |||
| 3 | 65.85 | 5.63 | |||
| TEB | 0.5 | 1 | 84.50 | 4.69 | 6.85 |
| 2 | 90.67 | 6.59 | |||
| 3 | 90.25 | 8.10 | |||
| 1.0 | 1 | 73.13 | 2.00 | 4.33 | |
| 2 | 78.75 | 3.48 | |||
| 3 | 79.50 | 4.31 | |||
| 5.0 | 1 | 70.28 | 2.18 | 3.56 | |
| 2 | 64.32 | 2.26 | |||
| 3 | 64.67 | 2.52 | |||
| TUL | 0.5 | 1 | 81.17 | 9.14 | 8.30 |
| 2 | 85.92 | 6.48 | |||
| 3 | 91.12 | 7.03 | |||
| 1.0 | 1 | 97.94 | 4.76 | 9.73 | |
| 2 | 80.42 | 2.57 | |||
| 3 | 99.21 | 5.27 | |||
| 5.0 | 1 | 106.34 | 3.01 | 6.14 | |
| 2 | 94.86 | 4.51 | |||
| 3 | 101.77 | 4.32 | |||
| CIB | 0.5 | 1 | 68.00 | 5.39 | 9.89 |
| 2 | 89.58 | 3.81 | |||
| 3 | 81.58 | 1.74 | |||
| 1.0 | 1 | 66.00 | 4.75 | 8.86 | |
| 2 | 70.46 | 8.30 | |||
| 3 | 78.33 | 9.04 | |||
| 5.0 | 1 | 73.47 | 4.42 | 5.64 | |
| 2 | 62.81 | 0.66 | |||
| 3 | 71.18 | 3.59 | |||
| BRM | 0.5 | 1 | 65.92 | 4.22 | 6.13 |
| 2 | 75.50 | 2.93 | |||
| 3 | 63.92 | 3.04 | |||
| 1.0 | 1 | 63.25 | 2.53 | 2.87 | |
| 2 | 65.13 | 3.88 | |||
| 3 | 63.75 | 2.04 | |||
| 5.0 | 1 | 69.23 | 1.35 | 3.20 | |
| 2 | 63.43 | 2.32 | |||
| 3 | 67.00 | 2.64 | |||
| ISS | 0.5 | 1 | 90.18 | 9.99 | 8.82 |
| 2 | 84.33 | 8.58 | |||
| 3 | 83.33 | 7.63 | |||
| 1.0 | 1 | 88.38 | 3.64 | 9.33 | |
| 2 | 76.30 | 7.73 | |||
| 3 | 91.25 | 8.49 | |||
| 5.0 | 1 | 68.30 | 6.95 | 8.20 | |
| 2 | 69.77 | 6.36 | |||
| 3 | 78.26 | 8.39 |
| Compound | Added Level (μg/kg) | Batch | Average Recovery (%) | Intraday RSD (%) | Interday RSD (%) |
|---|---|---|---|---|---|
| BAM | 0.5 | 1 | 91.08 | 8.62 | 9.83 |
| 2 | 99.08 | 4.81 | |||
| 3 | 82.58 | 8.23 | |||
| 1.0 | 1 | 83.99 | 3.65 | 5.79 | |
| 2 | 78.92 | 4.16 | |||
| 3 | 76.88 | 7.15 | |||
| 5.0 | 1 | 64.93 | 3.93 | 5.45 | |
| 2 | 74.50 | 4.07 | |||
| 3 | 69.83 | 3.73 | |||
| PEA | 0.5 | 1 | 96.67 | 7.49 | 8.72 |
| 2 | 89.58 | 9.83 | |||
| 3 | 92.80 | 8.69 | |||
| 1.0 | 1 | 78.21 | 9.99 | 8.45 | |
| 2 | 73.42 | 9.47 | |||
| 3 | 82.37 | 2.31 | |||
| 5.0 | 1 | 66.94 | 4.75 | 7.21 | |
| 2 | 76.85 | 8.89 | |||
| 3 | 70.95 | 3.95 | |||
| FOM | 0.5 | 1 | 82.42 | 6.79 | 8.10 |
| 2 | 80.92 | 8.87 | |||
| 3 | 81.25 | 9.83 | |||
| 1.0 | 1 | 69.67 | 4.89 | 4.36 | |
| 2 | 68.88 | 1.84 | |||
| 3 | 65.71 | 5.18 | |||
| 5.0 | 1 | 63.59 | 2.01 | 5.65 | |
| 2 | 72.47 | 6.99 | |||
| 3 | 65.97 | 2.21 | |||
| CLP | 0.5 | 1 | 102.33 | 8.26 | 6.73 |
| 2 | 92.42 | 4.33 | |||
| 3 | 97.83 | 2.82 | |||
| 1.0 | 1 | 76.63 | 4.49 | 5.57 | |
| 2 | 80.38 | 3.79 | |||
| 3 | 70.04 | 2.26 | |||
| 5.0 | 1 | 63.53 | 1.22 | 2.33 | |
| 2 | 66.42 | 1.50 | |||
| 3 | 67.26 | 2.35 | |||
| CLB | 0.5 | 1 | 77.17 | 7.47 | 8.79 |
| 2 | 82.17 | 4.32 | |||
| 3 | 92.42 | 6.55 | |||
| 1.0 | 1 | 72.42 | 3.64 | 5.02 | |
| 2 | 71.92 | 3.78 | |||
| 3 | 80.54 | 1.31 | |||
| 5.0 | 1 | 64.72 | 1.12 | 4.78 | |
| 2 | 72.14 | 3.85 | |||
| 3 | 74.03 | 1.88 | |||
| CLO | 0.5 | 1 | 108.88 | 3.10 | 8.13 |
| 2 | 98.25 | 9.43 | |||
| 3 | 109.08 | 5.82 | |||
| 1.0 | 1 | 86.77 | 9.14 | 8.96 | |
| 2 | 97.67 | 5.31 | |||
| 3 | 83.83 | 5.79 | |||
| 5.0 | 1 | 66.67 | 3.34 | 4.02 | |
| 2 | 67.01 | 4.81 | |||
| 3 | 67.73 | 4.48 | |||
| RAC | 0.5 | 1 | 73.83 | 7.81 | 9.10 |
| 2 | 74.25 | 8.31 | |||
| 3 | 84.33 | 8.18 | |||
| 1.0 | 1 | 83.13 | 9.13 | 8.13 | |
| 2 | 77.75 | 7.97 | |||
| 3 | 74.18 | 5.37 | |||
| 5.0 | 1 | 68.84 | 5.69 | 7.56 | |
| 2 | 67.91 | 5.05 | |||
| 3 | 80.38 | 4.52 | |||
| RIT | 0.5 | 1 | 78.67 | 6.38 | 6.80 |
| 2 | 80.83 | 6.45 | |||
| 3 | 77.75 | 8.30 | |||
| 1.0 | 1 | 81.00 | 6.38 | 8.76 | |
| 2 | 73.50 | 9.36 | |||
| 3 | 69.96 | 7.52 | |||
| 5.0 | 1 | 69.98 | 6.93 | 8.03 | |
| 2 | 81.38 | 6.69 | |||
| 3 | 68.02 | 1.24 | |||
| MAB | 0.5 | 1 | 88.67 | 7.07 | 7.96 |
| 2 | 94.67 | 5.70 | |||
| 3 | 85.17 | 8.80 | |||
| 1.0 | 1 | 84.46 | 9.65 | 9.96 | |
| 2 | 96.50 | 7.50 | |||
| 3 | 81.00 | 5.40 | |||
| 5.0 | 1 | 69.98 | 6.93 | 9.98 | |
| 2 | 85.08 | 5.80 | |||
| 3 | 89.38 | 2.76 | |||
| H-CLB | 0.5 | 1 | 92.00 | 7.29 | 8.89 |
| 2 | 83.42 | 7.98 | |||
| 3 | 92.33 | 9.50 | |||
| 1.0 | 1 | 75.58 | 9.60 | 8.40 | |
| 2 | 73.33 | 4.80 | |||
| 3 | 82.54 | 8.33 | |||
| 5.0 | 1 | 68.78 | 3.51 | 6.15 | |
| 2 | 71.24 | 2.67 | |||
| 3 | 79.91 | 5.23 | |||
| SAL | 0.5 | 1 | 78.42 | 8.87 | 8.36 |
| 2 | 64.67 | 3.64 | |||
| 3 | 68.23 | 4.86 | |||
| 1.0 | 1 | 62.58 | 2.10 | 3.65 | |
| 2 | 62.00 | 1.94 | |||
| 3 | 67.57 | 3.83 | |||
| 5.0 | 1 | 67.92 | 2.85 | 2.73 | |
| 2 | 65.43 | 2.50 | |||
| 3 | 66.13 | 2.66 | |||
| TEB | 0.5 | 1 | 101.58 | 4.74 | 7.61 |
| 2 | 92.50 | 7.17 | |||
| 3 | 91.92 | 7.23 | |||
| 1.0 | 1 | 85.38 | 5.91 | 6.25 | |
| 2 | 77.88 | 6.19 | |||
| 3 | 79.79 | 4.82 | |||
| 5.0 | 1 | 64.03 | 1.34 | 4.68 | |
| 2 | 72.10 | 4.05 | |||
| 3 | 71.53 | 2.73 | |||
| TUL | 0.5 | 1 | 78.88 | 6.39 | 6.80 |
| 2 | 78.58 | 8.66 | |||
| 3 | 75.75 | 5.85 | |||
| 1.0 | 1 | 90.83 | 8.35 | 8.79 | |
| 2 | 84.88 | 8.74 | |||
| 3 | 78.58 | 5.16 | |||
| 5.0 | 1 | 100.23 | 3.68 | 6.57 | |
| 2 | 104.13 | 5.16 | |||
| 3 | 92.09 | 4.03 | |||
| CIB | 0.5 | 1 | 92.32 | 7.08 | 7.54 |
| 2 | 103.50 | 6.06 | |||
| 3 | 92.75 | 3.21 | |||
| 1.0 | 1 | 68.21 | 2.06 | 7.40 | |
| 2 | 83.50 | 3.36 | |||
| 3 | 81.21 | 2.70 | |||
| 5.0 | 1 | 63.30 | 1.89 | 2.12 | |
| 2 | 64.89 | 2.15 | |||
| 3 | 63.62 | 2.31 | |||
| BRM | 0.5 | 1 | 111.83 | 4.86 | 6.20 |
| 2 | 101.92 | 5.13 | |||
| 3 | 103.00 | 3.10 | |||
| 1.0 | 1 | 74.75 | 1.36 | 4.97 | |
| 2 | 77.13 | 2.42 | |||
| 3 | 67.17 | 3.39 | |||
| 5.0 | 1 | 85.57 | 3.95 | 9.29 | |
| 2 | 66.94 | 1.49 | |||
| 3 | 69.00 | 5.06 | |||
| ISS | 0.5 | 1 | 93.75 | 8.62 | 7.74 |
| 2 | 92.33 | 7.85 | |||
| 3 | 93.75 | 8.15 | |||
| 1.0 | 1 | 84.58 | 6.94 | 7.05 | |
| 2 | 85.90 | 6.11 | |||
| 3 | 81.04 | 8.26 | |||
| 5.0 | 1 | 66.58 | 3.03 | 3.34 | |
| 2 | 66.77 | 4.15 | |||
| 3 | 64.79 | 2.95 |
References
- Guo, P.; Wan, J.; Zhan, C.; Zhu, C.; Jiang, W.; Ke, Y.; Ding, S.; Wang, D. A Simplified Sample Pretreatment for the Rapid Determination of 22 β-Agonist Residues in Swine Muscle and Liver Tissues by Ultra-High-Performance Liquid Chromatography Tandem Mass Spectrometry. J. Chromatogr. B 2018, 1096, 122–134. [Google Scholar] [CrossRef] [PubMed]
- Juan, C.; Igualada, C.; Moragues, F.; León, N.; Mañes, J. Development and Validation of a Liquid Chromatography Tandem Mass Spectrometry Method for the Analysis of β-Agonists in Animal Feed and Drinking Water. J. Chromatogr. A 2010, 1217, 6061–6068. [Google Scholar] [CrossRef] [PubMed]
- Zhang, Y. Application of LC-MS/MS method for simultaneous and rapid detection of 12 β-agonists in beef. China Food Saf. Mag. 2020, 26, 71–75. [Google Scholar] [CrossRef]
- Cheng, J.; Su, X.-O.; Han, C.; Wang, S.; Wang, P.; Zhang, S.; Xie, J. Ultrasensitive Detection of Salbutamol in Animal Urine by Immunomagnetic Bead Treatment Coupling with Surface-Enhanced Raman Spectroscopy. Sens. Actuators B Chem. 2018, 255, 2329–2338. [Google Scholar] [CrossRef]
- Wang, X.; Liufu, T.; Beloglazova, N.V.; Luo, P.; Qu, J.; Jiang, W. Development of a Competitive Indirect Enzyme-Linked Immunosorbent Assay for Screening Phenylethanolamine A Residues in Pork Samples. Food Anal. Methods 2016, 9, 3099–3106. [Google Scholar] [CrossRef]
- Nicoli, R.; Petrou, M.; Badoud, F.; Dvorak, J.; Saugy, M.; Baume, N. Quantification of Clenbuterol at Trace Level in Human Urine by Ultra-High Pressure Liquid Chromatography-Tandem Mass Spectrometry. J. Chromatogr. A 2013, 1292, 142–150. [Google Scholar] [CrossRef]
- Notice No. 1519th Ministry of Agriculture and Rural Affairs of the People’s Republic of China. Available online: http://www.moa.gov.cn/gk/tzgg_1/gg/201104/t20110422_1976294.htm (accessed on 1 September 2022).
- Zhou, Y.C.; Hua, X.M.; Li, D.D. The propertites of β-agonists and the key points in determination of residue. Meat Ind. 2021, 07, 34–39. [Google Scholar] [CrossRef]
- Jiang, D.; Cao, B.; Wang, M.; Yang, H.; Zhao, K.; Li, J.; Li, M.; Sun, L.; Deng, A. Development of a Highly Sensitive and Specific Monoclonal Antibody Based Enzyme-Linked Immunosorbent Assay for the Detection of a New Beta-Agonist, Phenylethanolamine A, in Food Samples. J. Sci. Food Agric. 2017, 97, 1001–1009. [Google Scholar] [CrossRef]
- Li, P.; Guo, Y.; Jiao, S.T. Preparation of a New Lean Meat Bambuterol Colloidal Raoid Test Card. Farm. Prod. Proc. 2020, 02, 61–63. [Google Scholar] [CrossRef]
- He, Z.; Fan, H. Research Progress of Electrochemical Detection of Beta-Agonists: A Mini-Review. Int. J. Electrochem. Sci. 2019, 14, 9449–9458. [Google Scholar] [CrossRef]
- Ye, D.; Wu, S.; Xu, J.; Jiang, R.; Zhu, F.; Ouyang, G. Rapid Determination of Clenbuterol in Pork by Direct Immersion Solid-Phase Microextraction Coupled with Gas Chromatography–Mass Spectrometry. J. Chromatogr. Sci. 2015, 54, 112–118. [Google Scholar] [CrossRef] [PubMed][Green Version]
- Medellín-Martínez, M.F.; Luna-Zavala, I.; Martínez-Delgado, M.; Pérez-Urizar, J.T.; Ramírez-Telles, J.A.; Patiño-Rodríguez, O. Sensitive Assay of Clenbuterol Residues in Beef by Ultra-High Performance Liquid Chromatography Coupled with Mass Spectrometry (UPLC-MS/MS) and Solid-Phase Extraction. Food Anal. Methods 2018, 11, 2561–2568. [Google Scholar] [CrossRef]
- Gan, S.; Lai, Q.N.; Li, Z.C.; Han, T.; Wu, C.Q. Catabolism and Residue of β-agonists in Swine by Surface-Enhanced Raman Scattering Spectrometry. Chin. J. Vet. Sci. 2016, 36, 1550–1557. [Google Scholar] [CrossRef]
- Li, G.; Zhang, X.; Zheng, F.; Liu, J.; Wu, D. Emerging Nanosensing Technologies for the Detection of Beta-Agonists. Food Chem. 2020, 332, 127431. [Google Scholar] [CrossRef]
- Wang, Q.; Deng, J.; Chen, Y.; Luo, Y.; Jiang, X. An Immunoassay Based on Lab-on-a-Chip for Simultaneous and Sensitive Detection of Clenbuterol and Ractopamine. Chin. Chem. Lett. 2020, 31, 1835–1838. [Google Scholar] [CrossRef]
- Masia, A.; Suarez-Varela, M.M.; Llopis-Gonzalez, A.; Pico, Y. Determination of Pesticides and Veterinary Drug Residues in Food by Liquid Chromatography-Mass Spectrometry: A Review. Anal. Chim. Acta 2016, 936, 40–61. [Google Scholar] [CrossRef]
- Foodmate. Available online: http://down.foodmate.net/standard/yulan.php?itemid=17197 (accessed on 2 September 2022).
- Foodmate. Available online: http://down.foodmate.net/standard/yulan.php?itemid=15638 (accessed on 4 November 2022).
- Foodmate. Available online: http://down.foodmate.net/standard/yulan.php?itemid=28764 (accessed on 4 November 2022).
- Matuszewski, B.K.; Constanzer, M.L.; Chavez-Eng, C.M. Strategies for the Assessment of Matrix Effect in Quantitative Bioanalytical Methods Based on HPLC-MS/MS. Anal. Chem. 2003, 75, 3019–3030. [Google Scholar] [CrossRef]
- Giacinti, G.; Raynaud, C.; Capblancq, S.; Simon, V. Evaluation and Prevention of the Negative Matrix Effect of Terpenoids on Pesticides in Apples Quantification by Gas Chromatography-Tandem Mass Spectrometry. J. Chromatogr. A 2017, 1483, 8–19. [Google Scholar] [CrossRef]
- FDA. Available online: https://www.fda.gov/regulatory-information/search-fda-guidance-documents/bioanalytical-method-validation-guidance-industry (accessed on 4 November 2022).
- Shao, B.; Jia, X.; Zhang, J.; Meng, J.; Wu, Y.; Duan, H.; Tu, X. Multi-Residual Analysis of 16 β-Agonists in Pig Liver, Kidney and Muscle by Ultra Performance Liquid Chromatography Tandem Mass Spectrometry. Food Chem. 2009, 114, 1115–1121. [Google Scholar] [CrossRef]
- Wang, X.; Guo, T.; Wang, S.; Yuan, J.; Zhao, R. Simultaneous Determination of 11 -Agonists in Human Urine Using High-Performance Liquid Chromatography/Tandem Mass Spectrometry with Isotope Dilution. J. Anal. Toxicol. 2015, 39, 213–218. [Google Scholar] [CrossRef]
- Chen, Q.P.; Han, F.; Wang, Y.; Huang, Y.F.; Wang, S.Y.; Yu, H.J. Research Progress on β-agonists in Food-born Animal Tissues. J. Food Saf. Food Qual. 2019, 10, 385–393. [Google Scholar] [CrossRef]
- Yan, K.; Zhang, H.; Hui, W.; Zhu, H.; Li, X.; Zhong, F.; Tong, X.; Chen, C. Rapid Screening of Toxic Salbutamol, Ractopamine, and Clenbuterol in Pork Sample by High-Performance Liquid Chromatography-UV Method. J. Food Drug Anal. 2016, 24, 277–283. [Google Scholar] [CrossRef] [PubMed]
- Wang, C.-J.; Liu, H.-J.; Chou, T.-C.; Lin, C.-C.; Pan, W.-H.; Chen, P.-C.; Hsu, J.-F. Simultaneous Determination of Eight β-Adrenergic Agonists in Human Urine by an Isotope Dilution-Online Clean-up System Coupled with Liquid Chromatography-Tandem Mass Spectrometry. Chemosphere 2022, 301, 134778. [Google Scholar] [CrossRef] [PubMed]
- Liu, D.; Han, L.; Huang, K.; Wang, B.; Wang, H.; Yu, T.T.; Wang, H.X. Simultaneous Determination of Traditional and New Types of “Lean Meat Powder” in Pork by Ultra Performance Liquid Chromatography-Tandem Mass Spectrometry. Food Mach 2019, 35, 87–93. [Google Scholar] [CrossRef]
- Zhang, Y.; Zhao, S.Z.; Qu, L.; Cao, C.; Shi, Y.Y.; Yi, X.H. Determination of 10 Kinds of β-agonists in Meat and Meat Products by Martix Solid-phase Dispersion-High Performance Liquid Chromatography Tandem Quadrupole Linear Ion Trap Mass Spectrometry. Food Sci. 2014, 35, 202–207. [Google Scholar] [CrossRef]
- Liu, H.B.; Li, Y.; Yao, X.M.; Yu, L.; Cai, Y.H. Simultaneous Determination of Twenty-Seven β-agonists Residues in Goat Milk and Powder Using Ultral Performance Liquid Chromatography Tandem Mass Spectrometry. Sci. Technol. Food Ind. 2017, 38, 214–220. [Google Scholar] [CrossRef]
- Yang, L.; Xiao-Ou, S.; Rui-Guo, W.; Pei-Long, W.; Wei, Z.; Jie, C. Simultaneous Determination of 14 Kinds of beta-Agonist Residues in Sheep Saliva by Ultra Performance Liquid Chramatogrephy-Tandem Mass Spectrometry. Chin. J. Anal. Chem. 2013, 41, 899–904. [Google Scholar] [CrossRef]
- Qu, C.H.; Li, X.L.; Zhang, L.; Xi, C.X.; Wang, G.M.; Li, N.B.; Luo, H.Q. Simultaneous Determination of Cimaterol, Salbutamol, Terbutaline and Ractopamine in Feed by SPE Coupled to UPLC. Chromatographia 2011, 73, 243–249. [Google Scholar] [CrossRef]
- Deng, X.-J.; Yang, H.-Q.; Li, J.-Z.; Song, Y.; Guo, D.-H.; Luo, Y.; Du, X.-N.; Bo, T. Multiclass Residues Screening of 105 Veterinary Drugs in Meat, Milk, and Egg Using Ultra High Performance Liquid Chromatography Tandem Quadrupole Time-of-Flight Mass Spectrometry. J. Liq. Chromatogr. Relat. Technol. 2011, 34, 2286–2303. [Google Scholar] [CrossRef]
- Sakai, N.; Sakai, M.; Haron, D.E.M.; Yoneda, M.; Mohd, M.A. Beta-Agonist Residues in Cattle, Chicken and Swine Livers at the Wet Market and the Environmental Impacts of Wastewater from Livestock Farms in Selangor State, Malaysia. Chemosphere 2016, 165, 183–190. [Google Scholar] [CrossRef]
- Moragues, F.; Igualada, C. How to Decrease Ion Suppression in a Multiresidue Determination of Beta-Agonists in Animal Liver and Urine by Liquid Chromatography-Mass Spectrometry with Ion-Trap Detector. Anal. Chim. Acta 2009, 637, 193–195. [Google Scholar] [CrossRef] [PubMed]
- Turberg, M.P.; Macy, T.D.; Lewis, J.J.; Coleman, M.R. Determination of Ractopamine Hydrochloride in Swine and Turkey Tissues by Liquid Chromatography with Coulometric Detection. J. AOAC Int. 1995, 78, 1394–1402. [Google Scholar] [CrossRef] [PubMed]
- Zhang, L.; Jia, Q.; Liao, G.; Qian, Y.; Qiu, J. A Fast Method for the Simultaneous Analysis of 26 Beta-Agonists in Swine Muscle with a Multi-Functional Filter by Ultra-High Performance Liquid Chromatography-Tandem Mass Spectrometry. Separations 2022, 9, 121. [Google Scholar] [CrossRef]
- Yikilmaz, Y.; Kuzukiran, O.; Erdogan, E.; Sen, F.; Kirmizibayrak, O.; Filazi, A. The Determination of Beta-Agonist Residues in Bovine Tissues Using Liquid Chromatography-Tandem Mass Spectrometry. Biomed. Chromatogr. 2020, 34, e4926. [Google Scholar] [CrossRef] [PubMed]
- Foodmate. Available online: http://down.foodmate.net/standard/yulan.php?itemid=15544 (accessed on 4 November 2022).


| Compound | Internal Standard | Parent Ion (m/z) | Daughter Ion (m/z) | Collision Energy (V) | Declustering Potential (V) |
|---|---|---|---|---|---|
| CLO | CLB-D9 | 214.125 | 195.970 * | 11.95 | 88 |
| 154.054 | 17.13 | ||||
| TEB | SAL-D3 | 226.062 | 152.095 * | 16.04 | 101 |
| 125.071 | 24.00 | ||||
| TUL | CLB-D9 | 228.112 | 154.125 * | 16.25 | 88 |
| 116.429 | 28.80 | ||||
| CIB | CLB-D9 | 234.162 | 160.125 * | 14.60 | 92 |
| 143.071 | 25.09 | ||||
| SAL | SAL-D3 | 240.175 | 148.125 * | 16.14 | 93 |
| 222.125 | 10.48 | ||||
| CLB | CLB-D9 | 277.088 | 202.946 * | 16.04 | 96 |
| 258.750 | 10.60 | ||||
| RIT | CLB-D9 | 288.175 | 270.149 * | 12.75 | 104 |
| 121.071 | 22.35 | ||||
| CLP | CLB-D9 | 291.088 | 202.958 * | 15.74 | 97 |
| 273.095 | 10.64 | ||||
| H-CLB | RAC-D6 | 293.088 | 275.083 * | 11.49 | 101 |
| 202.958 | 17.81 | ||||
| ISS | RAC-D6 | 302.175 | 284.196 * | 13.93 | 100 |
| 107.000 | 28.42 | ||||
| RAC | RAC-D6 | 302.175 | 164.167 * | 15.57 | 103 |
| 284.202 | 11.61 | ||||
| MAB | CLB-D9 | 311.138 | 237.048 * | 17.01 | 101 |
| 293.042 | 11.28 | ||||
| FOM | CLB-D9 | 345.175 | 149.125 * | 19.03 | 103 |
| 327.125 | 13.38 | ||||
| PEA | PEA-D3 | 345.225 | 327.036 * | 12.29 | 102 |
| 150.125 | 22.23 | ||||
| BRM | CLB-D9 | 367.000 | 292.875 * | 16.23 | 105 |
| 348.958 | 11.87 | ||||
| BAM | BAM-D9 | 368.212 | 294.042 * | 16.82 | 110 |
| 72.125 | 31.66 | ||||
| RAC-D6 | 343.880 | 307.430 | 13.00 | 100 | |
| SAL-D3 | 243.162 | 151.054 | 16.00 | 98 | |
| CLB-D9 | 322.710 | 286.250 | 15.00 | 117 | |
| PEA-D3 | 347.420 | 330.300 | 12.00 | 102 | |
| BAM-D9 | 412.960 | 376.620 | 19.00 | 100 |
| Enzymatic Condition | Number of β-agonists | ||
|---|---|---|---|
| Recovery < 60% | Recovery 60% to 120% | Recovery > 120% | |
| 37 °C, 12 h | 0 | 16 | 0 |
| 40 °C, 2 h | 0 | 16 | 0 |
| 55 °C, 2 h | 7 | 9 | 0 |
| Extraction Solvent | Number of β-agonists | ||
|---|---|---|---|
| Recovery < 60% | Recovery 60% to 120% | Recovery > 120% | |
| No-extraction | 3 | 10 | 3 |
| Methanol | 7 | 9 | 0 |
| Acetonitrile (containing 1% acetic acid, v/v) | 0 | 16 | 0 |
| SPE Columns | Number of β-agonists | ||
|---|---|---|---|
| Recovery < 60% | Recovery 60% to 120% | Recovery > 120% | |
| Oasis MCX | 2 | 14 | 0 |
| Oasis HLB | 3 | 11 | 2 |
| Bond Elut C18 | 3 | 13 | 0 |
| QVet-AG | 0 | 16 | 0 |
| Matrix | Compound | Regression Equation | R2 | Linear Range (μg/L) | LOD (μg/kg) | LOQ (μg/kg) |
|---|---|---|---|---|---|---|
| Pork | BAM | y = 0.1258x − 0.0057 | 0.9998 | 0.1–50 | 0.10 | 0.30 |
| PEA | y = 0.6074x + 0.2572 | 0.9928 | 0.1–50 | 0.11 | 0.38 | |
| FOM | y = 0.1844x + 0.0074 | 0.9978 | 0.1–50 | 0.06 | 0.15 | |
| CLP | y = 1.7030x − 1.0950 | 0.9972 | 0.1–50 | 0.03 | 0.08 | |
| CLB | y = 1.0860x + 0.2131 | 0.9989 | 0.1–50 | 0.03 | 0.08 | |
| CLO | y = 1.6150x + 0.1295 | 0.9965 | 0.1–50 | 0.04 | 0.11 | |
| RAC | y = 16.220x − 0.9442 | 0.9988 | 0.1–50 | 0.08 | 0.24 | |
| RIT | y = 0.6781x − 0.2005 | 0.9984 | 0.1–50 | 0.02 | 0.07 | |
| MAB | y = 0.1564x + 0.0129 | 0.9988 | 0.1–50 | 0.06 | 0.17 | |
| H-CLB | y = 13.340x − 5.9060 | 0.9979 | 0.1–50 | 0.02 | 0.07 | |
| SAL | y = 1.4730x + 0.4359 | 0.9969 | 0.1–50 | 0.04 | 0.12 | |
| TEB | y = 1.6870x + 0.2761 | 0.9985 | 0.1–50 | 0.08 | 0.23 | |
| TUL | y = 2.2080x − 0.7053 | 0.9964 | 0.1–50 | 0.03 | 0.08 | |
| CIB | y = 2.0570x − 1.1800 | 0.9968 | 0.1–50 | 0.03 | 0.08 | |
| BRM | y = 0.0483x − 0.0141 | 0.9980 | 0.1–50 | 0.03 | 0.08 | |
| ISS | y = 8.1590x − 0.4464 | 0.9944 | 0.1–50 | 0.01 | 0.04 | |
| Beef | BAM | y = 0.0936x + 0.0092 | 0.9994 | 0.1–50 | 0.03 | 0.08 |
| PEA | y = 0.4056x + 0.1524 | 0.9989 | 0.1–50 | 0.03 | 0.08 | |
| FOM | y = 0.1063x + 0.0317 | 0.9991 | 0.1–50 | 0.03 | 0.08 | |
| CLP | y = 0.7935x + 0.4343 | 0.9969 | 0.1–50 | 0.02 | 0.06 | |
| CLB | y = 0.8907x + 0.0041 | 0.9994 | 0.1–50 | 0.03 | 0.08 | |
| CLO | y = 1.4230x + 0.2680 | 0.9992 | 0.1–50 | 0.05 | 0.16 | |
| RAC | y = 10.590x + 0.6483 | 0.9999 | 0.1–50 | 0.03 | 0.08 | |
| RIT | y = 0.2399x-0.0052 | 0.9991 | 0.1–50 | 0.05 | 0.16 | |
| MAB | y = 0.0834x + 0.0318 | 0.9981 | 0.1–50 | 0.04 | 0.13 | |
| H-CLB | y = 8.1500x + 0.4237 | 0.9999 | 0.1–50 | 0.03 | 0.08 | |
| SAL | y = 1.4270x + 0.0643 | 0.9995 | 0.1–50 | 0.02 | 0.06 | |
| TEB | y = 1.6510x + 0.1169 | 0.9998 | 0.1–50 | 0.03 | 0.08 | |
| TUL | y = 2.0850x − 0.0947 | 0.9991 | 0.1–50 | 0.03 | 0.08 | |
| CIB | y = 1.4520x + 0.2382 | 0.9998 | 0.1–50 | 0.03 | 0.08 | |
| BRM | y = 0.0312x + 0.0094 | 0.9998 | 0.1–50 | 0.03 | 0.08 | |
| ISS | y = 6.7130x + 2.5610 | 0.9982 | 0.1–50 | 0.03 | 0.08 | |
| Lamb | BAM | y = 0.0981x − 0.0065 | 0.9997 | 0.1–50 | 0.03 | 0.08 |
| PEA | y = 0.3109x + 0.1793 | 0.9970 | 0.1–50 | 0.06 | 0.19 | |
| FOM | y = 0.1031x + 0.0189 | 0.9991 | 0.1–50 | 0.03 | 0.08 | |
| CLP | y = 1.2570x − 0.0721 | 0.9987 | 0.1–50 | 0.02 | 0.07 | |
| CLB | y = 0.8248x + 0.0322 | 0.9995 | 0.1–50 | 0.04 | 0.13 | |
| CLO | y = 1.5840x − 0.2309 | 0.9997 | 0.1–50 | 0.05 | 0.15 | |
| RAC | y = 11.350x − 2.6370 | 0.9981 | 0.1–50 | 0.07 | 0.22 | |
| RIT | y = 0.2302x + 0.0225 | 0.9998 | 0.1–50 | 0.08 | 0.23 | |
| MAB | y = 0.1247x − 0.0041 | 0.9995 | 0.1–50 | 0.03 | 0.08 | |
| H-CLB | y = 8.3590x − 2.6760 | 0.9971 | 0.1–50 | 0.04 | 0.12 | |
| SAL | y = 1.4630x − 0.0553 | 0.9989 | 0.1–50 | 0.09 | 0.28 | |
| TEB | y = 1.6790x + 0.1416 | 0.9988 | 0.1–50 | 0.03 | 0.08 | |
| TUL | y = 2.1110x + 0.3056 | 0.9986 | 0.1–50 | 0.01 | 0.04 | |
| CIB | y = 1.6940x − 0.2312 | 0.9997 | 0.1–50 | 0.02 | 0.05 | |
| BRM | y = 0.0507x + 0.0002 | 0.9997 | 0.1–50 | 0.03 | 0.08 | |
| ISS | y = 12.880x − 3.8780 | 0.9981 | 0.1–50 | 0.07 | 0.21 |
Disclaimer/Publisher’s Note: The statements, opinions and data contained in all publications are solely those of the individual author(s) and contributor(s) and not of MDPI and/or the editor(s). MDPI and/or the editor(s) disclaim responsibility for any injury to people or property resulting from any ideas, methods, instructions or products referred to in the content. |
© 2022 by the authors. Licensee MDPI, Basel, Switzerland. This article is an open access article distributed under the terms and conditions of the Creative Commons Attribution (CC BY) license (https://creativecommons.org/licenses/by/4.0/).
Share and Cite
Yan, Y.; Ning, J.; Cheng, X.; Lv, Q.; Teng, S.; Wang, W. Rapid and High-Throughput Determination of Sixteen β-agonists in Livestock Meat Using One-Step Solid-Phase Extraction Coupled with UHPLC-MS/MS. Foods 2023, 12, 76. https://doi.org/10.3390/foods12010076
Yan Y, Ning J, Cheng X, Lv Q, Teng S, Wang W. Rapid and High-Throughput Determination of Sixteen β-agonists in Livestock Meat Using One-Step Solid-Phase Extraction Coupled with UHPLC-MS/MS. Foods. 2023; 12(1):76. https://doi.org/10.3390/foods12010076
Chicago/Turabian StyleYan, Yonghong, Jun Ning, Xin Cheng, Qingqin Lv, Shuang Teng, and Wei Wang. 2023. "Rapid and High-Throughput Determination of Sixteen β-agonists in Livestock Meat Using One-Step Solid-Phase Extraction Coupled with UHPLC-MS/MS" Foods 12, no. 1: 76. https://doi.org/10.3390/foods12010076
APA StyleYan, Y., Ning, J., Cheng, X., Lv, Q., Teng, S., & Wang, W. (2023). Rapid and High-Throughput Determination of Sixteen β-agonists in Livestock Meat Using One-Step Solid-Phase Extraction Coupled with UHPLC-MS/MS. Foods, 12(1), 76. https://doi.org/10.3390/foods12010076