
The Impact of Alternative Foods on Consumers’ Continuance Intention from an Innovation Perspective


Abstract
:1. Introduction
1.1. Research Background and Purpose
1.2. Alternative Foods
1.3. Research Scope
2. Theoretical Background and the Research Model
2.1. Continuance Intention (CI), Trust (TR), and Satisfaction (SAT)
2.2. Food Innovation Quality (FIQ)
2.3. Perceived Value (PV)
2.4. Expectation (EXP)
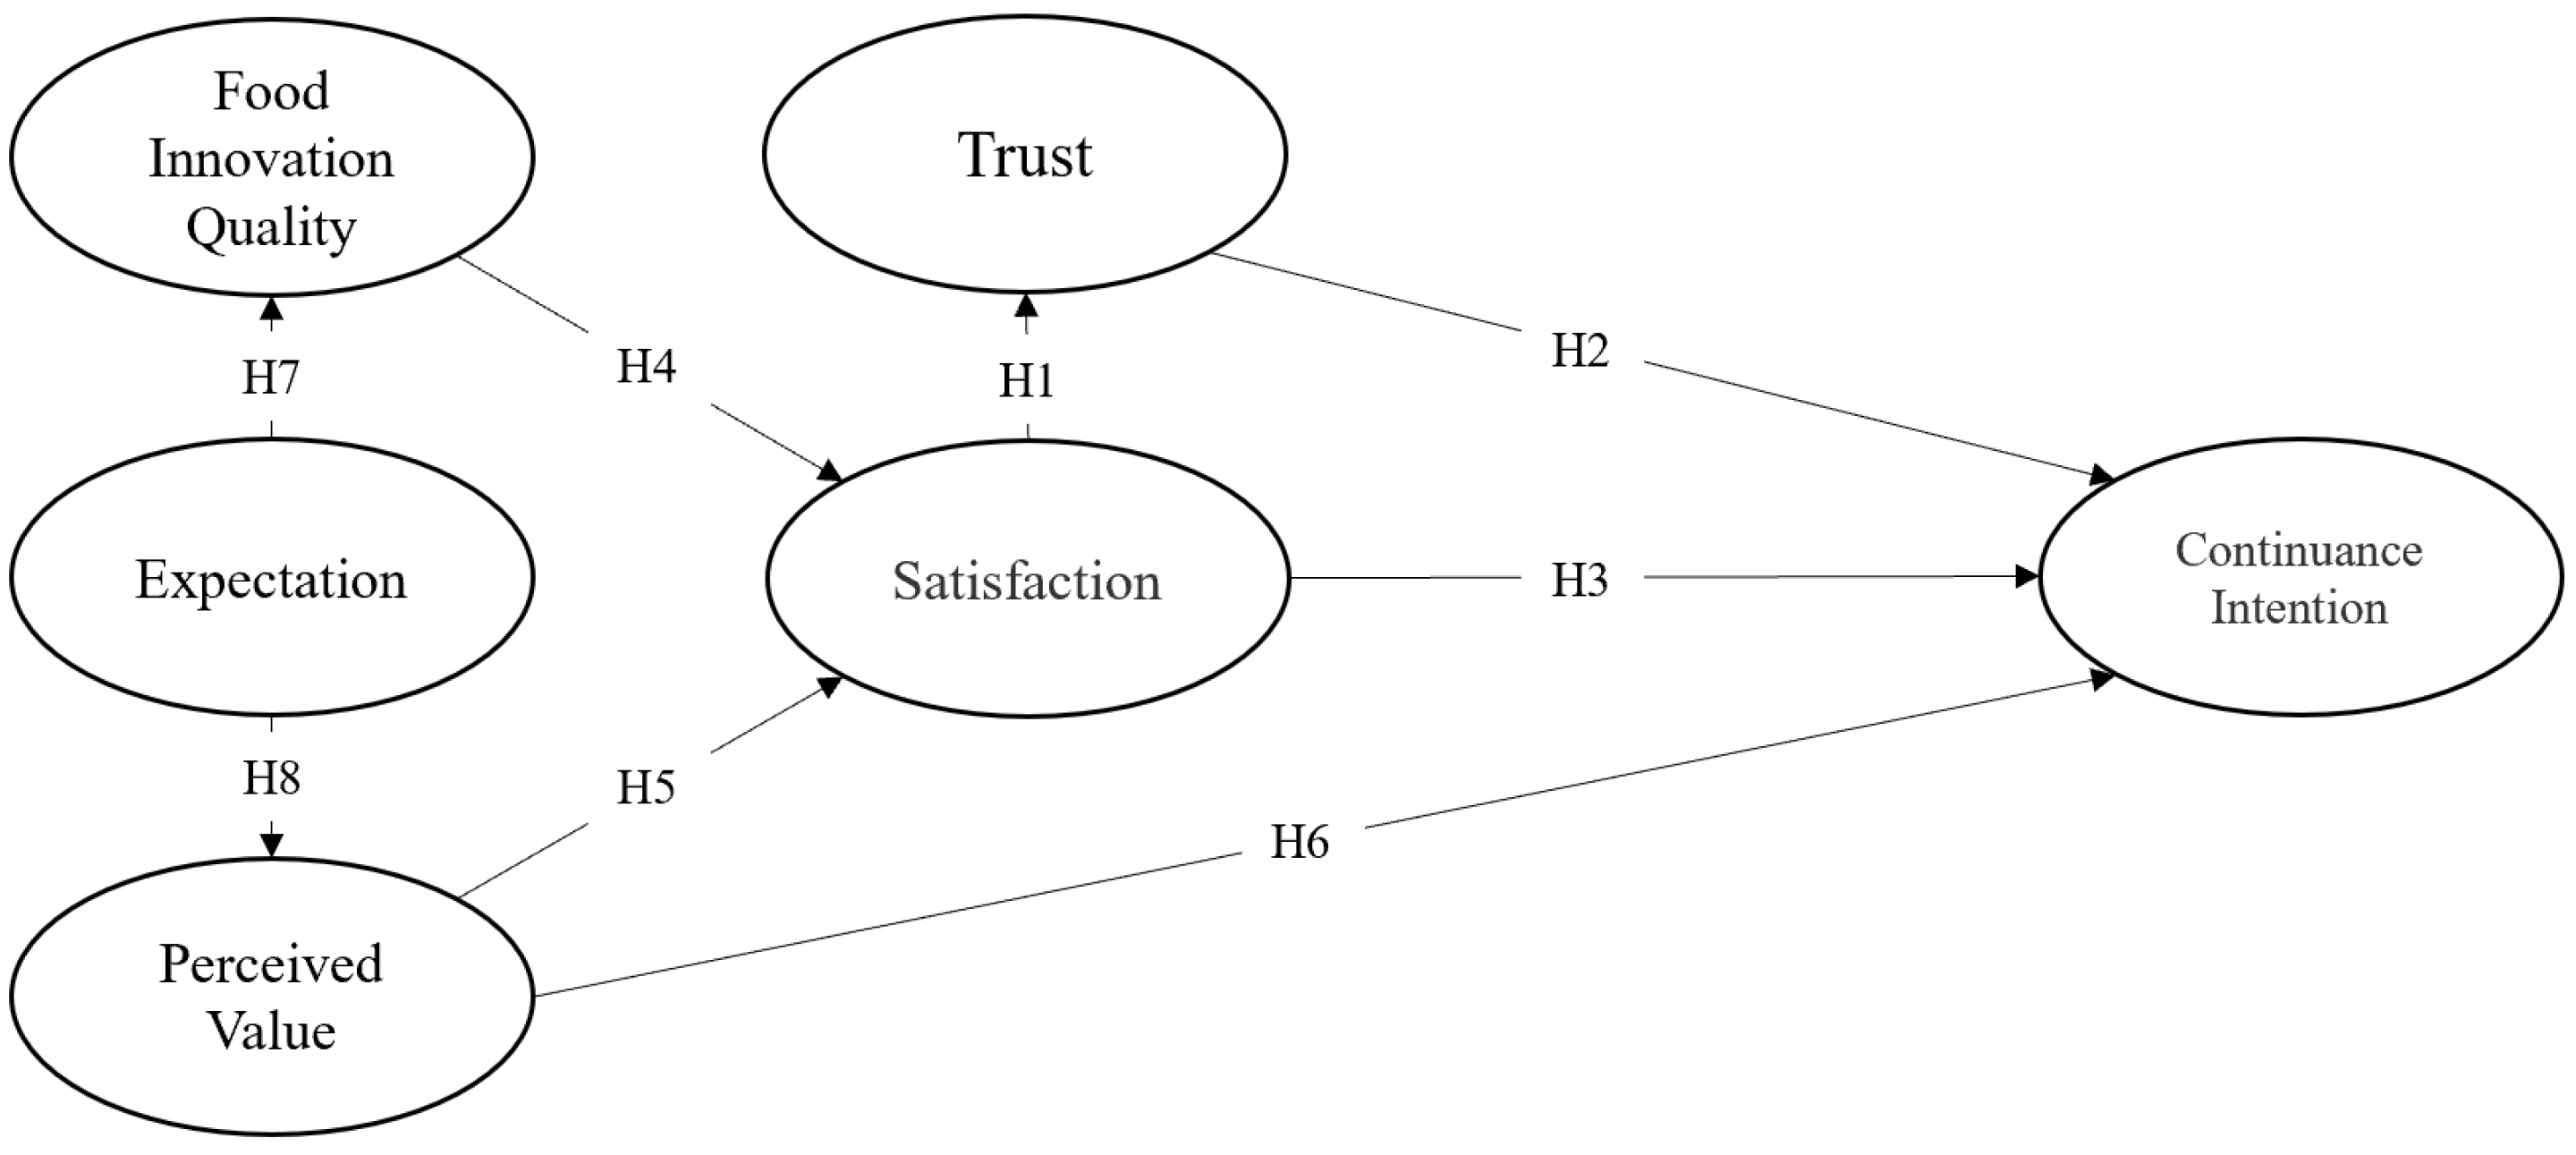
2.5. Proposed Theoretical Model
2.6. Definition and Measure of Variables
3. Research Analysis and Findings
3.1. Descriptive Analysis of Demographic Variables
3.2. The Reliability Analysis and Exploratory Factor Analysis
3.3. Confirmatory Factor Analysis
3.3.1. Convergent Validity
3.3.2. Model Fit Test
3.4. Path Analysis
3.5. Hypothesis Explanation
4. Discussion
5. Theoretical Contribution
6. Managerial Implications
7. Conclusions and Suggestions
7.1. Conclusions
7.2. Research Limitations and Future Ressarch
- As alternative foods, especially insect foods, are rarely popular, in order to find enough experienced consumers, we did not limit our research to specific geographical regions. Research could be more in-depth in the future if researchers are able to classify and analyze different consumer groups.
- The research was based on the perspective of innovation, but the model did not further subdivide the innovation dimension, which was another weakness of this research.
- As the subjects of this study were consumers who had experienced innovative alternative foods, food safety considerations were not relevant. While food safety was not the focus of this study, food safety should be viewed from the perspective of innovative foods. As a result, future researchers may need to consider the different impacts of food safety on consumers when conducting research relevant to food development or feedback.
- According to this study, perceived value is defined as consumers’ consideration of cost or whether the food would be worthwhile to consume. The literature we referred to shows that other scholars have divided values into several dimensions, such as nutrition, environment, emotion, etc. Future research may examine the significance of the above dimensions and provide in-depth analyses.
Author Contributions
Funding
Institutional Review Board Statement
Informed Consent Statement
Data Availability Statement
Acknowledgments
Conflicts of Interest
References
- Grahl, S.; Palanisamy, M.; Strack, M.; Meier-Dinkel, L.; Toepfl, S.; Mörlein, D. Towards more sustainable meat alternatives: How technical parameters affect the sensory properties of extrusion products derived from soy and algae. J. Clean. Prod. 2018, 198, 962–971. [Google Scholar] [CrossRef]
- Nations, U. World Population Prospects: The 2017 Revision; United Nations, Department of Economic and Social Affairs, Population Division: New York, NY, USA, 2017; p. 33. Available online: https://population.un.org/wpp/Publications/Files/WPP2017_Volume-I_Comprehensive-Tables.pdf (accessed on 9 June 2021).
- Sabaté, J.; Soret, S. Sustainability of plant-based diets: Back to the future. Am. J. Clin. Nutr. 2014, 100, 476S–482S. [Google Scholar] [CrossRef] [PubMed]
- Röös, E.; Patel, M.; Spångberg, J.; Carlsson, G.; Rydhmer, L. Limiting livestock production to pasture and by-products in a search for sustainable diets. Food Policy 2016, 58, 1–13. [Google Scholar] [CrossRef] [Green Version]
- Karmaus, A.L.; Jones, W. Future foods symposium on alternative proteins: Workshop proceedings. Trends Food Sci. Technol. 2020, 107, 124–129. [Google Scholar] [CrossRef]
- Koch, J.A.; Bolderdijk, J.W.; van Ittersum, K. Disgusting? No, just deviating from internalized norms. Understanding consumer skepticism toward sustainable food alternatives. J. Environ. Psychol. 2021, 76, 101645. [Google Scholar] [CrossRef]
- Gómez-Luciano, C.A.; de Aguiar, L.K.; Vriesekoop, F.; Urbano, B. Consumers’ willingness to purchase three alternatives to meat proteins in the United Kingdom, Spain, Brazil and the Dominican Republic. Food Qual. Prefer. 2019, 78, 103732. [Google Scholar] [CrossRef]
- Lombardi, A.; Vecchio, R.; Borrello, M.; Caracciolo, F.; Cembalo, L. Willingness to pay for insect-based food: The role of information and carrier. Food Qual. Prefer. 2019, 72, 177–187. [Google Scholar] [CrossRef]
- Verbeke, W. Profiling consumers who are ready to adopt insects as a meat substitute in a Western society. Food Qual. Prefer. 2015, 39, 147–155. [Google Scholar] [CrossRef]
- de Boer, J.; Aiking, H. Strategies towards healthy and sustainable protein consumption: A transition framework at the levels of diets, dishes, and dish ingredients. Food Qual. Prefer. 2019, 73, 171–181. [Google Scholar] [CrossRef]
- Damsbo-Svendsen, M.; Frøst, M.B.; Olsen, A. A review of instruments developed to measure food neophobia. Appetite 2017, 113, 358–367. [Google Scholar] [CrossRef]
- Kühne, B.; Vanhonacker, F.; Gellynck, X.; Verbeke, W. Innovation in traditional food products in Europe: Do sector innovation activities match consumers’ acceptance? Food Qual. Prefer. 2010, 21, 629–638. [Google Scholar] [CrossRef]
- Laestadius, L.I. Public Perceptions of the Ethics of In-vitro Meat: Determining an Appropriate Course of Action. J. Agric. Environ. Ethics 2015, 28, 991–1009. [Google Scholar] [CrossRef]
- Hartmann, C.; Siegrist, M. Consumer perception and behaviour regarding sustainable protein consumption: A systematic review. Trends Food Sci. Technol. 2017, 61, 11–25. [Google Scholar] [CrossRef]
- Finke, M.D. Complete Nutrient Content of Four Species of Feeder Insects. Zoo Biol. 2013, 32, 27–36. [Google Scholar] [CrossRef] [PubMed]
- Montazemi, A.R.; Qahri-Saremi, H. Factors affecting adoption of online banking: A meta-analytic structural equation modeling study. Inf. Manag. 2015, 52, 210–226. [Google Scholar] [CrossRef]
- Teo, T.S.H.; Srivastava, S.C.; Jiang, L. Trust and Electronic Government Success: An Empirical Study. J. Manag. Inf. Syst. 2008, 25, 99–132. [Google Scholar] [CrossRef]
- Bhattacherjee, A. Understanding information systems continuance: An expectation-confirmation model. MIS Q. 2001, 25, 351–370. [Google Scholar] [CrossRef]
- Hartmann, M.; Klink, J.; Simons, J. Cause related marketing in the German retail sector: Exploring the role of consumers’ trust. Food Policy 2015, 52, 108–114. [Google Scholar] [CrossRef]
- Şahin, A.; Kitapçi, H.; Zehir, C. Creating Commitment, Trust and Satisfaction for a Brand: What is the Role of Switching Costs in Mobile Phone Market? Procedia-Soc. Behav. Sci. 2013, 99, 496–502. [Google Scholar] [CrossRef] [Green Version]
- Liu, R.; Gao, Z.; Nayga, R.M.; Snell, H.A.; Ma, H. Consumers’ valuation for food traceability in China: Does trust matter? Food Policy 2019, 88, 101768. [Google Scholar] [CrossRef]
- Lassoued, R.; Hobbs, J.E. Consumer confidence in credence attributes: The role of brand trust. Food Policy 2015, 52, 99–107. [Google Scholar] [CrossRef]
- Oliver, R.L. A Cognitive Model of the Antecedents and Consequences of Satisfaction Decisions. J. Mark. Res. 1980, 17, 460–469. [Google Scholar] [CrossRef]
- Gabbott, M.; Hogg, G. An empirical investigation of the impact of non-verbal communication on service evaluation. Eur. J. Mark. 2000, 34, 384–398. [Google Scholar] [CrossRef]
- Munoz, C.; Laniado, H.; Córdoba, J. Development of a robust customer satisfaction index for domestic air journeys. Res. Transp. Bus. Manag. 2020, 100519. [Google Scholar] [CrossRef]
- Yuan, C.L.; Moon, H.; Kim, K.H.; Wang, S.; Yu, X. Third-party organization endorsement impacts on perceived value and B2B customer loyalty. Ind. Mark. Manag. 2020, 90, 221–230. [Google Scholar] [CrossRef]
- Roca, J.C.; Chiu, C.-M.; Martínez, F.J. Understanding e-learning continuance intention: An extension of the Technology Acceptance Model. Int. J. Hum.-Comput. Stud. 2006, 64, 683–696. [Google Scholar] [CrossRef] [Green Version]
- Bhattacherjee, A.; Barfar, A. Information technology continuance research: Current state and future directions. Asia Pac. J. Inf. Syst. 2011, 21, 1–18. [Google Scholar]
- Chen, S.-C.; Liu, M.-L.; Lin, C.-P. Integrating Technology Readiness into the Expectation–Confirmation Model: An Empirical Study of Mobile Services. Cyberpsychology Behav. Soc. Netw. 2013, 16, 604–612. [Google Scholar] [CrossRef] [PubMed] [Green Version]
- Wilkins, H.; Merrilees, B.; Herington, C. The Determinants of Loyalty in Hotels. J. Hosp. Mark. Manag. 2009, 19, 1–21. [Google Scholar] [CrossRef]
- Mascarello, G.; Pinto, A.; Parise, N.; Crovato, S.; Ravarotto, L. The perception of food quality. Profiling Italian consumers. Appetite 2015, 89, 175–182. [Google Scholar] [CrossRef] [PubMed]
- Wang, J.; Ge, J.; Ma, Y. Urban Chinese Consumers’ Willingness to Pay for Pork with Certified Labels: A Discrete Choice Experiment. Sustainability 2018, 10, 603. [Google Scholar] [CrossRef] [Green Version]
- Huotilainen, A.; Tuorila, H. Social representation of new foods has a stable structure based on suspicion and trust. Food Qual. Prefer. 2005, 16, 565–572. [Google Scholar] [CrossRef]
- Ronteltap, A.; van Trijp, J.C.M.; Renes, R.J.; Frewer, L.J. Consumer acceptance of technology-based food innovations: Lessons for the future of nutrigenomics. Appetite 2007, 49, 1–17. [Google Scholar] [CrossRef] [PubMed]
- Siegrist, M. Factors influencing public acceptance of innovative food technologies and products. Trends Food Sci. Technol. 2008, 19, 603–608. [Google Scholar] [CrossRef]
- McComas, K.A.; Besley, J.C.; Steinhardt, J. Factors influencing U.S. consumer support for genetic modification to prevent crop disease. Appetite 2014, 78, 8–14. [Google Scholar] [CrossRef] [PubMed]
- Stierand, M.; Dörfler, V.; MacBryde, J. Creativity and Innovation in Haute Cuisine: Towards a Systemic Model. Creat. Innov. Manag. 2014, 23, 15–28. [Google Scholar] [CrossRef] [Green Version]
- Jin, B.; Suh, Y.G. Integrating effect of consumer perception factors in predicting private brand purchase in a Korean discount store context. J. Consum. Mark. 2005, 22, 62–71. [Google Scholar] [CrossRef]
- Byker, C.; Shanks, J.; Misyak, S.; Serrano, E. Characterizing Farmers’ Market Shoppers: A Literature Review. J. Hunger Environ. Nutr. 2012, 7, 38–52. [Google Scholar] [CrossRef]
- Yu, Y.S.; Luo, M.; Zhu, D.H. The Effect of Quality Attributes on Visiting Consumers’ Patronage Intentions of Green Restaurants. Sustainability 2018, 10, 1187. [Google Scholar] [CrossRef] [Green Version]
- Wu, H.-C.; Cheng, C.-C.; Ai, C.-H. A study of experiential quality, experiential value, trust, corporate reputation, experiential satisfaction and behavioral intentions for cruise tourists: The case of Hong Kong. Tour. Manag. 2018, 66, 200–220. [Google Scholar] [CrossRef]
- Liu, Y.; Song, Y.; Sun, J.; Sun, C.; Liu, C.; Chen, X. Understanding the relationship between food experiential quality and customer dining satisfaction: A perspective on negative bias. Int. J. Hosp. Manag. 2020, 87, 102381. [Google Scholar] [CrossRef]
- Eggert, A.; Ulaga, W.; Frow, P.; Payne, A. Conceptualizing and communicating value in business markets: From value in exchange to value in use. Ind. Mark. Manag. 2018, 69, 80–90. [Google Scholar] [CrossRef]
- Lovelock, C. Services Marketing People, Technology, Strategy, 5/e; Pearson Education India: Noida, India, 2008. [Google Scholar]
- Ryu, K.; Lee, H.-R.; Kim, W.G. The influence of the quality of the physical environment, food, and service on restaurant image, customer perceived value, customer satisfaction, and behavioral intentions. Int. J. Contemp. Hosp. Manag. 2012, 24, 200–223. [Google Scholar] [CrossRef]
- Gneezy, A.; Gneezy, U.; Lauga, D.O. A Reference-Dependent Model of the Price–Quality Heuristic. J. Mark. Res. 2014, 51, 153–164. [Google Scholar] [CrossRef] [Green Version]
- Cronin, J.J.; Brady, M.K.; Hult, G.T.M. Assessing the effects of quality, value, and customer satisfaction on consumer behavioral intentions in service environments. J. Retail. 2000, 76, 193–218. [Google Scholar] [CrossRef]
- Lee, J.-H.; Im, J.-E. The effect of perceived justice on postcomplaint behavior in the internet open market-Focused on the moderating effect of fashion involvement. J. Korean Soc. Cloth. Text. 2008, 32, 1427–1437. [Google Scholar] [CrossRef]
- Laureati, M.; Jabes, D.; Russo, V.; Pagliarini, E. Sustainability and organic production: How information influences consumer’s expectation and preference for yogurt. Food Qual. Prefer. 2013, 30, 1–8. [Google Scholar] [CrossRef]
- Deliza, R.; MacFie, H.J.H. The generation of sensory expectation by external cues and its effect on sensory perception and hedonic ratings: A review. J. Sens. Stud. 1996, 11, 103–128. [Google Scholar] [CrossRef]
- Grunert, K.G.; Larsen, H.H.; Madsen, T.K.; Baadsgaard, A. Market Orientation in Food and Agriculture; Springer Science & Business Media: Berlin/Heidelberg, Germany, 1995. [Google Scholar]
- Fernandes, T.; Calamote, A. Unfairness in consumer services: Outcomes of differential treatment of new and existing clients. J. Retail. Consum. Serv. 2016, 28, 36–44. [Google Scholar] [CrossRef] [Green Version]
- Mohiuddin Babu, M.; Dey, B.L. Appraisal of the potential of the growth of e-retailer based on impact of perceived value on trust for online purchases. Strateg. Chang. 2018, 27, 477–487. [Google Scholar] [CrossRef]
- Kim, S.; Lee, J.-S. Is satisfaction enough to ensure reciprocity with upscale restaurants? The role of gratitude relative to satisfaction. Int. J. Hosp. Manag. 2013, 33, 118–128. [Google Scholar] [CrossRef]
- Chen, C.-T.; Cheng, C.-C.; Hsu, F.-S. GRSERV scale: An effective tool for measuring consumer perceptions of service quality in green restaurants. Total Qual. Manag. Bus. Excell. 2015, 26, 355–367. [Google Scholar] [CrossRef]
- Hsiao, K.-L.; Chen, C.-C. What drives smartwatch purchase intention? Perspectives from hardware, software, design, and value. Telemat. Inform. 2018, 35, 103–113. [Google Scholar] [CrossRef]
- Konuk, F.A. The influence of perceived food quality, price fairness, perceived value and satisfaction on customers’ revisit and word-of-mouth intentions towards organic food restaurants. J. Retail. Consum. Serv. 2019, 50, 103–110. [Google Scholar] [CrossRef]
- Lin, C.-P.; Tsai, Y.H.; Chiu, C.-K. Modeling Customer Loyalty from an Integrative Perspective of Self-Determination Theory and Expectation–Confirmation Theory. J. Bus. Psychol. 2009, 24, 315–326. [Google Scholar] [CrossRef]
- Jackson, D.L. Revisiting Sample Size and Number of Parameter Estimates: Some Support for the N:q Hypothesis. Struct. Equ. Modeling Multidiscip. J. 2003, 10, 128–141. [Google Scholar] [CrossRef]
- Coop. Plus d’une Personne sur Quatre Consomme Régulièrement des Alternatives Végétales. Available online: https://www.coop.ch/fr/inspirations-cadeaux/regimes-specifiques/vegetalien/report.html (accessed on 16 October 2021).
- Norusis, M.J. SPSS for Windows: Base System User’s Guide, Release 5.0; SPSS Incorporated: Chicago, IL, USA, 1992. [Google Scholar]
- Kaiser, H.F. An index of factorial simplicity. Psychometrika 1974, 39, 31–36. [Google Scholar] [CrossRef]
- Thompson, B. Exploratory and Confirmatory Factor Analysis; American Psychological Association: Washington, DC, USA, 2004. [Google Scholar]
- Anderson, J.C.; Gerbing, D.W. Structural equation modeling in practice: A review and recommended two-step approach. Psychol. Bull. 1988, 103, 411–423. [Google Scholar] [CrossRef]
- Hair, J.F.; Black, W.C.; Babin, B.J.; Anderson, R.E.; Tatham, R.L. Multivariate Data Analysis; Prentice Hall: Upper Saddle River, NJ, USA, 1998; Volume 5. [Google Scholar]
- Nunnally, J.; Jum, N.; Bernstein, I.H.; Bernstein, I. Psychometric Theory; McGraw-Hill Companies, Incorporated: New York, NY, USA, 1994. [Google Scholar]
- Fornell, C.; Larcker, D.F. Evaluating Structural Equation Models with Unobservable Variables and Measurement Error. J. Mark. Res. 2018, 18, 39–50. [Google Scholar] [CrossRef]
- Chin, W.W. Commentary: Issues and opinion on structural equation modeling. Commentary 1998, 22, 7–16. [Google Scholar]
- Hooper, D.; Coughlan, J.; Mullen, M.R. Structural equation modelling: Guidelines for determining model fit. Electron. J. Bus. Res. Methods 2008, 6, 53–60. [Google Scholar]
- Jackson, D.L.; Gillaspy, J.A., Jr.; Purc-Stephenson, R. Reporting practices in confirmatory factor analysis: An overview and some recommendations. Psychol. Methods 2009, 14, 6. [Google Scholar] [CrossRef]
- Kline, R.B. Principles and Practice of Structural Equation Modeling, 4th ed.; Guilford Publications: New York, NY, USA, 2015. [Google Scholar]
- Whittaker, T.A. A Beginner’s Guide to Structural Equation Modeling; Taylor & Francis: Abingdon, UK, 2011. [Google Scholar]
- Hu, L.t.; Bentler, P.M. Cutoff criteria for fit indexes in covariance structure analysis: Conventional criteria versus new alternatives. Struct. Equ. Modeling Multidiscip. J. 1999, 6, 1–55. [Google Scholar] [CrossRef]
- Fu, X.-M.; Zhang, J.-H.; Chan, F.T. Determinants of loyalty to public transit: A model integrating Satisfaction-Loyalty Theory and Expectation-Confirmation Theory. Transp. Res. Part A Policy Pract. 2018, 113, 476–490. [Google Scholar] [CrossRef]
- Jiang, Y.; Lau, A.K. Roles of consumer trust and risks on continuance intention in the sharing economy: An empirical investigation. Electron. Commer. Res. Appl. 2021, 47, 101050. [Google Scholar] [CrossRef]
- Al-Ansi, A.; Olya, H.G.; Han, H. Effect of general risk on trust, satisfaction, and recommendation intention for halal food. Int. J. Hosp. Manag. 2019, 83, 210–219. [Google Scholar] [CrossRef]
- Wang, C.; Teo, T.S.; Liu, L. Perceived value and continuance intention in mobile government service in China. Telemat. Inform. 2020, 48, 101348. [Google Scholar] [CrossRef]
- Lee, H.; Kim, J.; Kim, J. Determinants of success for application service provider: An empirical test in small businesses. Int. J. Hum.-Comput. Stud. 2007, 65, 796–815. [Google Scholar] [CrossRef]
- Muskat, B.; Hörtnagl, T.; Prayag, G.; Wagner, S. Perceived quality, authenticity, and price in tourists’ dining experiences: Testing competing models of satisfaction and behavioral intentions. J. Vacat. Mark. 2019, 25, 480–498. [Google Scholar] [CrossRef] [Green Version]
- Viljoen, A.; Kruger, M. The “art” of creative food experiences: A dimension-based typology. Int. J. Gastron. Food Sci. 2020, 21, 100239. [Google Scholar] [CrossRef]
- Alaimo, L.S.; Fiore, M.; Galati, A. How the COVID-19 pandemic is changing online food shopping human behaviour in Italy. Sustainability 2020, 12, 9594. [Google Scholar] [CrossRef]
- Wang, E.S.-T. Impact of multiple perceived value on consumers’ brand preference and purchase intention: A case of snack foods. J. Food Prod. Mark. 2010, 16, 386–397. [Google Scholar] [CrossRef]
- Bo, L.X.; Lee, A.S.H. An extended expectation confirmation model of continuance intention to use online food delivery services in Asia country. In Proceedings of the 5th International Conference on E-Commerce, E-Business and E-Government, Rome, Italy, 28–30 April 2021; pp. 49–52. [Google Scholar]
- Motoki, K.; Park, J.; Spence, C.; Velasco, C. Contextual acceptance of novel and unfamiliar foods: Insects, cultured meat, plant-based meat alternatives, and 3D printed foods. Food Qual. Prefer. 2022, 96, 104368. [Google Scholar] [CrossRef]
- Lupton, D.; Turner, B. Food of the future? Consumer responses to the idea of 3D-printed meat and insect-based foods. Food Foodways 2018, 26, 269–289. [Google Scholar] [CrossRef]
- Kitz, R.; Walker, T.; Charlebois, S.; Music, J. Food packaging during the COVID-19 pandemic: Consumer perceptions. Int. J. Consum. Stud. 2022, 46, 434–448. [Google Scholar] [CrossRef] [PubMed]
- Akbari, M.; Gholizadeh, M.H.; Zomorrodi, M. Islamic symbols in food packaging and purchase intention of Muslim consumers. J. Islamic Mark. 2018, 9, 113–131. [Google Scholar] [CrossRef]
- Ardoin, R.; Prinyawiwatkul, W. Consumer perceptions of insect consumption: A review of western research since 2015. Int. J. Food Sci. Technol. 2021, 56, 4942–4958. [Google Scholar] [CrossRef]
- Koluman, N.; Kutlu, H.R.; Güney, İ. Climate Change and Animal Farming. Clim. Chang. Impacts Basin Agro-Ecosyst. 2018, 18, 223. [Google Scholar]


| Research Variable | Operability Definition | Code | Questions | Reference Scale |
|---|---|---|---|---|
| Continuance intention | Consumers’ subjective perception of the likelihood of continuing to consume alternative foods in the future. | CI1 | I intend to consume alternative foods continuously, not just occasionally. | [18] |
| CI2 | In the future, I intend to consume alternative foods more frequently. | |||
| CI3 | I’ll recommend alternative foods to my friends. | |||
| Trust | The level of trust consumers have after consuming alternative foods | TR1 | Alternative foods are credible in my opinion. | [52,53] |
| TR2 | Alternative foods are reliable in my opinion. | |||
| TR3 | The alternative food meets my expectations. | |||
| TR4 | Alternative foods can replace traditional foods, in my opinion. | |||
| Satisfaction | Relative relationship between consumers’ actual feelings before and after consuming the alternative food. | SAT1 | I am satisfied with the alternative foods. | [52,54] |
| SAT2 | My payment was better than I expected. | |||
| SAT3 | There is nothing wrong with eating alternative foods. | |||
| Food innovation quality | Consumer perceptions of innovative alternative foods to traditional foods. | FIQ1 | I find alternative foods to be innovative. | [54,55] |
| FIQ2 | In my opinion, alternative foods are fresh and tasty. | |||
| FIQ3 | The quality of the alternative food innovations is high on every visit, in my opinion. | |||
| Perceived value | Consumers’ perceptions of the benefits of alternative foods in comparison to their costs. | PV1 | Alternate food is a worthwhile investment. | [56,57] |
| PV2 | The alternative food is well worth the price that I pay. | |||
| PV3 | Alternative foods are of great value to me. | |||
| Expectation | Consumer experience predicts the availability of alternative foods. | EXP1 | I anticipate the alternative food will offer good value for the price I pay. | [58] |
| EXP2 | In my opinion, alternative foods should be of equal quality to regular foods. | |||
| EXP3 | Alternative foods are expected to be delicious. |
| Sample | Category | Number | Percentage (%) |
|---|---|---|---|
| Gender | Male | 209 | 42.92 |
| Female | 278 | 57.08 | |
| Age | Under 20 | 40 | 8.21 |
| 21–30 years old | 225 | 46.20 | |
| 31–40 years old | 95 | 19.51 | |
| 41–50 years old | 102 | 20.94 | |
| Over 51 | 25 | 5.13 | |
| Monthly Income (RMB) | Under 4000 | 83 | 17.04 |
| 4001–6000 | 183 | 37.58 | |
| 6001–12,000 | 68 | 13.96 | |
| 12,001–18,000 | 76 | 15.61 | |
| 18,001–24,000 | 51 | 10.47 | |
| Over 24,001 | 26 | 5.34 | |
| Education Level | Junior high school or lower | 93 | 19.10 |
| Secondary school or high school | 201 | 41.27 | |
| Undergraduate or college | 146 | 29.98 | |
| Graduate and above | 47 | 9.65 | |
| Marital status | Married | 393 | 80.70 |
| Unmarried | 94 | 19.30 | |
| Profession | Manufacturing | 135 | 27.72 |
| Medical Industry | 132 | 27.10 | |
| Financial Industry | 88 | 18.07 | |
| Design Industry | 67 | 13.76 | |
| Service Industry | 65 | 13.35 | |
| How do you feel about alternative foods | Very Good | 227 | 46.61 |
| Just so so | 222 | 45.59 | |
| Not Good | 38 | 7.80 |
| Construct | Item | Cronbach’s α after Deletion | Component | |||||
|---|---|---|---|---|---|---|---|---|
| 1 | 2 | 3 | 4 | 5 | 6 | |||
| Trust α = 0.922 | TRU1 | 0.892 | 0.827 | |||||
| TRU2 | 0.896 | 0.826 | ||||||
| TRU3 | 0.900 | 0.848 | ||||||
| TRU4 | 0.906 | 0.797 | ||||||
| Expectation α = 0.894 | EXP1 | 0.861 | 0.836 | |||||
| EXP2 | 0.821 | 0.865 | ||||||
| EXP3 | 0.862 | 0.805 | ||||||
| Satisfaction α = 0.878 | SAT1 | 0.816 | 0.882 | |||||
| SAT2 | 0.795 | 0.890 | ||||||
| SAT3 | 0.866 | 0.814 | ||||||
| Continuance intention α = 0.913 | CI1 | 0.870 | 0.819 | |||||
| CI2 | 0.868 | 0.830 | ||||||
| CI3 | 0.886 | 0.838 | ||||||
| Food Innovation Quality α = 0.876 | FIQ1 | 0.825 | 0.842 | |||||
| FIQ2 | 0.782 | 0.864 | ||||||
| FIQ3 | 0.865 | 0.786 | ||||||
| Perceived Value α = 0.871 | PV1 | 0.811 | 0.881 | |||||
| PV2 | 0.805 | 0.885 | ||||||
| PV3 | 0.837 | 0.861 | ||||||
| Eigenvalue | 3.227 | 2.489 | 2.474 | 2.474 | 2.447 | 2.431 | ||
| Variance explanation after rotation by each factor | 16.982 | 13.102 | 13.022 | 13.021 | 12.877 | 12.794 | ||
| Total explained variance% | 81.798 | |||||||
| KMO and Bartlett’s Test | ||||||||
| Kaiser-Meyer-Olkin value | 0.890 | |||||||
| Bartlett’s sphere test | The approximate chi-square | 6421.990 | ||||||
| df. | 171 | |||||||
| Significance | 0.000 | |||||||
| Construct | Item | Factor Loading | S.E. | t | p | CR | AVE |
|---|---|---|---|---|---|---|---|
| EXP | EXP1 | 0.839 | 0.895 | 0.741 | |||
| EXP2 | 0.893 | 0.048 | 23.56 | 0.000 | |||
| EXP3 | 0.849 | 0.045 | 22.258 | 0.000 | |||
| FIQ | FIQ1 | 0.841 | 0.880 | 0.710 | |||
| FIQ2 | 0.898 | 0.052 | 22.67 | 0.000 | |||
| FIQ3 | 0.785 | 0.049 | 19.692 | 0.000 | |||
| PV | PV1 | 0.841 | 0.872 | 0.695 | |||
| PV2 | 0.858 | 0.055 | 20.357 | 0.000 | |||
| PV3 | 0.801 | 0.048 | 19.315 | 0.000 | |||
| SAT | SAT1 | 0.854 | 0.880 | 0.710 | |||
| SAT2 | 0.886 | 0.047 | 22.176 | 0.000 | |||
| SAT3 | 0.784 | 0.045 | 19.722 | 0.000 | |||
| TRU | TRU1 | 0.887 | 0.922 | 0.748 | |||
| TRU2 | 0.875 | 0.035 | 26.884 | 0.000 | |||
| TRU3 | 0.855 | 0.037 | 25.678 | 0.000 | |||
| TRU4 | 0.842 | 0.037 | 24.961 | 0.000 | |||
| CI | CI1 | 0.894 | 0.913 | 0.777 | |||
| CI2 | 0.892 | 0.037 | 27.496 | 0.000 | |||
| CI3 | 0.858 | 0.037 | 25.767 | 0.000 |
| EXP | FIQ | PV | SAT | TRU | CI | |
|---|---|---|---|---|---|---|
| EXP | 0.860 | |||||
| FIQ | 0.450 | 0.842 | ||||
| PV | 0.299 | 0.239 | 0.833 | |||
| SAT | 0.297 | 0.316 | 0.176 | 0.842 | ||
| TRU | 0.509 | 0.584 | 0.405 | 0.549 | 0.864 | |
| CI | 0.625 | 0.480 | 0.433 | 0.308 | 0.228 | 0.881 |
| Indicators | Norm | Results | Judgment |
|---|---|---|---|
| ML chi-square (MLχ2) | The small the better | 183.943 | |
| Degrees of Freedom (DF) | The large the better | 137 | |
| Normed Chi-square (χ2/DF) | 1 < χ2/DF < 5 | 1.343 | Yes |
| Root Mean Square Error Approximation (RMSEA) | <0.08 | 0.027 | Yes |
| Standardized Root Mean Square Residual (SRMR) | <0.08 | 0.030 | Yes |
| Tucker-Lewis Index (TLI) | >0.9 | 0.991 | Yes |
| Comparative Fit Index (CFI) | >0.9 | 0.993 | Yes |
| Normative Fit Index (NFI) | >0.9 | 0.972 | Yes |
| Goodness of Fit Index (GFI) | >0.8 | 0.962 | Yes |
| Parsimony Goodness of Fit Index (PGFI) | >0.5 | 0.694 | Yes |
| Parsimony Normed Fit Index (PNFI) | >0.5 | 0.779 | Yes |
| Incremental Fit Index (IFI) | >0.9 | 0.993 | Yes |
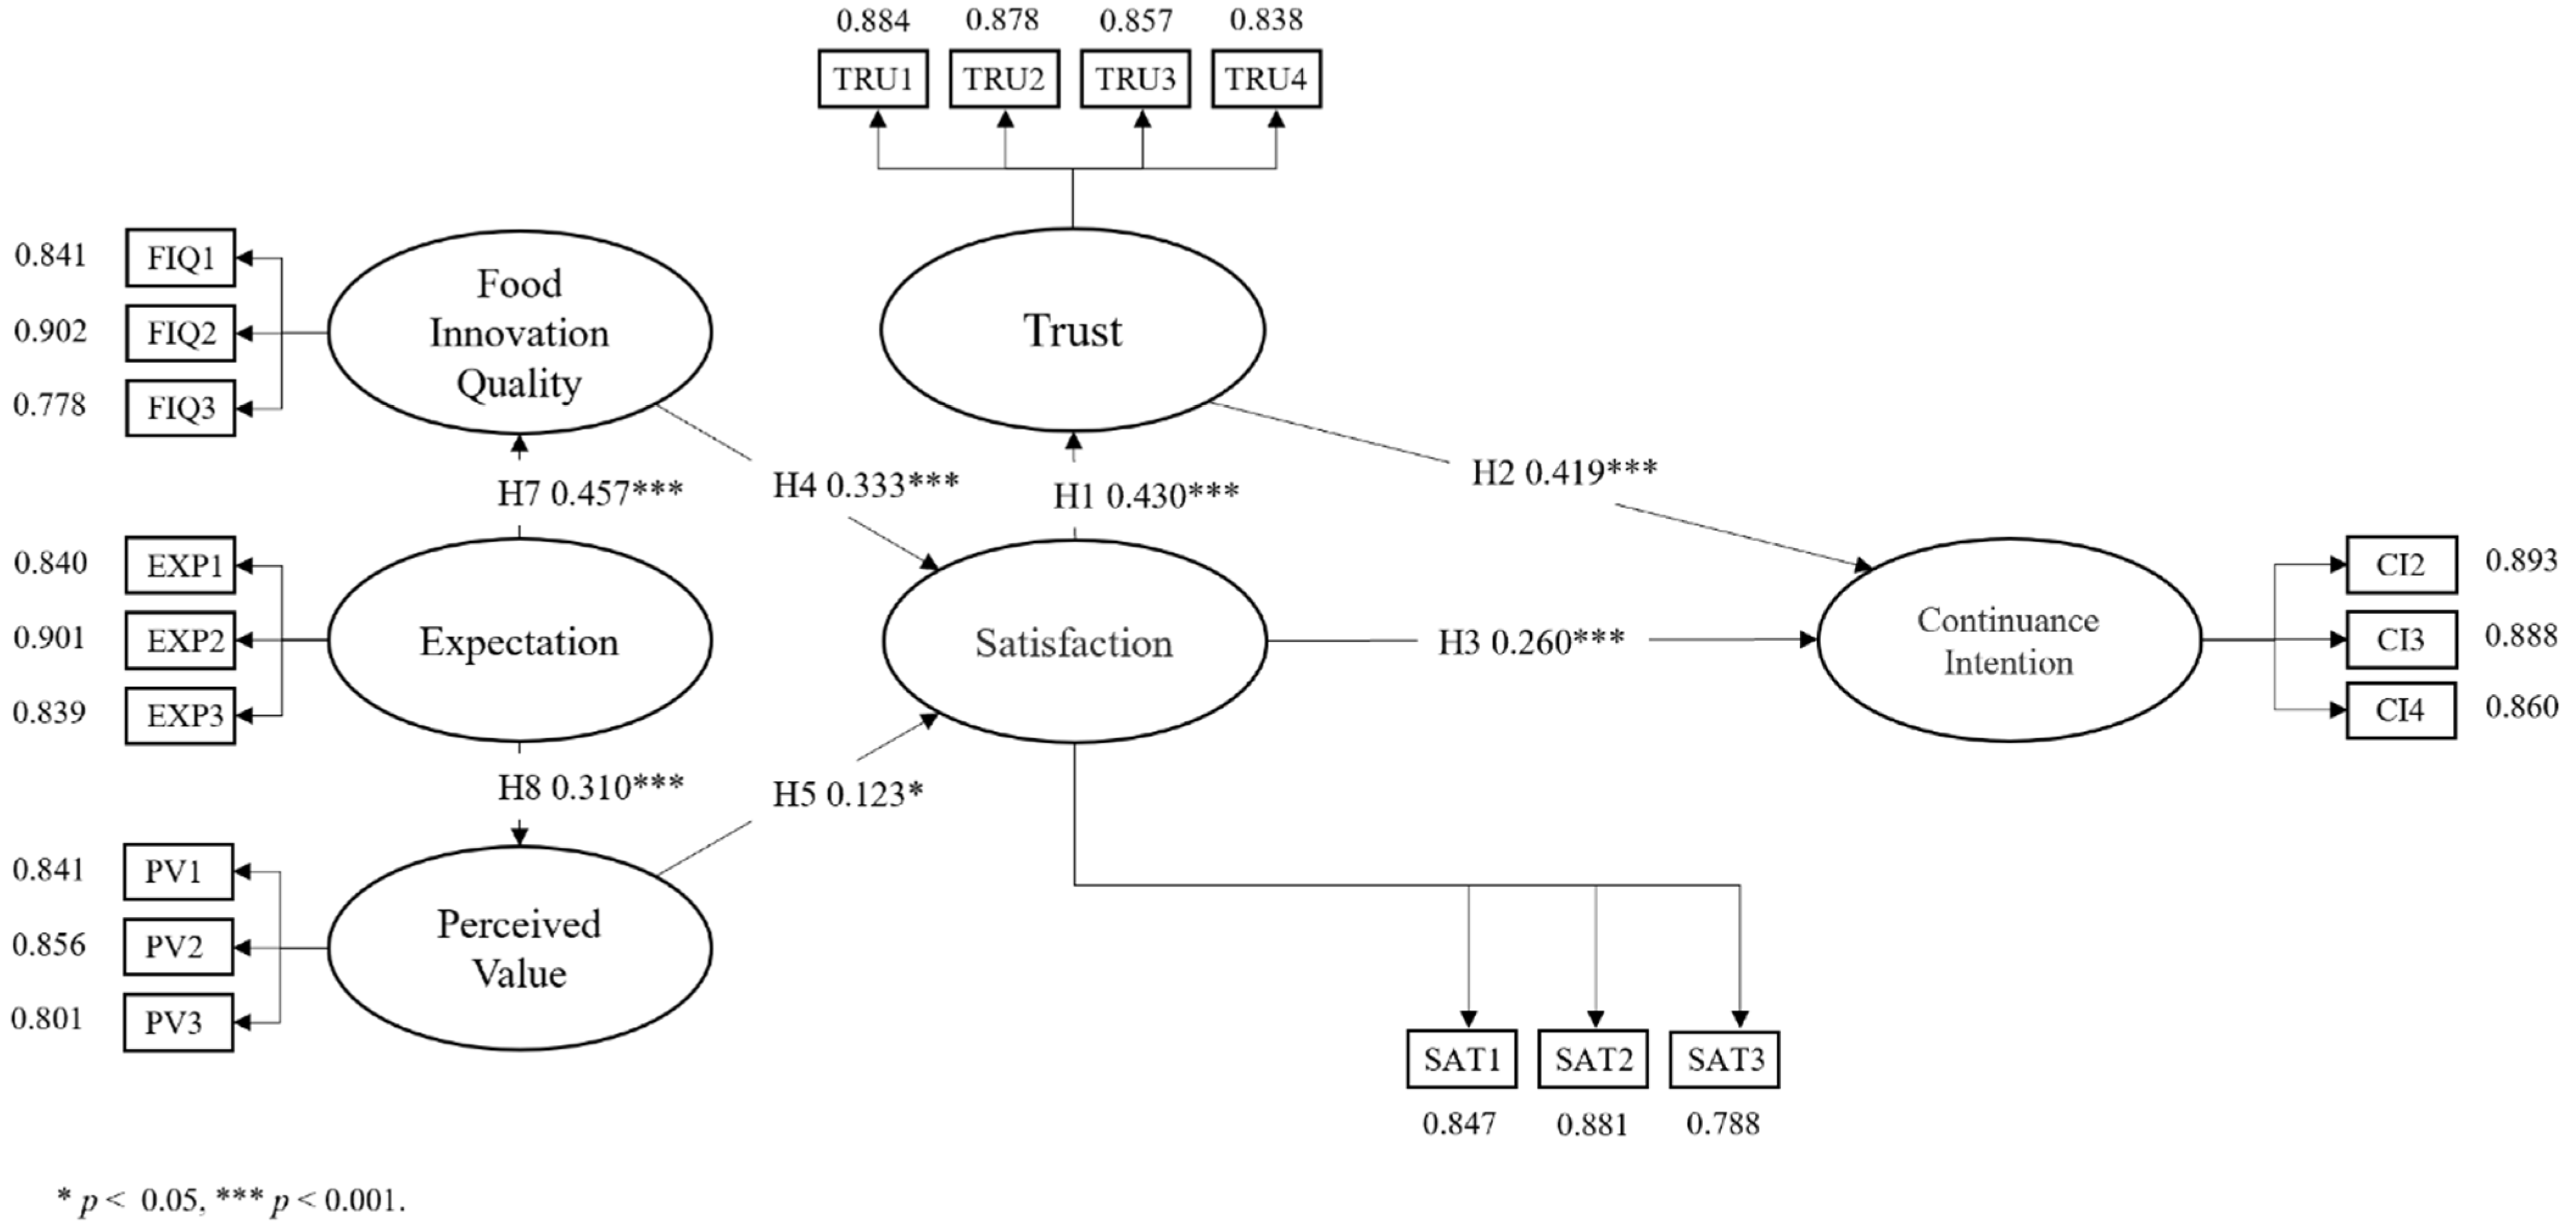
| Hypothesis | DV | IV | Unstd | S.E. | Unstd/S.E. | p-Value | Std. | Results |
|---|---|---|---|---|---|---|---|---|
| H1 | TRU | SAT | 0.537 | 0.061 | 8.843 | 0.000 | 0.430 | Support |
| H2 | CI | TRU | 0.391 | 0.045 | 8.647 | 0.000 | 0.419 | Support |
| H3 | CI | SAT | 0.303 | 0.057 | 5.282 | 0.000 | 0.260 | Support |
| H4 | SAT | FIQ | 0.364 | 0.055 | 6.600 | 0.000 | 0.333 | Support |
| H5 | SAT | PV | 0.133 | 0.054 | 2.484 | 0.013 | 0.123 | Support |
| H6 | CI | PV | 0.092 | 0.055 | 1.692 | 0.091 | 0.073 | nonsupport |
| H7 | FIQ | EXP | 0.404 | 0.044 | 9.178 | 0.000 | 0.457 | Support |
| H8 | PV | EXP | 0.277 | 0.045 | 6.134 | 0.000 | 0.310 | Support |
Publisher’s Note: MDPI stays neutral with regard to jurisdictional claims in published maps and institutional affiliations. |
© 2022 by the authors. Licensee MDPI, Basel, Switzerland. This article is an open access article distributed under the terms and conditions of the Creative Commons Attribution (CC BY) license (https://creativecommons.org/licenses/by/4.0/).
Share and Cite
Yang, C.; Chen, X.; Sun, J.; Gu, C. The Impact of Alternative Foods on Consumers’ Continuance Intention from an Innovation Perspective. Foods 2022, 11, 1167. https://doi.org/10.3390/foods11081167
Yang C, Chen X, Sun J, Gu C. The Impact of Alternative Foods on Consumers’ Continuance Intention from an Innovation Perspective. Foods. 2022; 11(8):1167. https://doi.org/10.3390/foods11081167
Chicago/Turabian StyleYang, Chun, Xuqi Chen, Jie Sun, and Chao Gu. 2022. "The Impact of Alternative Foods on Consumers’ Continuance Intention from an Innovation Perspective" Foods 11, no. 8: 1167. https://doi.org/10.3390/foods11081167
APA StyleYang, C., Chen, X., Sun, J., & Gu, C. (2022). The Impact of Alternative Foods on Consumers’ Continuance Intention from an Innovation Perspective. Foods, 11(8), 1167. https://doi.org/10.3390/foods11081167