
Linking Categorical and Dimensional Approaches to Assess Food-Related Emotions

 ,
,  , and
, and
Abstract
:
1. Introduction
1.1. Categorical and Dimensional Food-Elicited Emotion Assessment
1.2. Related Work
1.3. Linking the Different Approaches
2. Methods and Procedures
2.1. Overview of the Approach
2.2. Participants
2.3. Stimuli
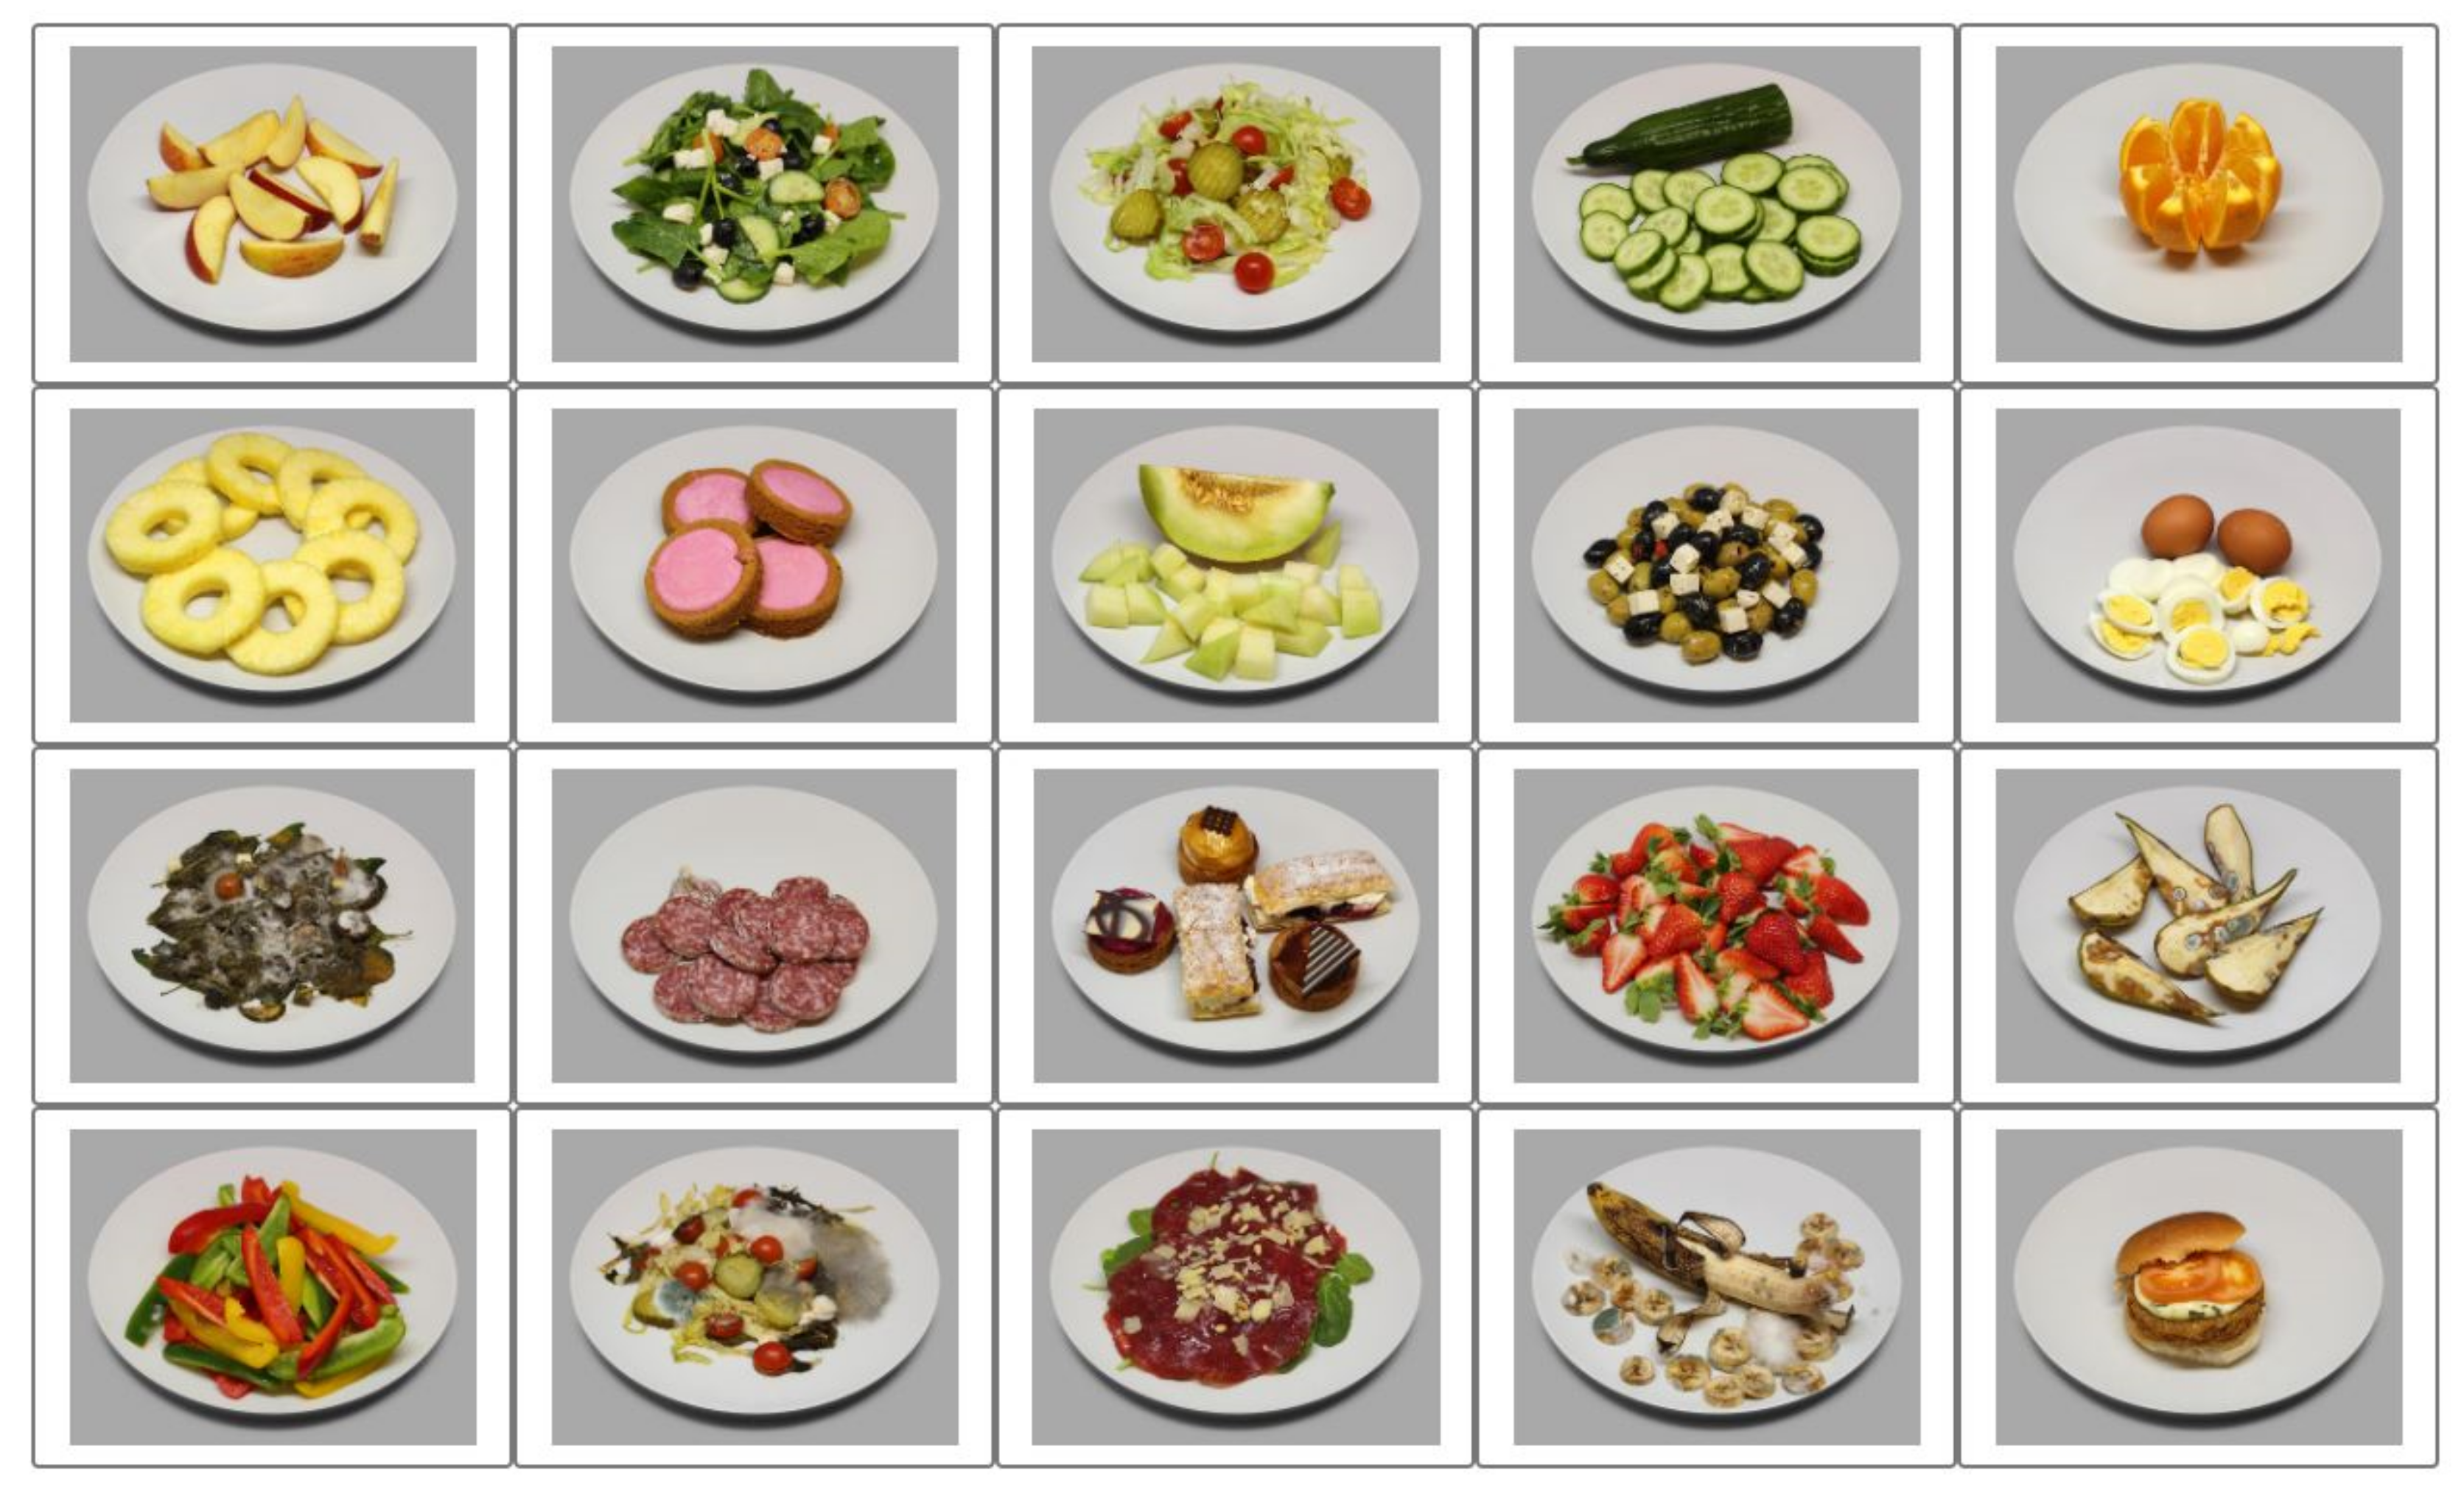
2.3.1. Food Images
2.3.2. Emotion Terms
2.4. Measures
2.4.1. Demographics
2.4.2. Valence and Arousal
2.5. Data Analysis
2.6. Procedure
2.6.1. Task I: Image2Grid
2.6.2. Task II: Image2Label
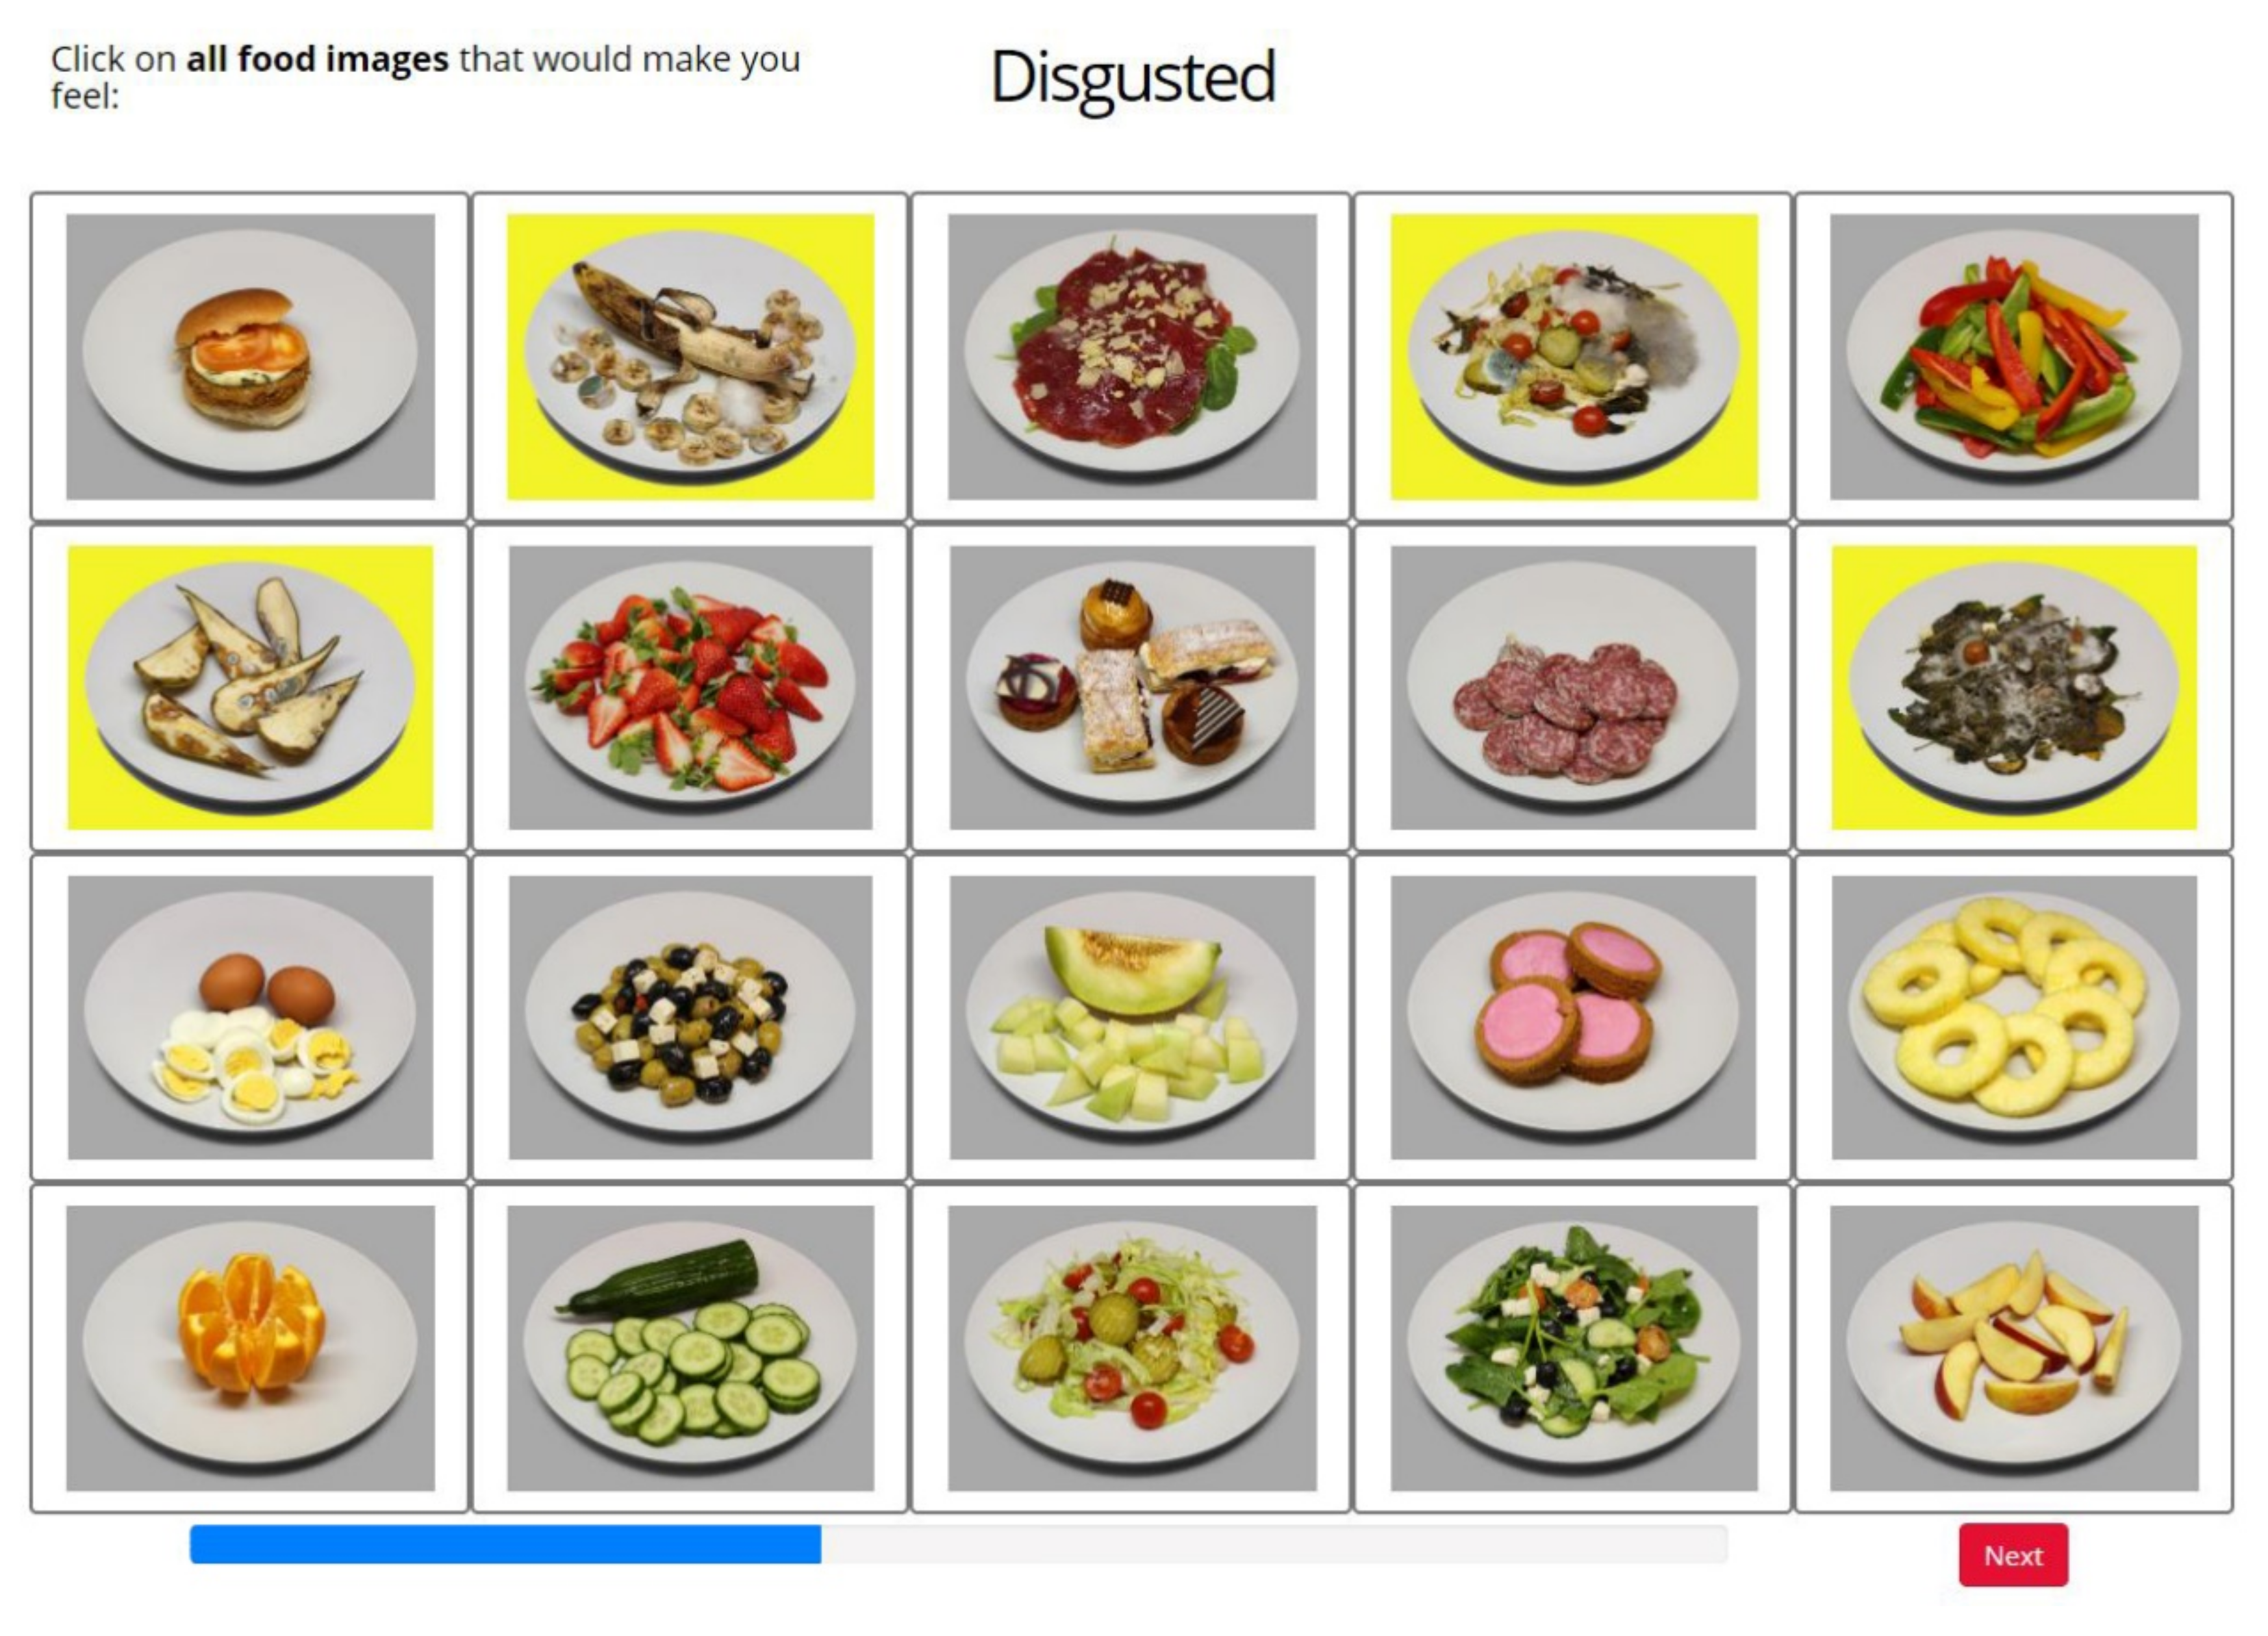
2.6.3. Task III: Label2Image
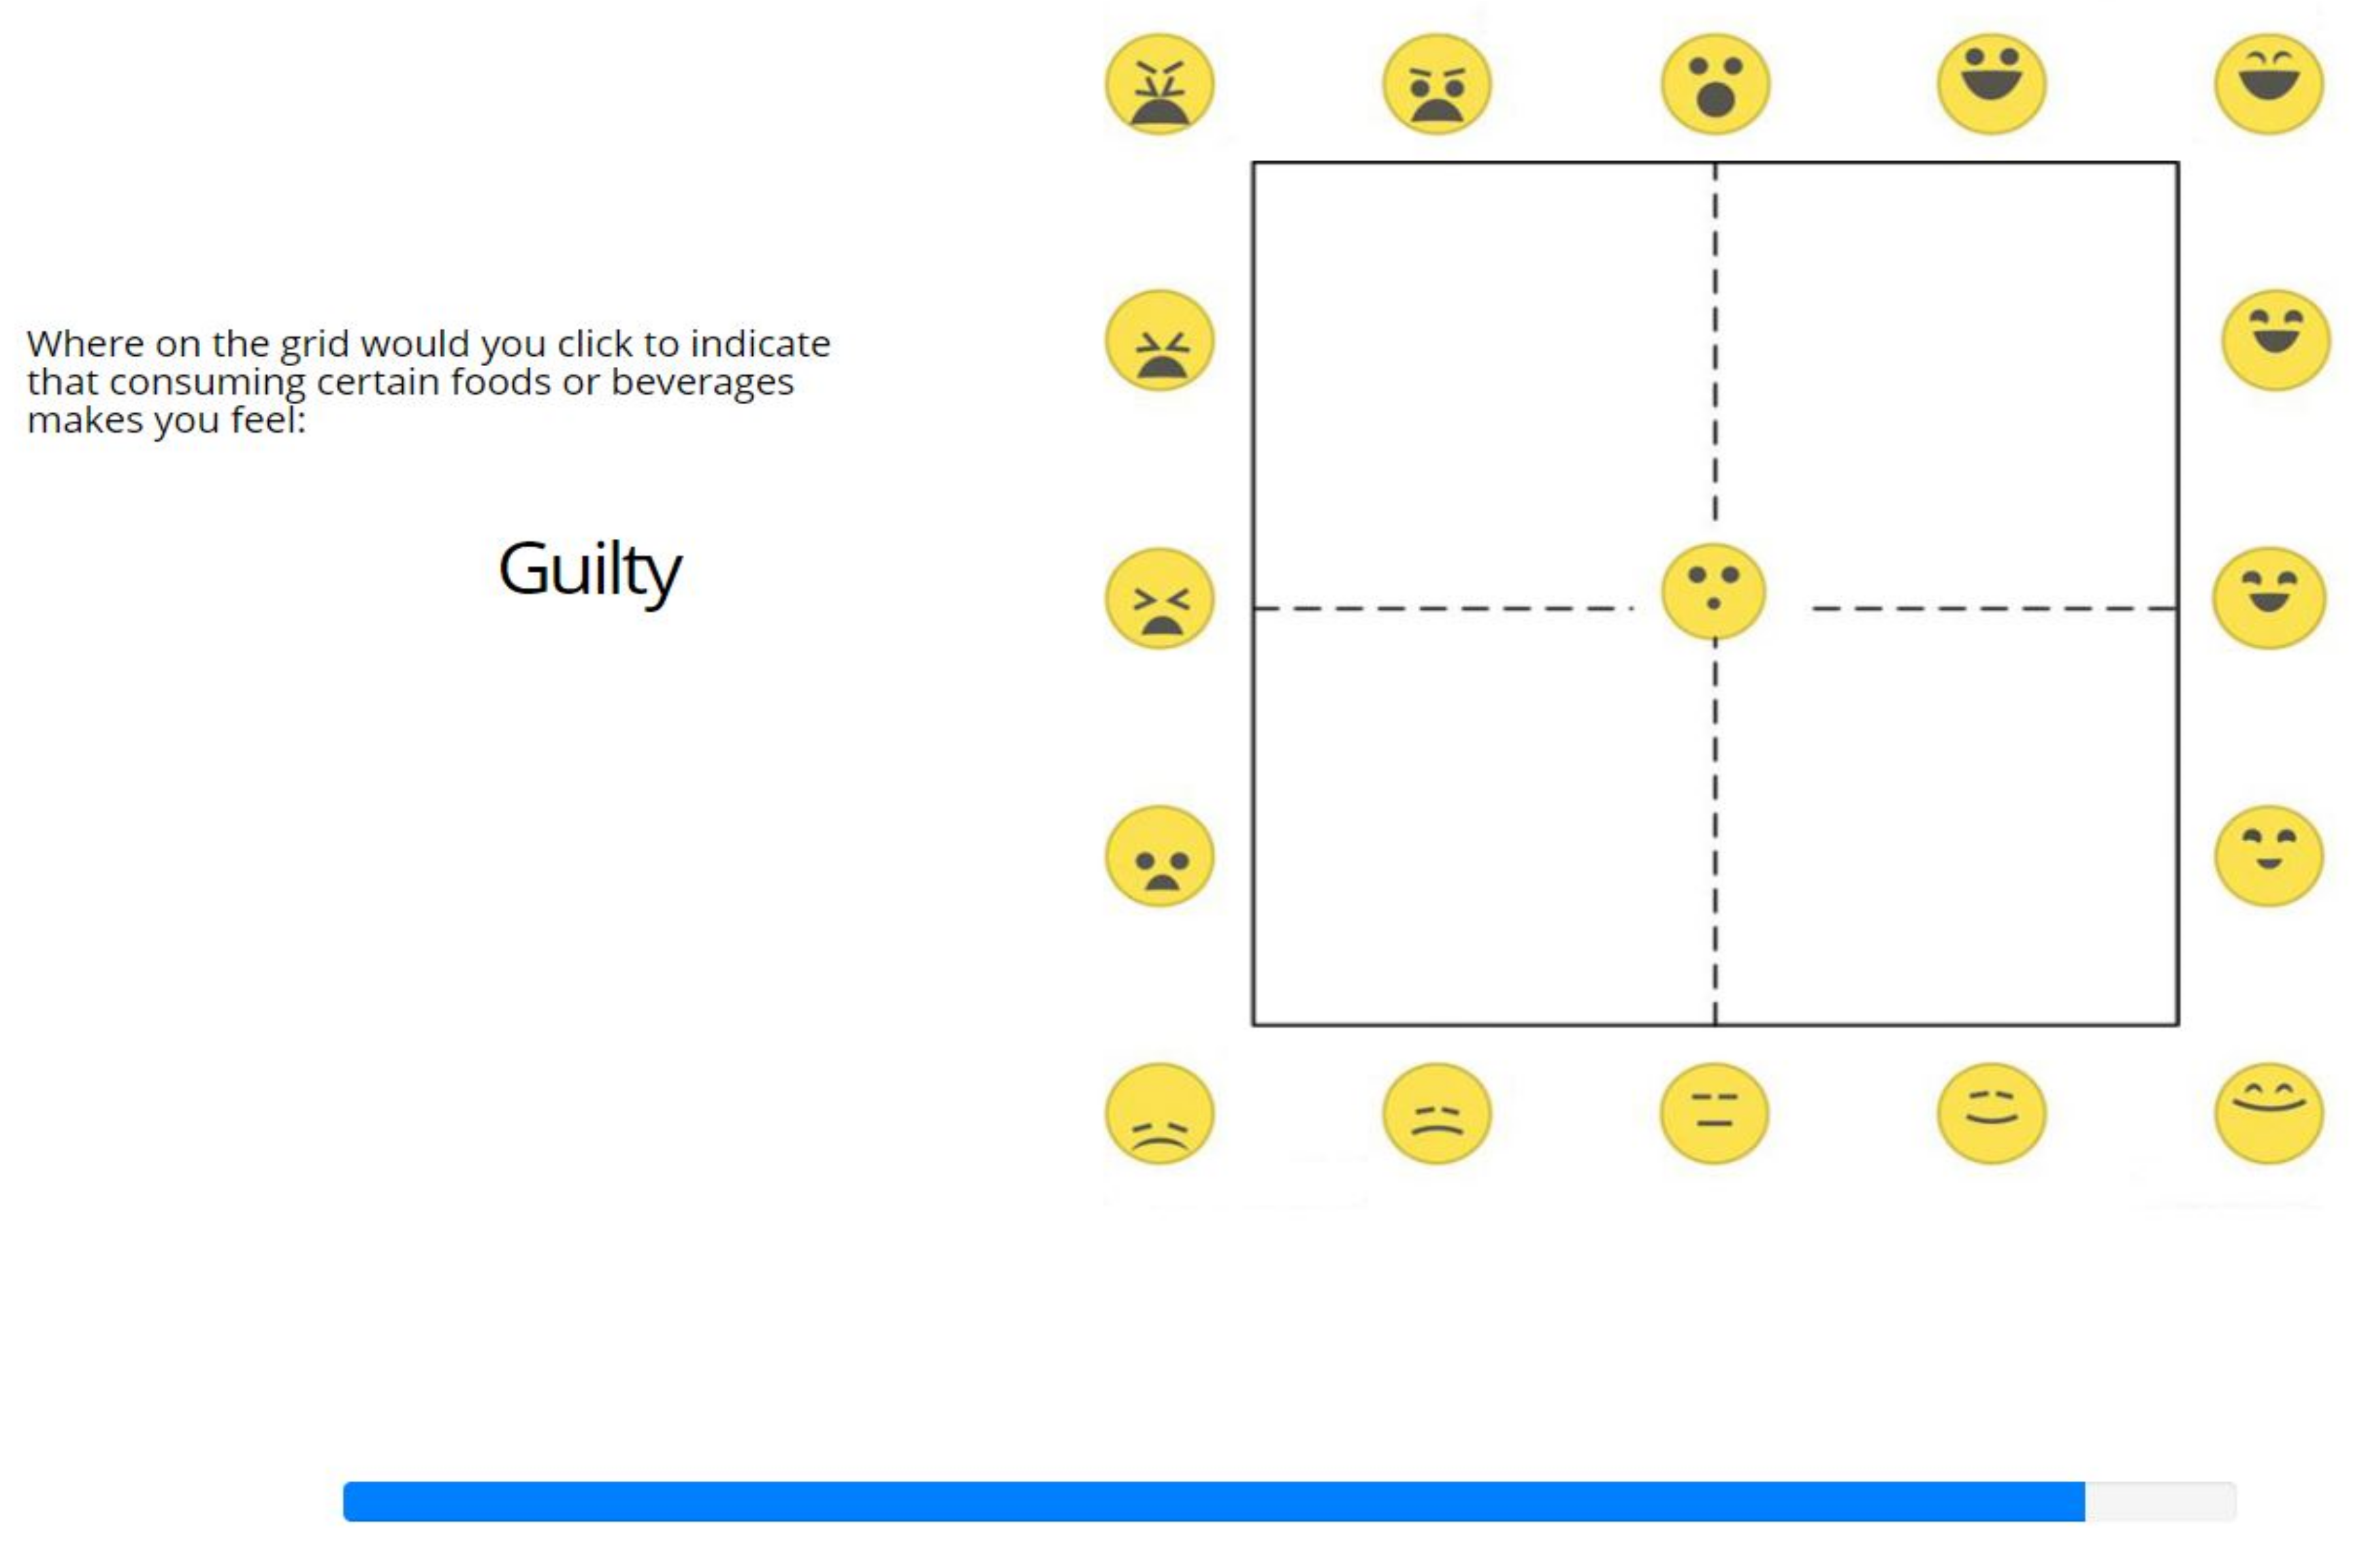
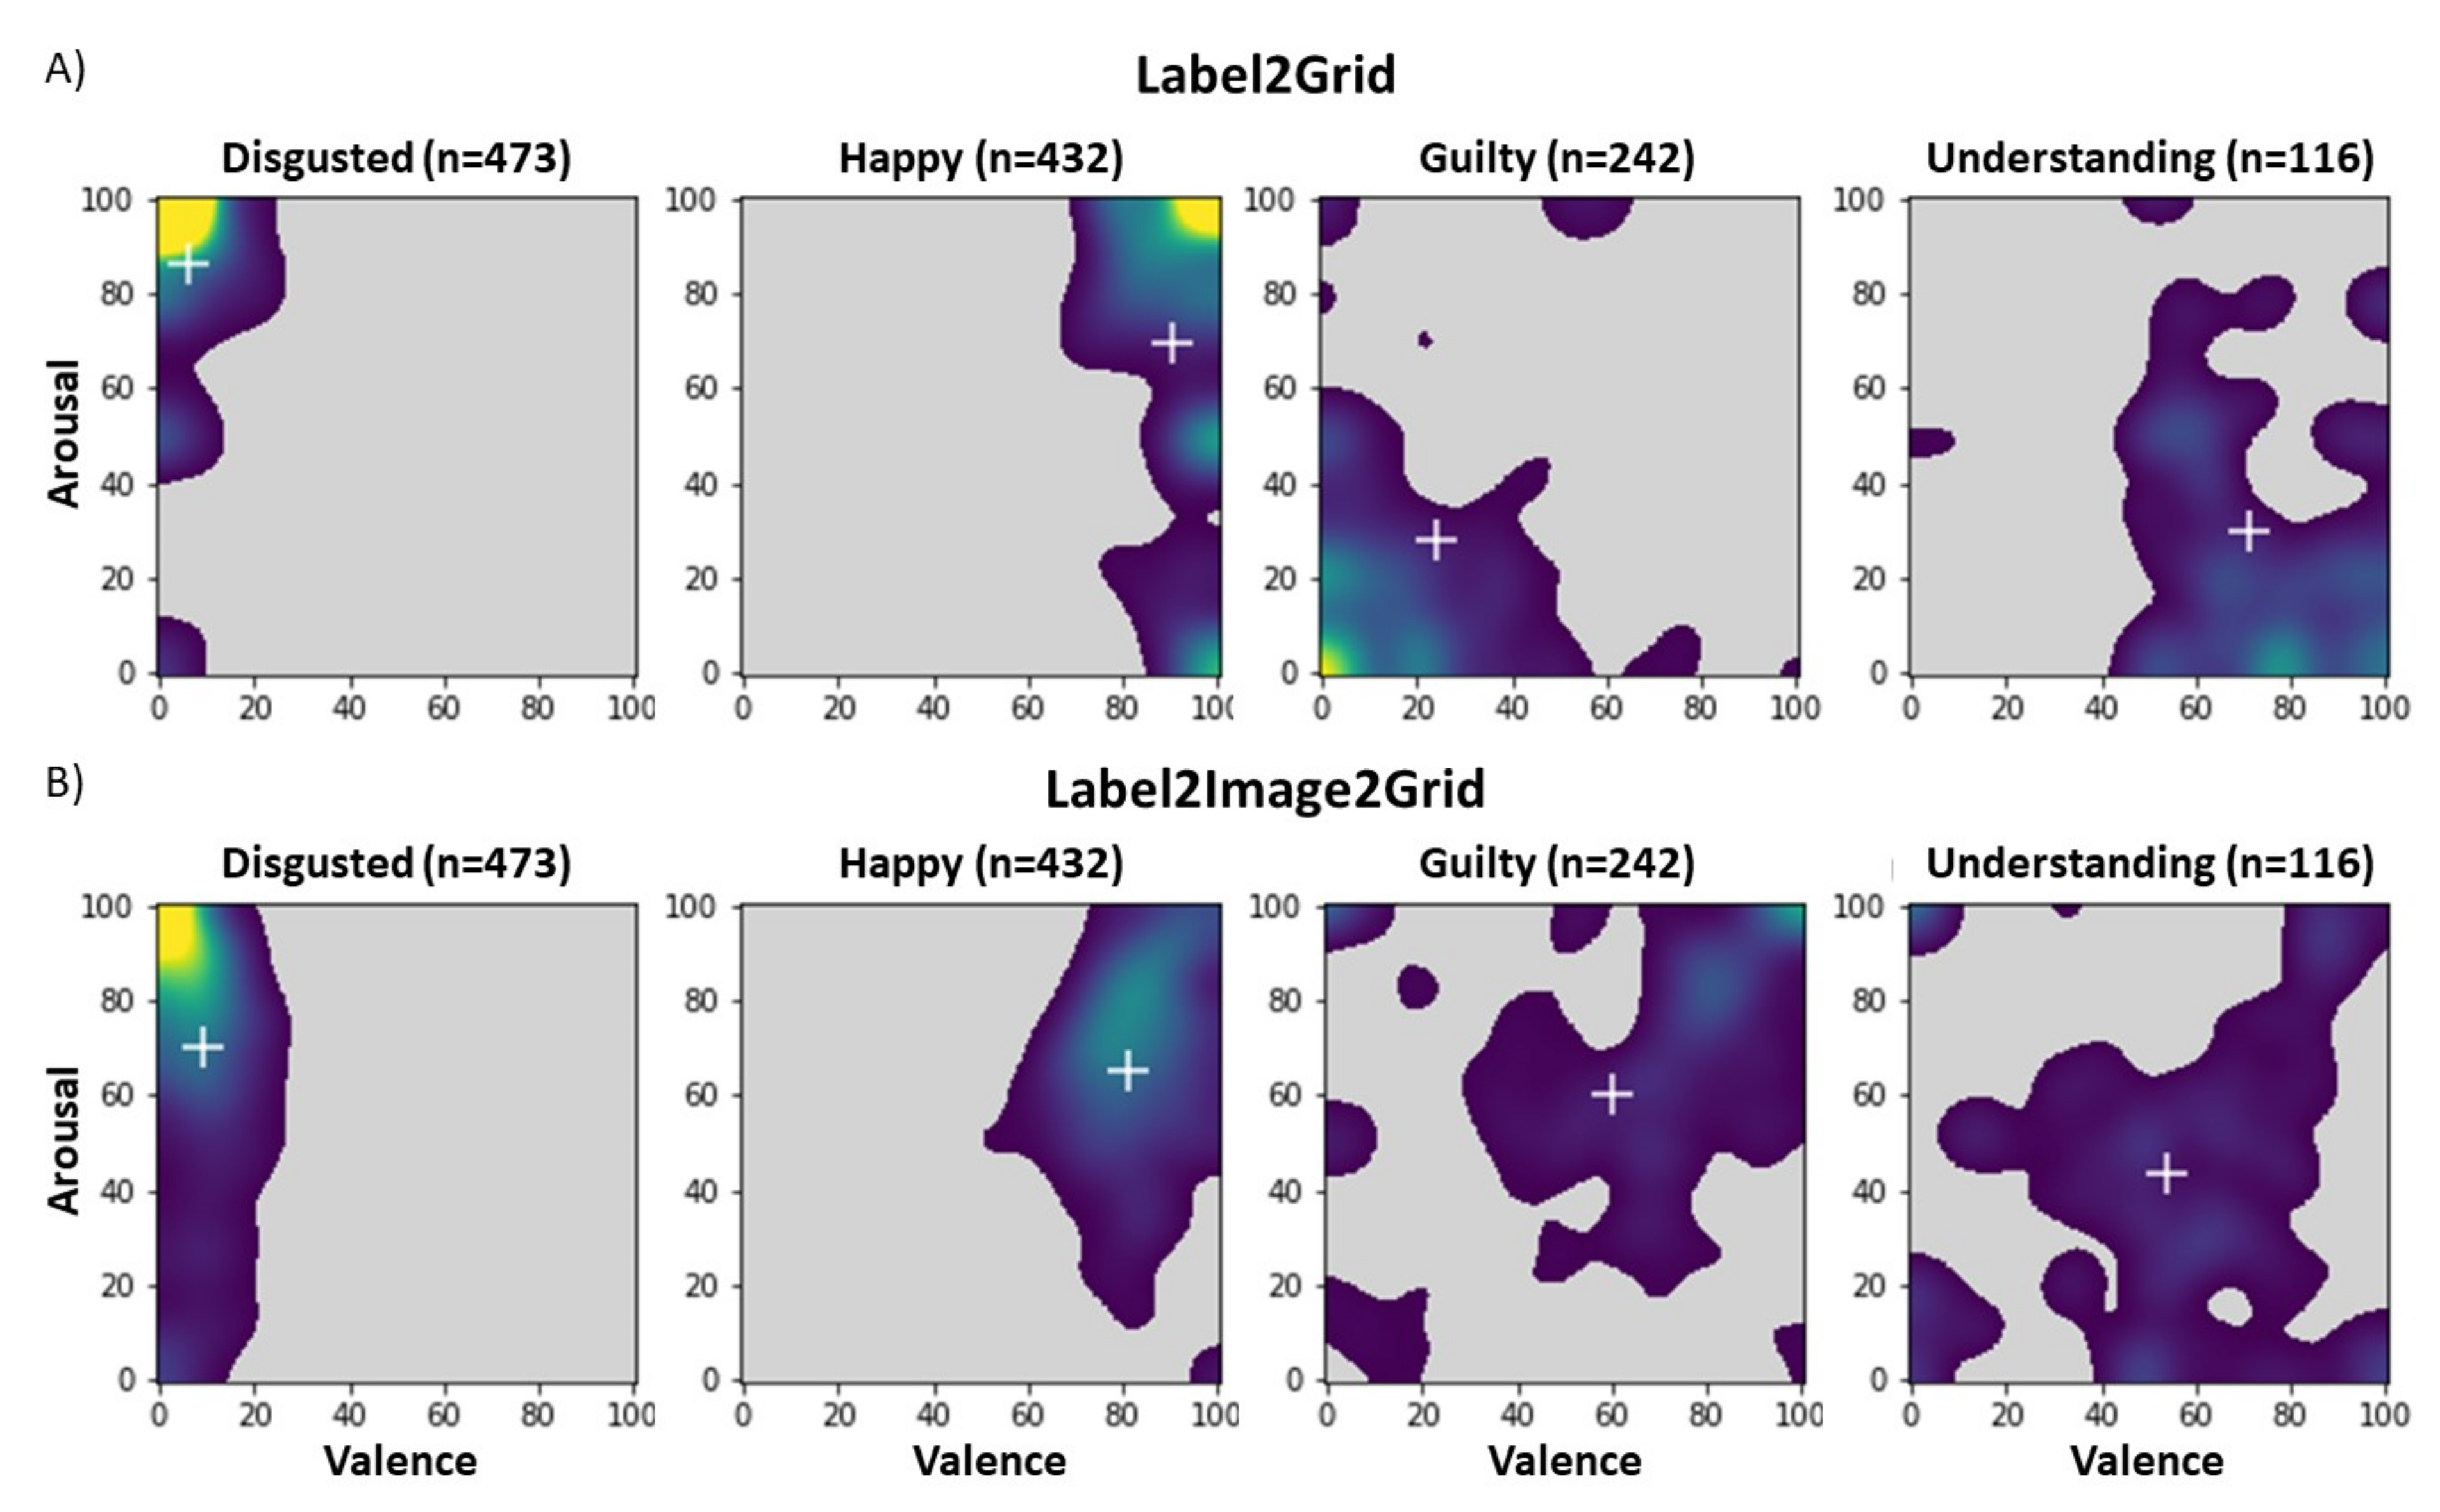
2.6.4. Task IV: Label2Grid
3. Results
3.1. Task I: Image2Grid
3.2. Task II: Image2Label
3.3. Task III: Label2Image
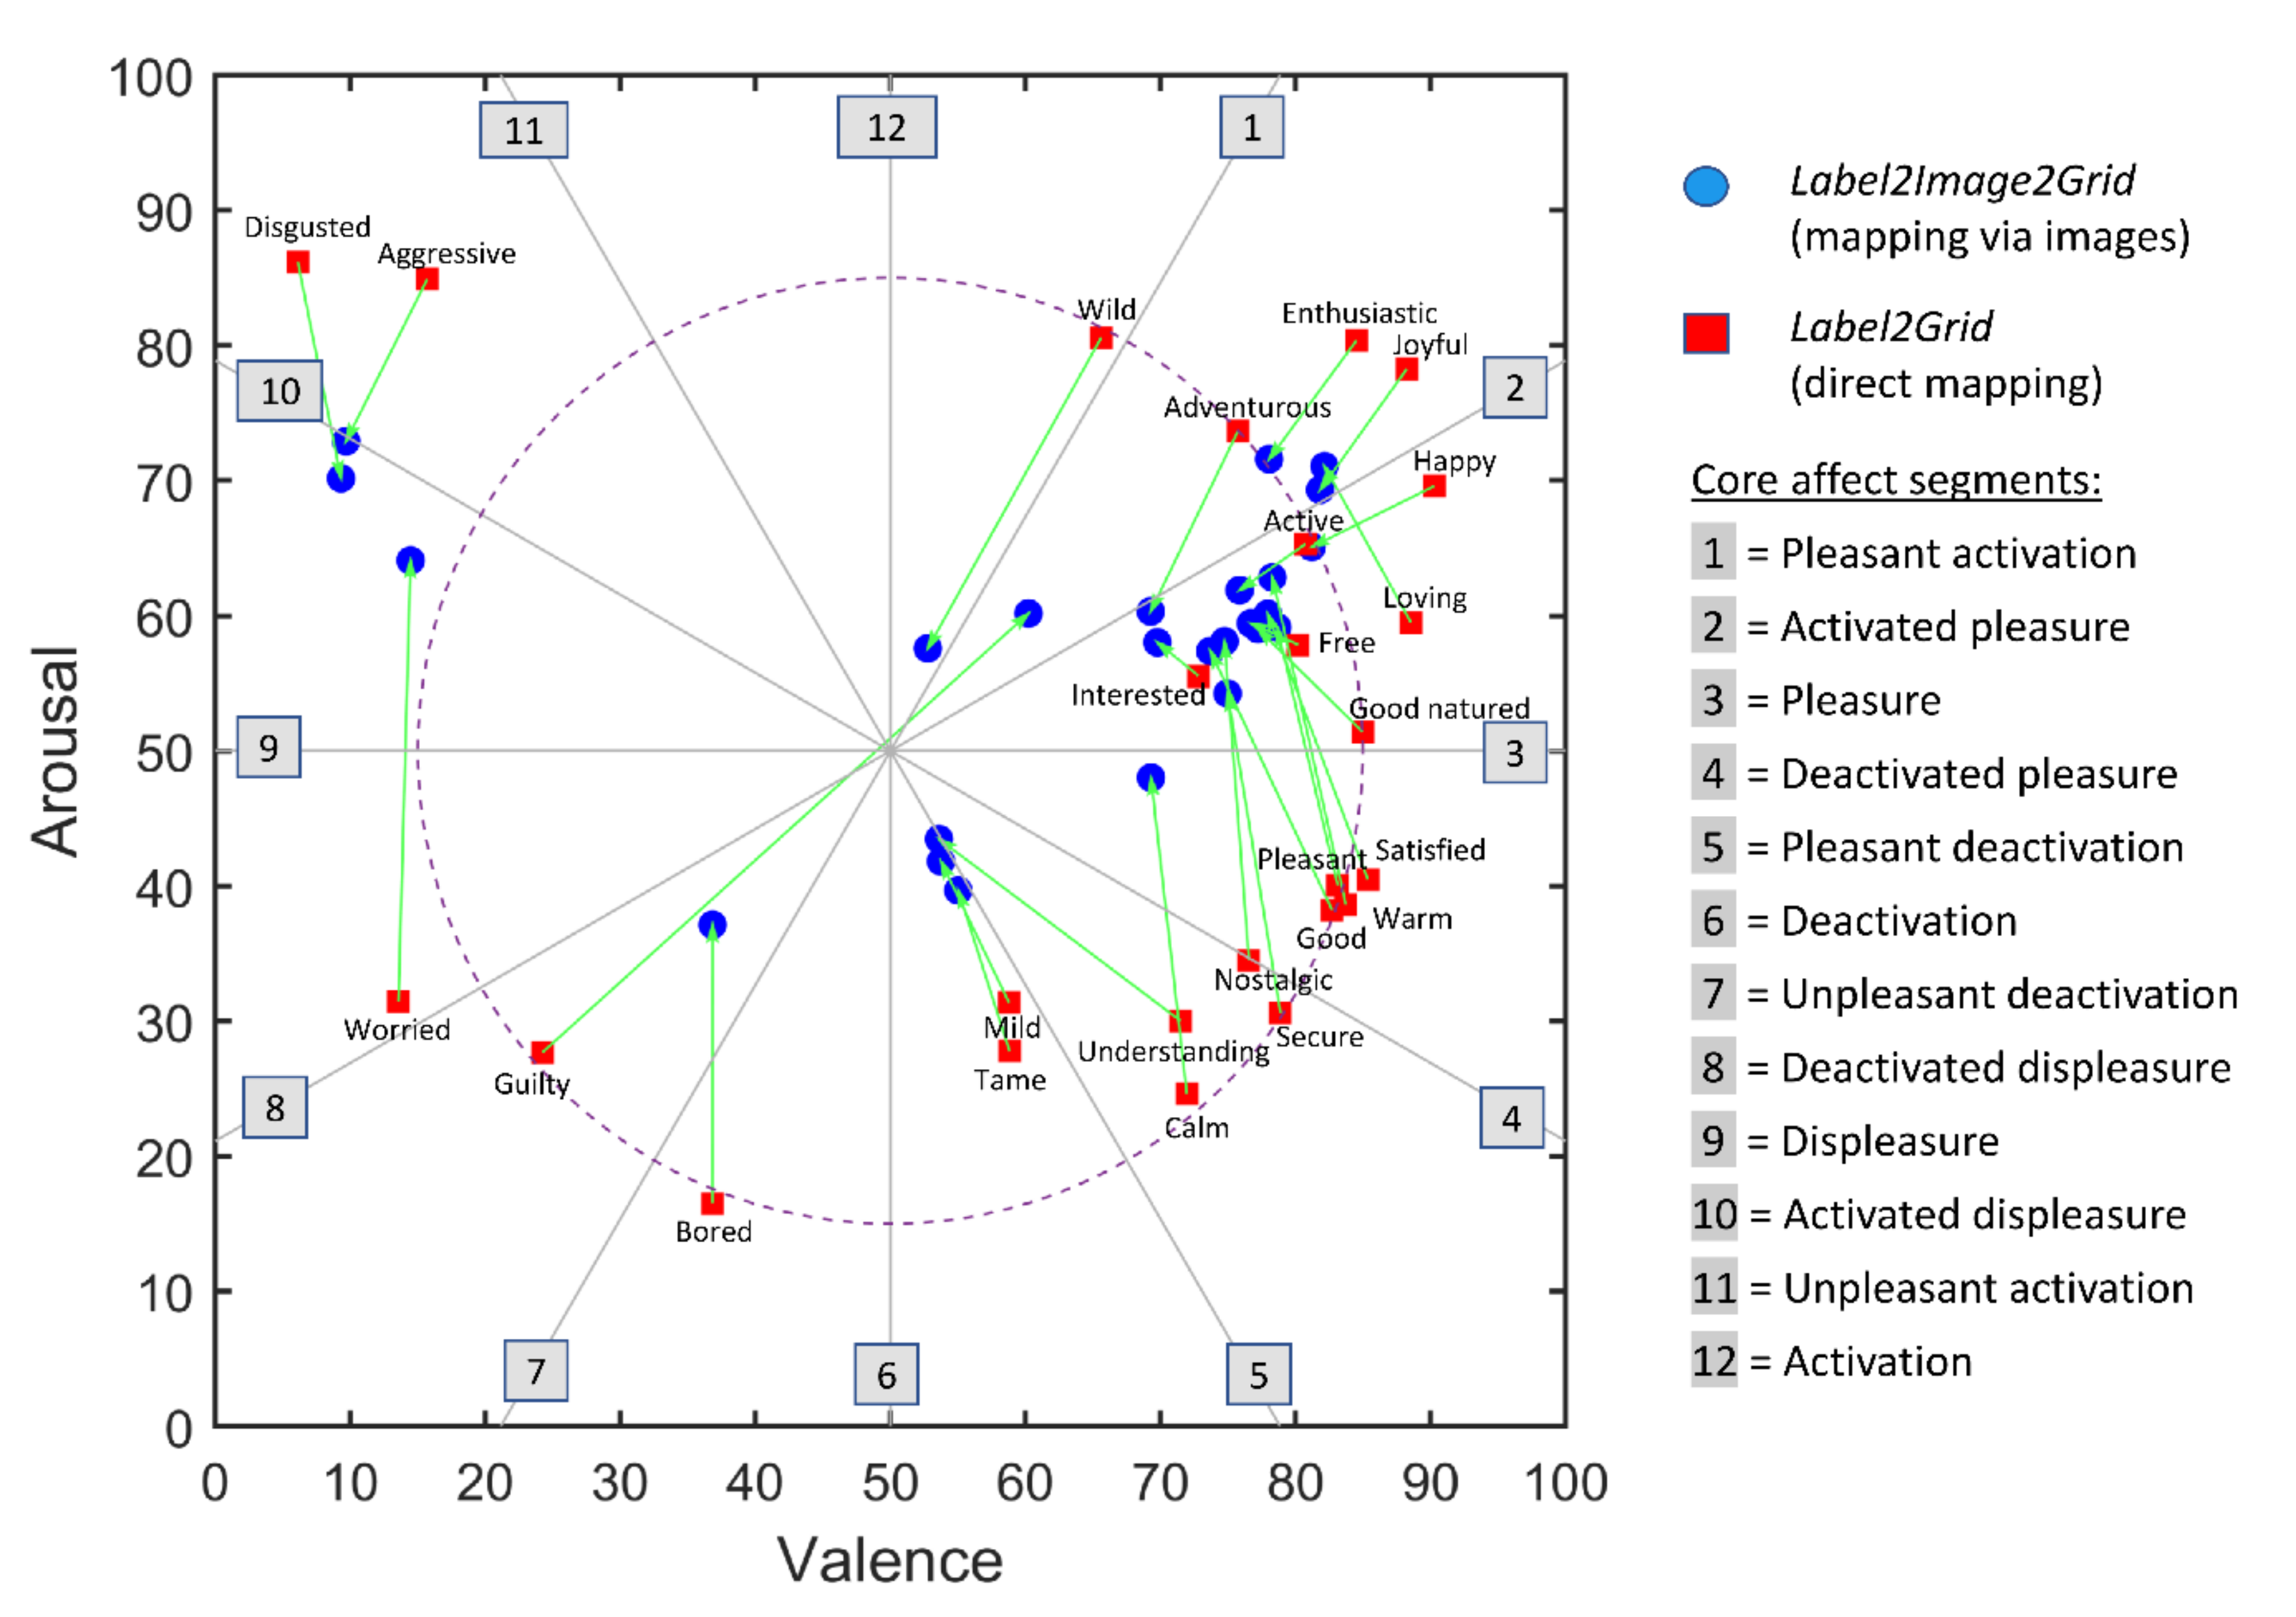
3.4. Task IV: Label2Grid
4. Discussion
4.1. Limitations
4.2. Future Research
Supplementary Materials
Author Contributions
Funding
Institutional Review Board Statement
Informed Consent Statement
Data Availability Statement
Conflicts of Interest
References
- Gutjar, S.; de Graaf, C.; Kooijman, V.; de Wijk, R.A.; Nys, A.; ter Horst, G.J.; Jager, G. The role of emotions in food choice and liking. Food Res. Int. 2015, 76, 216–223. [Google Scholar] [CrossRef]
- Dalenberg, J.R.; Gutjar, S.; ter Horst, G.J.; de Graaf, K.; Renken, R.J.; Jager, G. Evoked emotions predict food choice. PLoS ONE 2014, 9, e115388. [Google Scholar] [CrossRef] [PubMed]
- Wichchukit, S.; O’Mahony, M. ‘Liking’, ‘Buying’, ‘Choosing’ and ‘Take Away’ preference tests for varying degrees of hedonic disparity. Food Qual. Prefer. 2011, 22, 60–65. [Google Scholar] [CrossRef]
- Wichchukit, S.; O’Mahony, M. Paired preference tests: ‘Liking’, ‘Buying’ and ‘Take Away’ preferences. Food Qual. Prefer. 2010, 21, 925–929. [Google Scholar] [CrossRef]
- Coppin, G.; Sander, D. Theoretical approaches to emotion and its measurement. In Emotion Measurement; Meiselman, H.L., Ed.; Woodhead Publishing: Cambridge, UK, 2016; pp. 3–30. [Google Scholar]
- Lorette, P. Investigating emotion perception via the Two-Dimensional Affect and Feeling Space: An example of a cross-cultural study among Chinese and non-Chinese participants. Front. Psychol. 2021, 12, 1–14. [Google Scholar] [CrossRef]
- Fox, E. Perspectives from affective science on understanding the nature of emotion. Brain Neurosci. Adv. 2018, 2, 1–8. [Google Scholar] [CrossRef] [Green Version]
- Russell, J.A. A circumplex model of affect. J. Personal. Soc. Psychol. 1980, 39, 1161–1178. [Google Scholar] [CrossRef]
- Ekman, P. An argument for basic emotions. Cogn. Emot. 1992, 6, 169–200. [Google Scholar] [CrossRef]
- Barrett, L.F. The theory of constructed emotion: An active inference account of interoception and categorization. Soc. Cogn. Affect. Neurosci. 2017, 12, 1–23. [Google Scholar] [CrossRef]
- Kaneko, D.; Toet, A.; Ushiama, S.; Brouwer, A.M.; Kallen, V.; van Erp, J.B.F. EmojiGrid: A 2D pictorial scale for cross-cultural emotion assessment of negatively and positively valenced food. Food Res. Int. 2018, 115, 541–551. [Google Scholar] [CrossRef]
- King, S.C.; Meiselman, H.L. Development of a method to measure consumer emotions associated with foods. Food Qual. Prefer. 2010, 21, 168–177. [Google Scholar] [CrossRef]
- Gutjar, S.; Dalenberg, J.R.; de Graaf, C.; de Wijk, R.; Palascha, A.; Renken, R.J.; Jager, G. What reported food-evoked emotions may add: A model to predict consumer food choice. Food Qual. Prefer. 2015, 45, 140–148. [Google Scholar] [CrossRef]
- King, S.C.; Meiselman, H.L.; Carr, B.T. Measuring emotions associated with foods in consumer testing. Food Qual. Prefer. 2010, 21, 1114–1116. [Google Scholar] [CrossRef]
- Jaeger, S.R.; Swaney-Stueve, M.; Chheang, S.L.; Hunter, D.C.; Pineau, B.; Ares, G. An assessment of the CATA-variant of the EsSense Profile®. Food Qual. Prefer. 2018, 68, 360–370. [Google Scholar] [CrossRef]
- Ng, M.; Chaya, C.; Hort, J. Beyond liking: Comparing the measurement of emotional response using EsSense Profile and consumer defined check-all-that-apply methodologies. Food Qual. Prefer. 2013, 28, 193–205. [Google Scholar] [CrossRef]
- Köster, E.P.; Mojet, J. From mood to food and from food to mood: A psychological perspective on the measurement of food-related emotions in consumer research. Food Res. Int. 2015, 76, 180–191. [Google Scholar] [CrossRef]
- Scherer, K.R. What are emotions? And how can they be measured? Soc. Sci. Inf. 2005, 44, 695–729. [Google Scholar] [CrossRef]
- Jaeger, S.R.; Cardello, A.V.; Schutz, H.G. Emotion questionnaires: A consumer-centric perspective. Food Qual. Prefer. 2013, 30, 229–241. [Google Scholar] [CrossRef]
- Toet, A.; Kaneko, D.; Ushiama, S.; Hoving, S.; de Kruijf, I.; Brouwer, A.-M.; Kallen, V.; van Erp, J.B.F. EmojiGrid: A 2D pictorial scale for the assessment of food elicited emotions. Front. Psychol. 2018, 9, 2396. [Google Scholar] [CrossRef] [Green Version]
- Vidal, L.; Ares, G.; Jaeger, S.R. Use of emoticon and emoji in tweets for food-related emotional expression. Food Qual. Prefer. 2016, 49, 119–128. [Google Scholar] [CrossRef]
- Ares, G.; Jaeger, S.R. A comparison of five methodological variants of emoji questionnaires for measuring product elicited emotional associations: An application with seafood among Chinese consumers. Food Res. Int. 2017, 99, 216–228. [Google Scholar] [CrossRef] [PubMed]
- Gallo, K.E.; Swaney-Stueve, M.; Chambers, D.H. A focus group approach to understanding food-related emotions with children using words and emojis. J. Sens. Stud. 2017, 32, e12264. [Google Scholar] [CrossRef]
- Schouteten, J.J.; Verwaeren, J.; Lagast, S.; Gellynck, X.; De Steur, H. Emoji as a tool for measuring children’s emotions when tasting food. Food Qual. Prefer. 2018, 68, 322–331. [Google Scholar] [CrossRef]
- Schouteten, J.J.; Verwaeren, J.; Gellynck, X.; Almli, V.L. Comparing a standardized to a product-specific emoji list for evaluating food products by children. Food Qual. Prefer. 2019, 72, 86–97. [Google Scholar] [CrossRef]
- Pinto, V.R.A.; Teixeira, C.G.; Lima, T.S.; De Almeida Prata, E.R.B.; Vidigal, M.C.T.R.; Martins, E.; Perrone, Í.T.; Carvalho, A.F.d. Health beliefs towards kefir correlate with emotion and attitude: A study using an emoji scale in Brazil. Food Res. Int. 2020, 129, 108833. [Google Scholar] [CrossRef]
- Yik, M.; Russell, J.A.; Steiger, J.H. A 12-point circumplex structure of core affect. Emotion 2011, 11, 705–731. [Google Scholar] [CrossRef] [PubMed] [Green Version]
- Woodward, H.E.; Treat, T.A.; Cameron, C.D.; Yegorova, V. Valence and arousal-based affective evaluations of foods. Eat. Behav. 2017, 24, 26–33. [Google Scholar] [CrossRef]
- Russell, J.A.; Weiss, A.; Mendelson, G.A. Affect grid: A single-item scale of pleasure and arousal. J. Personal. Soc. Psychol. 1989, 57, 493–502. [Google Scholar] [CrossRef]
- Lieberman, M.D.; Eisenberger, N.I.; Crockett, M.J.; Tom, S.M.; Pfeifer, J.H.; Way, B.M. Putting feelings into words. Affect labeling disrupts amygdala activity in response to affective stimuli. Psychol. Sci. 2007, 18, 421–428. [Google Scholar] [CrossRef]
- Russell, J.A.; Feldman Barrett, L. Core affect, prototypical emotional episodes, and other things called emotion: Dissecting the elephant. J. Personal. Soc. Psychol. 1999, 76, 805–819. [Google Scholar] [CrossRef]
- Scherer, K.R.; Shuman, V.; Fontaine, J.R.; Soriano, C. The GRID meets the Wheel: Assessing emotional feeling via self-report. In Components of Emotional Meaning: A Sourcebook; Fontaine, J.R.J., Scherer, K.R., Soriano, C., Eds.; Oxford University Press: Oxford, UK, 2013; pp. 281–298. [Google Scholar]
- Ekkekakis, P.; Petruzzello, S.J. Analysis of the affect measurement conundrum in exercise psychology: IV. A conceptual case for the affect circumplex. Psychol. Sport Exerc. 2002, 3, 35–63. [Google Scholar] [CrossRef]
- Jaeger, S.R.; Spinelli, S.; Ares, G.; Monteleone, E. Linking product-elicited emotional associations and sensory perceptions through a circumplex model based on valence and arousal: Five consumer studies. Food Res. Int. 2018, 109, 626–640. [Google Scholar] [CrossRef]
- Kuppens, P.; Tuerlinckx, F.; Russell, J.A.; Barrett, L.F. The relation between valence and arousal in subjective experience. Psychol. Bull. 2013, 139, 917–940. [Google Scholar] [CrossRef]
- Whissell, C. Using the revised Dictionary of Affect in Language to quantify the emotional undertones of samples of natural language. Psychol. Rep. 2009, 105, 509–521. [Google Scholar] [CrossRef]
- Warriner, A.B.; Kuperman, V.; Brysbaert, M. Norms of valence, arousal, and dominance for 13,915 English lemmas. Behav. Res. Methods 2013, 45, 1191–1207. [Google Scholar] [CrossRef] [Green Version]
- Whissell, C.M. Chapter 5—The Dictionary of Affect in Language. In The Measurement of Emotions; Plutchik, R., Kellerman, H., Eds.; Academic Press: New York, NY, USA, 1989; pp. 113–131. [Google Scholar]
- World Medical Association. World Medical Association declaration of Helsinki: Ethical principles for medical research involving human subjects. J. Am. Med. Assoc. 2013, 310, 2191–2194. [Google Scholar] [CrossRef] [Green Version]
- Toet, A.; Kaneko, D.; de Kruijf, I.; Ushiama, S.; van Schaik, M.G.; Brouwer, A.-M.; Kallen, V.; van Erp, J.B.F. CROCUFID: A cross-cultural food image database for research on food elicited affective responses. Front. Psychol. 2019, 10, 58. [Google Scholar] [CrossRef]
- Nestrud, M.A.; Meiselman, H.L.; King, S.C.; Lesher, L.L.; Cardello, A.V. Development of EsSense25, a shorter version of the EsSense Profile. Food Qual. Prefer. 2016, 48, 107–117. [Google Scholar] [CrossRef]
- Ares, G.; Antúnez, L.; Giménez, A.; Jaeger, S.R. List length has little impact on consumers’ visual attention to CATA questions. Food Qual. Prefer. 2015, 42, 100–109. [Google Scholar] [CrossRef]
- Bradley, M.M.; Lang, P.J. Measuring emotion: The Self-Assessment Manikin and the semantic differential. J. Behav. Ther. Exp. Psychiatry 1994, 25, 49–59. [Google Scholar] [CrossRef]
- Toet, A.; Van Erp, J.B.F. The EmojiGrid as a tool to assess experienced and perceived emotions. Psych 2019, 1, 469–481. [Google Scholar] [CrossRef] [Green Version]
- Toet, A.; van Erp, J.B.F. Affective rating of audio and video clips using the EmojiGrid [version 2; peer review: 2 approved]. F1000Research 2021, 9, 1–21. [Google Scholar] [CrossRef]
- Toet, A.; van Erp, J.B.F. The EmojiGrid as a rating tool for the affective appraisal of touch. PLoS ONE 2020, 15, e0237873. [Google Scholar] [CrossRef]
- Liu, Y.; Toet, A.; Krone, T.; van Stokkum, R.; Eijsman, S.; van Erp, J.B.F. A network model of affective odor perception. PLoS ONE 2020, 15, e0236468. [Google Scholar] [CrossRef]
- Toet, A.; Eijsman, S.; Liu, Y.; Donker, S.; Kaneko, D.; Brouwer, A.-M.; van Erp, J.B.F. The relation between valence and arousal in subjective odor experience. Chemosens. Percept. 2019, 13, 141–151. [Google Scholar] [CrossRef]
- Van der Burg, E.; Toet, A.; Brouwer, A.-M.; van Erp, J.B.F. Sequential effects in odor perception. Chemosens. Percept. 2021. Online first. [Google Scholar] [CrossRef]
- Toet, A.; Heijn, F.; Brouwer, A.-M.; Mioch, T.; van Erp, J.B.F. The EmojiGrid as an immersive self-report tool for the affective assessment of 360 VR videos. In Proceedings of the EuroVR 2019: Virtual Reality and Augmented Reality, Tallinn, Estonia, 23–25 October 2019; pp. 330–335. [Google Scholar]
- Kaneko, D.; Stuldreher, I.; Reuten, A.J.C.; Toet, A.; van Erp, J.B.F.; Brouwer, A.-M. Comparing explicit and implicit measures for assessing cross-cultural food experience. Front. Neuroergonomics 2021, 2, 1–16. [Google Scholar] [CrossRef]
- Koo, T.K.; Li, M.Y. A guideline of selecting and reporting intraclass correlation coefficients for reliability research. J. Chiropr. Med. 2016, 15, 155–163. [Google Scholar] [CrossRef] [Green Version]
- Shrout, P.E.; Fleiss, J.L. Intraclass correlations: Uses in assessing rater reliability. Psychol. Bull. 1979, 86, 420–428. [Google Scholar] [CrossRef] [PubMed]
- Anwyl-Irvine, A.; Massonnié, J.; Flitton, A.; Kirkham, N.; Evershed, J. Gorilla in our Midst: An online behavioral experiment builder. bioRxiv 2019, 438242. [Google Scholar] [CrossRef] [Green Version]
- Aust, F.; Diedenhofen, B.; Ullrich, S.; Musch, J. Seriousness checks are useful to improve data validity in online research. Behav. Res. Methods 2013, 45, 527–535. [Google Scholar] [CrossRef] [PubMed] [Green Version]
- Meiselman, H.L. A review of the current state of emotion research in product development. Food Res. Int. 2015, 76 Pt 2, 192–199. [Google Scholar] [CrossRef]
- Goldsmith, K.; Cho, E.K.; Dhar, R. When guilt begets pleasure: The positive effect of a negative emotion. J. Mark. Res. 2012, 49, 872–881. [Google Scholar] [CrossRef] [Green Version]
- Giner-Sorolla, R. Guilty pleasures and grim necessities: Affective attitudes in dilemmas of self-control. J. Personal. Soc. Psychol. 2001, 80, 206–221. [Google Scholar] [CrossRef]
- Jaeger, S.R.; Roigard, C.M.; Chheang, S.L. The valence × arousal circumplex-inspired emotion questionnaire (CEQ): Effect of response format and question layout. Food Qual. Prefer. 2021, 90, 104172. [Google Scholar] [CrossRef]
- Jaeger, S.R.; Roigard, C.M.; Jin, D.; Xia, Y.; Zhong, F.; Hedderley, D.I. A single-response emotion word questionnaire for measuring product-related emotional associations inspired by a circumplex model of core affect: Method characterisation with an applied focus. Food Qual. Prefer. 2020, 83, 103805. [Google Scholar] [CrossRef]
- Scherer, K.; Dan, E.; Flykt, A. What determines a feeling’s position in affective space? A case for appraisal. Cogn. Emot. 2006, 20, 92–113. [Google Scholar] [CrossRef]
- Simmons, W.K.; Martin, A.; Barsalou, L.W. Pictures of appetizing foods activate gustatory cortices for taste and reward. Cereb. Cortex 2005, 15, 1602–1608. [Google Scholar] [CrossRef]
- Avery, J.A.; Liu, A.G.; Ingeholm, J.E.; Gotts, S.J.; Martin, A. Viewing images of foods evokes taste quality-specific activity in gustatory insular cortex. Proc. Natl. Acad. Sci. USA 2021, 118, e2010932118. [Google Scholar] [CrossRef]
- Verastegui-Tena, L.; Schulte-Holierhoek, A.; van Trijp, H.; Piqueras-Fiszman, B. Beyond expectations: The responses of the autonomic nervous system to visual food cues. Physiol. Behav. 2017, 179, 478–486. [Google Scholar] [CrossRef]


| ID | Food Image | V | A | Vc | Ac |
|---|---|---|---|---|---|
| 123 | Salad1_mold | 6.71 | 78.51 | 5.11 | 86.36 |
| 190 | Banana_mold | 7.09 | 76.80 | 6.77 | 75.80 |
| 167 | Salad2_mold | 8.24 | 76.65 | 6.62 | 83.15 |
| 152 | Pear_mold | 9.05 | 72.41 | 8.43 | 74.89 |
| 175 | Carpaccio | 38.09 | 46.51 | 34.92 | 53.79 |
| 13 | Salad2_fresh | 48.61 | 46.25 | 53.13 | 44.10 |
| 82 | Olives_feta | 48.65 | 56.92 | 47.61 | 58.79 |
| 136 | Salami | 51.65 | 51.07 | 42.23 | 52.03 |
| 250 | Burger | 57.96 | 47.95 | 58.08 | 49.44 |
| 93 | Boiled_eggs | 58.06 | 47.49 | 58.31 | 46.31 |
| 47 | Cookies | 58.94 | 50.17 | 63.05 | 50.39 |
| 9 | Salad1_fresh | 62.05 | 51.11 | 60.97 | 48.90 |
| 36 | Cucumber | 62.82 | 46.36 | 62.67 | 50.57 |
| 70 | Melon | 64.20 | 54.04 | 63.74 | 54.00 |
| 44 | Pineapple | 66.69 | 53.80 | 70.39 | 60.70 |
| 162 | Bellpeppers | 67.88 | 50.58 | 70.62 | 50.56 |
| 43 | Orange | 70.57 | 51.73 | 70.77 | 55.10 |
| 4 | Apple | 74.18 | 49.43 | 66.92 | 54.16 |
| 145 | Pastries | 77.62 | 65.69 | 79.07 | 65.89 |
| 147 | Strawberries | 79.62 | 67.50 | 80.85 | 64.95 |
| Valence | Arousal | ||||||
|---|---|---|---|---|---|---|---|
| n | L2G | L2I2G | p | L2G | L2I2G | p | |
| Understanding | 116 | 71.48 | 53.60 | <0.001 | 30.03 | 43.47 | <0.001 |
| Wild | 132 | 65.62 | 52.77 | <0.001 | 80.58 | 57.58 | <0.001 |
| Secure | 181 | 78.89 | 74.97 | 0.147 | 30.62 | 54.24 | <0.001 |
| Aggressive | 186 | 15.68 | 9.68 | <0.001 | 84.88 | 72.90 | <0.001 |
| Tame | 190 | 58.83 | 55.03 | 0.0510 | 27.76 | 39.67 | <0.001 |
| Adventurous | 206 | 75.73 | 69.28 | <0.001 | 73.64 | 60.32 | <0.001 |
| Active | 213 | 80.76 | 75.86 | <0.005 | 65.31 | 61.89 | 0.211 |
| Warm | 230 | 83.74 | 78.29 | <0.001 | 38.60 | 62.83 | <0.001 |
| Free | 238 | 80.21 | 76.70 | <0.001 | 57.86 | 59.44 | 0.656 |
| Guilty | 242 | 24.24 | 60.23 | <0.001 | 27.69 | 60.17 | <0.001 |
| Loving | 247 | 88.57 | 82.15 | <0.001 | 59.48 | 71.06 | <0.001 |
| Enthusiastic | 258 | 84.53 | 78.06 | <0.001 | 80.38 | 71.58 | <0.001 |
| Nostalgic | 261 | 76.56 | 74.75 | 0.199 | 34.51 | 58.11 | <0.001 |
| Good | 277 | 82.72 | 73.70 | <0.001 | 38.21 | 57.39 | <0.001 |
| Calm | 306 | 71.96 | 69.30 | 0.108 | 24.59 | 48.02 | <0.001 |
| Mild | 330 | 58.79 | 53.75 | <0.005 | 31.36 | 41.82 | <0.001 |
| Satisfied | 334 | 85.37 | 77.96 | <0.001 | 40.49 | 60.13 | <0.001 |
| Worried | 340 | 13.56 | 14.46 | 0.967 | 31.47 | 64.09 | <0.001 |
| Joyful | 363 | 88.26 | 81.83 | <0.001 | 78.26 | 69.31 | <0.001 |
| Bored | 364 | 36.81 | 36.83 | 0.635 | 16.51 | 37.13 | <0.001 |
| Interested | 377 | 72.80 | 69.77 | 0.379 | 55.57 | 58.03 | 0.213 |
| Pleasant | 408 | 83.14 | 78.66 | <0.001 | 40.04 | 59.14 | <0.001 |
| Good natured | 428 | 84.98 | 77.24 | <0.001 | 51.40 | 59.01 | <0.001 |
| Happy | 432 | 90.27 | 81.21 | <0.001 | 69.58 | 65.09 | <0.001 |
| Disgusted | 473 | 6.11 | 9.31 | <0.001 | 86.17 | 7.16 | <0.001 |
| Core Affect Domain | |||
|---|---|---|---|
| Emotion Term | Jaeger et al. [34] | Indirect Mapping | Direct Mapping |
| Adventurous | 1 | 3.1 | 2.6 |
| Active | 1 | 3.2 | 3.1 |
| Wild | 1.5 | 1.7 | 1.9 |
| Enthusiastic | 1.5 | 2.7 | 2.6 |
| Free | 1.5 | 3.4 | 3.5 |
| Loving | 2 | 2.9 | 3.5 |
| Joyful | 2 | 3.0 | 2.8 |
| Happy | 3 | 3.1 | 3.1 |
| Interested | 3 | 3.3 | 3.5 |
| Good natured | 3 | 3.4 | 3.9 |
| Pleasant | 3 | 3.4 | 4.6 |
| Good | 3 | 3.4 | 4.7 |
| Satisfied | 4 | 3.3 | 4.5 |
| Secure | 4 | 3.7 | 5.1 |
| Warm | 4.5 | 3.2 | 4.6 |
| Nostalgic | 4.5 | 3.4 | 5.0 |
| Understanding | 4.5 | 6.0 | 5.4 |
| Mild | 4.5 | 6.2 | 6.2 |
| Calm | 5 | 4.2 | 5.6 |
| Tame | 6 | 6.1 | 6.3 |
| Bored | 7 | 8.5 | 9.3 |
| Guilty | 10 | 2.5 | 2.6 |
| Disgusted | 10 | 10.9 | 11.3 |
| Aggressive | 10.5 | 11.0 | 11.5 |
| Worried | 11 | 10.7 | 9.1 |
Publisher’s Note: MDPI stays neutral with regard to jurisdictional claims in published maps and institutional affiliations. |
© 2022 by the authors. Licensee MDPI, Basel, Switzerland. This article is an open access article distributed under the terms and conditions of the Creative Commons Attribution (CC BY) license (https://creativecommons.org/licenses/by/4.0/).
Share and Cite
Toet, A.; Van der Burg, E.; Van den Broek, T.J.; Kaneko, D.; Brouwer, A.-M.; Van Erp, J.B.F. Linking Categorical and Dimensional Approaches to Assess Food-Related Emotions. Foods 2022, 11, 972. https://doi.org/10.3390/foods11070972
Toet A, Van der Burg E, Van den Broek TJ, Kaneko D, Brouwer A-M, Van Erp JBF. Linking Categorical and Dimensional Approaches to Assess Food-Related Emotions. Foods. 2022; 11(7):972. https://doi.org/10.3390/foods11070972
Chicago/Turabian StyleToet, Alexander, Erik Van der Burg, Tim J. Van den Broek, Daisuke Kaneko, Anne-Marie Brouwer, and Jan B. F. Van Erp. 2022. "Linking Categorical and Dimensional Approaches to Assess Food-Related Emotions" Foods 11, no. 7: 972. https://doi.org/10.3390/foods11070972
APA StyleToet, A., Van der Burg, E., Van den Broek, T. J., Kaneko, D., Brouwer, A.-M., & Van Erp, J. B. F. (2022). Linking Categorical and Dimensional Approaches to Assess Food-Related Emotions. Foods, 11(7), 972. https://doi.org/10.3390/foods11070972