
Effects of Radio Frequency Tempering on the Temperature Distribution and Physiochemical Properties of Salmon (Salmo salar)


Abstract
:1. Introduction
2. Materials and Methods
2.1. Sample Preparation
2.2. Dielectric Properties
2.3. Penetration Depth
2.4. Tempering Experiments
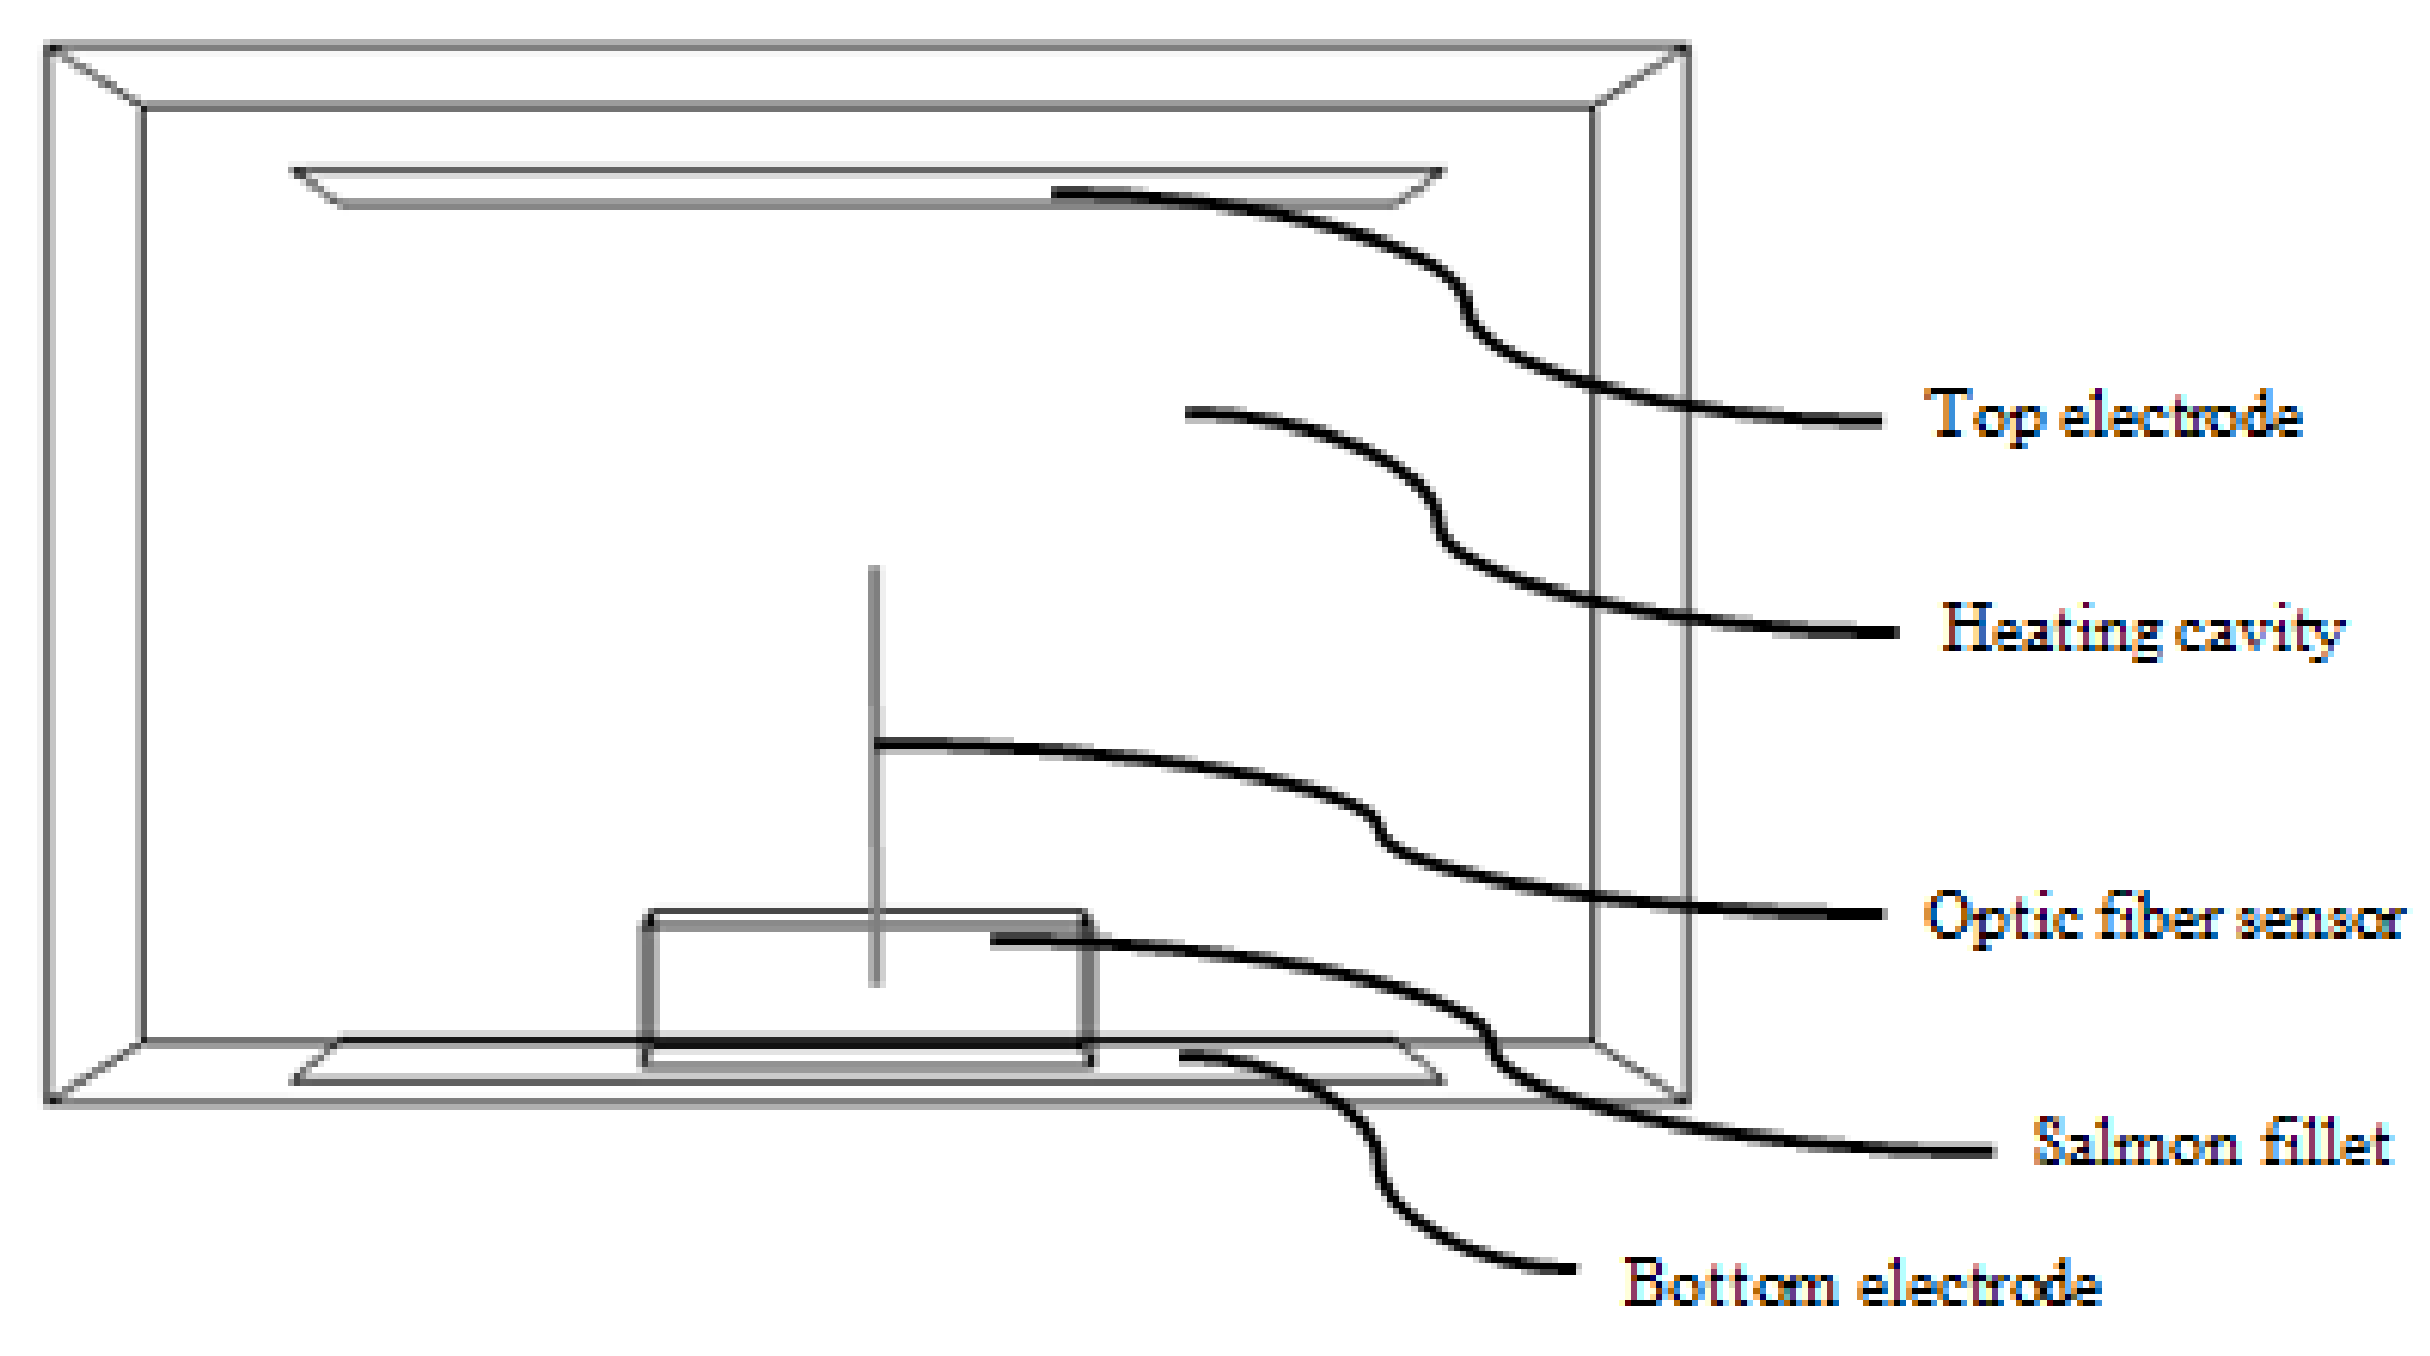
2.4.1. Radio Frequency Tempering (RT)
2.4.2. Water Tempering (WT) and Air Tempering (AT)
2.5. Drip Loss and Cooking Loss
2.6. Color
2.7. Lipid Oxidation
2.8. Protein Denaturation
2.9. Water Migration
2.10. Microstructure
2.11. Statistical Analysis
3. Results and Discussions
3.1. Dielectric Properties
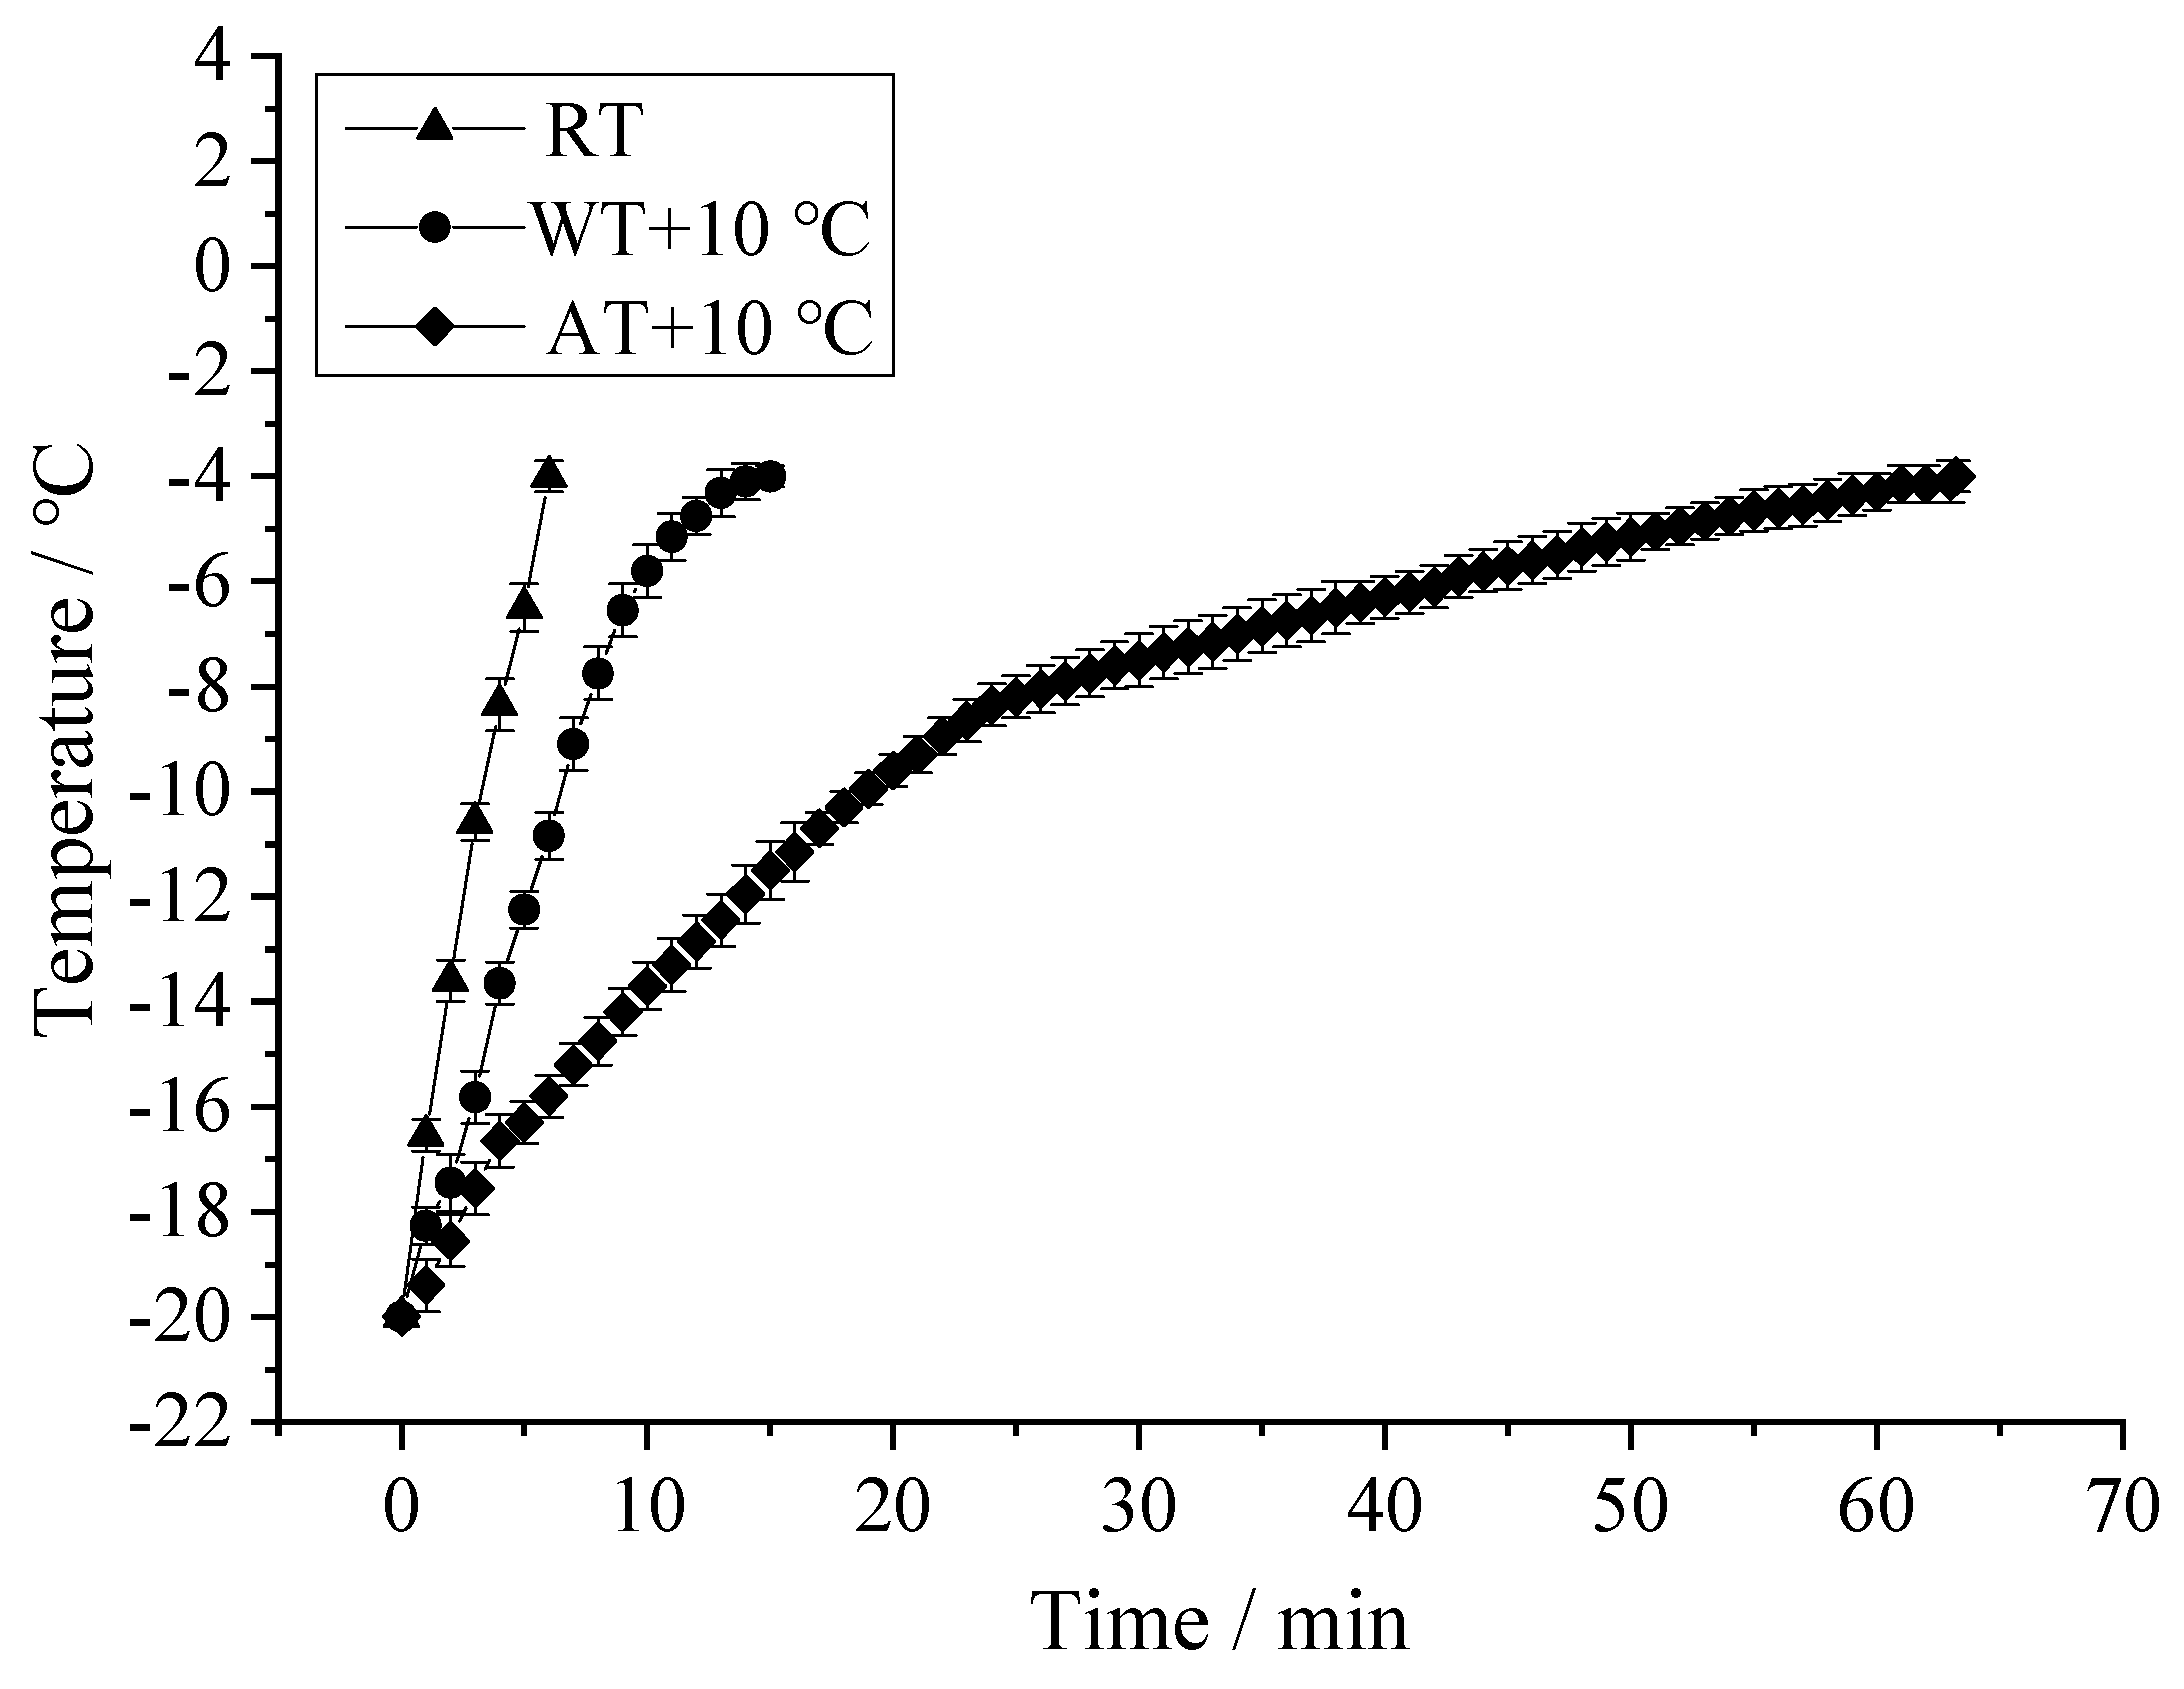
3.2. Tempering Rate
3.3. Surface Temperature Distribution
3.4. Drip and Cooking Loss
3.5. Color
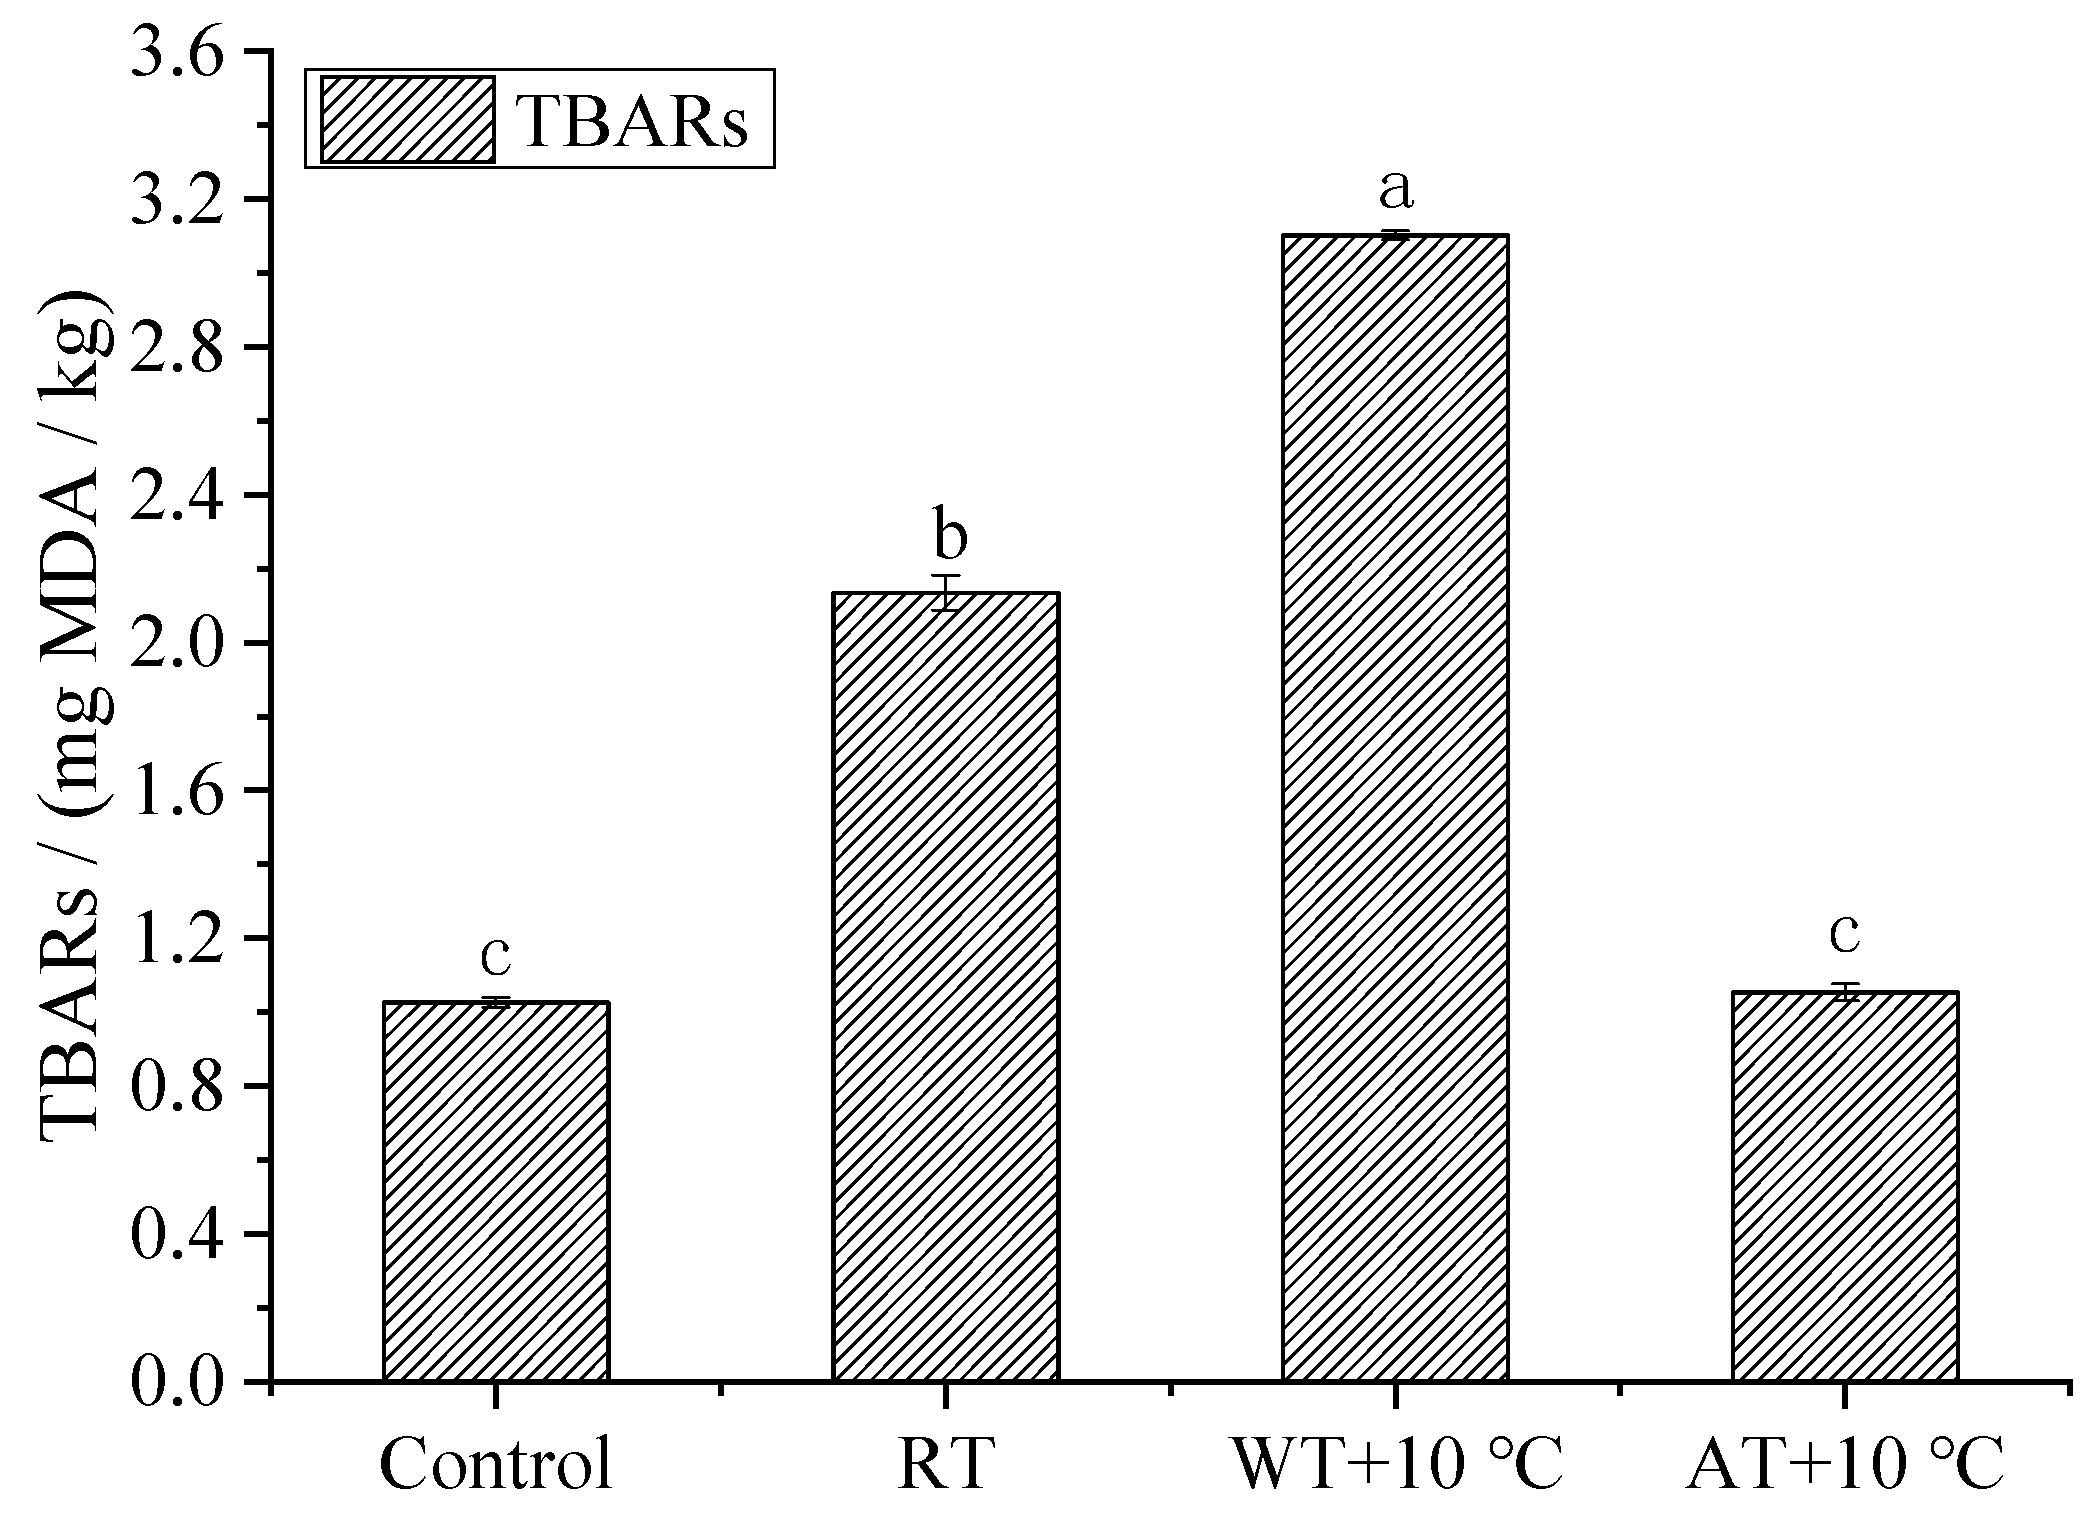
3.6. TBARS
3.7. Protein Denaturation
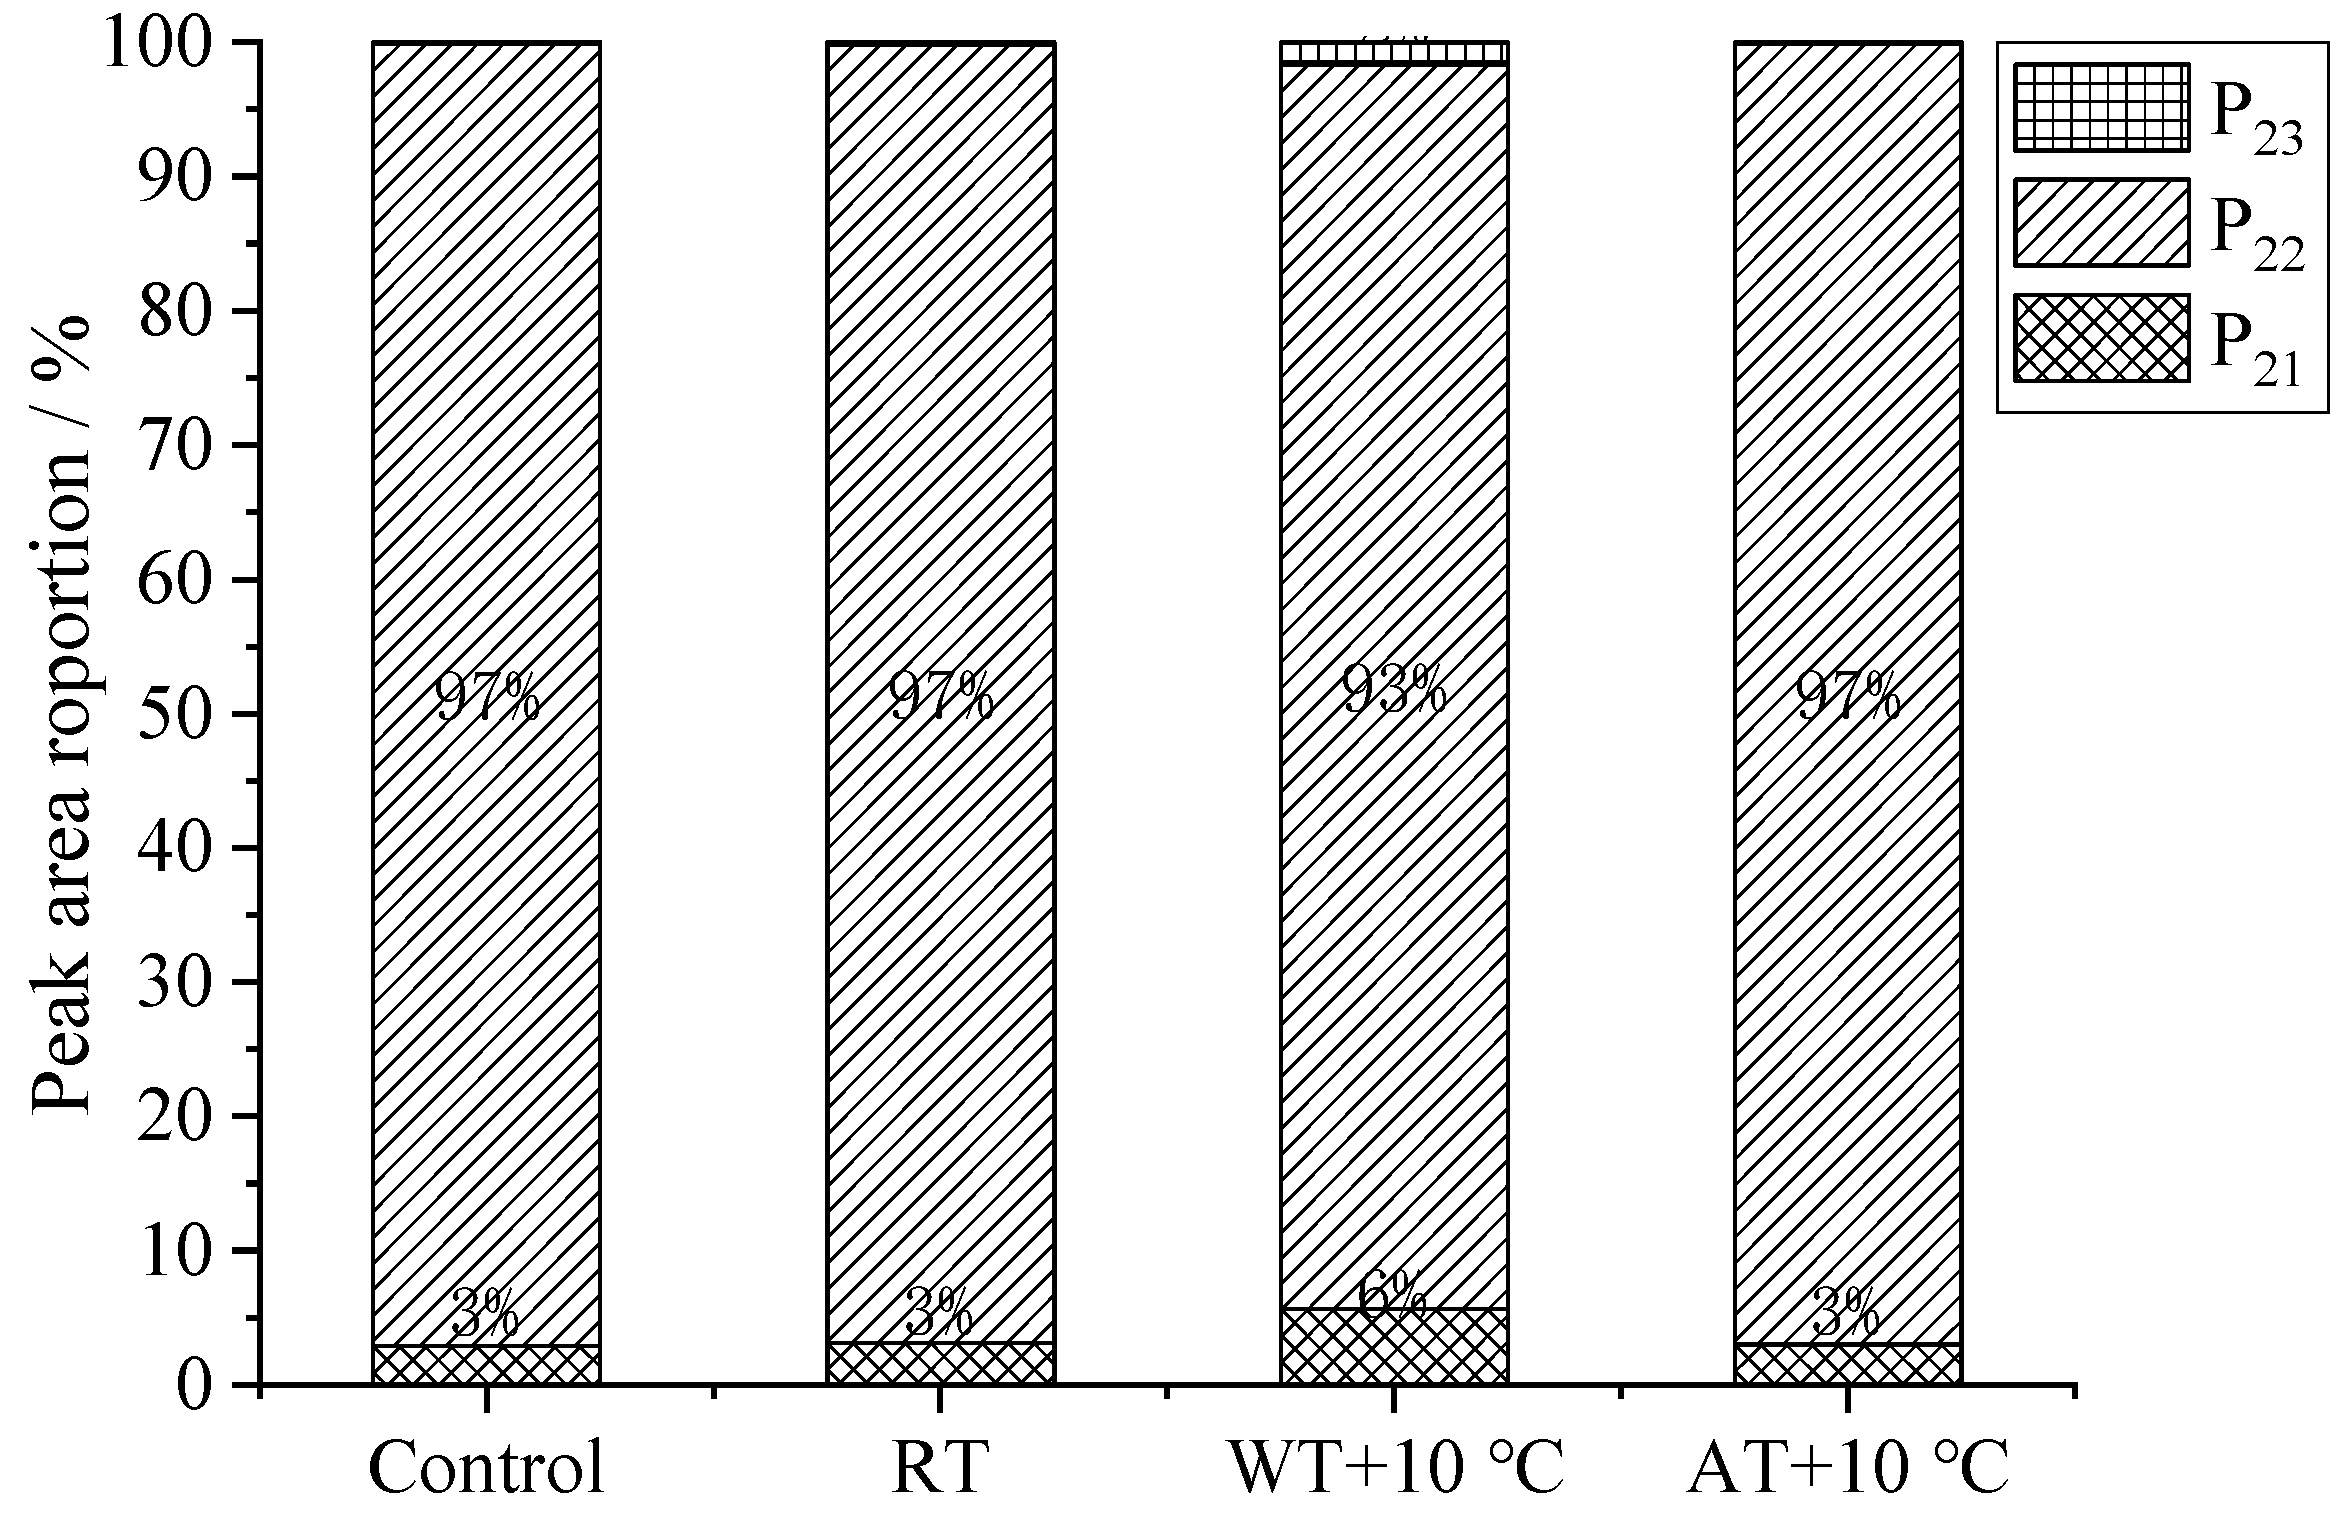
3.8. Moisture Migration
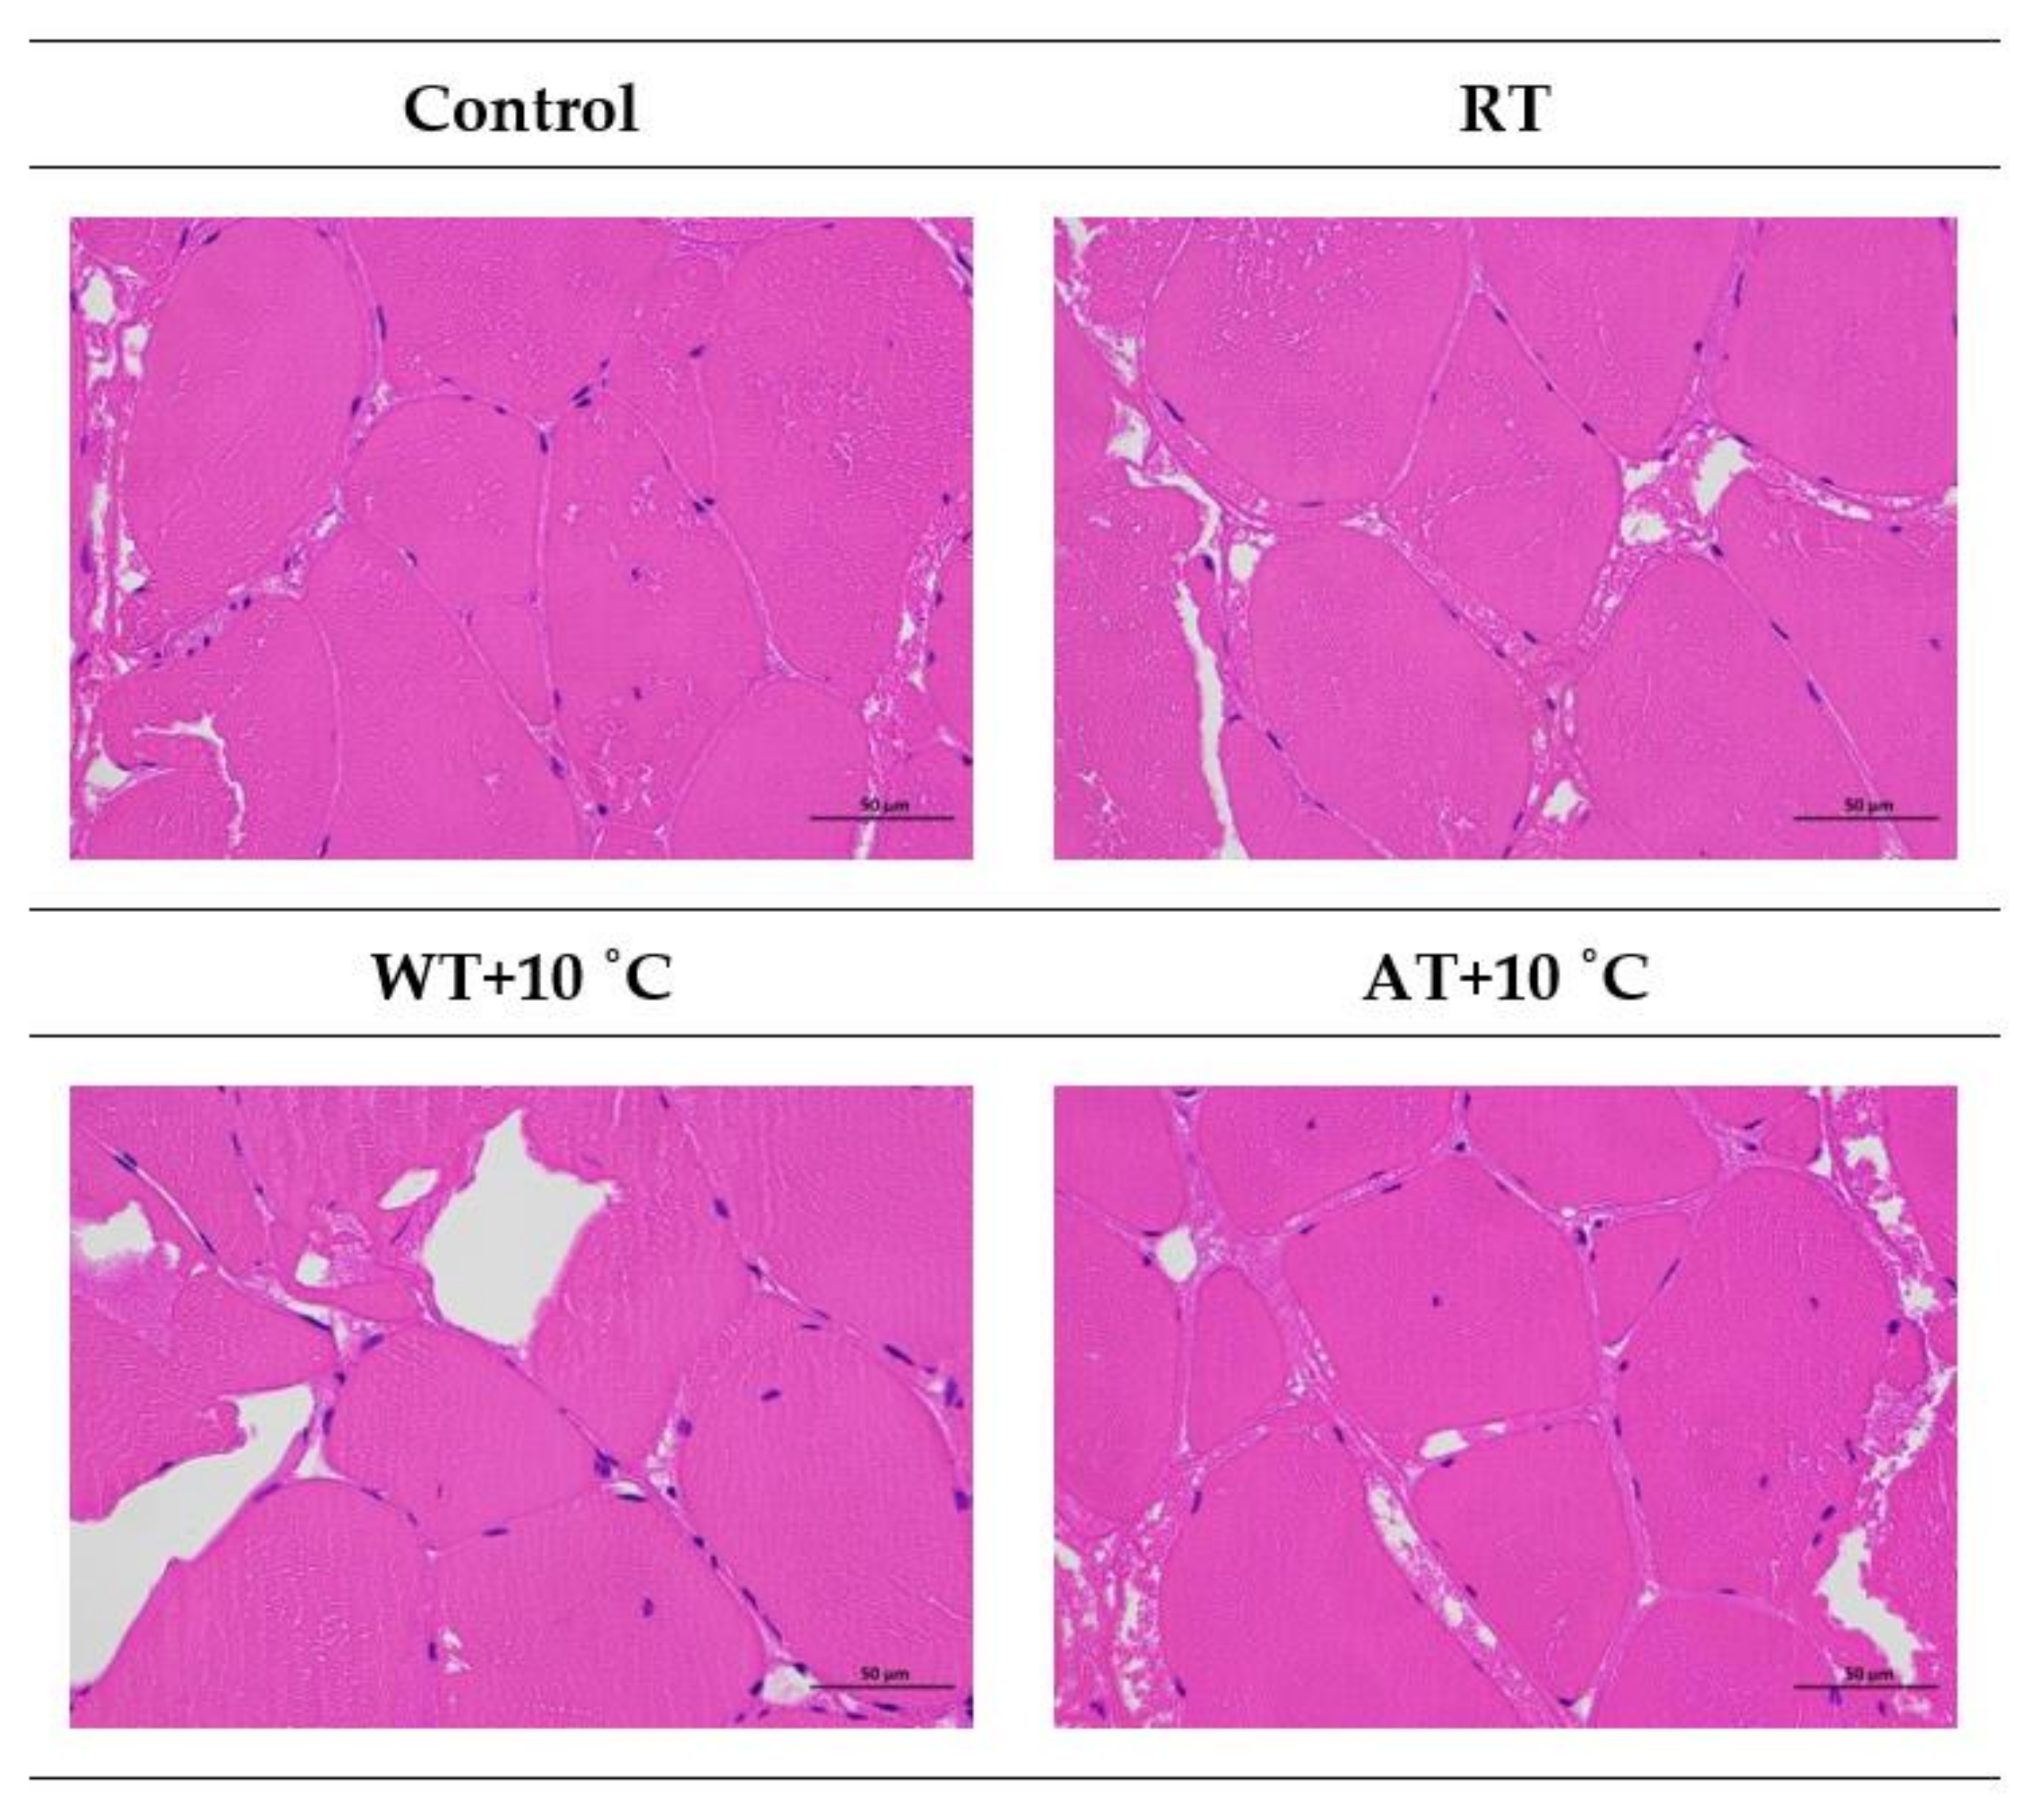
3.9. Microstructure
4. Conclusions
Author Contributions
Funding
Institutional Review Board Statement
Informed Consent Statement
Data Availability Statement
Conflicts of Interest
References
- Calder, P.C. Fatty acids and inflammation: The cutting edge between food and pharma. Eur. J. Pharmacol. 2011, 668, S50–S58. [Google Scholar] [CrossRef] [PubMed]
- Mozaffarian, D.; Wu, J.H. Omega-3 fatty acids and cardiovascular disease: Effects on risk factors, molecular pathways, and clinical events. J. Am. Coll. Cardiol. 2011, 58, 2047–2067. [Google Scholar] [CrossRef] [PubMed] [Green Version]
- Boonsumrej, S.; Chaiwanichsiri, S.; Tantratian, S.; Suzuki, T.; Takai, R. Effects of freezing and tempering on the quality changes of tiger shrimp (Penaeus monodon) frozen by air-blast and cryogenic freezing. J. Food Eng. 2007, 80, 292–299. [Google Scholar] [CrossRef]
- Li, D.; Jia, S.; Zhang, L.; Wang, Z.; Pan, J.; Zhu, B.; Luo, Y. Effect of using a high voltage electrostatic field on microbial communities, degradation of adenosine triphosphate, and water loss when tempering lightly-salted, frozen common carp (Cyprinus carpio). J. Food Eng. 2017, 212, 226–233. [Google Scholar] [CrossRef]
- Cui, Y.; Xuan, X.; Ling, J.; Liao, X.; Zhang, H.; Shang, H.; Lin, X. Effects of high hydrostatic pressure-assisted tempering on the physicohemical characteristics of silver pomfret (Pampus argenteus). Food Sci. Nutr. 2019, 7, 1573–1583. [Google Scholar] [CrossRef] [Green Version]
- Ersoy, B.; Aksan, E.; Ozeren, A. The effect of tempering methods on the quality of eels (Anguilla anguilla). Food Chem. 2008, 111, 377–380. [Google Scholar] [CrossRef]
- Cai, L.; Zhang, W.; Cao, A.; Cao, M. Effects of different tempering methods on the quality of largemouth bass (Micropterus salmonides). LWT Food Sci. Technol. 2020, 120, 108908. [Google Scholar] [CrossRef]
- Mousakhani-Ganjeh, A.; Hamdami, N.; Soltanizadeh, N. Impact of high voltage electric field tempering on the quality of frozen tuna fish (Thunnus albacares). J. Food Eng. 2015, 156, 39–44. [Google Scholar] [CrossRef]
- Mousakhani-Ganjeh, A.; Hamdami, N.; Soltanizadeh, N. Effect of high voltage electrostatic field tempering on the lipid oxidation of frozen tuna fish (Thunnus albacares). Innov. Food Sci. Emerg. Technol. 2016, 36, 42–47. [Google Scholar] [CrossRef]
- Li, X.; Sun, P.; Ma, Y.; Cai, L.; Li, J. Effect of ultrasonic thawing on the water holding capacity, physico-chemical properties, and structure of frozen tuna fish (Thunnus tonggol) myofibrillar proteins. J. Sci. Food Agric. 2019, 99, 5083–5091. [Google Scholar] [CrossRef]
- Zhu, S.; Ramaswamy, H.; Simpson, B. Effect of high-pressure versus conventional tempering on color, drip loss and texture of Atlantic salmon frozen by different methods. LWT Food Sci. Technol. 2004, 37, 291–299. [Google Scholar] [CrossRef]
- Anderson, B.A.; Singh, R.P. Modeling the tempering of frozen foods using air impingement technology. Int. J. Refrig. 2006, 29, 294–304. [Google Scholar] [CrossRef]
- Hafezparast-Moadab, N.; Hamdami, N.; Dalvi-Isfahan, M.; Farahnaky, A. Effects of radiofrequency-assisted freezing on microstructure and quality of rainbow trout (Oncorhynchus mykiss) fillet. Innovative Food Sci. Emerg. Technol. 2018, 47, 81–87. [Google Scholar] [CrossRef]
- Guo, C.; Wang, X.; Wang, Y. Dielectric properties of soy protein isolate dispersion and its temperature profile during radio frequency heating. J. Food Process. Preserv. 2018, 42, e13659. [Google Scholar] [CrossRef]
- Li, Y.; Zhou, L.; Chen, J.; Subbiah, J.; Chen, X.; Fu, H.; Wang, Y. Dielectric properties of chili powder in the development of radio frequency and microwave pasteurisation. Int. J. Food Prop. 2018, 20 (Suppl. S3), S3373–S3384. [Google Scholar] [CrossRef]
- Mao, Y.; Wang, P.; Wu, Y.; Hou, L.; Wang, S. Effects of various radio frequencies on combined drying and disinfestation treatments for in-shell walnuts. LWT Food Sci. Technol. 2021, 144, 111246. [Google Scholar] [CrossRef]
- Bedane, T.F.; Chen, L.; Marra, F.; Wang, S. Experimental study of radio frequency (RF) tempering of foods with movement on conveyor belt. J. Food Eng. 2017, 201, 17–25. [Google Scholar] [CrossRef]
- Nagaraj, G.; Singh, R.; Hung, Y.-C.; Mohan, A. Effect of radio-frequency on heating characteristics of beef homogenate blends. LWT Food Sci. Technol. 2015, 60, 372–376. [Google Scholar] [CrossRef]
- Piyasena, P.; Dussault, C.; Koutchma, T.; Ramaswamy, H.S.; Awuah, G.B. Radio frequency heating of foods: Principles, applications and related properties—A review. Crit. Rev. Food Sci. Nutr. 2003, 43, 587–606. [Google Scholar] [CrossRef]
- Yang, H.; Chen, Q.; Cao, H.; Fan, D.; Huang, J.; Zhao, J.; Zhang, H. Radiofrequency tempering of frozen minced fish based on the dielectric response mechanism. Innov. Food Sci. Emerg. Technol. 2019, 52, 80–88. [Google Scholar] [CrossRef]
- Farag, K.W.; Duggan, E.; Morgan, D.J.; Cronin, D.A.; Lyng, J.G. A comparison of conventional and radio frequency defrosting of lean beef meats: Effects on water binding characteristics. Meat Sci. 2009, 83, 278–284. [Google Scholar] [CrossRef]
- Llave, Y.; Terada, Y.; Fukuoka, M.; Sakai, N. Dielectric properties of frozen tuna and analysis of defrosting using a radio-frequency system at low frequencies. J. Food Eng. 2014, 139, 1–9. [Google Scholar] [CrossRef]
- Kim, J.; Park, J.W.; Park, S.; Choi, D.S.; Choi, S.R.; Kim, Y.H.; Cho, B.-K. Study of Radio Frequency Tempering for Cylindrical Pork Sirloin. J. Biosyst. Eng. 2016, 41, 108–115. [Google Scholar] [CrossRef] [Green Version]
- Palazoglu, T.K.; Miran, W. Experimental comparison of microwave and radio frequency tempering of frozen block of shrimp. Innov. Food Sci. Emerg. Technol. 2017, 41, 292–300. [Google Scholar] [CrossRef]
- Palazoğlu, T.K.; Miran, W. Experimental investigation of the effect of conveyor movement and sample’s vertical position on radio frequency tempering of frozen beef. J. Food Eng. 2018, 219, 71–80. [Google Scholar] [CrossRef]
- Li, Y.; Li, F.; Tang, J.; Zhang, R.; Wang, Y.; Koral, T.; Jiao, Y. Radio frequency tempering uniformity investigation of frozen beef with various shapes and sizes. Innov. Food Sci. Emerg. Technol. 2018, 48, 42–55. [Google Scholar] [CrossRef]
- Zhang, Y.; Li, F.; Yao, Y.; He, J.; Tang, J.; Jiao, Y. Effects of freeze-thaw cycles of Pacific white shrimp (Litopenaeus vannamei) subjected to radio frequency tempering on melanosis and quality. Innov. Food Sci. Emerg. Technol. 2021, 74, 102860. [Google Scholar] [CrossRef]
- Cai, L.; Zhang, W.; Cao, A.; Li, J. Effects of ultrasonics combined with far infrared or microwave tempering on protein denaturation and moisture migration of Sciaenops ocellatus (red drum). J. Ultrason. Sonochem. 2019, 55, 96–104. [Google Scholar] [CrossRef]
- Jiao, Y.; Tang, J.; Wang, Y.; Koral, T.L. Radio-Frequency Applications for Food Processing and Safety. J. Annu. Rev. Food Sci. Technol. 2018, 9, 105–127. [Google Scholar] [CrossRef] [Green Version]
- An, H.; Ma, H.; Ren, X. Relationship between electrical parameters and quality indexes during apple fruit storage. J. Food Sci. 2013, 34, 298–302. [Google Scholar]
- Zhou, S.; Zhang, H.; Li, H.; Ma, Q. Review of fruit nondestructive testing technology research based on the dielectric characteristics. Food Res. Dev. 2015, 36, 131–135. [Google Scholar]
- Li, X.; Kang, N.; Li, D.; Liu, X.; Jia, Y.; Li, F.; Wang, Y.; Pan, Z. Correlation between dielectric characteristics and storage time of goji berry fruit. Agric. Mech. Res. 2015, 6, 136–139. [Google Scholar]
- Jin, Y.; Wang, H.; Yang, N. Effect of low frequency band on dielectric properties of eggs during storage. Chin. J. Food Sci. 2015, 15, 220–225. [Google Scholar]
- Guo, W.; Zhu, X.; Liu, H.; Yue, R.; Wang, S. Effects of milk concentration and freshness on microwave dielectric properties. J. Food Eng. 2010, 99, 344–350. [Google Scholar] [CrossRef]
- Castro-Giráldez, M.; Toldrá, F.; Fito, P. Low frequency dielectric measurements to assess post-mortem ageing of pork meat. J. LWT Food Sci. Technol. 2011, 44, 1465–1472. [Google Scholar] [CrossRef]
- Wang, Y.; Tang, J.; Rasco, B.; Kong, F.; Wang, S. Dielectric properties of salmon fillets as a function of temperature and composition. J. Food Eng. 2008, 87, 236–246. [Google Scholar] [CrossRef]
- Lau, S.K.; Subbiah, J. An automatic system for measuring dielectric properties of foods: Albumen, yolk, and shell of fresh eggs. J. Food Eng. 2018, 223, 79–90. [Google Scholar] [CrossRef]
- Chen, Y.; He, J.; Li, F.; Tang, J.; Jiao, Y. Model food development for tuna (Thunnus Obesus) in radio frequency and microwave tempering using grass carp mince. J. Food Eng. 2021, 292, 110267. [Google Scholar] [CrossRef]
- Xia, X.; Kong, B.; Liu, J.; Diao, X.; Liu, Q. Influence of different tempering methods on physicochemical changes and protein oxidation of porcine longissimus muscle. LWT Food Sci. Technol. 2012, 46, 280–286. [Google Scholar] [CrossRef]
- Zhu, Y.; Li, F.; Tang, J.; Wang, T.; Jiao, Y. Effects of radio frequency, air and water tempering, and different end-point tempering temperatures on pork quality. J. Food Process Eng. 2019, 42, e13026. [Google Scholar] [CrossRef]
- Xuan, X.; Cui, Y.; Lin, X.; Yu, J.; Liao, X.; Ling, J.; Shang, H. Impact of high hydrostatic pressure on the shelling efficacy, physicochemical properties, and microstructure of fresh razor clam (Sinonovacula constricta). J. Food Sci. 2018, 83, 284–293. [Google Scholar] [CrossRef]
- Siró, I.; Vén, C.; Balla, C.; Jónás, G.; Zeke, I.; Friedrich, L. Application of an ultrasonic assisted curing technique for improving the diffusion of sodium chloride in porcine meat. J. Food Eng. 2009, 91, 353–362. [Google Scholar] [CrossRef]
- Rahbari, M.; Hamdami, N.; Mirzaei, H.; Jafari, S.M.; Kashaninejad, M.; Khomeiri, M. Effects of high voltage electric field tempering on the characteristics of chicken breast protein. J. Food Eng. 2018, 216, 98–106. [Google Scholar] [CrossRef]
- McDonnell, C.K.; Allen, P.; Morin, C.; Lyng, J.G. The effect of ultrasonic salting on protein and water-protein interactions in meat. Food Chem. 2014, 147, 245–251. [Google Scholar] [CrossRef]
- Carr, H.Y.; Purcell, E.M. Effects of Diffusion on Free Precession in Nuclear Magnetic Resonance Experiments. Phys. Rev. 1954, 94, 630–638. [Google Scholar] [CrossRef]
- Meiboom, S.; Gill, D. Modified Spin-Echo Method for Measuring Nuclear Relaxation Times. Rev. Sci. Instrum. 1958, 29, 688–691. [Google Scholar] [CrossRef] [Green Version]
- Ida, G.; Aursand, L.G.-J.; Ulf, E.D.; Axelson, E.; Turid, R. Water Distribution in Brine Salted Cod (Gadus morhua) and Salmon (Salmo salar): A Low-Field 1H NMR Study. J. Agric. Food Chem. 2008, 56, 6252–6260. [Google Scholar]
- Jiang, Q.; Jia, R.; Nakazawa, N.; Hu, Y.; Osako, K.; Okazaki, E. Changes in protein properties and tissue histology of tuna meat as affected by salting and subsequent freezing. Food Chem. 2019, 271, 550–560. [Google Scholar] [CrossRef]
- Kannan, S.; Dev, S.R.S.; Gariepy, Y.; Raghavan, G.S.V. Effect of radiofrequency heating on the dielectric and physical properties of eggs. Prog. Electr. Res. 2013, 51, 201–220. [Google Scholar] [CrossRef] [Green Version]
- Wang, Y.; Tang, J.; Rasco, B.; Wang, S.; Alshami, A.A.; Kong, F. Using whey protein gel as a model food to study dielectric heating properties of salmon (Oncorhynchus gorbuscha) fillets. LWT Food Sci. Technol. 2009, 42, 1174–1178. [Google Scholar] [CrossRef]
- Guan, D.; Cheng, M.; Wang, Y.; Tang, J. Dielectric properties of mashed potatoes relevant to Microwave and Radio frequency Pasteurization and Sterilization Processes. J. Food Sci. 2004, 69, FEP30–FEP37. [Google Scholar]
- Choi, E.J.; Park, H.W.; Chung, Y.B.; Park, S.H.; Kim, J.S.; Chun, H.H. Effect of tempering methods on quality changes of pork loin frozen by cryogenic immersion. Meat Sci. 2017, 124, 69–76. [Google Scholar] [CrossRef]
- Brown, T.; James, S.J. The effect of air temperature, velocity and visual lean (VL) composition on the tempering times of frozen boneless beef blocks. Meat Sci. 2006, 73, 545–552. [Google Scholar] [CrossRef]
- Uyar, R.; Bedane, T.F.; Erdogdu, F.; Koray Palazoglu, T.; Farag, K.W.; Marra, F. Radio-frequency tempering of food products—A computational study. J. Food Eng. 2015, 146, 163–171. [Google Scholar] [CrossRef]
- Li, X.; Sun, P.; Jia, J.; Cai, L.; Li, J.; Lv, Y. Effect of low frequency ultrasound tempering method on the quality characteristics of Peru squid (Dosidicus gigas). Food Sci. Technol. Int. 2018, 25, 171–181. [Google Scholar] [CrossRef]
- Jiao, Y.; Tang, J.; Wang, S.; Koral, T. Influence of dielectric properties on the heating rate in free-running oscillator radio frequency systems. J. Food Eng. 2014, 120, 197–203. [Google Scholar] [CrossRef]
- Singh, R.P.; Heldman, D.R. Chapter 4—Heat Transfer in Food Processing. In Introduction to Food Engineering, 5th ed.; Singh, R.P., Heldmanm, D.R., Eds.; Academic Press: Cambridge, MA, USA, 2014; pp. 265–419. [Google Scholar]
- Xia, X.; Kong, B.; Xiong, Y.; Ren, Y. Decreased gelling and emulsifying properties of myofibrillar protein from repeatedly frozen-thawed porcine longissimus muscle are due to protein denaturation and susceptibility to aggregation. Meat Sci. 2010, 85, 481–486. [Google Scholar] [CrossRef]
- He, X.; Liu, R.; Nirasawa, S.; Zheng, D.; Liu, H. Effect of high voltage electrostatic field treatment on tempering characteristics and post-tempering quality of frozen pork tenderloin meat. J. Food Eng. 2013, 115, 245–250. [Google Scholar] [CrossRef]
- Ke, P.J.; Cervantes, E.; Robles-Martinez, C. Determination of thiobarbituric acid reactive substances (TBARS) in fish tissue by an improved distillationspectrophotometric method. J. Sci. Food Agric. 1984, 35, 1248–1254. [Google Scholar] [CrossRef]
- Cao, M.; Cao, A.; Wang, J.; Cai, L.; Regenstein, J.; Ruan, Y.; Li, X. Effect of magnetic nanoparticles plus microwave or far-infrared tempering on protein conformation changes and moisture migration of red seabream (Pagrus Major) fillets. Food Chem. 2018, 266, 498–507. [Google Scholar] [CrossRef]
- Zheng, H.; Xiong, G.; Han, M.; Deng, S.; Xu, X.; Zhou, G. High pressure/thermal combinations on texture and water holding capacity of chicken batters. Innov. Food Sci. Emerg. Technol. 2015, 30, 8–14. [Google Scholar] [CrossRef]
- McDonnell, C.K.; Allen, P.; Duggan, E.; Arimi, J.M.; Casey, E.; Duane, G.; Lyng, J.G. The effect of salt and fibre direction on water dynamics, distribution and mobility in pork muscle: A low field NMR study. Meat Sci. 2013, 95, 51–58. [Google Scholar] [CrossRef] [PubMed]
- Zhang, M.; Li, F.; Diao, X.; Kong, B.; Xia, X. Moisture migration, microstructure damage and protein structure changes in porcine longissimus muscle as influenced by multiple freeze-thaw cycles. Meat Sci. 2017, 133, 10–18. [Google Scholar] [CrossRef] [PubMed]


| T (°C) | Parameters | 13.56 MHz | 27.12 MHz | 40.68 MHz |
|---|---|---|---|---|
| −20 | ε′ | 11.25 ± 0.31 Ad | 7.54 ± 0.02 Bb | 2.64 ± 0.03 Cc |
| ε″ | 6.10 ± 0.17 Af | 2.82 ± 0.09 Bh | 1.65 ± 0.04 Ch | |
| dp/cm | 200.41 Aa | 174.53 Ba | 120.56 Ca | |
| −15 | ε′ | 15.39 ± 0.06 Ad | 10.16 ± 0.02 Bb | 4.79 ± 0.11 Cbc |
| ε″ | 14.17 ± 0.26 Af | 6.81 ± 0.12 Bh | 3.24 ± 0.56 Ch | |
| dp/cm | 105.97 Ab | 86.56 Bb | 83.45 Bb | |
| −10 | ε′ | 24.13 ± 0.08 Ad | 13.76 ± 3.23 Bb | 11.41 ± 3.45 Bb |
| ε” | 45.05 ± 4.37 Af | 15.74 ± 6.78 Bg | 9.93 ± 5.09 Bg | |
| dp/cm | 47.96 Ac | 46.58 ABc | 43.09 Bc | |
| −5 | ε′ | 97.36 ± 5.99 Ac | 71.42 ± 4.88 Ba | 63.91 ± 4.04 Ba |
| ε″ | 432.35 ± 23.38 Ae | 203.89 ± 8.03 Bf | 140.43 ± 4.94 Cf | |
| dp/cm | 13.40 Ad | 10.36 ABd | 8.73 Bd | |
| 0 | ε′ | 101.15 ± 8.35 Abc | 72.07 ± 5.54 Ba | 64.55 ± 4.52 Ba |
| ε″ | 498.56 ± 27.76 Ade | 233.50 ± 8.69 Be | 159.66 ± 5.30 Ce | |
| dp/cm | 12.34 Ad | 9.49 ABd | 8.00 Bd | |
| 5 | ε′ | 104.74 ± 9.50 Abc | 73.43 ± 6.08 Ba | 65.69 ± 4.72 Ba |
| ε″ | 572.69 ± 45.01 Acd | 266.26 ± 5.47 Bd | 182.33 ± 2.95 Cd | |
| dp/cm | 11.40 Ad | 8.75 Ad | 7.34 Ad | |
| 10 | ε′ | 111.48 ± 9.21 Aabc | 75.22 ± 6.37 Ba | 66.91 ± 4.57 Ba |
| ε″ | 648.70 ± 53.84 Abc | 300.79 ± 5.09 Bc | 205.87 ± 2.40 Cc | |
| dp/cm | 10.65 Ad | 8.13 Ad | 6.79 Ad | |
| 15 | ε′ | 115.91 ± 11.57 Aab | 77.10 ± 7.08 Ba | 68.21 ± 4.92 Ba |
| ε″ | 722.13 ± 61.82 Aab | 335.76 ± 3.99 Bb | 229.94 ± 1.74 Cb | |
| dp/cm | 10.04 Ad | 7.62 Ad | 6.34 Ad | |
| 20 | ε′ | 122.97 ± 13.03 Aa | 79.27 ± 8.01 Ba | 69.65 ± 5.44 Ba |
| ε″ | 804.56 ± 74.99 Aa | 373.25 ± 2.63 Ba | 256.32 ± 0.80 Ca | |
| dp/cm | 9.48 Ad | 7.16 Ad | 5.93 Ad |
| Treatments | Views | Maximum Temperature/(°C) | Minimum Temperature/(°C) | Standard Deviation/(°C) |
|---|---|---|---|---|
| RT | top | 7.3 | −5.2 | ±1.1 |
| bottom | 13.4 | −0.6 | ±2.2 | |
| WT + 10 °C | top | 11.8 | 3.7 | ±0.9 |
| bottom | 8.4 | −0.5 | ±1.1 | |
| AT + 10 °C | top | 7.2 | 3.3 | ±0.5 |
| bottom | 2.2 | −3.9 | ±0.6 |
| Treatments | Drip Loss/(%) | Cooking Loss/(%) |
|---|---|---|
| Control | - | 11.34 ± 0.02 b |
| RT | 0.66 ± 0.052 b | 13.58 ± 0.63 ab |
| WT + 10 °C | 1.029 ± 0.050 a | 15.75 ± 0.06 a |
| AT + 10 °C | 0.43 ± 0.021 b | 12.26 ± 0.48 b |
| Treatments | L* | a* | b* | ΔE |
|---|---|---|---|---|
| Control | 42.27 ± 0.48 b | 14.29 ± 0.33 a | 13.88 ± 0.32 a | - |
| RT | 44.46 ± 0.94 a | 13.57 ± 0.83 a | 12.14 ± 0.85 b | 2.89 |
| WT + 10 °C | 44.74 ± 0.32 a | 13.35 ± 0.73 a | 12.80 ± 0.52 ab | 2.85 |
| AT + 10 °C | 43.34 ± 1.00 a | 14.41 ± 0.23 a | 12.10 ± 0.60 b | 2.08 |
| Treatment | T1max/°C | ΔH1/(J/g) | T2max/°C | ΔH2/(J/g) | T3max/°C | ΔH3/(J/g) |
|---|---|---|---|---|---|---|
| Control | 58.18 ± 0.82 a | 0.0779 ± 0.002 a | 67.88 ± 0.38 a | 0.0962 ± 0.001 a | 77.27 ± 0.06 a | 0.2315 ± 0.003 a |
| RT | 57.24 ± 0.36 b | 0.0662 ± 0.004 b | 67.51 ± 0.23 a | 0.0928 ± 0.001 ab | 76.56 ± 0.12 a | 0.2309 ± 0.002 a |
| WT + 10 °C | 56.93 ± 0.14 b | 0.0623 ± 0.005 b | 67.04 ± 0.19 a | 0.0890 ± 0.003 b | 76.55 ± 0.23 a | 0.2200 ± 0.006 a |
| AT + 10 °C | 57.88 ± 0.17 a | 0.0718 ± 0.003 a | 67.75 ± 0.21 a | 0.0941 ± 0.002 ab | 77.10 ± 0.24 a | 0.2307 ± 0.004 a |
Publisher’s Note: MDPI stays neutral with regard to jurisdictional claims in published maps and institutional affiliations. |
© 2022 by the authors. Licensee MDPI, Basel, Switzerland. This article is an open access article distributed under the terms and conditions of the Creative Commons Attribution (CC BY) license (https://creativecommons.org/licenses/by/4.0/).
Share and Cite
Han, R.; He, J.; Chen, Y.; Li, F.; Shi, H.; Jiao, Y. Effects of Radio Frequency Tempering on the Temperature Distribution and Physiochemical Properties of Salmon (Salmo salar). Foods 2022, 11, 893. https://doi.org/10.3390/foods11060893
Han R, He J, Chen Y, Li F, Shi H, Jiao Y. Effects of Radio Frequency Tempering on the Temperature Distribution and Physiochemical Properties of Salmon (Salmo salar). Foods. 2022; 11(6):893. https://doi.org/10.3390/foods11060893
Chicago/Turabian StyleHan, Rong, Jialing He, Yixuan Chen, Feng Li, Hu Shi, and Yang Jiao. 2022. "Effects of Radio Frequency Tempering on the Temperature Distribution and Physiochemical Properties of Salmon (Salmo salar)" Foods 11, no. 6: 893. https://doi.org/10.3390/foods11060893
APA StyleHan, R., He, J., Chen, Y., Li, F., Shi, H., & Jiao, Y. (2022). Effects of Radio Frequency Tempering on the Temperature Distribution and Physiochemical Properties of Salmon (Salmo salar). Foods, 11(6), 893. https://doi.org/10.3390/foods11060893