Article

Nutritional Characterization of Strychnos madagascariensis Fruit Flour Produced by Mozambican Communities and Evaluation of Its Contribution to Nutrient Adequacy

1
Faculdade de Ciências da Nutrição e Alimentação da Universidade do Porto, 4150-180 Porto, Portugal
2
LAQV/REQUIMTE, Laboratório de Bromatologia e Hidrologia, Departamento de Ciências Químicas, Faculdade de Farmácia da Universidade do Porto, 4050-313 Porto, Portugal
3
Departamento de Engenharia Rural, Faculdade de Agronomia e Engenharia Florestal, Universidade Eduardo Mondlane, Maputo 257, Mozambique
4
Department of Environmental Health, School of Health, P. Porto, 4200-072 Porto, Portugal
5
LAQV/REQUIMTE, Laboratório de Química Aplicada, Departamento de Ciências Químicas, Faculdade de Farmácia da Universidade do Porto, 4050-313 Porto, Portugal
6
Departamento de Engenharia Química, Faculdade de Engenharia, Universidade Eduardo Mondlane, Maputo 257, Mozambique
*
Author to whom correspondence should be addressed.
Foods 2022, 11(4), 616; https://doi.org/10.3390/foods11040616
Submission received: 2 February 2022 / Revised: 15 February 2022 / Accepted: 16 February 2022 / Published: 21 February 2022
(This article belongs to the Special Issue Trace Elements as Contaminants and Nutrients)

Abstract

:
The indigenous fruit Strychnos madagascariensis is usually processed to flour, called nfuma, being highly consumed during staple food shortage. This study aimed to evaluate the nutritional composition of nfuma and its nutrient adequacy. Flours from four districts of Mozambique were analyzed using AOAC methods for proximate composition, HPLC for sugar, amino acids (AA), vitamin E and carotenoids and ICP-MS and FAAS for minerals. The results showed that nfuma stands out for its high content of fat (26.3–27.8%), mainly oleic acid, fiber (>6%), vitamin E (6.7 to 8.0 mg/100 g) and carotenes (2.2 to 2.6 mg/100 g). The main amino acids of nfuma protein were Arg, Asp and Glu, and Lys was the limiting one. The mineral composition reveals K (~1200 to 1700 mg/100 g) as the main macromineral followed by Mg > Ca > Na. The main trace element was Mn (~4 mg/100 g) followed by Fe > Zn > Cu > Cr > Co. Aluminum (~3 mg/100 g) was the main non-essential element and Rb, Ni, Sr, Ba, V, Cd were also quantified. Assuming the daily consumption of 50 g, nfuma provides 82% of Vitamin A dietary reference value for toddlers, while the consumption of 100 g contributes to 132% and 60% of Mn and vitamin A DRV for adults, respectively. Despite the nutritional advantages of nfuma, this flour can be a source of Ni, highlighting the importance of the study of good practices in its preparation to decrease the exposure to non-essential elements.

1. Introduction

In recent years, the increase in knowledge about the protective role of fruits and vegetables has led to an increase in campaigns to promote their consumption for better health. Although fruits and vegetables can be consumed in natura, since fresh products are highly perishable, they can be processed to increase their shelf life and maintain (or even improve) their nutritional quality and sensory characteristics [1].
Indigenous fruits have been receiving considerable attention from the scientific community as they can be important contributors to the diet of people in developing countries, reducing nutritional deficiencies and food insecurity, as well as improving the health and economic status of those populations [2,3]. In addition, they can be exploited by the agro-industry and become a source of income for local communities in the future [4,5]. Indigenous fruits are easily accessible to the most vulnerable people because fruit trees are not farmed and often grow in forests and around homes and fields. However, in African countries, indigenous fruits are still underutilized, while several communities are food insecure and, consequently, malnourished [5,6,7,8].
Strychnos spp. (monkey orange) is an indigenous fruit tree known for its edible fruits and drought tolerance. However, it has been labeled as a “lost fruit”—fruit that have potential as food- and cash-crops, but little attention has been paid by scientists, policymakers, and the world at large [8]. Thus, little attention has been paid to its potential commercialization, due to limited knowledge and disseminated information compared to many other exotic fruits [9]. Despite some imprecision in species differentiation, five species are prevalent and most consumed in southern Africa (S. innocua, S. cocculoides, S. pungens S. spinosa, and S. madagascariensis). Due to their seasonality and high perishability, traditional fruit processing is a very common practice, in addition to their immediate consumption as fresh fruits, with S. madagascariensis and S. innocua being processed preferably into dry products [10]. Significant variations in the nutritional composition of these fruits have been reported in the literature, and scarce information is available concerning their processed products [9].
Mozambique has numerous native and exotic fruit species that are important for rural communities’ survival in times of food shortages. The S. madagascariensis fruit, known in southern Mozambique as “macuácua”, can be consumed immediately in natura, but it is usually processed into flour by local communities to increase the stability and shelf life of the fruit. Once harvested, the fruit pulp is first dried under the sun and roasted over a fire, and then ground to produce nfuma flour, which is consumed by local communities as a snack or as a complement of staple foods in times of food scarcity. However, there is practically no data on its nutritional value. Thus, this study aimed to evaluate the nutritional composition of nfuma, the fruit flour of S. madagascariensis, and its adequacy in terms of nutrients in light of current recommendations.

2. Materials and Methods

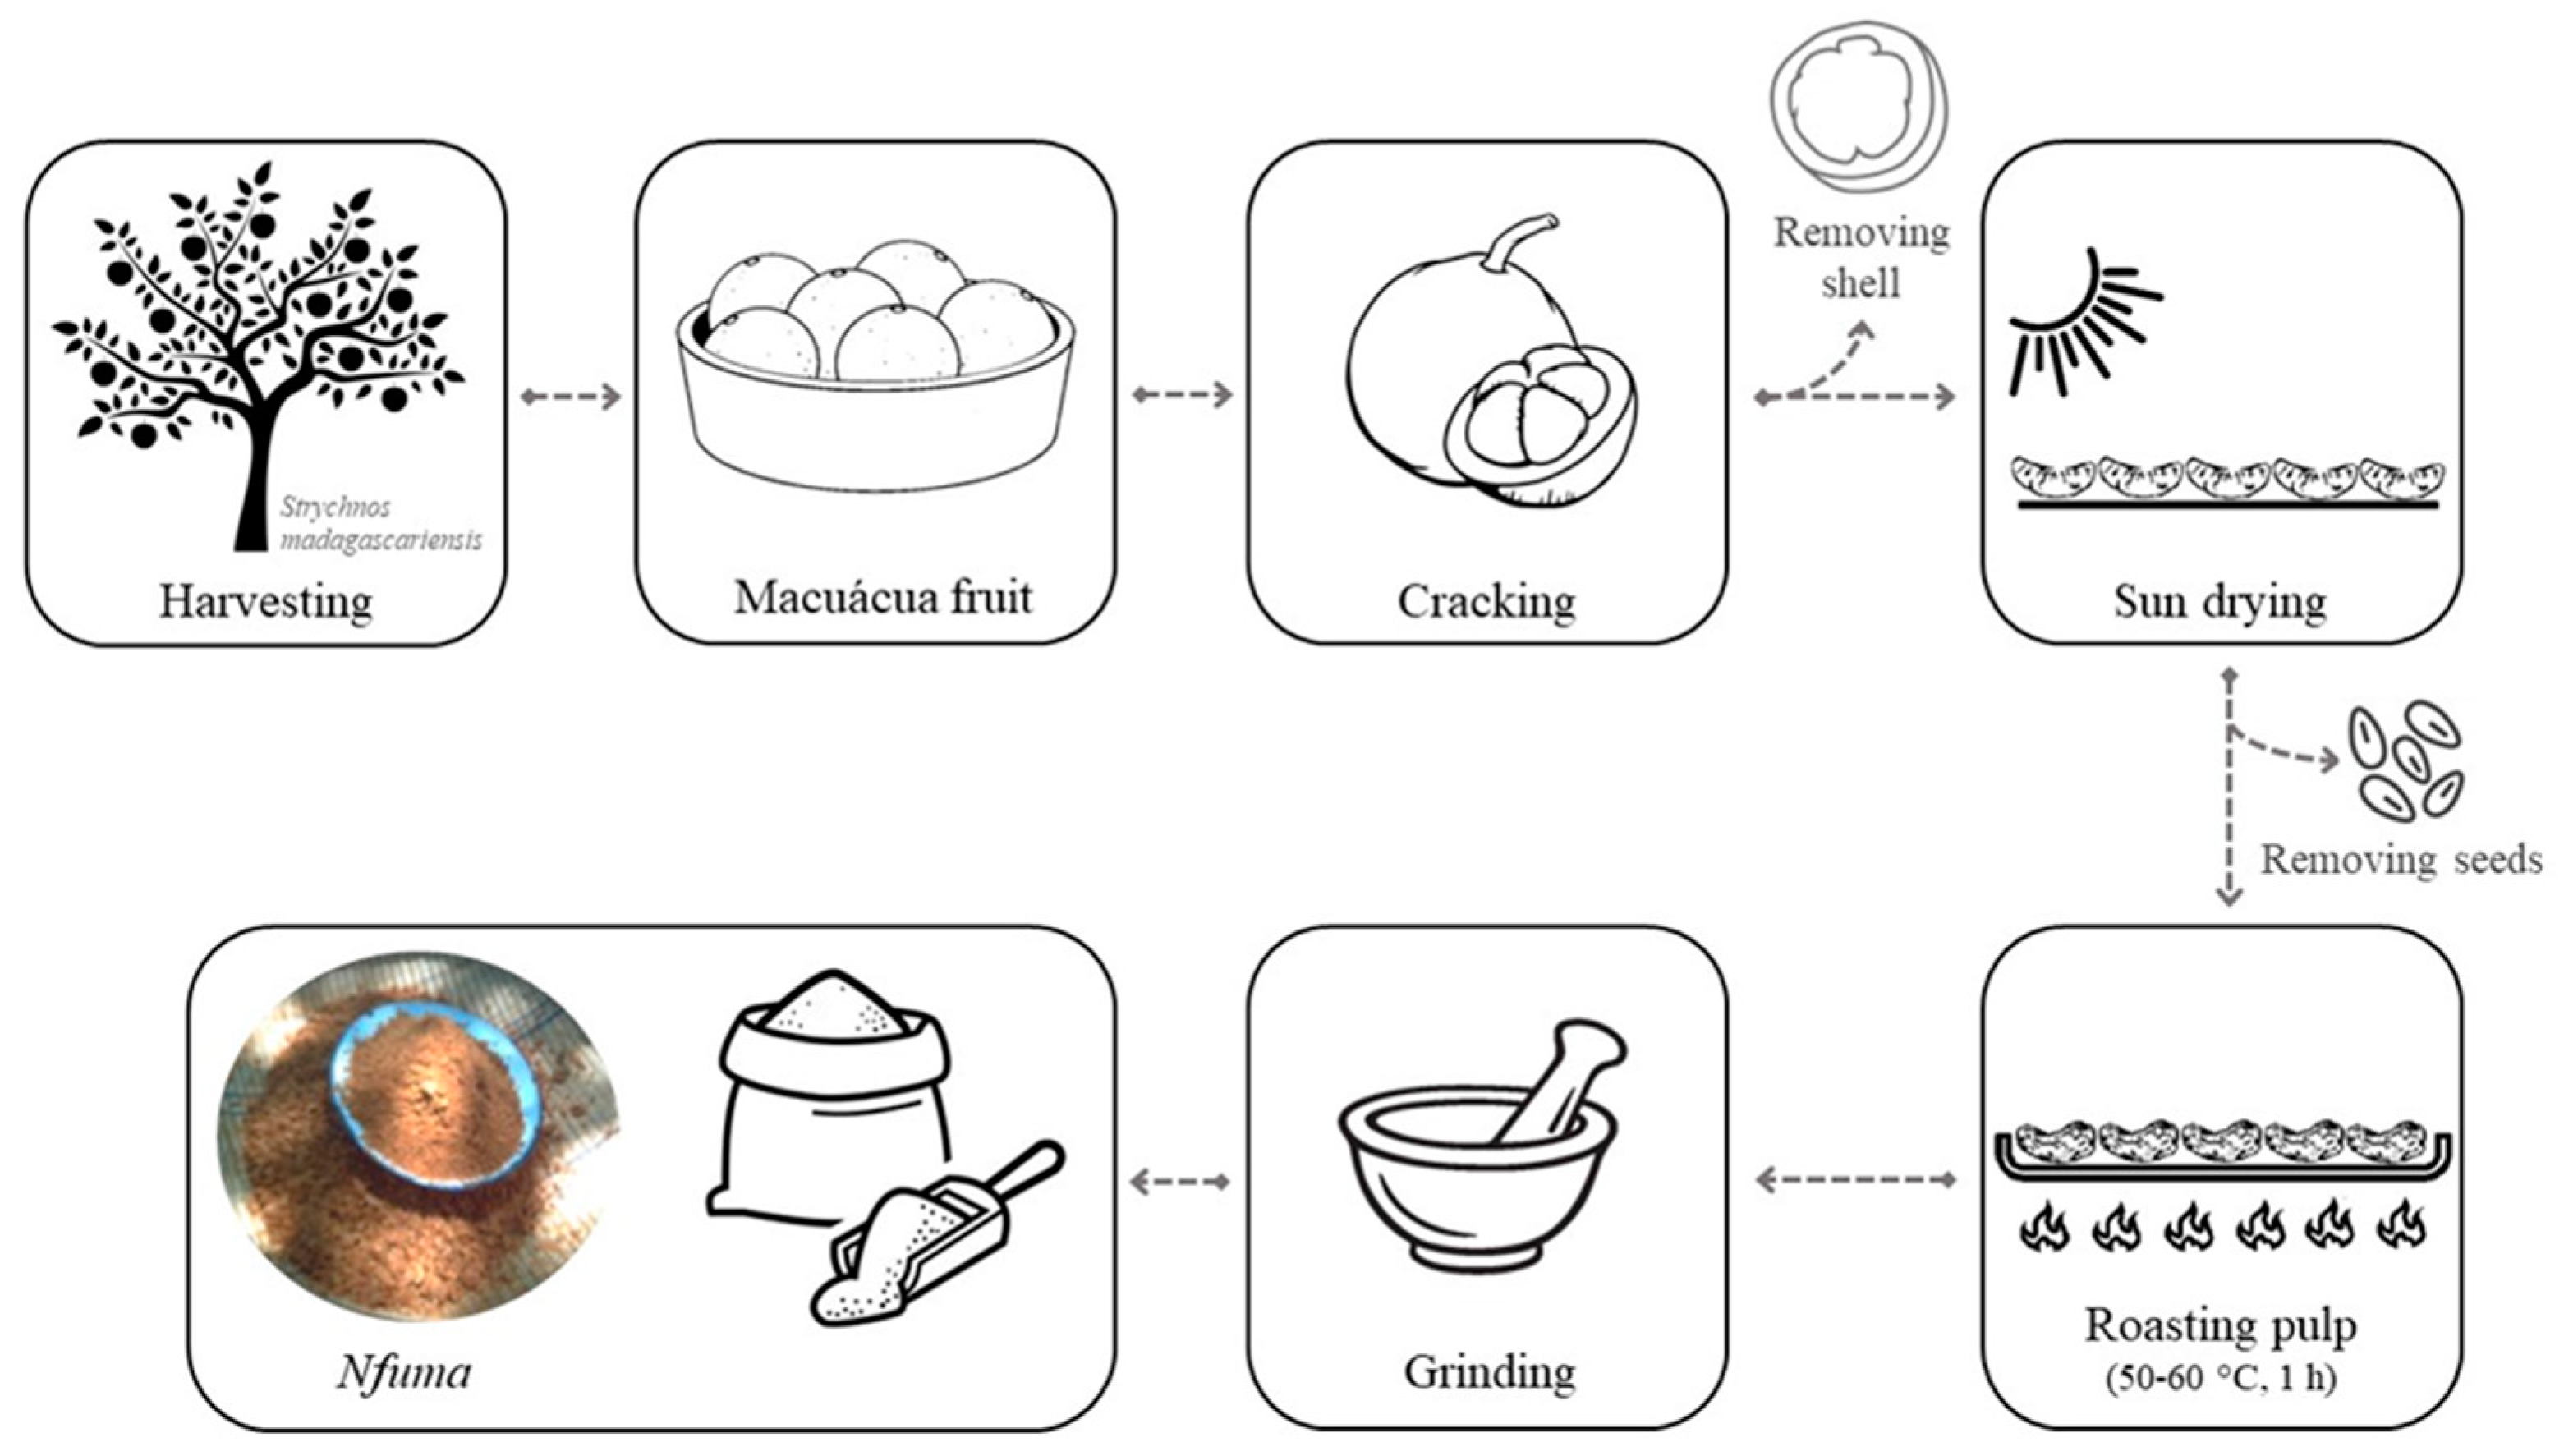
2.1. Fruit Collection and Flour Preparation

Fruit samples were collected by residents of four different districts (Marracuene, Manhiça, Chókwè and Chicualacuala) in southern Mozambique. A total of 480 fresh fruits, weighing 510 ± 75 g (n = 12 fruits, randomly selected), were harvested per region (eight randomly selected trees; 15 fruits per tree; three different times), during summer, from October to December. Nfuma was traditionally prepared by local residents. Briefly, 120 ripe fruits were broken and the orange pulp with seeds was left to dry in the sun (2 to 4 days), to facilitate the removal of the seeds. Then, the pulp was roasted at about 50–60 °C (temperature measured using a digital thermocouple with a surface probe), on a metal plate under fire, for about 1 h. The dried pulp was then ground into flour using a pestle and mortar, producing about 5 kg of flour. The process was repeated three independent times per region. A schematic description of the sampling methodology is provided in Figure 1.

2.2. Chemical Analysis

2.2.1. Proximate Analysis

Moisture, crude fat, protein and ash contents were determined according to the Association of Official Analytical Chemists (AOAC) methods 925.09, 920.39, 992.15 and 923.03, respectively [11]. Total dietary fiber was determined by the enzymatic-gravimetric method based on American Association of Cereal Chemists 32–05.01 method and AOAC 985.29 method, according to Martins et al. [12]. Carbohydrates were calculated by the differential method and the energy value was determined based on Regulation (EU) No 1169/2011 [13]. That is, the energy content was calculated from the amount of protein, fat, available carbohydrates and fiber using the factors 17, 37, 17 and 8 kJ per gram (4, 9, 4 and 2 kcal per gram), respectively.

2.2.2. Low Molecular Weight Carbohydrates Determination by HPLC-RI

The low molecular weight carbohydrates (mono and disaccharides) were determined by high-performance liquid chromatography with refractive index detection (HPLC-RI), as described by Santos et al. [14], with some modifications. Briefly, five hundred milligrams of flour were accurately weighed into a centrifuge tube. Prior to sugar extraction, the oil was removed from the flour with the aid of three 5 mL portions of hexane, discarded after centrifugation, and the solid residue was left under a nitrogen stream to evaporate the solvent. The defatted flour was then mixed with 5 mL of ethanol (50% v/v), for sugar extraction. The suspension was stirred for 30 s and the extraction was carried out in an ultrasonic bath (FungiLab, Barcelona, Spain) for 30 min at 50 °C. Thereafter, the mixture was centrifuged at 5000× g at 4 °C for 10 min and 2 mL of the supernatant were left under a nitrogen stream to reduce the ethanol fraction. The final volume was then rigorously adjusted to 2 mL with acetonitrile and allowed to stand for 20 min. The final solution was centrifuged at 5000× g for 10 min at 4 °C and filtered through a 0.22 μm PTFE filter prior to injection.

2.2.3. Fatty Acids Composition by GC-FID

The fatty acid composition of extractable lipids was evaluated as methyl esters derivatives by gas chromatography with flame ionization detection (GC-FID), using alkaline trans-esterification with methanolic potassium hydroxide, as detailed in Regulation EEC 2568/91 [15]. The analysis was performed using a Chrompack CP 9001 gas chromatograph (Middelburg, the Netherlands), equipped with a split–splitless injector, a flame ionization detector, an autosampler (Chrompack CP 9050) and a 50 m × 0.25 mm id fused silica capillary column coated with SelectFAME. Helium was used as carrier gas at an internal pressure of 120 kPa. The detector and injector temperatures were 250 and 230 °C, respectively. The results were initially expressed as a relative percentage of each fatty acid methyl ester, without discriminating positional and geometric isomers, calculated by internal normalization of the chromatographic peak areas after standardization of the detector response with the certified reference standard, and converted to the flour mass based on the determined fat content.

Atherogenicity and Thrombogenicity Indexes

The nutritional quality parameters atherogenic index (AI) and thrombogenic index (TI) were calculated according to [16]:
AI = C 12 : 0 + 4   ×   C 14 : 0 + C 16 : 0 MUFA + n 3   PUFA + n 6   PUFA
TI = C 14 : 0 + C 16 : 0 + C 18 : 0 0 . 5   ×   MUFA + 0 . 5   ×   n 6   PUFA + 3   ×   n 3   PUFA + n 3   PUFA n 6   PUFA  
where MUFA and PUFA correspond to monounsaturated and polyunsaturated fatty acids, respectively.

2.2.4. Analysis of Vitamin E and Carotenoids by HPLC-DAD/FLD

The vitamin E and total carotene contents of the lipid extract were determined by normal-phase high-performance liquid chromatography with diode-array and fluorescence detection (HPLC-DAD/FLD), as described in [17]. An exact amount of fat was dissolved in hexane, an appropriate volume of the internal standard solution (tocol) was added, and the mixture was homogenized by stirring. A normal phase silica column (Supelcosil TM LC-SI; 7.5 cm × 3 mm; 3 µm) (Supelco, Bellefonte, PA, USA), conditioned at 25 °C and eluted with a gradient of 1,4-dioxane in hexane at a flow rate of 0.75 mL/min was used. Detection was programmed for excitation at 290 nm and emission at 330 nm for tocols and 450 nm for carotenes. The different vitamin E compounds were identified by comparing retention times with standards, and quantified through individual calibration curves, being expressed in mg of tocopherol/100 g of flour. β-carotene was also quantified based on a calibration curve.

2.2.5. Amino Acid Composition by HPLC-FLD and Assessment of Protein Quality

Amino acids (Asp, Glu, Ser, Hi, Gly, Thr, Arg, Ala, Tyr, Val, Met, Phe, Ile, Leu, Lys, Pro, Trp, Cys, where Asp means aspartic acid/asparagine and Glu means glutamic acid/glutamine) were analyzed by HPLC-FLD, after hydrolysis and derivatization with 9-fluorenylmethyl chloroformate and O-phthaldialdehyde, according to Benhammouche et al. (2021). Briefly, about 100 mg of flour (±3.5 mg of protein) was weighed into a glass crimp vial. An amount of 10 mL of hydrochloric acid solution HCl 6 M containing 0.5% (w/v) phenol were added, sealed and the acid hydrolysis was performed at 110 °C for 24 h. An amount of 1 mL from the resulting hydrolysate was taken and neutralized with NaOH 6 N, and the final volume was made up to 10 mL with borate buffer (0.1 M). An amount of 32 µL of the neutralized solution was mixed with 8 µL of internal standard 250 µM (Norvaline) and 40 µL O-phthaldialdehyde and 20 µL 9-fluorenylmethyl chloroformate were added. Trp was determined separately using alkaline hydrolysis (NaOH 4.2 N, for 18 h at 110 °C). The resulting derivatization products were then subjected to HPLC analysis under the conditions detailed in [18]. Amino acids (AAs) content was reported as mg of AA/g protein.
In order to evaluate the quality of protein in nfuma, the essential amino acid profile (EAA) scores (EAAS) and EAA index (EAAI) were calculated using the following equations [19]:
EAAS = EAA test   protein   ( mg / g ) EAA reference   protein   ( mg / g )
EAAI = EAAS   1 × EAAS   2 × EAAS   3 × EAAS   n   n ×   100  
where n is the number of amino acids included in the calculation. The reference protein used was the FAO/WHO EAAS pattern from the joint [20].

2.2.6. Mineral Analysis

Mineral analysis was performed according to Pinto et al. [21]. Sample mineralization was performed by microwave-assisted closed-vessel acid digestion using an MLS-1200 Mega high-performance microwave digestion unit (Milestone, Sorisole, Italy) equipped with an HPR-1000/10 S rotor. Microminerals determination was performed by inductively coupled plasma-mass spectrometry (ICP-MS) using an iCAP™ Q instrument (Thermo Fisher Scientific, Bremen, Germany) and measuring the following elemental isotopes (m/z ratios): 7Li, 9Be, 27Al, 51V, 52Cr, 55Mn, 59Co, 60Ni, 65Cu, 66Zn, 75As, 82Se, 85Rb, 88Sr, 114Cd, 133Cs, 137Ba, 205Tl, 208Pb and 209Bi. The determination of Ca, Mg, Fe, Na and K was performed by flame atomic absorption spectroscopy (FAAS) using a PerkinElmer (Überlingen, Germany) AAnalyst 200 instrument. Limits of detection (LOD) and limits of quantification (LOQ) were estimated from the analysis of 10 digestion blanks. The results are presented in Supplementary Materials (Table S1). For quality control purposes, the certified reference material (CRM) IRMM 807 (rice flour, supplied by EC Institute for Reference Materials and Measurements, Geel, Belgium) and BCR 679 (white cabbage, supplied by EC Institute for Reference Materials and Measurements, Geel, Belgium) were analyzed under the same conditions as the samples. The results obtained were in good agreement with the certified values (recoveries ranging from 95.7% to 108.6%), proving that the method accuracy was adequate.

2.2.7. Estimated Intake of Nutrients and Non-Essential Elements

Evaluation of Nutrient Adequacy

The estimated daily intake (EDI) of nutrients and energy, as % of EFSA dietary reference values (DRVs) [22], was calculated assuming an average daily consumption of 100 g of nfuma. DRVs include a set of nutrient reference values: population reference intakes (PRIs), average requirements (ARs), adequate intakes (AIs) and reference intake (RIs). For nutrients that have both PRI and AR, the EDI was calculated based on PRI, since it corresponds to the intake level that meets the needs of all people in a population [22]. Regarding energy, the AR for adults with a physical activity level (PAL) between 1.4 and 2.0 was calculated as the mean value of AR for all age groups between 18 and 79 years. The AI and AR (g/day) for macronutrients were calculated based on the lower and upper limit of AR range for energy.

Estimated Intake of Non-Essential Elements

The estimated intake (EI) was calculated based on the elemental content (Celement: µg/g), the average per capita consumption of nfuma (Cnfuma: g) and the adult and toddlers standard human body weight (bw) of 70 and 12 kg [23], respectively, according to the following formula:
EI = C element   ×   C n f u m a bw
The estimated daily intake (EDI: µg/day/kg bw) of Ni, weekly intake (EWI: µg/week/kg bw) of Al and monthly intake (EMI: µg/month/kg bw) of Cd were calculated assuming a Cnfuma of 100 g, 700 g and 3000 g, respectively.
The obtained EI were expressed as % of the toxicological guidance levels for exposure assessment, namely the tolerable daily intake (TDI) [24], the provisional tolerable weekly intake (PTWI) and provisional tolerable monthly intake (PTMI) [25], for Ni, Al, Cd, respectively.

2.2.8. Statistical Analysis

All samples were prepared and analyzed in triplicate. Data were tested for normal distribution of the residuals with Shapiro–Wilk test. The existence of statistically significant differences between means was studied using one-way analysis of variance (ANOVA), when the normal distribution of residuals was confirmed. Welch correction was applied when the homogeneity of variances was not verified. Whenever statistical significance was found, Tukey’s or Tamhane’s T2 post hoc tests were applied to compare the means, depending, respectively, on equal variance or not. All these statistical analyses were conducted with the XLSTAT for Windows version 2014.5 (Addinsoft, Paris, France) at the 0.05 significance level.

3. Results and Discussion

3.1. Proximate Composition, Energy Value and Sugar Profile

The macronutrient composition of S. madagascariensis fruit flour (nfuma) is presented in Table 1. The main component was available carbohydrates (49.7–54.9%), followed by fat (26.3–27.8%), total fiber (5.8–10.8%), ash (4.8–6.0%), moisture (~4%) and protein (~3%). Nfuma provides an energy value of approximately 475–490 kcal/100 g of flour.
The moisture content of nfuma ranged from 4.4 to 4.6%, with no significant differences between the different origins (districts). Nfuma showed a low moisture content when compared to cereal flours such as maize and wheat (~13.4) [26]. Compared to commercial fruit flours, it presented a higher content than coconut flour (3.8%), but lower than grape (5%) and other fruit flours (up to 12.2%). The low moisture content of nfuma, together with proper packaging, minimizes the risk of microbiological contamination as well as product deterioration during storage, while also improving shelf life.
Protein (3.0–3.5%) was the macronutrient found in the lowest content, similar to flours from other fruits such as green bananas (3.4%) [1] and other common fruits, as described by Carli et al. [27] for 10 different commercial fruit flours (1.59–6.59%). Regarding Strychnos spp, Ngadze et al. [9] reported a low protein content for monkey orange, especially for S. innocua (0.3–11.5%). [28] also found low protein contents in indigenous fruits (1.3–3.7% dw), reporting 3.3% for S. spinosa.
Nfuma has a high-fat content (26.3–27.8%) (Table 1), with the flour originating in Manhiça having the highest value (p < 0.05), with no significant differences between flour from other communities. The fat content of nfuma is higher than the values reported by Ngadze et al. [9] for all Strychnos spp. (0.3–20%), except for S. spinosa, where a content of 31.2% dw was reported [29], which was considered an outlier [9]. This flour has an unusual high fat content, even when compared with flours from fat-rich fruits, such as coconut and nuts, because those are by-products of the oil/vegetable milk extraction process [30].
The fixed residue (ash) in nfuma ranged from 4.8 to 6.0%. The values obtained are similar to those described for S. innocua (4.7%) [31]. Compared to commercial fruit flours studied by Carli et al. [27], passion fruits, papaya and açai presented values (4.9–6.5%) in the same range of nfuma.
The most abundant macronutrient of nfuma was carbohydrate (~60%). Available carbohydrates varied from 49.7 to 54.9%, with the lowest content found in Chókwè and the highest in Marracuene flour. This value is lower than >80% of total carbohydrates found in other flours, such as cereal and cassava flours [26] or unripe banana and sweet potato flours [32]. In relation to Strychnos Spp, lower values of total carbohydrates were described in the Ngadze et al. review [9]; however, Kalenga Saka and Msonthi [29] described a total carbohydrate value of 61% dw in S. innocua. Regarding the free sugars, which together represent ~10% of flour mass, fructose and glucose are the ones present in higher levels, ranging between 3.3–4.3% and 3.7–5.0%, respectively, while sucrose represents only 1.4–1.9% of the flour. No significant differences (p < 0.05) were observed between sugars profiles of flours from different communities. The total fiber content of nfuma varies significantly between communities, with Marracuene flour having the lowest content of total fiber (5.8%) and Chókwè flour the highest one (10.8%). In fact, the highest soluble fiber content in Chókwè (3.9% vs. 0.6–1.4%) is responsible for the higher total fiber content of these flour, since the insoluble fiber value is similar in all flours (5.2–6.9%). Ngadze et al. [9], reported lower values of total carbohydrates for Strychnos spp. (S. innocua and S. spinosa, S. cocculoides and S. pungens), however Kalenga Saka and Msonth [29] and Lockett et al. [33] described a total carbohydrate value of ~60% for S. innocua and S. spinosa, respectively. Regarding the sugar profile, the higher ratio of monosaccharides/sucrose agrees with [34], wherein most of the indigenous South African fruits were monosaccharides dominant. This pattern was also observed in several dried fruits [35].
Given the total fiber content (ranging between 6 and 11%), nfuma can be considered as a food “high in fiber”, according to Regulation (EC) No. 1924/2006 [36], a claim which “may only be made where the product contains at least 6 g of fiber per 100 g”. Compared with cassava four (1.6%) and corn flour (2.6%) [18], nfuma stands out for its high fiber content. In the study by Carli et al. [27], only coconut (9.4%) and orange (7.6%) flours had similarly high fiber contents. The other fruit flours studied had fiber contents between 2.0–4.9%. Ngadze et al. [9] describe a fiber content of 2.5–22.2% dry weight basis (dw) for other Strychnos spp, with the mean fiber content of S. innocua (9.4%) the most similar to nfuma, the S. madagascariensis flour.

3.2. Fatty Acids Composition and Atherogenic and Thrombogenic Indices

Nfuma has a high percentage of monounsaturated fatty acids-MUFA (~17 g/100 g of flour; ~65% of total fatty acids), followed by saturated fatty acids-SFA (~7 g/100 g; ~25% of total fatty acids) and polyunsaturated fatty acids-PUFA (~2.5 g/100 g; ~9% of total fatty acids) (Table 2). In relation to the origin of the flour, significant differences (p < 0.05) were observed for the main fatty acids, oleic and palmitic acids, being the flour from Manhiça significantly higher in both fatty acids, which is in line with its higher fat content.
The fatty acid profile of nfuma is similar to that of high-fat fruits and their oils, namely olives, avocados and nuts [37,38], but with a slightly higher saturated content. Although nfuma has a higher fat content than cereal flour, it presents high amounts of oleic acid (~16 g/100 g of flour), some linoleic (1.8 g/100 g) and alpha-linolenic (0.5 g/100 g) acids and low amounts of SFA, which means it can play a protective role in health. The SFA fraction was mainly palmitic acid (~5 g/100 g), known for its controversial association with detrimental health effects; however, an optimal intake of palmitic acid, in an adequate ratio to unsaturated fatty acids may be crucial to maintain membrane phospholipids balance [39].
Despite the differences in the main fatty acids, regarding the health-related lipid indices of nfuma, the atherogenic index (AI) and thrombogenic index (TI) were 0.28 and 0.60, respectively, and did not differ between flour origins. Lower AI and TI values (close to zero) translate into lower atherogenic and thrombogenic potential. Thus, the consumption of nfuma can contribute to the prevention of cardiovascular diseases, since this flour, like olive oil (AI = 0.14; TI = 0.32), has AI and TI values below 1 [16]. Higher indices were reported for coconut (AI = 13.63; TI = 6.18) and palm (AI = 2.03; TI = 2.07) lipids, which are mainly characterized by SFA and are associated with cardiovascular diseases [16,40].

3.3. Vitamin E and Carotenoids

Unlike cereal flours, the high-fat content of nfuma is also responsible for its high content of liposoluble bioactive compounds, namely vitamin E and β-carotene (provitamin A activity) (Table 3).
Vitamin E and β-carotene contents ranged between 6.73–7.97 and 2.19–2.64 mg/100 g, respectively. Although no statistically significant differences were observed between communities, Chókwè and Manhiça presented the highest content of vitamin E and β-carotene, respectively. Nfuma has a higher β-carotene content than yellow sweet potato flour (0.6 mg/100 g) which is commonly used by local communities in Mozambique to make bread, cakes and porridges [41]. Regarding vitamin E, nfuma was shown to have a significant amount, similar to peanuts (9.9 mg/100 g) and some vegetable oils, such as palm oil (9.5 mg/100 g) [26].

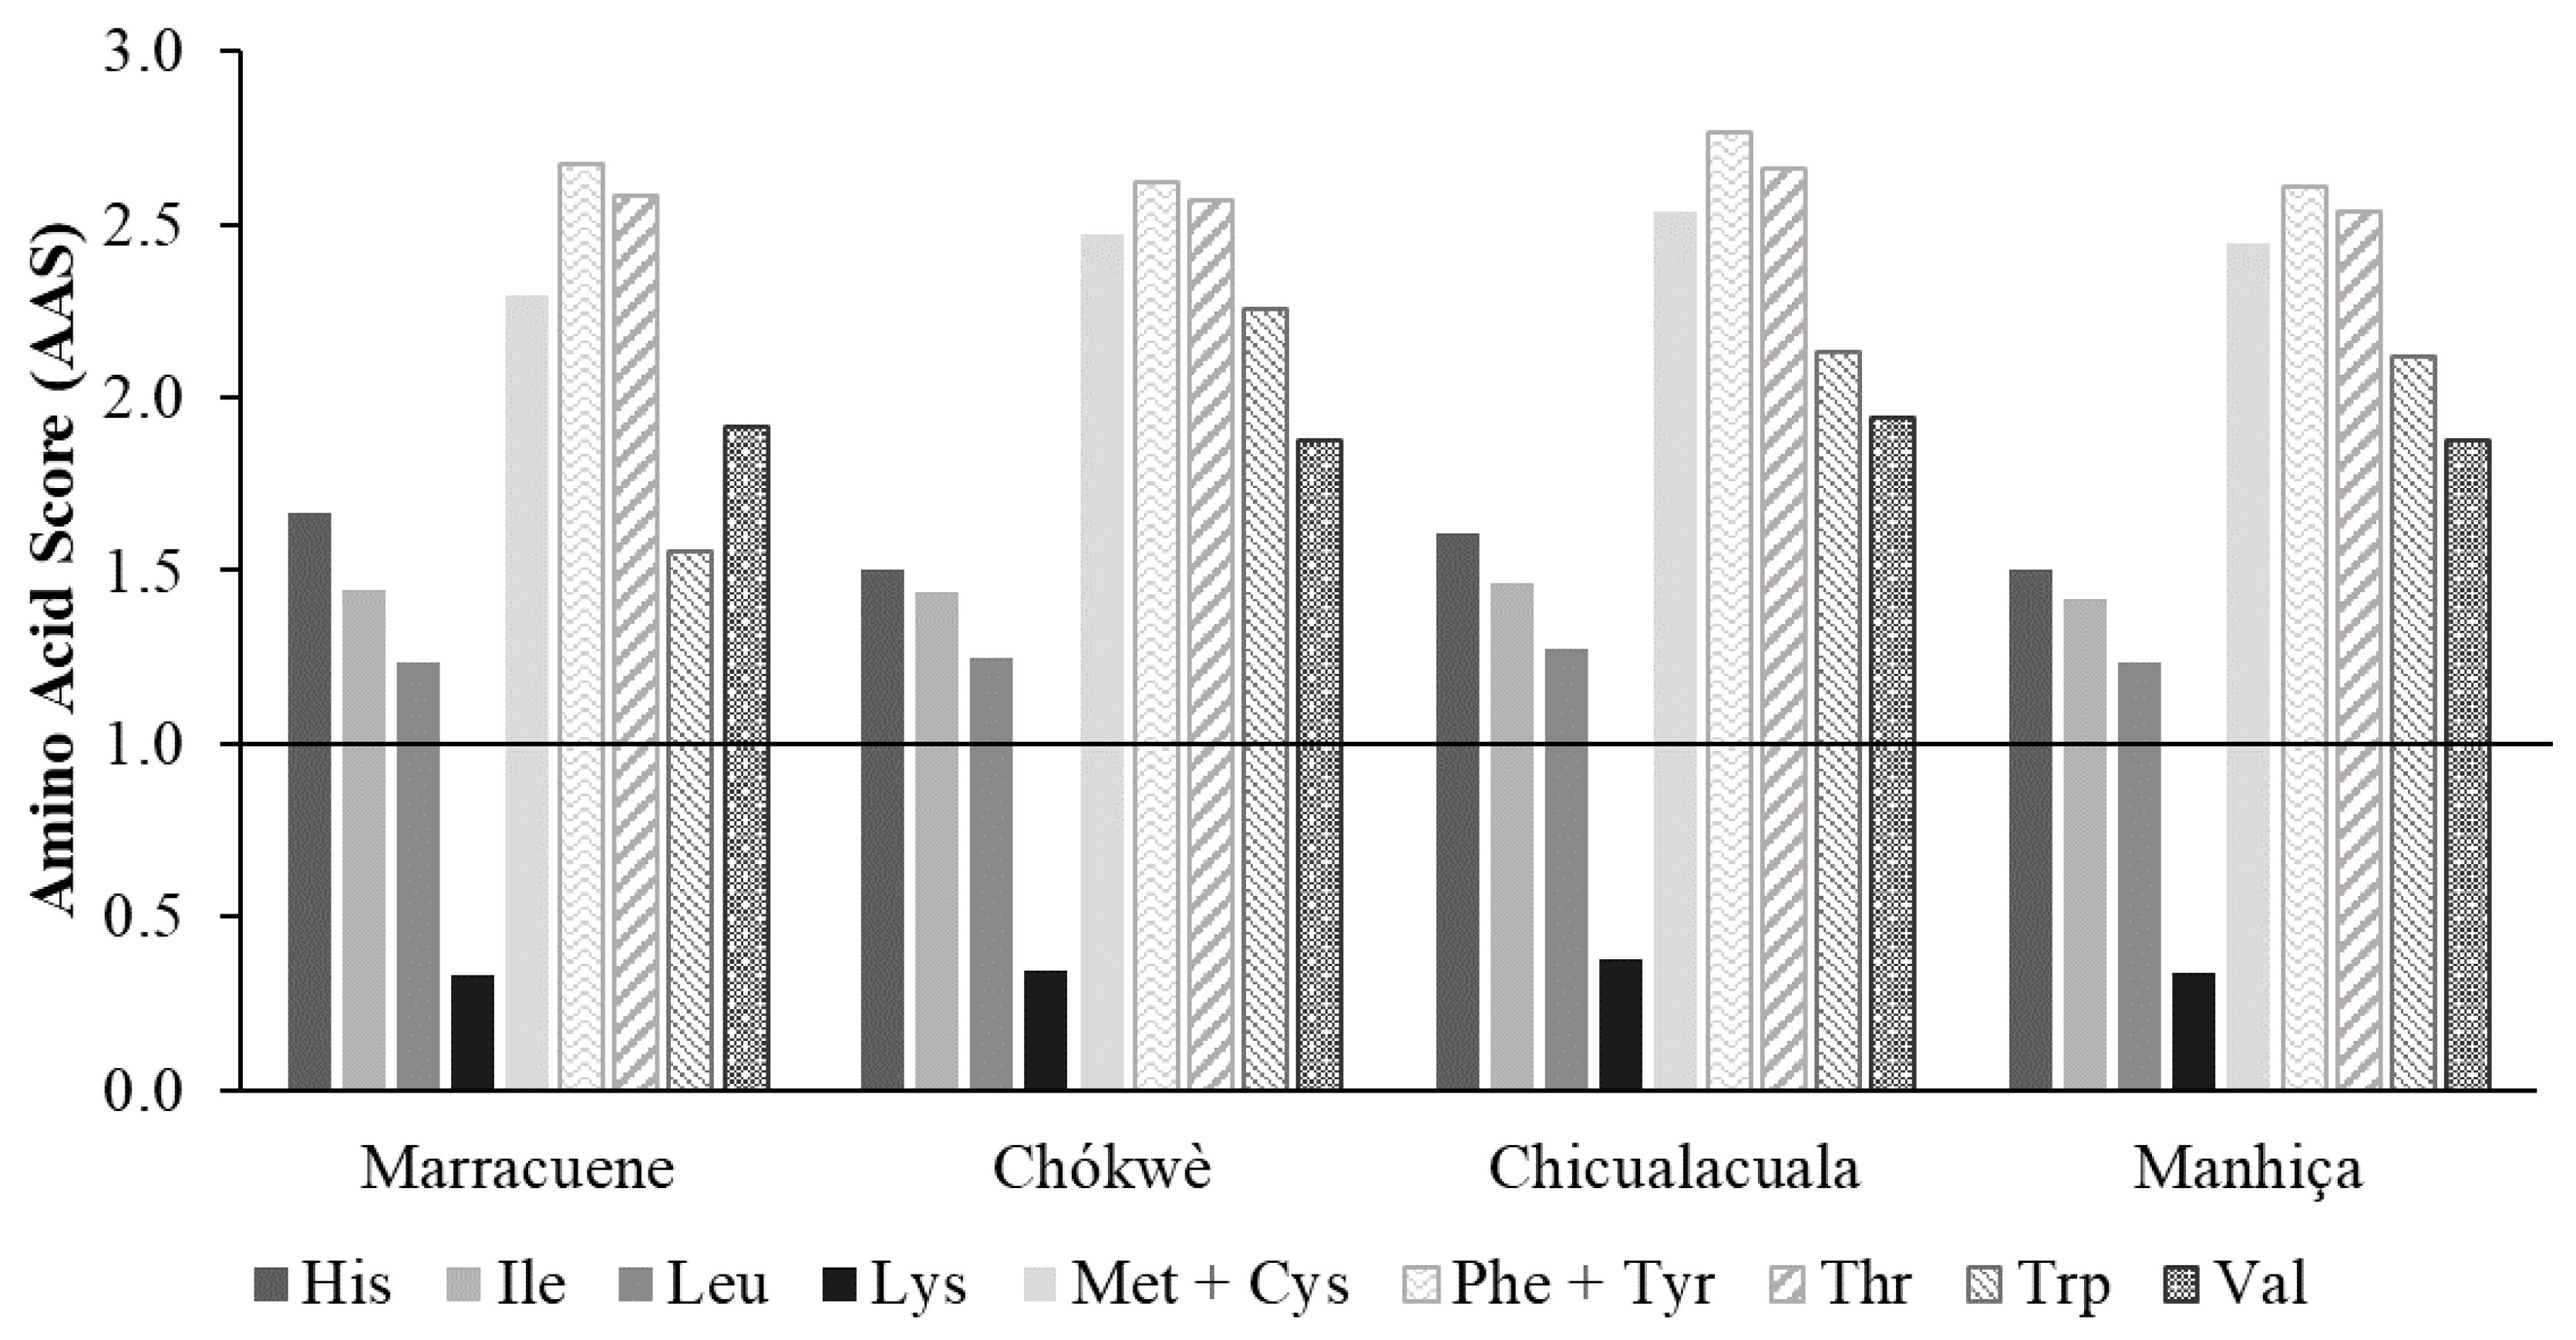
3.4. Amino Acids and Protein Nutritional Quality

The amino acid (AA) composition (mg/g protein) of nfuma from the different districts is shown in Table 4. Of the 18 amino acids analyzed, 17 were identified in the flour. Arg was the amino acid with the highest amount (148–156 mg/g protein), followed by Asp (106–121 mg/g), Glu (92–103 mg/g) and Ser (93–97 mg/g), Val (73–76 mg/g) and Leu (73–75 mg/g), Thr (58–61 mg/g) and Phe (59–62 mg/g) and Cys (50–56 mg/g), with significant differences between communities (p < 0.05) for Arg, Asp and Ser. Protein from Marracuene flour presented the higher Asp and Ser content, and lower of Arg. The lowest AA amounts were found for Met, Trp and Lys (up to 17 mg/g protein), being significantly different between communities, and Ala was not detected. Lys and Met were significantly higher in protein from Chicualacuala flour (16.9 mg/g protein) and Chókwè (15.6 mg/g protein), respectively, and Trp was significantly lower in protein from Marracuene flour (10.3 mg/g protein). Studies on the AA composition of indigenous fruits is scarce in the literature [42], and no information is available for fruits or products of Strychnos spp. [9]. Arg, the main AA in nfuma, was also found as the main AA of Dovyalis longispina and is generally abundant in other indigenous fruits [42]. Glu and Asp, the second and third most abundant AA in nfuma, have been described in relatively high amounts in other indigenous fruits [42]. These three AA have been described as major amino acids in nut seeds [38].
Met and Trp were the least abundant AA in nfuma (up to 15.6 mg/g protein), which is a common finding for proteins of plant origin [19]. Met was also found to be the least abundant AA by Sibiya et al. [42] in almost all indigenous fruits; however, different results were found for Lys, one of the least abundant AA in nfuma (up to 16.9 mg/g protein), but with relatively high or intermediate levels in some indigenous fruits [42]. Lys exhibits significant thermal instability even at low temperatures [19]; therefore, some losses may have occurred during the drying and roasting processes and its concentration may be higher in S. madagascariensis fresh fruits. Although in low amounts, nfuma presents all nine essential AA, which is in agreement with the findings of Sibiya et al. [42], who found eight essential AA (Trp was not evaluated) in 14 indigenous fruits.
The nutritional quality of the protein of nfuma, expressed as essential amino acid scores (EAAS) [20], is presented in Figure 2.
When all nine individual scores are greater than or equal to 1, the protein is considered complete. Despite having all essential AA, according to the results obtained, the protein of nfuma is incomplete, presenting Lys as the limiting AA (AAS < 1), which is in agreement with the results available for the protein of other flours, namely those derived from cereals, e.g., wheat and corn [19], or nut seeds [38]. Although the protein of nfuma is incomplete, it can balance other amino acid deficiencies. Nfuma is a relatively important source of Met+Cys, Phe+Tyr and Thr (AAS ≥ 1). To achieve the recommended daily allowances of all EAA, local communities should combine nfuma with other protein sources, namely legumes such as beans, as they are a rich source of Lys and a poor source of Met [19]. Beans are mainly grown in rural areas of Mozambique and can help to alleviate malnutrition [43]. The EAA with the highest ratio to daily requirements was Phe+Tyr. These AA are precursors of the physiologically active molecules catecholamines, which act as both neurotransmitters and hormones [44]. Although the three most abundant AA in nfuma are considered non-essential, it has been shown that Arg, Asp and Glu (Table 4) can act as regulators of key metabolic pathways, leading to a new concept of functional AA [45].

3.5. Mineral Elements

Table 5 presents the results of mineral content in nfuma from different origins (districts). Of the 25 elements analyzed, the content of eight of them (Li, Be, As, Se, Cs, Pb, Tl and Bi) was below the limits of detection. The most abundant macromineral was K (ranging from approximately 1200 to 1700 mg/100 g) and the less abundant was Na (4.0–6.6 mg/100 g).
This trend was also observed in other fruit flours [1,27], dried fruits [46] and indigenous fruits [28,47]. Brito et al. [1] found similar values for green banana flour, with mean value of 1100, 88, and 45 mg/100 g for K, Mg and Ca, respectively. Commercial fruit flours (up to 952 mg/100 g) [27] and dried fruit products (up to 1162 mg/100 g), have been described as essential sources of K [46]; however, nfuma presents even higher values. Among the 14 wild fruits native to southern African studied by Sibiya et al. [47], higher K levels were found in Carissa macrocarpa and Syzygium cordatum (1312.3 and 1427.1 mg/100 g dw, respectively). Regarding Strychnos spp, our results for S. madagascariensis flour are in the range of those observed by Kalenga Saka and Msonthi [29] and Amarteifio and Mosase [28] for S. spinosa fruit (1968 and 1370 mg/100 g dw, respectively) for K, and higher for Mg (43 and 49 mg/100 g dw, respectively).
For essential macrominerals, statistically significant differences were observed between the content of K, Mg and Na in the flours of the different communities (Marracuene, Chókwè, Chicualacuala and Manhiça). A high K and Mg content was observed for Marracuene flour (1654 ± 102 and 85.6 ± 2.8 mg/100 g, respectively) and a high Na content was observed for Chicualacuala flour (6.6 ± 0.1 mg/100 g).
Regarding essential trace elements, the following trend was observed: Mn (~4000 µg/100 g) > Fe > Zn > Cu > Cr > Co (6.8–7.6 µg/100 g). Significant differences (p < 0.05) were observed only for Cu (higher Cu content in Marracuene flour compared to Chicualacuala flour). Nfuma can be considered an interesting source of Mn when compared to dried fruits (~300 µg/100 g: apricot, dates, peach, poir, runes, raisins) [46]. Of the commercial fruit flours studied by Carli et al. [27], only coconut showed a Mn concentration similar to nfuma. Hassan et al. [48] found a Mn content of 2500 µg/100 g dw for S. innocua fruit. For Fe (~1600 µg/100 g) and Zn (~250 µg/100 g) in nfuma, lower levels were found when compared to cashew flours (~5000 and 4000 µg/100 g, respectively) [49]. Carli et al. (2017) reported higher Fe values in 8 out 10 fruit flours (~3000–11,000 µg/100 g: plum, coconut, orange, papaya, apple, passion fruit, green banana flours, in ascending order) and all flours had higher Zn values (500 to 4000 µg/100 g) than nfuma. Amarteifio and Mosase [28] reported a similar Zn content (220 µg/100 g dw) for S. spinosa fruit, and a lower value for Fe (~110 µg/100 g dw), proposing the supplementation of these fruits to meet Fe requirements. Interestingly, several studies report the ability of Strychnos spp. to improve nutrition based on their high Fe and Zn contents [9,10,50], despite the wide variation between and within the Strychnos spp. (other than S. madagascariensis), as reviewed by Ngadze et al. [9]. The Cu content (200 µg/100 g) of nfuma was in agreement with the data for some fruit flours, as reported by Carli et al. [27] (~170–210 µg/100 g for açai, orange and lemon flours) and Brito et al. [1] (up to 300 µg/100 g for apple and green banana). Regarding Cr, nfuma has contents (~58 µg/100 g) higher than those reported by Brito et al. [1] for apple and green banana flours (up to 20 µg/100 g). The minor essential element found in nfuma was Co (~7 µg/100 g), a constituent of vitamin B12. Nfuma presents higher Co levels than grain flours (up to 1.2 µg/100 g) [51] and within the range of dried sweet cherries (~0.6 to 14 µg/100 g; mean value of 3 µg/100 g dw) [52]. For S. innocua, Hassan et al. [48] reported quite different Co levels compared to nfuma, reaching 1200 µg/100 g dw.
Some non-essential elements were also quantified in nfuma. Among those, Al was the most abundant (~2600–3300 µg/100 g) and Cd the least (~2.1–2.4 µg/100 g). Statistically significant (p < 0.05) were observed for Al, Rb and Ba, with a higher Rb content and a lower Ba content in the Marracuene flour. For Al, a higher content was observed for Manhiça flour compared to Marracuene flour (3331 ± 26 vs. 2631 ± 210 µg/100 g). Aluminum content can vary significantly in food, depending on the food composition itself as well as on “external” factors (e.g., soil contamination, culinary practices). Our results are in close agreement with Brito et al. (2017), who studied two fruit flours (apple and green banana) and found Al levels ranging from 190 to 4900 µg/100 g.

3.6. Nutrient Adequacy of Nfuma

The estimated daily intake of nutrients and energy, expressed as % of DRV, was calculated assuming an average per capita consumption of nfuma of 100 g per day and is presented in Table 6. For macronutrients, except protein and total dietary fiber, the EDI was calculated based on the energy value. Thus, macronutrients DRVs depend on each individual’s energy needs. Overall, consumption of 100 g of nfuma contributes to 15–27% of daily energy needs, depending on the physical activity level. EDI values show that nfuma is an important source of fiber and lipids, namely alpha-linolenic acid, contributing to 30%, 22–69% and 27–48% of DRVs, respectively. Regarding liposoluble vitamins, nfuma provides 55–63% and 56–66% of vitamins A and E, respectively. In Mozambique, 69% of children under 5 years of age are deficient in vitamin A (Amaro, 2019; World Health, 2006). Considering a daily consumption of 50 g of nfuma, children aged 1–3 and 4–6 years can obtain 82 and 68% (Table 7), respectively, of vitamin A EDIs [22]. Thus, the consumption of nfuma by children in Mozambique may alleviate vitamin A deficiency due to its high β-carotene content. As mentioned above, flour is used during times of food shortage as a supplement to staple foods, such as maize and cassava flour. Maize flour is often boiled in water to make a maize-meal porridge that is consumed for breakfast by communities in sub-Saharan Africa [9]. According to the FAO Food Balance Sheets, Mozambican communities consume 192 g of maize and 285 g of cassava per day [53]. Maize and cassava flour have a higher carbohydrate content (75% and 85%, respectively), while nfuma has more fiber, fat and liposoluble vitamins [26]. On the other hand, nfuma has a low protein content, providing only 6% (male) and 7% (female) of DRVs. Therefore, as noted above, nfuma must be combined with other protein sources to achieve DRVs.
Considering the EDI of essential elements (expressed as % of DRV), nfuma contributes significantly to the daily intake of Mg and K, representing 22–26% and 40% of DRVs, respectively. In addition, daily consumption of 100 g of nfuma is sufficient to meet Mn requirements, since it provides more than 100% of Mn DRV. Nfuma has a higher content of specific minerals, especially K and Mg, compared to common staple flours in Mozambique, such as maize (120 mg/100 g of K and 46 mg/100 g of Mg) and cassava flours (20 mg/100 of K and 2 mg/100 g Mg) [26]. On the other hand, 100 g of nfuma provides only 10% (female) to 15% (male) of Fe DRV, although it contains twice the Fe content of maize flour (800 µg/100 g). For children (1–6 years), 50 g of nfuma provides 12% of Fe DRV (Table 7).
Consequently, the combination of maize flour with nfuma in porridges, together with consumption of nfuma as a daytime snack, as reported by people from Mozambican communities, may increase Fe intake, which is of great importance given the high prevalence (64%) of anemia in children in Mozambique [54]. However, it is still necessary to study the bioaccessibility and bioavailability of nfuma minerals to define its real potential in human nutrition.

3.7. Exposure Assessment to Non-Essential Trace Elements

Considering the non-essential trace elements for which a tolerable intake is established, the amount of Ni, Al and Cd in nfuma contributes to 52%, 15% and 9% of the corresponding TDI, PTWI and PTMI, respectively, for adults (Table 8). Thus, the consumption of nfuma (100 g) alone is not likely to be considered a relevant source of Al and Cd. The same is not true for Ni, since the average content found contributed to ~50% of the TDI established by the European Food Safety Authority (13 µg/kg bw).
When looking at the exposure of toddlers, the consumption of 50 g of nfuma can contribute to 151%, 44% and 11% of the TDI, PTWI and PTMI of Ni, Al and Cd, respectively. These results indicate that young age groups can be at high risk of health complications due to Ni exposure. Since the fruits used to prepare the flour had low levels of Al and Ni (data not shown), the selection of appropriate materials and the use of good practices in the preparation of nfuma should be evaluated in order to mitigate the presence of these non-essential elements, while maintaining the nutritional advantages of the food discussed above.

4. Conclusions

This research aimed to determine the nutritional composition of nfuma, a flour from S. madagascariensis pulp fruit, prepared by local communities in Mozambique and evaluate its adequacy in terms of nutrient recommendations. This fruit flour stands out for its high fat content, mainly composed by MUFA, delivering vitamin E and carotenes, together with naturally occurring sugars and high fiber content. Nfuma is also a good source of Mn and K and, despite being a poor source of Fe, nfuma contains twice the Fe content of maize flour. However, its Ni content should be addressed with caution and mitigation strategies are required in order to guarantee its safety.
Although nfuma bioaccessibility evaluation is still needed, its consumption seems to be a promising food-based strategy to alleviate the high prevalence of anemia and vitamin A deficiency in children of Mozambique. Its local use in the “enrichment” of maize-based porridges or as ingredient for pastry and snacks for the development of healthier new food products deserves to be technologically approached for wider valorization.

Supplementary Materials

The following supporting information can be downloaded at: https://www.mdpi.com/article/10.3390/foods11040616/s1, Table S1: Limits of detection (LOD) for the elements analyzed by ICP-MS.

Author Contributions

Conceptualization, S.S.I.C., M.K., O.V. and O.P.; methodology, O.V., S.C. and E.P.; formal analysis, Z.S.M.; investigation, S.S.I.C., M.R., M.K., S.C.M.P. and E.P.; resources, A.A., I.M.P.L.V.O.F. and S.C.; data curation, O.V., M.R. and E.P.; writing—original draft preparation, S.S.I.C. and M.R.; writing—review and editing, O.V., M.K., E.P., I.M.P.L.V.O.F. and A.A.; supervision, O.V.; funding acquisition, O.V. and O.P. All authors have read and agreed to the published version of the manuscript.

Funding

This research was supported by AgriFood XXI I&D project (NORTE-01-0145-FEDER-000041) cofinanced by European Regional Development Fund (ERDF), through the NORTE 2020 (Programa Operacional Regional do Norte 2014/2020) and by UIDB/50006/2020, funded by FCT/MCTES (Portugal).

Institutional Review Board Statement

Not applicable.

Informed Consent Statement

Not applicable.

Data Availability Statement

Data is contained within the article.

Acknowledgments

Sandra S. I. Chemane thanks the HEST Project Scholarship through the Ministry of Science, Technology and Higher Education and and Eduardo Modlane University. Olga Viegas acknowledges her researcher contract to FCT-Fundação para a Ciência e a Tecnologia, in the framework of the project PTDC/SAU-NUT/30322/2017—DIETimpact. Authors thank Eulália Mendes for its help on proximate analysis.

Conflicts of Interest

The authors declare no conflict of interest.

References

  1. Brito, A.L.B.; Oliveira, A.F.; Nogueira, A.R.A.; Pessoa, A.G.G.; Pontes, L.F.B.L. Determination of inorganic constituents and physicochemical characterization of functional flour samples. Microchem. J. 2017, 132, 112–118. [Google Scholar] [CrossRef] [Green Version]
  2. Nyanga, L.K.; Gadaga, T.H.; Nout, M.J.R.; Smid, E.J.; Boekhout, T.; Zwietering, M.H. Nutritive value of masau (Ziziphus mauritiana) fruits from Zambezi Valley in Zimbabwe. Food Chem. 2013, 138, 168–172. [Google Scholar] [CrossRef] [PubMed]
  3. Stadlmayr, B.; Charrondière, U.R.; Eisenwagen, S.; Jamnadass, R.; Kehlenbeck, K. Nutrient composition of selected indigenous fruits from sub-Saharan Africa. J. Sci. Food Agric. 2013, 93, 2627–2636. [Google Scholar] [CrossRef] [PubMed]
  4. Magaia, T.; Uamusse, A.; Sjöholm, I.; Skog, K. Proximate Analysis of Five Wild Fruits of Mozambique. Sci. World J. 2013, 2013, 601435. [Google Scholar] [CrossRef] [Green Version]
  5. Van Wyk, B.E. The potential of South African plants in the development of new medicinal products. S. Afr. J. Bot. 2011, 77, 812–829. [Google Scholar] [CrossRef] [Green Version]
  6. Kuhnlein, H.V.; Johns, T. Northwest African and Middle Eastern food and dietary change of indigenous peoples. Asia Pac. J. Clin. Nutr. 2003, 12, 344–349. [Google Scholar]
  7. Bvenura, C.; Sivakumar, D. The role of wild fruits and vegetables in delivering a balanced and healthy diet. Food Res. Int. 2017, 99, 15–30. [Google Scholar] [CrossRef]
  8. National Research Council. Lost Crops of Africa: Volume III: Fruits; The National Academies Press: Washington, DC, USA, 2008. [Google Scholar]
  9. Ngadze, R.T.; Linnemann, A.R.; Nyanga, L.K.; Fogliano, V.; Verkerk, R. Local processing and nutritional composition of indigenous fruits: The case of monkey orange (Strychnos spp.) from Southern Africa. Food Rev. Int. 2017, 33, 123–142. [Google Scholar] [CrossRef] [Green Version]
  10. Ngadze, R.T.; Verkerk, R.; Nyanga, L.K.; Fogliano, V.; Linnemann, A.R. Improvement of traditional processing of local monkey orange (Strychnos spp.) fruits to enhance nutrition security in Zimbabwe. Food Secur. 2017, 9, 621–633. [Google Scholar] [CrossRef] [Green Version]
  11. AOAC. Official Method of Analysis, 18th ed.; Association of Officiating Analytical Chemists: Washington, DC, USA, 2005. [Google Scholar]
  12. Martins, Z.E.; Pinto, E.; Almeida, A.A.; Pinho, O.; Ferreira, I.M.P.L.V.O. Fibre fortification of wheat bread: Impact on mineral composition and bioaccessibility. Food Funct. 2017, 8, 1979–1987. [Google Scholar] [CrossRef]
  13. Regulation (EU) 1169/2011 of the European Parliament and of the Council of 25 October 2011 OJ L 304, 22.11.2011. pp. 18–63. Available online: https://eur-lex.europa.eu/eli/reg/2011/1169/oj (accessed on 10 January 2022).
  14. Santos, J.R.; Viegas, O.; Páscoa, R.N.M.J.; Ferreira, I.M.P.L.V.O.; Rangel, A.O.S.S.; Lopes, J.A. In-line monitoring of the coffee roasting process with near infrared spectroscopy: Measurement of sucrose and colour. Food Chem. 2016, 208, 103–110. [Google Scholar] [CrossRef] [PubMed]
  15. Regulation (EEC) 2568/91 of the 11 July 1991 OJ L 248, 5.9.1991. pp. 1–83. Available online: https://eur-lex.europa.eu/legal-content/en/TXT/?uri=CELEX:31991R2568 (accessed on 10 January 2022).
  16. Ulbricht, T.L.V.; Southgate, D.A.T. Coronary heart disease: Seven dietary factors. Lancet 1991, 338, 985–992. [Google Scholar] [CrossRef]
  17. Cruz, R.; Casal, S. Direct analysis of vitamin A, vitamin E, carotenoids, chlorophylls and free sterols in animal and vegetable fats in a single normal-phase liquid chromatographic run. J. Chromatogr. A 2018, 1565, 81–88. [Google Scholar] [CrossRef] [PubMed]
  18. Benhammouche, T.; Melo, A.; Martins, Z.; Faria, M.A.; Pinho, S.C.M.; Ferreira, I.; Zaidi, F. Nutritional quality of protein concentrates from Moringa Oleifera leaves and in vitro digestibility. Food Chem. 2021, 348, 128858. [Google Scholar] [CrossRef]
  19. Friedman, M. Nutritional Value of Proteins from Different Food Sources. A Review. J. Agric. Food Chem. 1996, 44, 6–29. [Google Scholar] [CrossRef]
  20. FAO; WHO; UNU. Protein and Amino Acid Requirements in Human Nutrition: Report of a Joint FAO/WHO/UNU Expert Consultation; World Health Organization: Geneva, Switzerland, 2007. [Google Scholar]
  21. Pinto, E.; Ferreira, I.M.P.L.V.O.; Almeida, A. Essential and non-essential/toxic trace elements in whey protein supplements. J. Food Compos. Anal. 2020, 86, 103383. [Google Scholar] [CrossRef]
  22. DRV Finder. Available online: https://multimedia.efsa.europa.eu/drvs/index.htm (accessed on 10 January 2022).
  23. EFSA Scientific Committee. Guidance on selected default values to be used by the EFSA Scientific Committee, Scientific Panels and Units in the absence of actual measured data. EFSA J. 2012, 10, 2579. [Google Scholar] [CrossRef]
  24. EFSA Panel on Contaminants in the Food Chain (CONTAM). Update of the risk assessment of nickel in food and drinking water. EFSA J. 2020, 18, e06268. [Google Scholar] [CrossRef]
  25. JEFCA. Discussion Paper on the Implementation of a Structured Approach to Identify the Need for Review of Codex Standards and Related Texts for Contaminants in Foods. CF/14 INF/1, April 2021. Available online: https://www.fao.org/fao-who-codexalimentarius/sh-proxy/en/?lnk=1&url=https%253A%252F%252Fworkspace.fao.org%252Fsites%252Fcodex%252FMeetings%252FCX-735-14%252FWDs-2021%252Fcf14_16e.pdf (accessed on 10 January 2022).
  26. INSA (Instituto Nacional de Saúde Dr. Ricardo Jorge). Tabela da Composição de Alimentos; Centro de Segurança Alimentar e Nutrição INSA: Lisboa, Portugal, 2007. [Google Scholar]
  27. Carli, C.G.; Lima, V.A.; Porcu, O.M. Prospecting the Physical, Chemical and Nutritional Characteristics of Commercial Fruit Flours. Nutr. Food Sci. Int. J. 2016, 2, 1–7. [Google Scholar] [CrossRef]
  28. Amarteifio, J.O.; Mosase, M. The Chemical Composition of Selected Indigenous Fruits of Botswana. J. Appl. Sci. Environ. Manag. 2009, 10, 43–47. [Google Scholar] [CrossRef] [Green Version]
  29. Kalenga Saka, J.D.; Msonthi, J.D. Nutritional value of edible fruits of indigenous wild trees in Malawi. For. Ecol. Manag. 1994, 64, 245–248. [Google Scholar] [CrossRef]
  30. Raczyk, M.; Kruszewski, B.; Michałowska, D. Effect of Coconut and Chestnut Flour Supplementations on Texture, Nutritional and Sensory Properties of Baked Wheat Based Bread. Molecules 2021, 26, 4641. [Google Scholar] [CrossRef] [PubMed]
  31. Bello, M.O.; Falade, O.S.; Adewusi, S.R.A.; Olawore, N.O. Studies on the chemical compositions and anti nutrients of some lesser known Nigeria fruits. Afr. J. Biotechnol. 2007, 7, 3972–3979. [Google Scholar]
  32. Ohizua, E.R.; Adeola, A.A.; Idowu, M.A.; Sobukola, O.P.; Afolabi, T.A.; Ishola, R.O.; Ayansina, S.O.; Oyekale, T.O.; Falomo, A. Nutrient composition, functional, and pasting properties of unripe cooking banana, pigeon pea, and sweetpotato flour blends. Food Sci. Nutr. 2017, 5, 750–762. [Google Scholar] [CrossRef] [PubMed] [Green Version]
  33. Lockett, C.T.; Calvert, C.C.; Grivetti, L.E. Energy and micronutrient composition of dietary and medicinal wild plants consumed during drought. Study of rural Fulani, northeastern Nigeria. Int. J. Food Sci. Nutr. 2000, 51, 195–208. [Google Scholar] [CrossRef]
  34. Wilson, A.L.; Downs, C.T. Fruit nutritional composition and non-nutritive traits of indigenous South African tree species. S. Afr. J. Bot. 2012, 78, 30–36. [Google Scholar] [CrossRef] [Green Version]
  35. Donno, D.; Mellano, M.G.; Riondato, I.; De Biaggi, M.; Andriamaniraka, H.; Gamba, G.; Beccaro, G.L. Traditional and Unconventional Dried Fruit Snacks as a Source of Health-Promoting Compounds. Antioxidants 2019, 8, 396. [Google Scholar] [CrossRef] [Green Version]
  36. Regulation (EC) 1924/2006 of the European Parliament and of the Council of 20 December 2006. OJ L 404, 30.12.2006. pp. 9–25. Available online: https://eur-lex.europa.eu/legal-content/en/ALL/?uri=CELEX%3A32006R1924 (accessed on 10 January 2022).
  37. Berasategi, I.; Barriuso, B.; Ansorena, D.; Astiasarán, I. Stability of avocado oil during heating: Comparative study to olive oil. Food Chem. 2012, 132, 439–446. [Google Scholar] [CrossRef]
  38. Venkatachalam, M.; Sathe, S.K. Chemical Composition of Selected Edible Nut Seeds. J. Agric. Food Chem. 2006, 54, 4705–4714. [Google Scholar] [CrossRef]
  39. Carta, G.; Murru, E.; Banni, S.; Manca, C. Palmitic Acid: Physiological Role, Metabolism and Nutritional Implications. Front. Physiol. 2017, 8, 902. [Google Scholar] [CrossRef] [Green Version]
  40. Elson, C.E.; Alfin-Slater, R.B. Tropical oils: Nutritional and scientific issues. Crit. Rev. Food Sci. Nutr. 1992, 31, 79–102. [Google Scholar] [CrossRef] [PubMed]
  41. Nogueira, A.C.; Sehn, G.A.R.; Rebellato, A.P.; Coutinho, J.P.; Godoy, H.T.; Chang, Y.K.; Steel, C.J.; Clerici, M.T.P.S. Yellow sweet potato flour: Use in sweet bread processing to increase β-carotene content and improve quality. An. Acad. Bras. Ciênc. 2018, 90, 283–293. [Google Scholar] [CrossRef] [PubMed] [Green Version]
  42. Sibiya, N.P.; Kayitesi, E.; Moteetee, A.N. Proximate Analyses and Amino Acid Composition of Selected Wild Indigenous Fruits of Southern Africa. Plants 2021, 10, 721. [Google Scholar] [CrossRef] [PubMed]
  43. Baptista, A.; Pinho, O.; Pinto, E.; Casal, S.; Mota, C.; Ferreira, I.M.P.L.V.O. Characterization of protein and fat composition of seeds from common beans (Phaseolus vulgaris L.), cowpea (Vigna unguiculata L. Walp) and bambara groundnuts (Vigna subterranea L. Verdc) from Mozambique. J. Food Meas. Charact. 2017, 11, 442–450. [Google Scholar] [CrossRef]
  44. Fernstrom, J.D.; Fernstrom, M.H. Tyrosine, Phenylalanine, and Catecholamine Synthesis and Function in the Brain. J. Nutr. 2007, 137, 1539S–1547S. [Google Scholar] [CrossRef] [PubMed]
  45. Wu, G. Functional amino acids in growth, reproduction, and health. Adv. Nutr. 2010, 1, 31–37. [Google Scholar] [CrossRef] [PubMed]
  46. Alasalvar, C.; Shahidi, F. 1-Composition, phytochemicals, and beneficial health effects of dried fruits: An overview. In Dried Fruits, 1st ed.; Alasalvar, C., Shahidi, F., Eds.; Wiley-Blackwell: Hoboken, NJ, USA, 2013. [Google Scholar]
  47. Sibiya, N.P.; Kayitesi, E.; Moteetee, A.N. Mineral composition of selected indigenous wild southern African fruits. S. Afr. J. Bot. 2020, 132, 87–94. [Google Scholar] [CrossRef]
  48. Hassan, L.G.; Abdulmumin, U.; Umar, K.J.; Ikeh, O.P.; Aliero, A.A. Nutritional and Anti-nutritional Composition of Strychnos innocua Del. (Monkey Orange) Fruit Pulp Grown in Zuru, Nigeria. Niger. J. Basic Appl. Sci. 2014, 22, 33–37. [Google Scholar] [CrossRef] [Green Version]
  49. Xavier, A.D.S.; Furtado, D.Z.S.; Assunção, N.A.; Nascimento, A.N. Bioacessibility of Fe and Zn (associated to proteins) in cashew nut. J. Food Compos. Anal. 2019, 83, 103259. [Google Scholar] [CrossRef]
  50. Omotayo, A.O.; Aremu, A.O. Undervalued Spiny Monkey Orange (Strychnos spinosa Lam.): An Indigenous Fruit for Sustainable Food-Nutrition and Economic Prosperity. Plants 2021, 10, 2785. [Google Scholar] [CrossRef]
  51. Ertl, K.; Goessler, W. Grains, whole flour, white flour, and some final goods: An elemental comparison. Eur. Food Res. Technol. 2018, 244, 2065–2075. [Google Scholar] [CrossRef] [Green Version]
  52. Gonçalves, A.C.; Campos, G.; Pinto, E.; Oliveira, A.S.; Almeida, A.; de Pinho, P.G.; Alves, G.; Silva, L.R. Essential and non-essential elements, and volatile organic compounds for the discrimination of twenty-three sweet cherry cultivars from Fundão, Portugal. Food Chem. 2022, 367, 130503. [Google Scholar] [CrossRef] [PubMed]
  53. FAOSTAT. Available online: https://www.fao.org/faostat/en/#data/FBS (accessed on 10 January 2022).
  54. Amaro, M. Accelerating progress in micronutrient deficiencies in Mozambique: A Ministry of Health perspective. Matern. Child Nutr. 2019, 15, e12707. [Google Scholar] [CrossRef] [PubMed] [Green Version]
Figure 1. Schematic description of the preparation of nfuma by Mozambican communities: from the fruit of Strychnos madagascariensis to flour.
Foods 11 00616 g001
Figure 2. Essential amino acid scores (EAAS) of S. madagascariensis fruit flour (nfuma) from 4 districts of Mozambique. Adult maintenance patterns are expressed as mg AA/g protein: His. 15; Ile. 30; Leu. 59; Lys. 45; Met + Cys. 27; Phe + Tyr. 38; Thr. 23; Trp. 6.6; Val. 39, according with WHO/FAO/UNU [20].
Foods 11 00616 g002
Table 1. Proximate composition, energy value, sugar and fiber profiles (%) of S. madagascariensis fruit flour (nfuma) from four districts (Marracuene, Manhiça, Chókwè and Chicualacuala) in southern Mozambique.
MarracueneChókwèChicualacualaManhiçap Value
Moisture (g)4.4 ± 0.24.6 ± 0.04.3 ± 0.14.4 ± 0.1ns
Protein (g)3.1 ± 0.0 b3.2 ± 0.1 b3.0 ± 0.0 b3.5 ± 0.1 a0.003 **
Fat (g)26.3 ± 0.2 b27.0 ± 0.0 b26.9 ± 0.1 b27.8 ± 0.0 a0.016 **
Ash (g)5.5 ± 0.1 b4.8 ± 0.0 c6.0 ± 0.1 a5.0 ± 0.1 c0.020 **
Total Carbohydrates # (g)60.7 ± 0.1 a60.5 ± 0.1 a,b59.8 ± 0.2 a,b59.3 ± 0.1 b0.026 **
Available Carbohydrates # (g)54.9 ± 0.1 a49.7 ± 0.1 d52.4 ± 0.0 c53.1 ± 0.1 b0.006 **
Sugars
Fructose (g)4.0 ± 0.03.5 ± 0.13.3 ± 0.24.3 ± 0.5ns
Glucose (g)4.4 ± 0.23.7 ± 0.03.7 ± 0.15.0 ± 1.0ns
Sucrose (g)1.4 ± 0.21.8 ± 0.41.9 ± 0.41.8 ± 0.4ns
Total dietary fiber (g)5.8 ± 0.1 c10.8 ± 0.0 a7.4 ± 0.2 b6.2 ± 0.1 c0.001 **
Insoluble (g)5.2 ± 0.16.9 ± 0.46.0 ± 0.25.5 ± 0.2ns
Soluble (g)0.6 ± 0.1 c3.9 ± 0.4 a1.4 ± 0.01 b0.6 ± 0.1 c0.022 **
Energy(kJ)2005 ± 8 a,b1982 ± 1 b,c1995 ± 1 a2039 ± 3 a0.012 **
(kcal)480 ± 2 a,b476 ± 0.2 b,c478 ± 0.2 a489 ± 0.7 a0.014 **
Data expressed as mean ± standard deviation (n = 3 independent samples × 3 analytical replicates); ns, not significant. Different letters for each district in a row indicate statistically significant differences (p < 0.05) between means. p Values from one-way ANOVA. Means were compared by Tukey’s since homogeneity of variances was confirmed by Levene’s test (p > 0.05). ** p Values from one-way Welch ANOVA. Means were compared by Tamhane’s T2 test since homogeneity of variances was not confirmed by Levene’s test (p < 0.05). # Carbohydrate content was determined by difference [Total carbohydrates = 100 − (moisture + protein + fat + ash); Available carbohydrates = Total carbohydrates − Total dietary fiber].
Table 2. Fatty acids composition (mg/100 g of flour) and atherogenic (AI) and thrombogenic (TI) indices of S. madagascariensis fruit flour (nfuma) from four districts (Marracuene, Manhiça, Chókwè and Chicualacuala) in southern Mozambique.
Fatty AcidMarracueneChókwèChicualacualaManhiça p Value
C12:03.4 ± 0.23.5 ± 0.93.8 ± 0.43.7 ± 0.5 ns
C14:034.1 ± 1.935.4 ± 1.035.3 ± 1.236.1 ± 0.5 ns
C16:05229.9 ± 118.3 a,b5354.5 ± 58.6 a5359.1 ± 67.2 a5528.3 ± 52.6 b,c 0.033 *
C16:1-n9421.4 ± 13.5428.7 ± 3.1428.5 ± 8.9439.1 ± 1.8 ns
C18:01198.7 ± 13.21201.6 ± 23.31213.6 ± 15.81258.0 ± 24.5 ns
C18:1-n916,464.1 ± 298.7 a,b16,905.2 ± 3.3 c16,812.7 ± 147.7 a,c17,388.1 ± 25.0 b,c <0.001 **
C18:2-n61791.6 ± 55.41832.8 ± 17.61839.6 ± 36.21884.9 ± 13.0 ns
C18:3-n3457.5 ± 21.1460.8 ± 9.9466.0 ± 14.1472.4 ± 9.6 ns
C20:0161.0 ± 2.8165.7 ± 2.5168.2 ± 5.4171.8 ± 2.8 ns
C20:1-n978.1 ± 1.482.4 ± 2.783.3 ± 3.984.8 ± 3.7 ns
SFA6926 ± 1387068 ± 677084 ± 767314 ± 80 -
MUFA17,013 ± 31317,469 ± 417,390 ± 16017,965 ± 17 -
PUFA2304 ± 792345 ± 272361 ± 512408 ± 17 -
AI#0.28 ± 0.000.28 ± 0.000.28 ± 0.000.28 ± 0.00 -
TI#0.60 ± 0.000.60 ± 0.000.60 ± 0.000.60 ± 0.00 -
Data expressed as mean ± standard deviation (n = 3 independent samples × 3 analytical replicates); ns, not significant. Different letters for each district in a row show statistically significant differences (p < 0.05) between means. * p Values from one-way ANOVA. Means were compared by Tukey’s since homogeneity of variances was confirmed by Levene’s test (p > 0.05). ** p Values from one-way Welch ANOVA. Means were compared by Tamhane’s T2 test since homogeneity of variances was not confirmed by Levene’s test (p < 0.05). # AI and TI were calculated according to Ulbricht and Southgate [16].
Table 3. Vitamin E and β-carotene contents (mg/100 g) of S. madagascariensis fruit flour (nfuma) from four districts (Marracuene, Manhiça, Chókwè and Chicualacuala) of southern Mozambique.
Vitamin Eβ-Carotene
Marracuene 6.73 ± 0.742.56 ± 0.08
Chókwè7.97 ± 0.722.45 ± 0.34
Chicualacuala6.88 ± 0.132.19 ± 0.11
Manhiça7.44 ± 0.402.64 ± 0.13
p valuensns
Data expressed as mean ± standard deviation (n = 3 independent samples × 3 analytical replicates); ns, not significant.
Table 4. Amino acids composition of protein (mg/g protein) from the S. madagascariensis fruit flour (nfuma) from four districts (Marracuene, Manhiça, Chókwè and Chicualacuala) in southern Mozambique.
Amino AcidMarracueneChókwèChicualacualaManhiçap Value
Asp121 ± 1 b106 ± 3 a114 ± 2 a,b116 ± 4 b0.004
Glu101 ± 5103 ± 1792.0 ± 2.6103 ± 18ns
Ser97.2 ± 0.4 b93.2 ± 1.5 a,b96.9 ± 0.5 a,b92.7 ± 2.2 a0.020
His25.0 ± 2.422.6 ± 0.324.1 ± 0.622.6 ± 0.7ns
Gly27.3 ± 0.427.3 ± 0.427.8 ± 0.227.7 ± 0.5ns
Thr59.5 ± 0.859.1 ± 0.761.1 ± 1.758.4 ± 1.5ns
Arg148 ± 1 b,c153 ± 2 a,c156 ± 1 a153 ± 3 a,c0.041
Alandndndnd
Tyr42.6 ± 0.340.7 ± 0.642.7 ± 0.140.3 ± 1.5ns
Val74.6 ± 0.373.1 ± 0.975.6 ± 0.373.1 ± 2.3ns
Met12.0 ± 0.0 b15.6 ± 0.3 a11.5 ± 0.3 b,c10.9 ± 0.2 c <0.001
Phe59.0 ± 0.259.0 ± 0.862.4 ± 0.258.9 ± 2.4ns
Ile43.3 ± 0.643.1 ± 1.143.8 ± 0.342.6 ± 1.1ns
Leu72.8 ± 0.373.6 ± 1.275 ± 0.372.7 ± 2.2ns
Lys14.9 ± 0.1 b15.6 ± 0.2 b16.9 ± 0.3 a15.4 ± 0.5 b0.002
Pro41.1 ± 1.5 a,b49 ± 5.2 b 30.1 ± 3.1 a43.1 ± 3.6 b0.005
Trp10.3 ± 0.5 b14.9 ± 0.3 a14.0 ± 0.6 a14.0 ± 0.3 a<0.001
Cys49.9 ± 1.650.4 ± 4.356.4 ± 1.355.5 ± 1.0ns
∑AAA 1102 ± 0100 ± 1105 ± 099.2 ± 3.9-
∑SAA 261.9 ± 0.066.8 ± 0.368.4 ± 0.366.1 ± 0.2-
∑EAA 3464 ± 3469 ± 6484 ± 1464 ± 12-
Data expressed as mean ± standard deviation (n = 3 independent samples × 3 analytical replicates); nd, below limit of detection (4.06 µM for Ala); ns, not significant. Different letters for each district in a row show statistically significant differences (p < 0.05) between means. p Values from one-way ANOVA analysis. Means were compared by Tukey’s. since homogeneity of variances was confirmed by Levene’s test (p > 0.05). 1 Aromatic amino acids: Phe+Tyr; 2 sulfur amino acids: Met+Cys; 3 Sum of essential amino acids Thr+Val+Met(+Cys)+Ile+Leu+Phe (+Tyr)+His+Lys+Trp used for daily requirements and protein value as suggested by FAO/WHO/UNU [20].
Table 5. Mineral composition of the S. madagascariensis fruit flour (nfuma) from four districts (Marracuene, Manhiça, Chókwè and Chicualacuala) in southern Mozambique.
ElementMarracueneChókwèChicualacualaManhiçap Value
Essential macrominerals (mg/100 g)
Ca24.7 ± 0.231.3 ± 6.326.2 ± 0.029.9 ± 2.5ns
Mg85.6 ± 2.8 a80.8 ± 3.4 a,b75.3 ± 4.7 a,b69.4 ± 4.3 b0.025 *
K1654 ± 102 a1399 ± 71 b1303 ± 15 b1204 ± 80 b0.002 *
Na4.9 ± 0.2 b4.0 ± 0.1 b6.6 ± 0.1 a4.9 ± 0.8 b0.002 *
Essential trace elements (µg/100 g)
Fe1683 ± 711620 ± 561476 ± 731706 ± 122ns
Zn261.4 ± 11.2216.5 ± 12.5205 ± 13.4228.6 ± 20.8ns
Mn4017 ± 1413885 ± 713874 ± 214098 ± 181ns
Cu215.2 ± 1.0 a200.3 ± 5.9 a,b193.9 ± 7.7 b208.5 ± 5.1 a,b0.021 *
Cr58.1 ± 1.455.2 ± 2.757.5 ± 1.958.1 ± 0.5ns
Co7.6 ± 0.37.3 ± 0.26.8 ± 0.37.6 ± 0.0ns
Non-essential trace elements (µg/100 g)
Al2631 ± 210 a3042 ± 221 a,b2995 ± 73 a3331 ± 26 b0.026 **
Rb1100 ± 19 a980 ± 29 b968 ± 15 b968 ± 31 b0.002 *
Ni463.8 ± 3.8482.6 ± 20.5458.8 ± 12.6478.0 ± 20.0ns
Sr258.2 ± 2.6240.9 ± 5.5250.2 ± 14.4256.2 ± 4.8ns
Ba222.3 ± 5.1 b252.2 ± 8.6 a249.7 ± 9.5 a257.0 ± 4.6 a0.006 *
V17.9 ± 0.4 a17.6 ± 0.5 a17 ± 0.6 a21.9 b ± 0.30.002 *
Cd2.4 ± 0.02.1 ± 0.22.3 ± 0.12.1 ± 0.1ns
Data expressed as mean ± standard deviation (n = 3 independent samples × 3 analytical replicates); ns, not significant. Different letters for each district in a column show statistically significant differences (p < 0.05) between means. * p Values from one-way ANOVA. Means were compared by Tukey’s since homogeneity of variances was confirmed by Levene’s test (p > 0.05). ** p Values from one-way Welch ANOVA. Means were compared by Tamhane’s T2 test since homogeneity of variances was not confirmed by Levene’s test (p < 0.05).
Table 6. Estimated daily intake (EDI), expressed as % of the dietary reference value (DRV) [22], of energy, macronutrients, vitamins and essential elements for adults considering an average per capita nfuma consumption of 100 g/day.
DRV (AI a/AR b/PRI c/RI d/SAI e)EDI (% DRV)
MaleFemaleMaleFemale
Energy (MJ/day)
Energy9.1–13.0 b,*7.4–10.5 b,*15–2219–27
Macronutrients (g/day)
Protein53.1 c,#45.6 c,#6.07.0
Fat48.3–120.8 d38.9–97.3 d22–5628–69
Alpha-linolenic acid1.2–1.7 a1.0–1.3 a27–3833–48
Linoleic acid9.7–13.8 a7.8–11.1 a13–1917–24
Carbohydrates244.5–465.8 d197.1–375.5 d11–2214–27
Total Dietary Fiber25 a30
Vitamins
Vitamin A (µg RE/day)750 c650 c,§55 63
Vitamin E (mg/day)13 a11 a5666
Minerals (mg/day)
Ca950 c3
Mg350 a300 a2226
K3500 a40
Na2000 e0.3
Fe11 c16 c,§1510
Zn9.4–16.3 c,†7.5–12.7 c,†1.4–2.41.8–3.0
Mn3 a132
Cu1.6 a1.3 a12.815.7
* Average requirement for adults (18–79 years) with a physical activity level (PAL) between 1.4 and 2.0. # Population reference intake for men and women with a reference body weight of 64 and 55 kg, respectively, based on IMC of 22 kg/m2. § Population reference intake for premenopausal women. Population reference intake for adults (≥18 years) with a phytate intake level between 300 and 1200 mg/day. DRV: dietary reference value; a–e reference value applied: AI a: adequate intake; AR b: average requirement; PRI c: population reference intake; RI d: reference intake; SAI e: safe and adequate intake. EDI of vitamin A was calculated based on the conversion of β-carotene content (expressed as mg/100 g) to retinol equivalent (1 µg RE = 6 µg of β-carotene).
Table 7. Estimated daily intake (EDI), expressed as % of the dietary reference value (DRV) [22], of vitamin A and Fe for children (1–6 years) considering an average per capita nfuma consumption of 100 g/day.
DRV (PRI)EDI (% DRV)
1–3 Years4–6 Years1–3 Years4–6 Years
Vitamin A (µg RE/day)2503008268
Fe (mg/day)712
DRV: dietary reference value; population reference intake. EDI of vitamin A was calculated based on the conversion of β-carotene content (expressed as mg/100 g) to retinol equivalent (1 µg RE = 6 µg of β-carotene).
Table 8. Estimated daily (EDI), weekly (EWI) and monthly (EMI) intake, expressed as % of toxicological guidance values of Ni, Al and Cd, considering the consumption of 100 g/day (adults) or 50 g/day (toddlers) of nfuma.
ElementReference ValueEstimated Intake of Non-Essential Elements
NiTDI (µg/day/kg bw)EDI (% TDI)
ToddlersAdult
1315152
AlPTWI (µg/week/kg bw)EWI (% PTWI)
ToddlersAdult
20004415
CdPTMI (µg/month/kg bw)EMI (% PTMI)
ToddlersAdult
25114
TDI: tolerable daily intake (EFSA 2019); PTWI: provisional tolerable weekly intake; PTMI: provisional tolerable monthly intake (JEFCA 2021).
Publisher’s Note: MDPI stays neutral with regard to jurisdictional claims in published maps and institutional affiliations.

