Feature Mapping for Rice Leaf Defect Detection Based on a Custom Convolutional Architecture


Abstract
1. Introduction
1.1. Literature Review
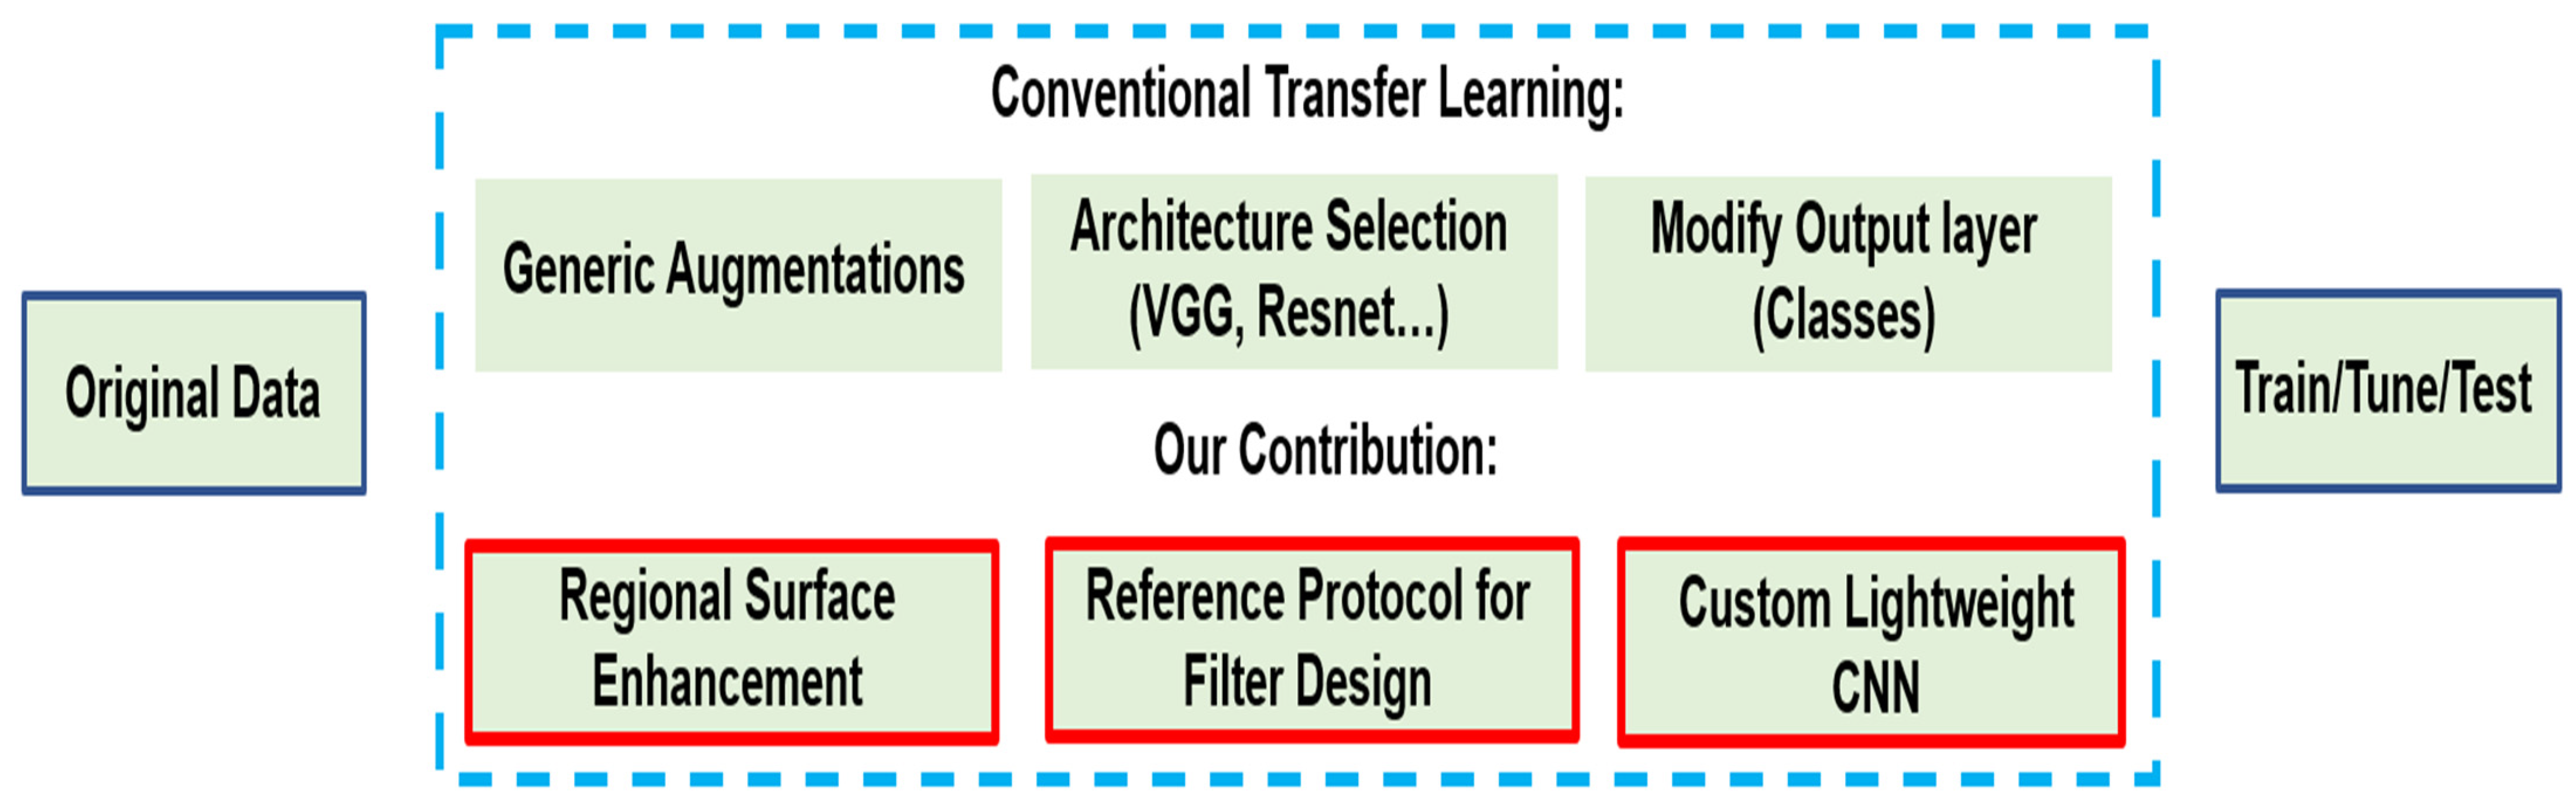
1.2. Paper Contribution
2. Methodology
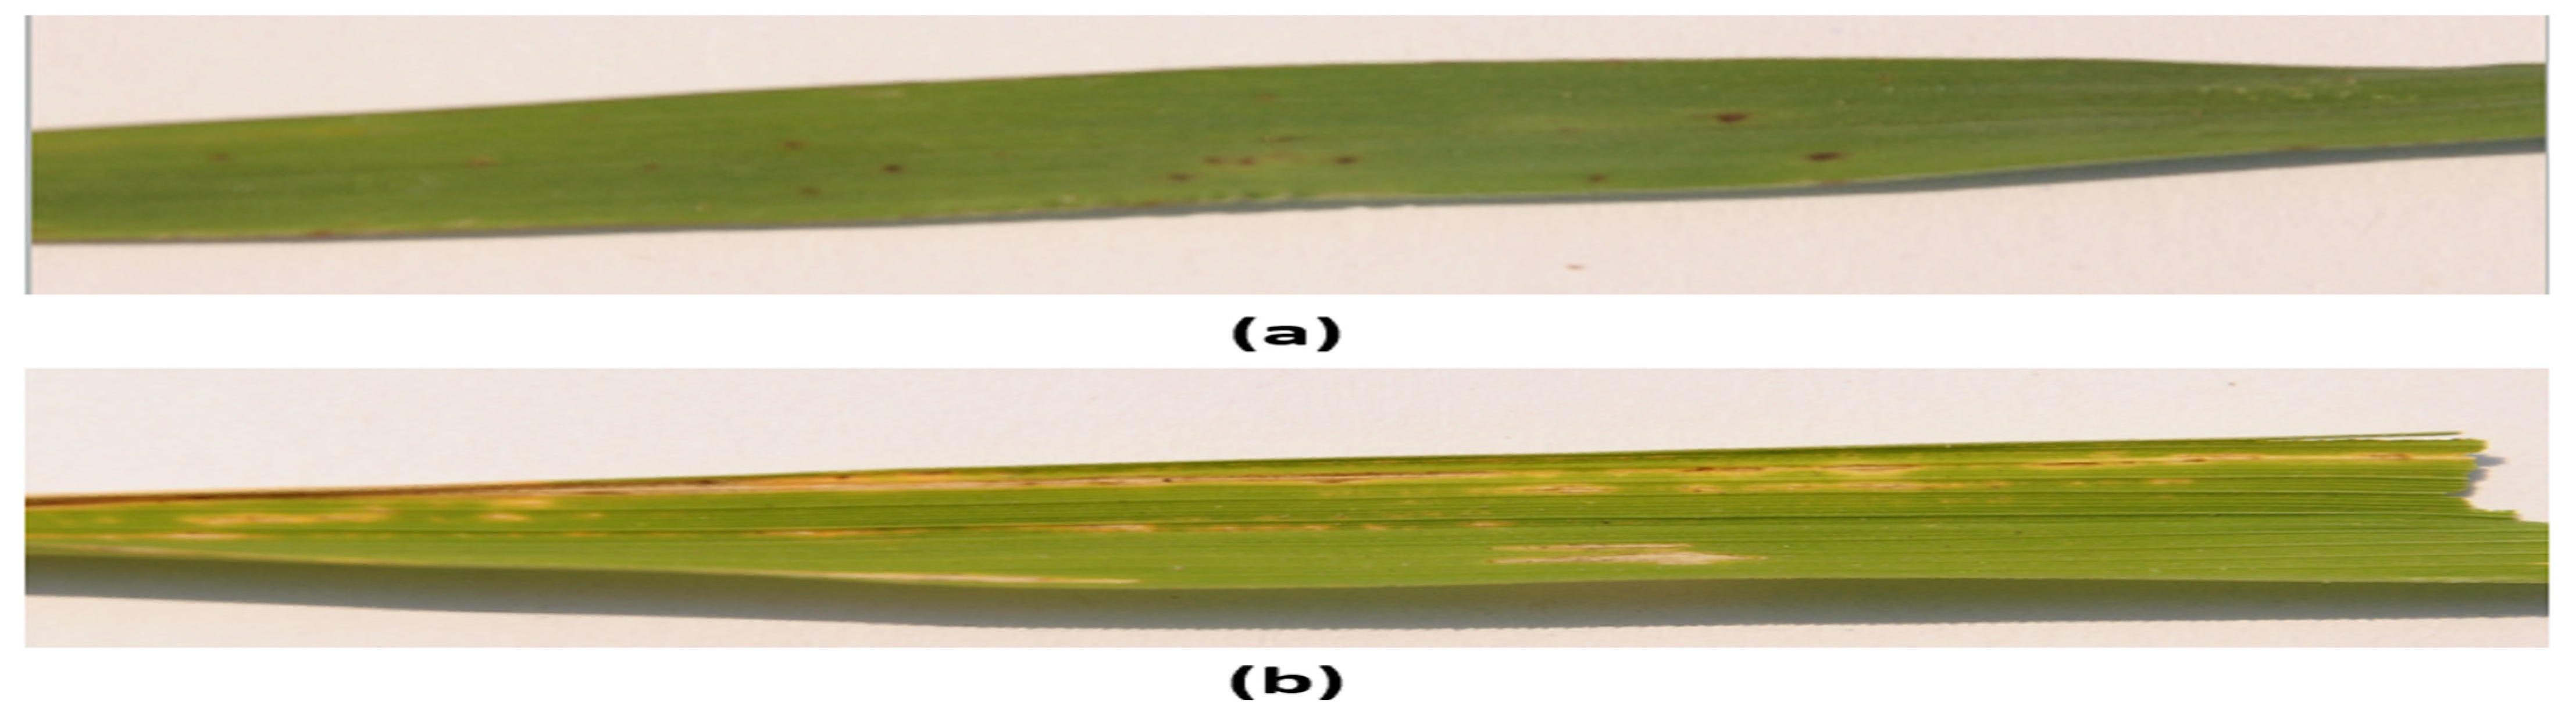
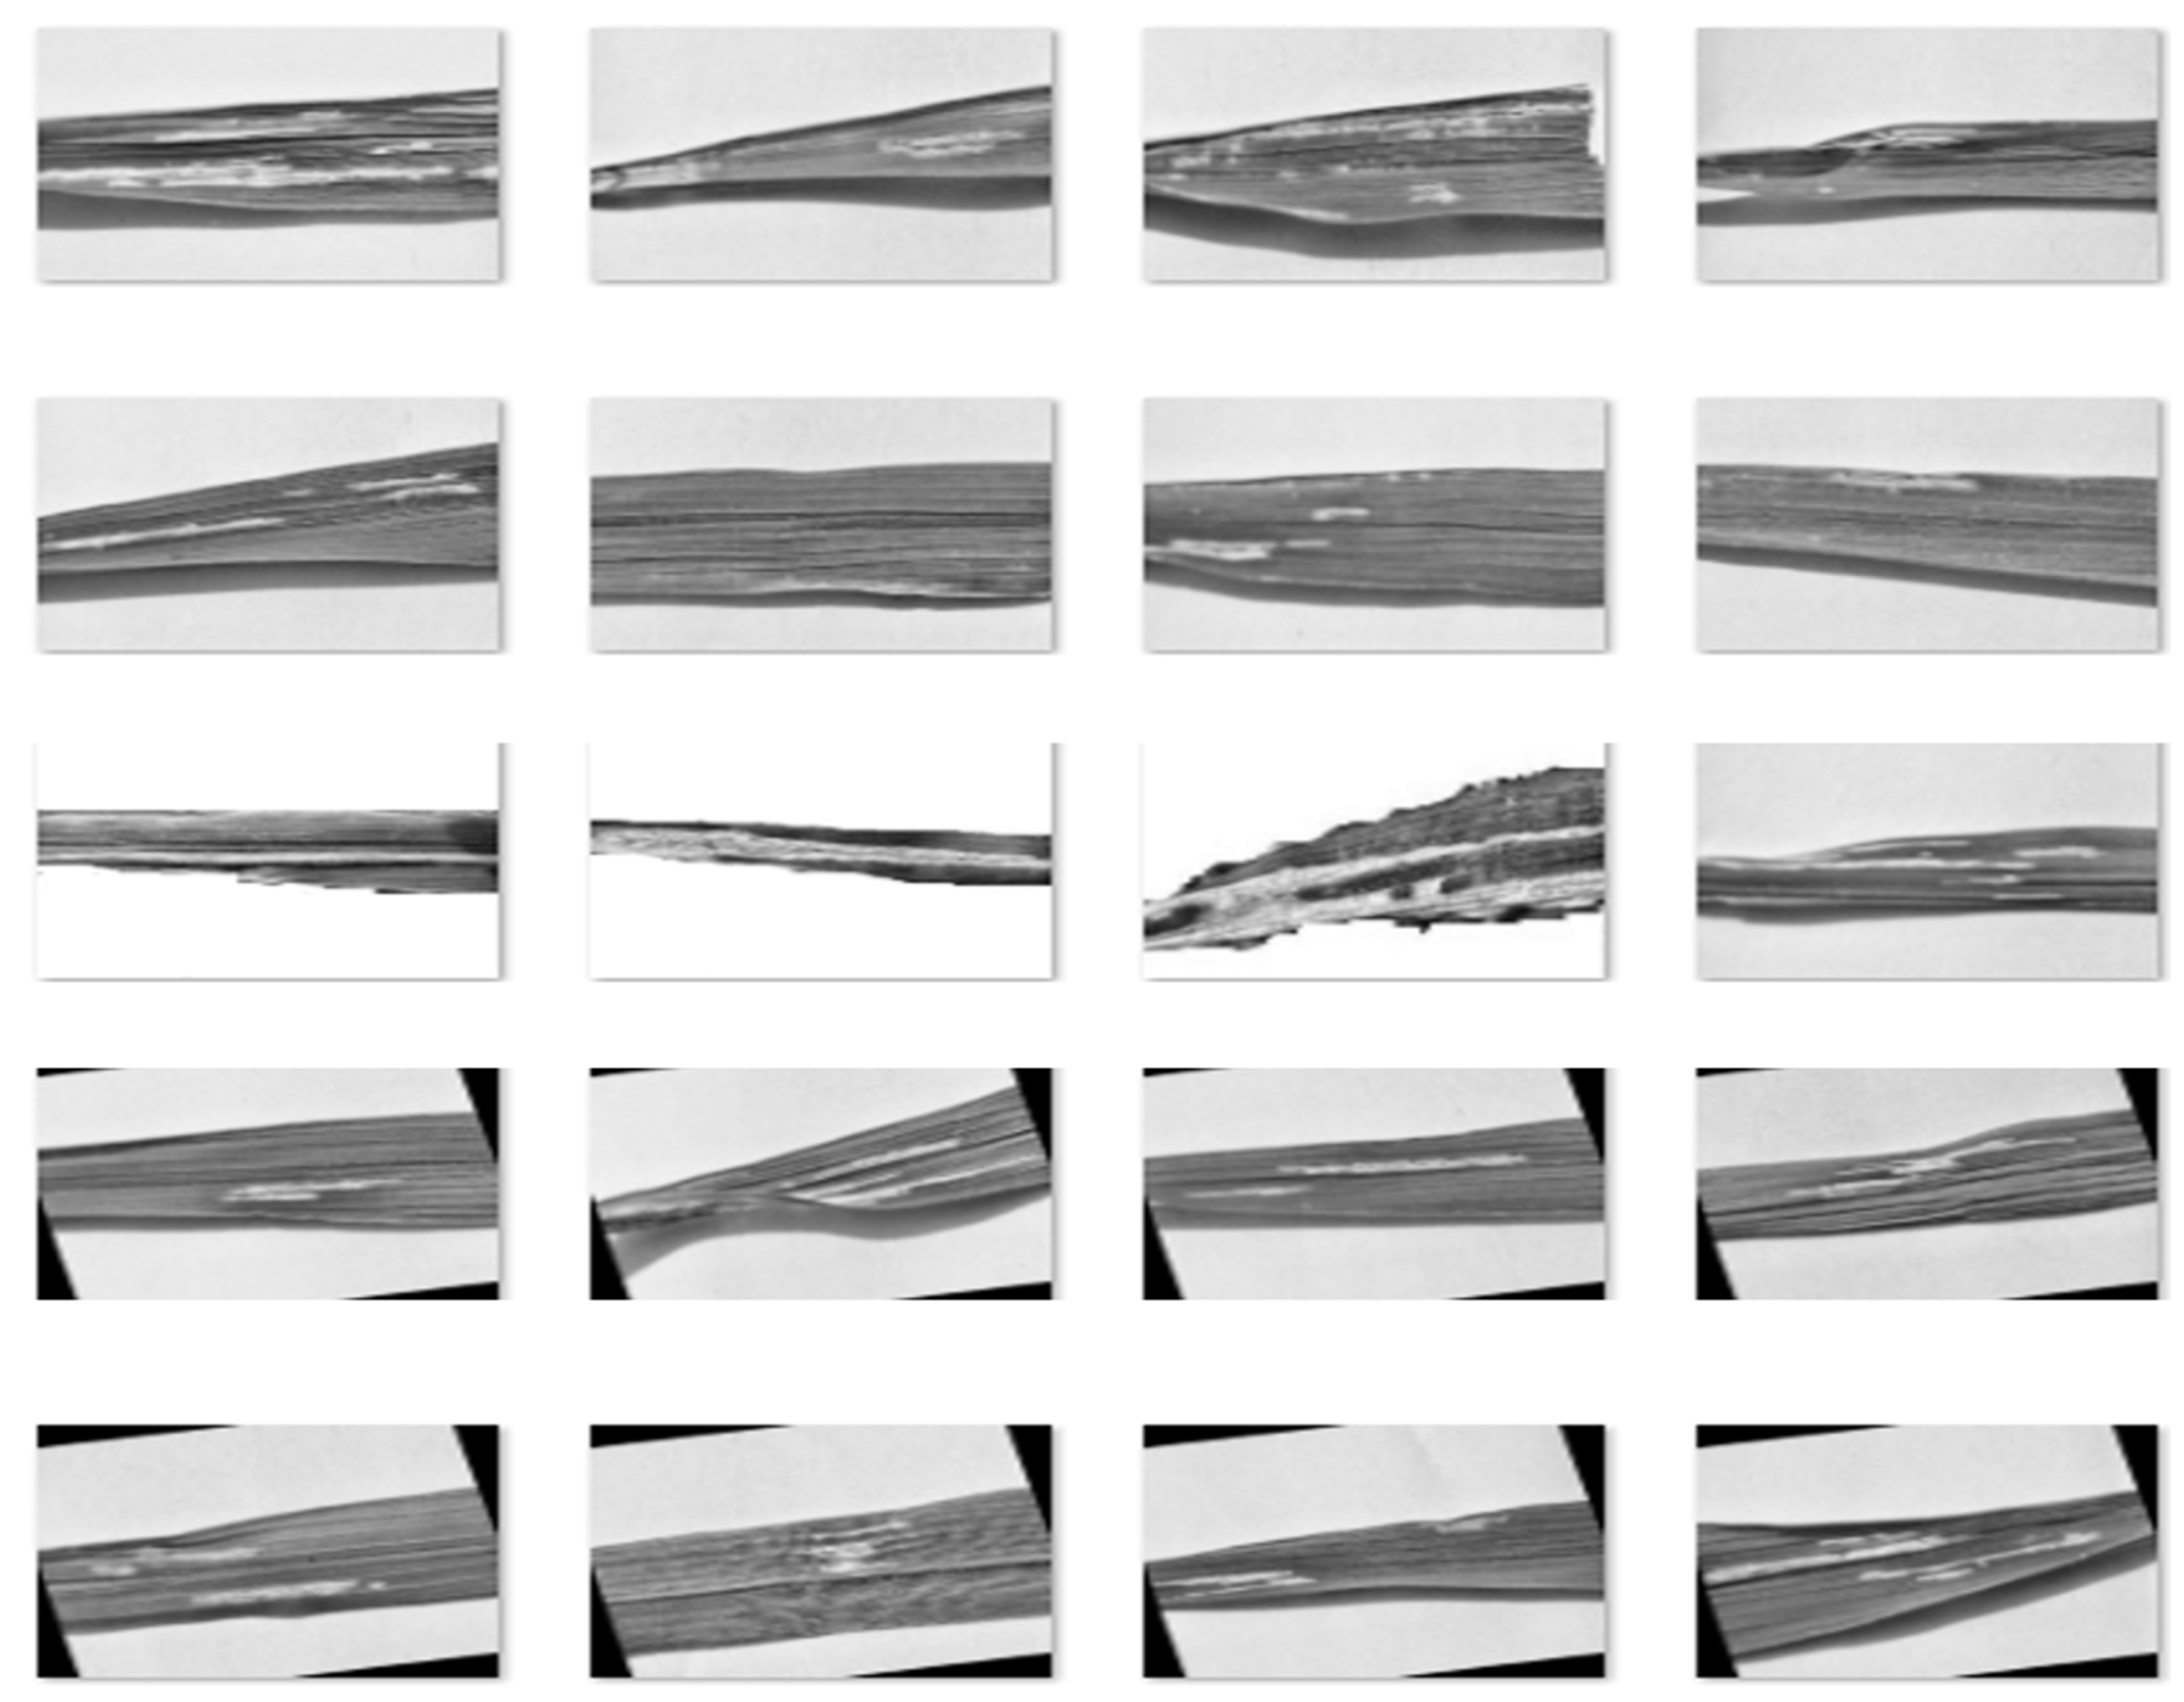
2.1. Dataset
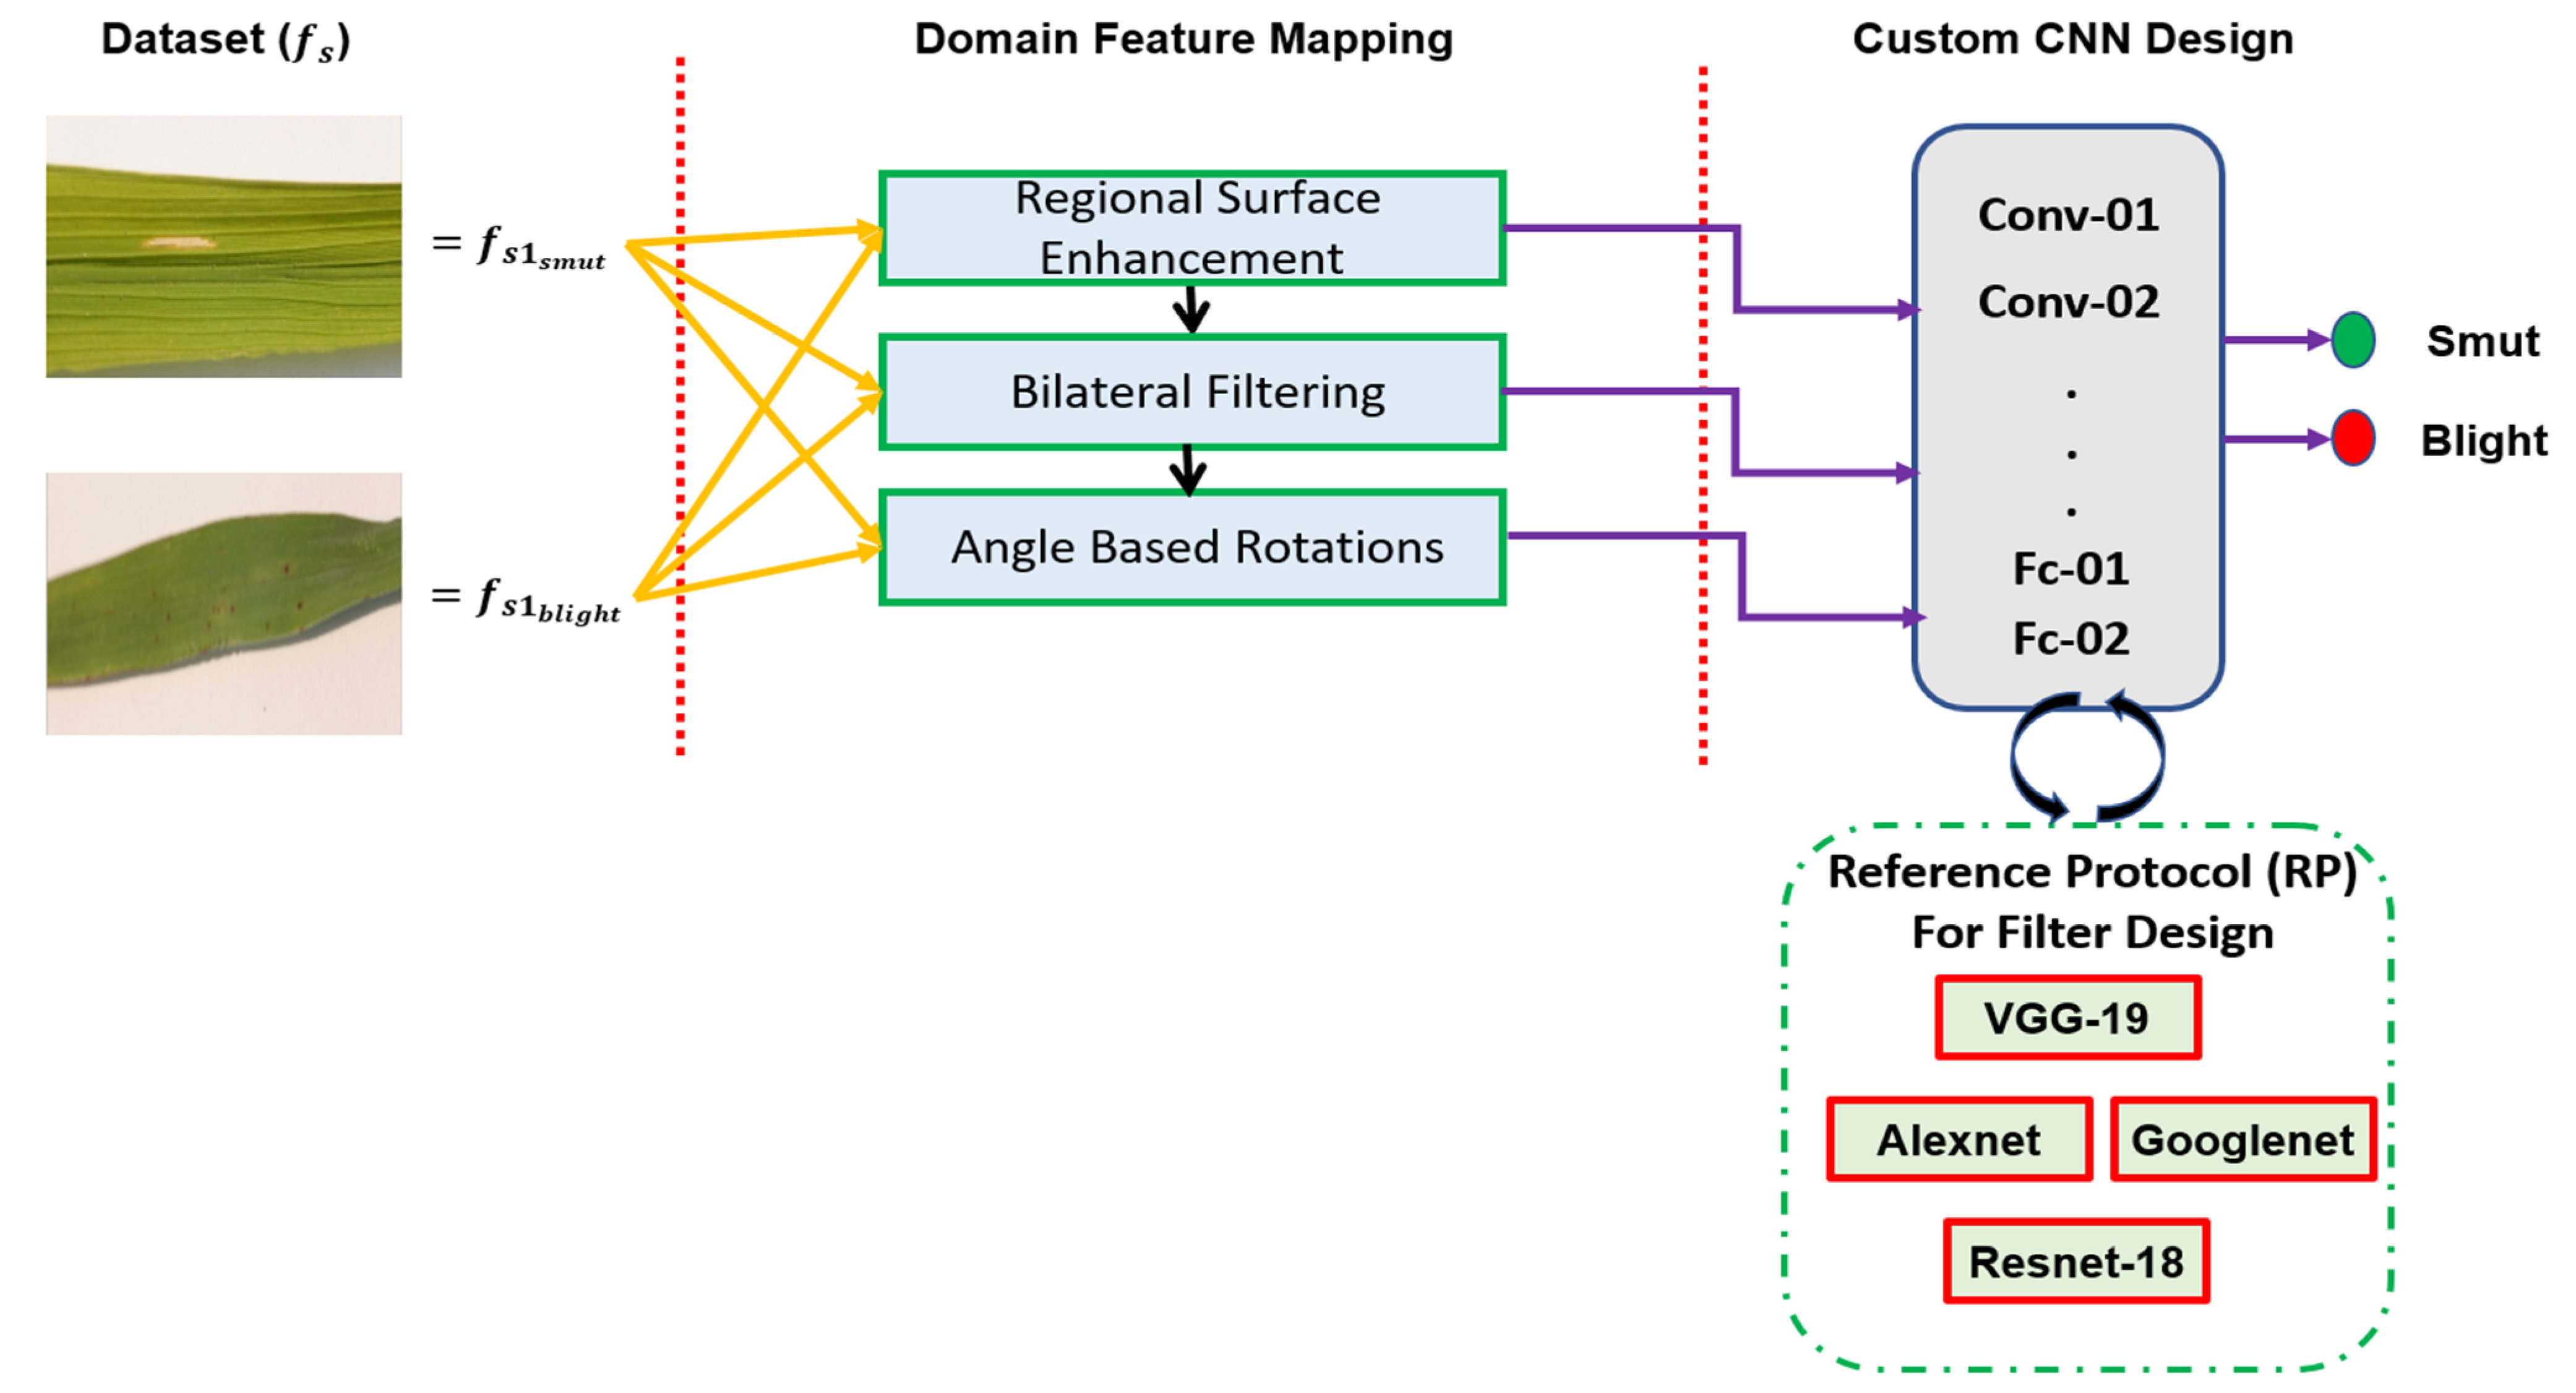
2.2. Proposed Methodology for Representative Data Scaling
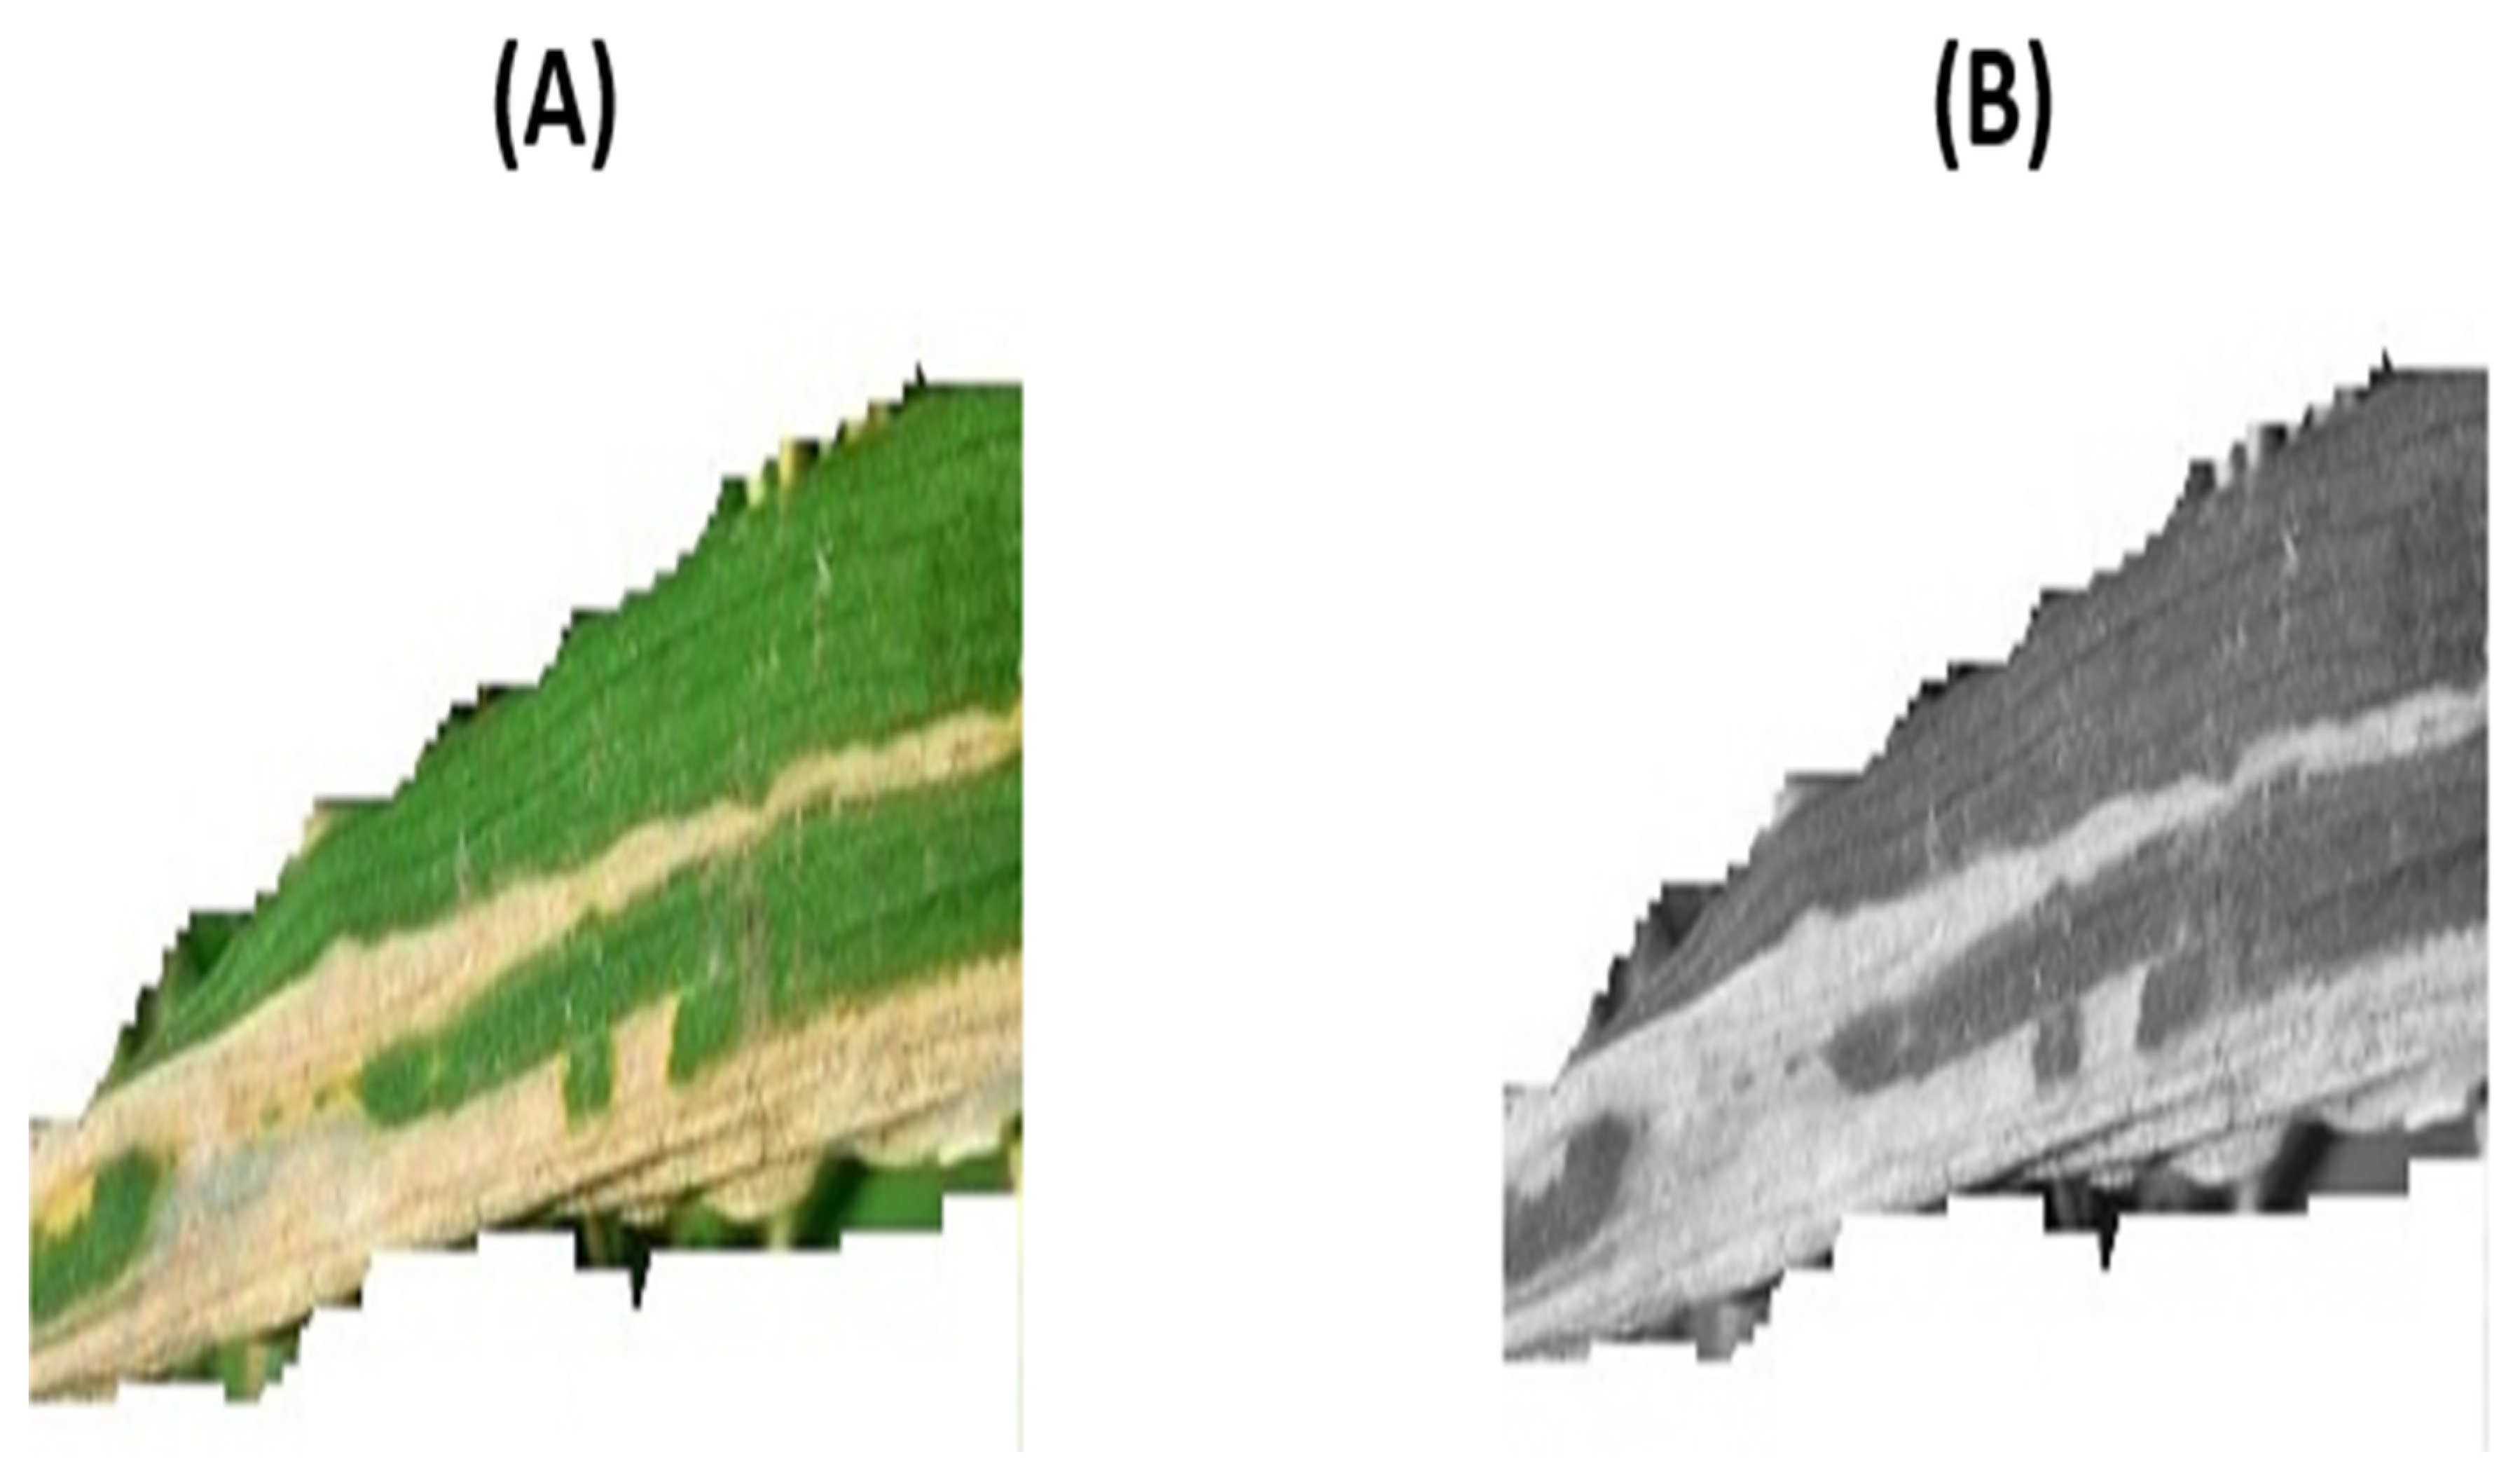
2.3. Class Accentuation
2.4. Device-Based Translation
2.5. Bilateral Filtering
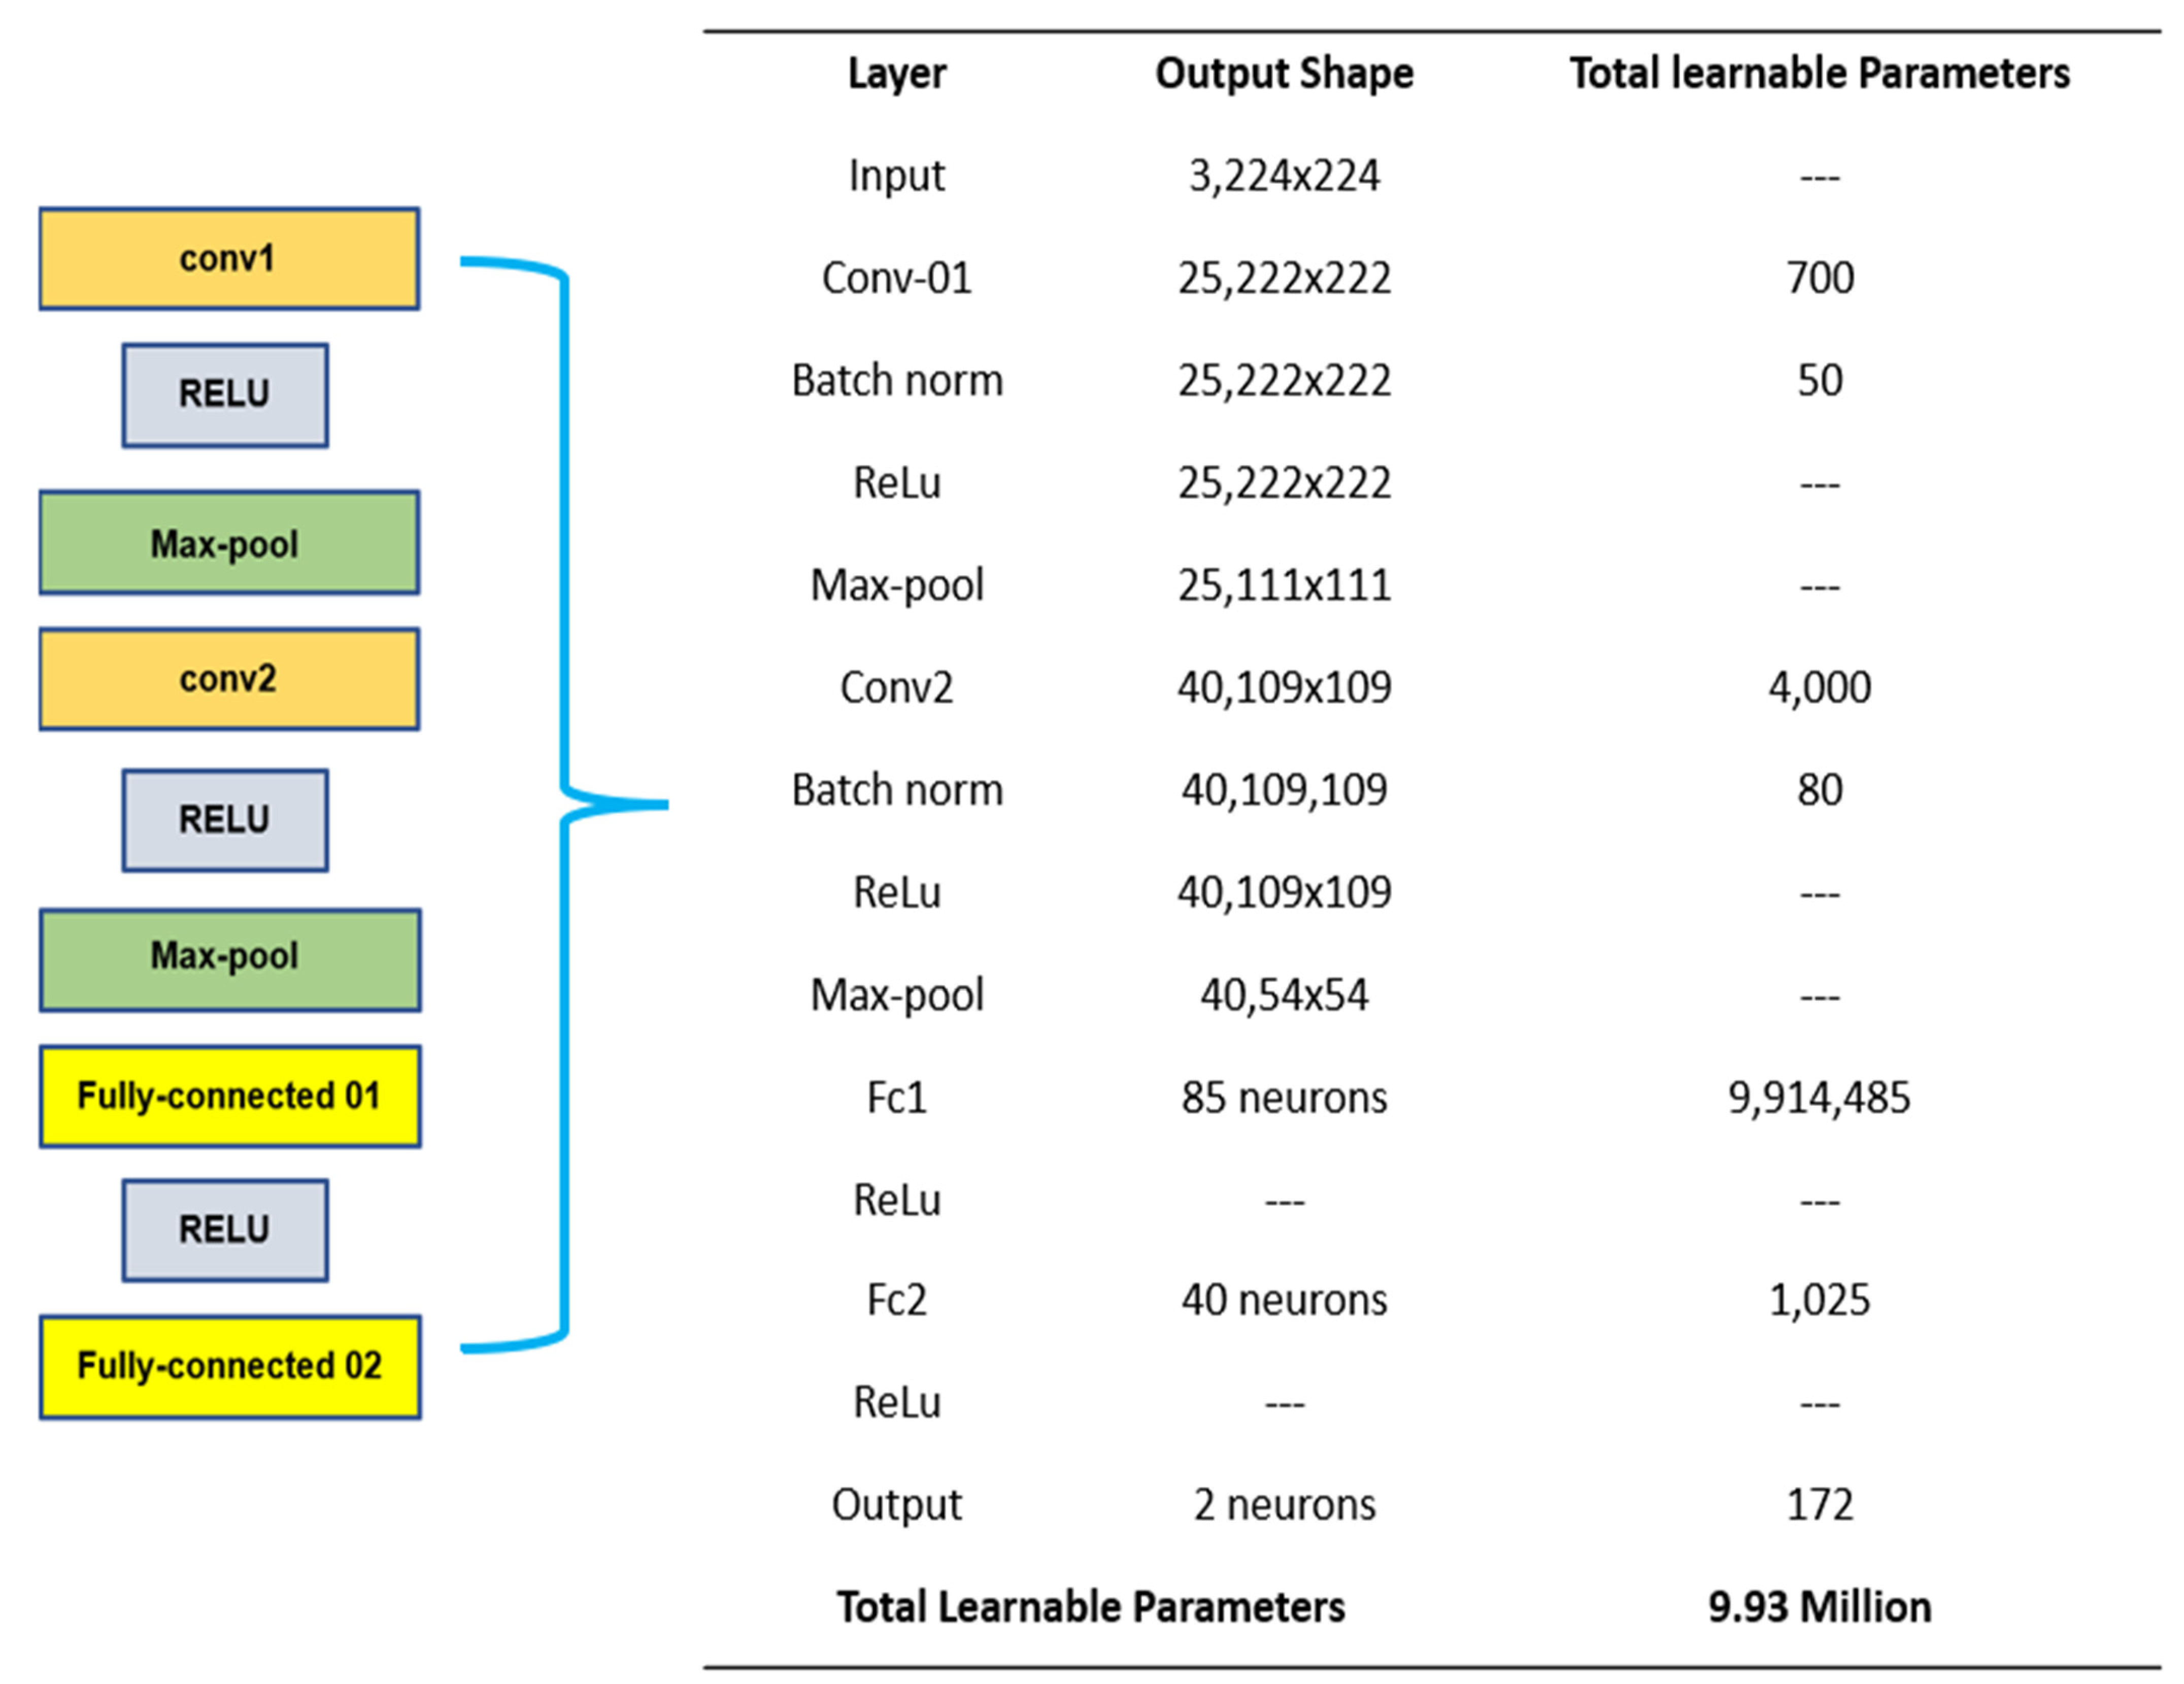
2.6. Proposed Architecture Design Mechanism
3. Results
3.1. Hyper-Parameters
3.2. Reference Protocol (RP) Comparison
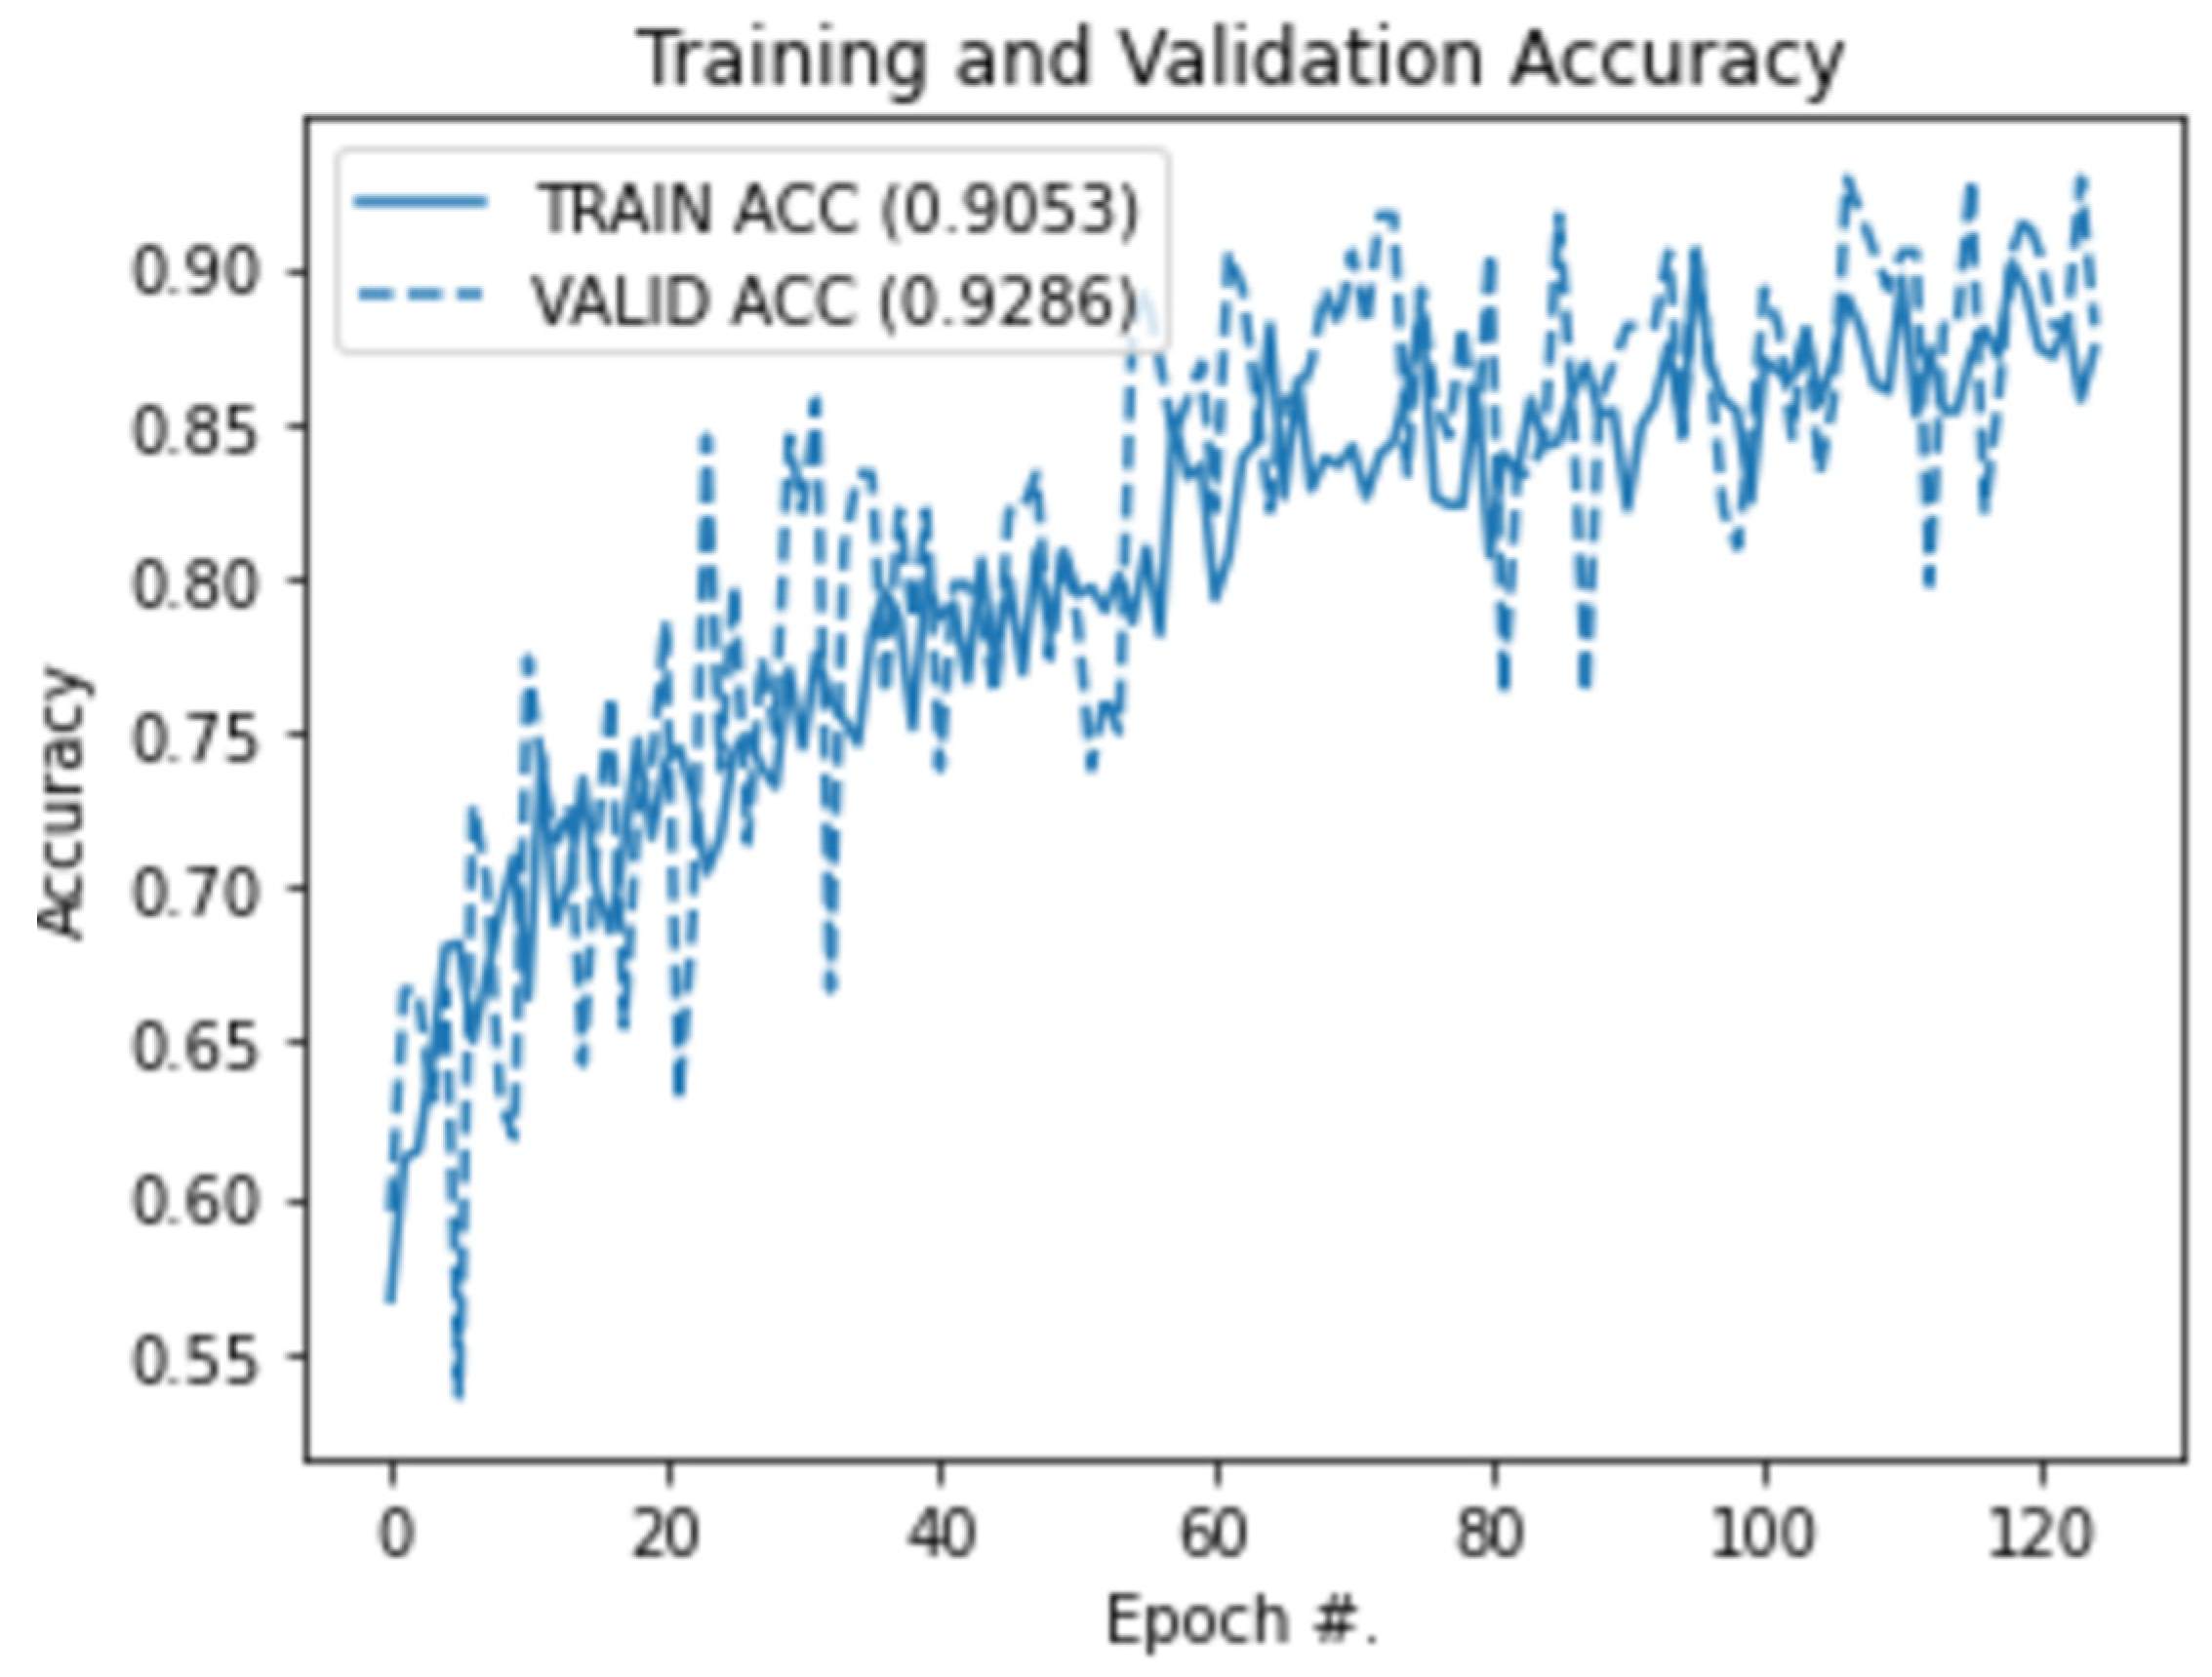
3.3. CNN Training and Validation
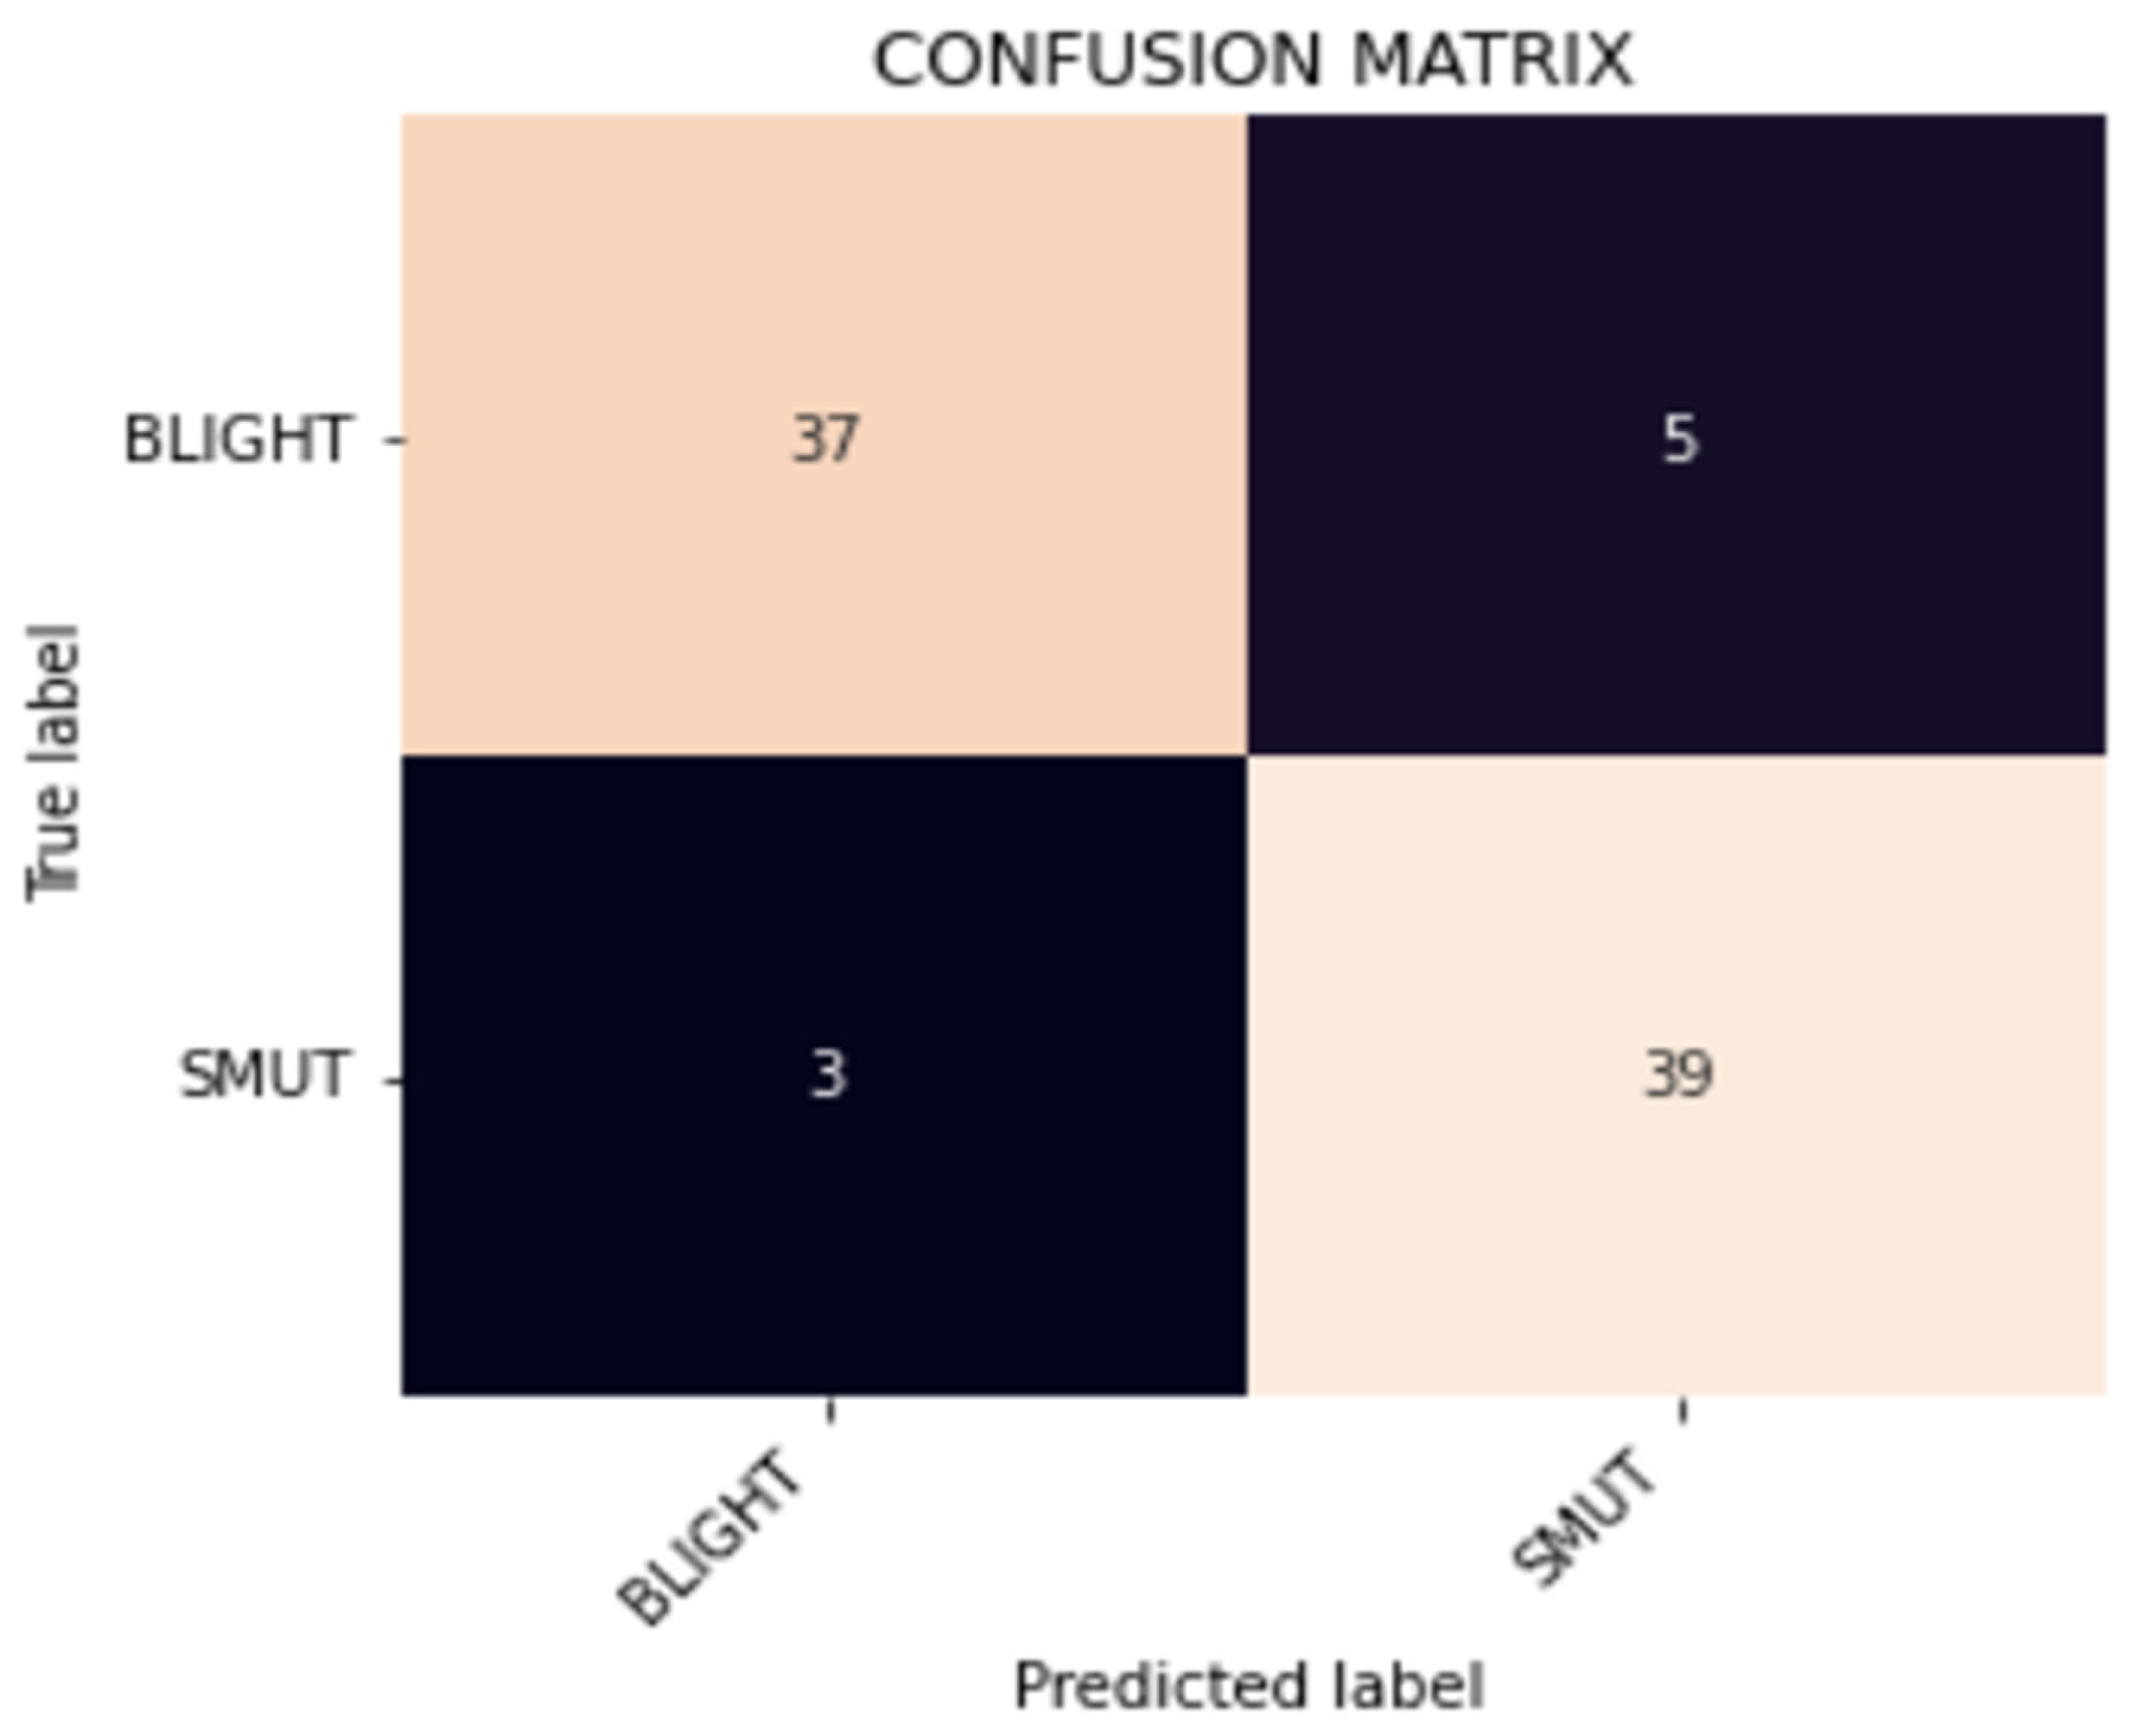
3.4. Test Data Performance
4. Discussion
5. Conclusions
Author Contributions
Funding
Data Availability Statement
Conflicts of Interest
References
- Total Global Rice Consumption 2021/22, Statista. Available online: https://www.statista.com/statistics/255977/total-globalrice-consumption/ (accessed on 27 July 2022).
- Trading Economics|20 Million Indicators for 196 Countries. Available online: https://tradingeconomics.com/bangladesh/gdp-from-agriculture (accessed on 27 July 2022).
- Sethy, P.K.; Barpanda, N.K.; Rath, A.K.; Behera, S.K. Image Processing Techniques for Diagnosing Rice Plant Disease: A Survey. Procedia Comput. Sci. 2020, 167, 516–530. [Google Scholar] [CrossRef]
- Hussain, M.; Chen, T.; Titrenko, S.; Su, P.; Mahmoud, M. A Gradient Guided Architecture Coupled with Filter Fused Representations for Micro-Crack Detection in Photovoltaic Cell Surfaces. IEEE Access 2022, 10, 58950–58964. [Google Scholar] [CrossRef]
- Hussain, M.; Chen, T.; Hill, R. Moving toward Smart Manufacturing with an Autonomous Pallet Racking Inspection System Based on MobileNetV2. J. Manuf. Mater. Process. 2022, 6, 75. [Google Scholar] [CrossRef]
- Haupt, J.; Nowak, R. Compressive Sampling Vs. Conventional Imaging. Int. Conf. Image Process. 2006, 1269–1272. [Google Scholar] [CrossRef]
- Phadikar, S. Classification of Rice Leaf Diseases Based on Morphological Changes. Int. J. Inf. Electron. Eng. 2012, 2, 460–463. [Google Scholar] [CrossRef]
- Zhou, G.; Zhang, W.; Chen, A.; He, M.; Ma, X. Rapid Detection of Rice Disease Based on FCM-KM and Faster R-CNN Fusion. IEEE Access 2019, 7, 143190–143206. [Google Scholar] [CrossRef]
- Liu, S. Pedestrian Detection based on Faster R-CNN. Int. J. Perform. Eng. 2019, 15, 1792. [Google Scholar] [CrossRef]
- Qin, F.; Liu, D.; Sun, B.; Ruan, L.; Ma, Z.; Wang, H. Identification of Alfalfa Leaf Diseases Using Image Recognition Technology. PLOS ONE 2016, 11, e0168274. [Google Scholar] [CrossRef] [PubMed]
- Phadikar, S.; Sil, J. Rice disease identification using pattern recognition techniques. In Proceedings of the 11th International Conference on Computer and Information Technology, Khulna, Bangladesh, 24–27 December 2008; pp. 420–423. [Google Scholar]
- Rahman, C.R.; Arko, P.S.; Ali, M.E.; Khan, M.A.I.; Apon, S.H.; Nowrin, F.; Wasif, A. Identification and recognition of rice diseases and pests using convolutional neural networks. Biosyst. Eng. 2020, 194, 112–120. [Google Scholar] [CrossRef]
- Huang, H.; Deng, J.; Lan, Y.; Yang, A.; Zhang, L.; Wen, S.; Zhang, H.; Zhang, Y.; Deng, Y. Detection of Helminthosporium Leaf Blotch Disease Based on UAV Imagery. Appl. Sci. 2019, 9, 558. [Google Scholar] [CrossRef]
- Islam, T.; Sah, M.; Baral, S.; RoyChoudhury, R. A faster technique on rice disease detection using image processing of affected area in agro-field. In Proceedings of the 2018 Second International Conference on Inventive Communication and Computational Technologies (ICICCT), Coimbatore, India, 20–21 April 2018; pp. 62–66. [Google Scholar]
- Asfarian, A.; Herdiyeni, Y.; Rauf, A.; Mutaqin, K.H. A computer vision for rice disease identification to support Integrated Pest Management. Crop Prot. 2014, 61, 103–104. [Google Scholar] [CrossRef]
- Albattah, W.; Javed, A.; Nawaz, M.; Masood, M.; Albahli, S. Artificial Intelligence-Based Drone System for Multiclass Plant Disease Detection Using an Improved Efficient Convolutional Neural Network. Front. Plant Sci. 2022, 13, 808380. [Google Scholar] [CrossRef] [PubMed]
- Atila, Ü.; Uçar, M.; Akyol, K.; Uçar, E. Plant leaf disease classification using efficientnet deep learning model. Ecol. Inform. 2021, 61, 101182. [Google Scholar] [CrossRef]
- Shah, D.; Trivedi, V.; Sheth, V.; Shah, A.; Chauhan, U. ResTS: Residual deep interpretable architecture for plant disease detection. Inf. Process. Agric. 2021, 4, 123–144. [Google Scholar] [CrossRef]
- Le, V.N.T.; Ahderom, S.; Apopei, B.; Alameh, K. A novel method for detecting morphologically similar crops and weeds based on the combination of contour masks and filtered Local Binary Pattern operators. GigaScience 2020, 9, giaa017. [Google Scholar] [CrossRef] [PubMed]
- Tm, P.; Pranathi, A.; SaiAshritha, K.; Chittaragi, N.B.; Koolagudi, S.G. Tomato Leaf Disease Detection Using Convolutional Neural Networks. In Proceedings of the 2018 Eleventh International Conference on Contemporary Computing (IC3), Noida, India, 2–4 August 2018; pp. 1–5. [Google Scholar] [CrossRef]
- Hussain, M.; Al-Aqrabi, H.; Hill, R. Statistical Analysis and Development of an Ensemble-Based Machine Learning Model for Photovoltaic Fault Detection. Energies 2022, 15, 5492. [Google Scholar] [CrossRef]
- Hussain, M.; Dhimish, M.; Holmes, V.; Mather, P. Deployment of AI-based RBF network for photovoltaics fault detection procedure. AIMS Electron. Electr. Eng. 2020, 4, 1–18. [Google Scholar] [CrossRef]
- Hussain, M.; Al-Aqrabi, H.; Munawar, M.; Hill, R.; Alsboui, T. Domain Feature Mapping with YOLOv7 for Automated Edge-Based Pallet Racking Inspections. Sensors 2022, 22, 6927. [Google Scholar] [CrossRef] [PubMed]
- Hussain, M.; Al-Aqrabi, H.; Munawar, M.; Hill, R.; Parkinson, S. Exudate Regeneration for Automated Exudate Detection in Retinal Fundus Images. IEEE Access 2022, in press. [Google Scholar] [CrossRef]
- Hussain, M.; Al-Aqrabi, H.; Hill, R. PV-CrackNet Architecture for Filter Induced Augmentation and Micro-Cracks Detection within a Photovoltaic Manufacturing Facility. Energies 2022, 15, 8667. [Google Scholar] [CrossRef]


| Smut | 40 |
| Blight | 40 |
| Class | Training | Validation | Test |
|---|---|---|---|
| smut | 196 | 42 | 42 |
| blight | 196 | 42 | 42 |
| Batch Size | 4 |
| Epochs | 125 |
| Learning Rate | 0.001 |
| Loss | Cross Entropy |
| Optimizer | SGD-M |
| Architecture | Parameters (M) |
|---|---|
| Our Model | 9.93 |
| VGG-19 | 143.67 |
| ResNet-18 | 11.69 |
| AlexNet | 61.0 |
| Googlenet | 13.0 |
| Metric | Score (%) |
|---|---|
| Accuracy | 94.10 |
| Precision | 95.0 |
| Recall | 93.0 |
| F1-score | 94.0 |
Publisher’s Note: MDPI stays neutral with regard to jurisdictional claims in published maps and institutional affiliations. |
© 2022 by the authors. Licensee MDPI, Basel, Switzerland. This article is an open access article distributed under the terms and conditions of the Creative Commons Attribution (CC BY) license (https://creativecommons.org/licenses/by/4.0/).
Share and Cite
Hussain, M.; Al-Aqrabi, H.; Munawar, M.; Hill, R. Feature Mapping for Rice Leaf Defect Detection Based on a Custom Convolutional Architecture. Foods 2022, 11, 3914. https://doi.org/10.3390/foods11233914
Hussain M, Al-Aqrabi H, Munawar M, Hill R. Feature Mapping for Rice Leaf Defect Detection Based on a Custom Convolutional Architecture. Foods. 2022; 11(23):3914. https://doi.org/10.3390/foods11233914
Chicago/Turabian StyleHussain, Muhammad, Hussain Al-Aqrabi, Muhammad Munawar, and Richard Hill. 2022. "Feature Mapping for Rice Leaf Defect Detection Based on a Custom Convolutional Architecture" Foods 11, no. 23: 3914. https://doi.org/10.3390/foods11233914
APA StyleHussain, M., Al-Aqrabi, H., Munawar, M., & Hill, R. (2022). Feature Mapping for Rice Leaf Defect Detection Based on a Custom Convolutional Architecture. Foods, 11(23), 3914. https://doi.org/10.3390/foods11233914