


Simultaneous Determination of 11 Mycotoxins in Maize via Multiple-Impurity Adsorption Combined with Liquid Chromatography–Tandem Mass Spectrometry
 ,
, 
Abstract
1. Introduction
2. Materials and Methods
2.1. Instruments and Reagents
2.2. Purification and Adsorption Material Selection
2.3. Test Method
2.3.1. Standard Solution Preparation
2.3.2. Formulation of Adsorbent Materials for Multiple-Adsorption Pre-treatment
2.3.3. Sample Pre-Treatment
2.3.4. Preparation of Blank Maize Substrate Solution
2.4. Method Validation
2.5. Chromatographic and Mass Spectrometric Conditions
3. Results and Discussion
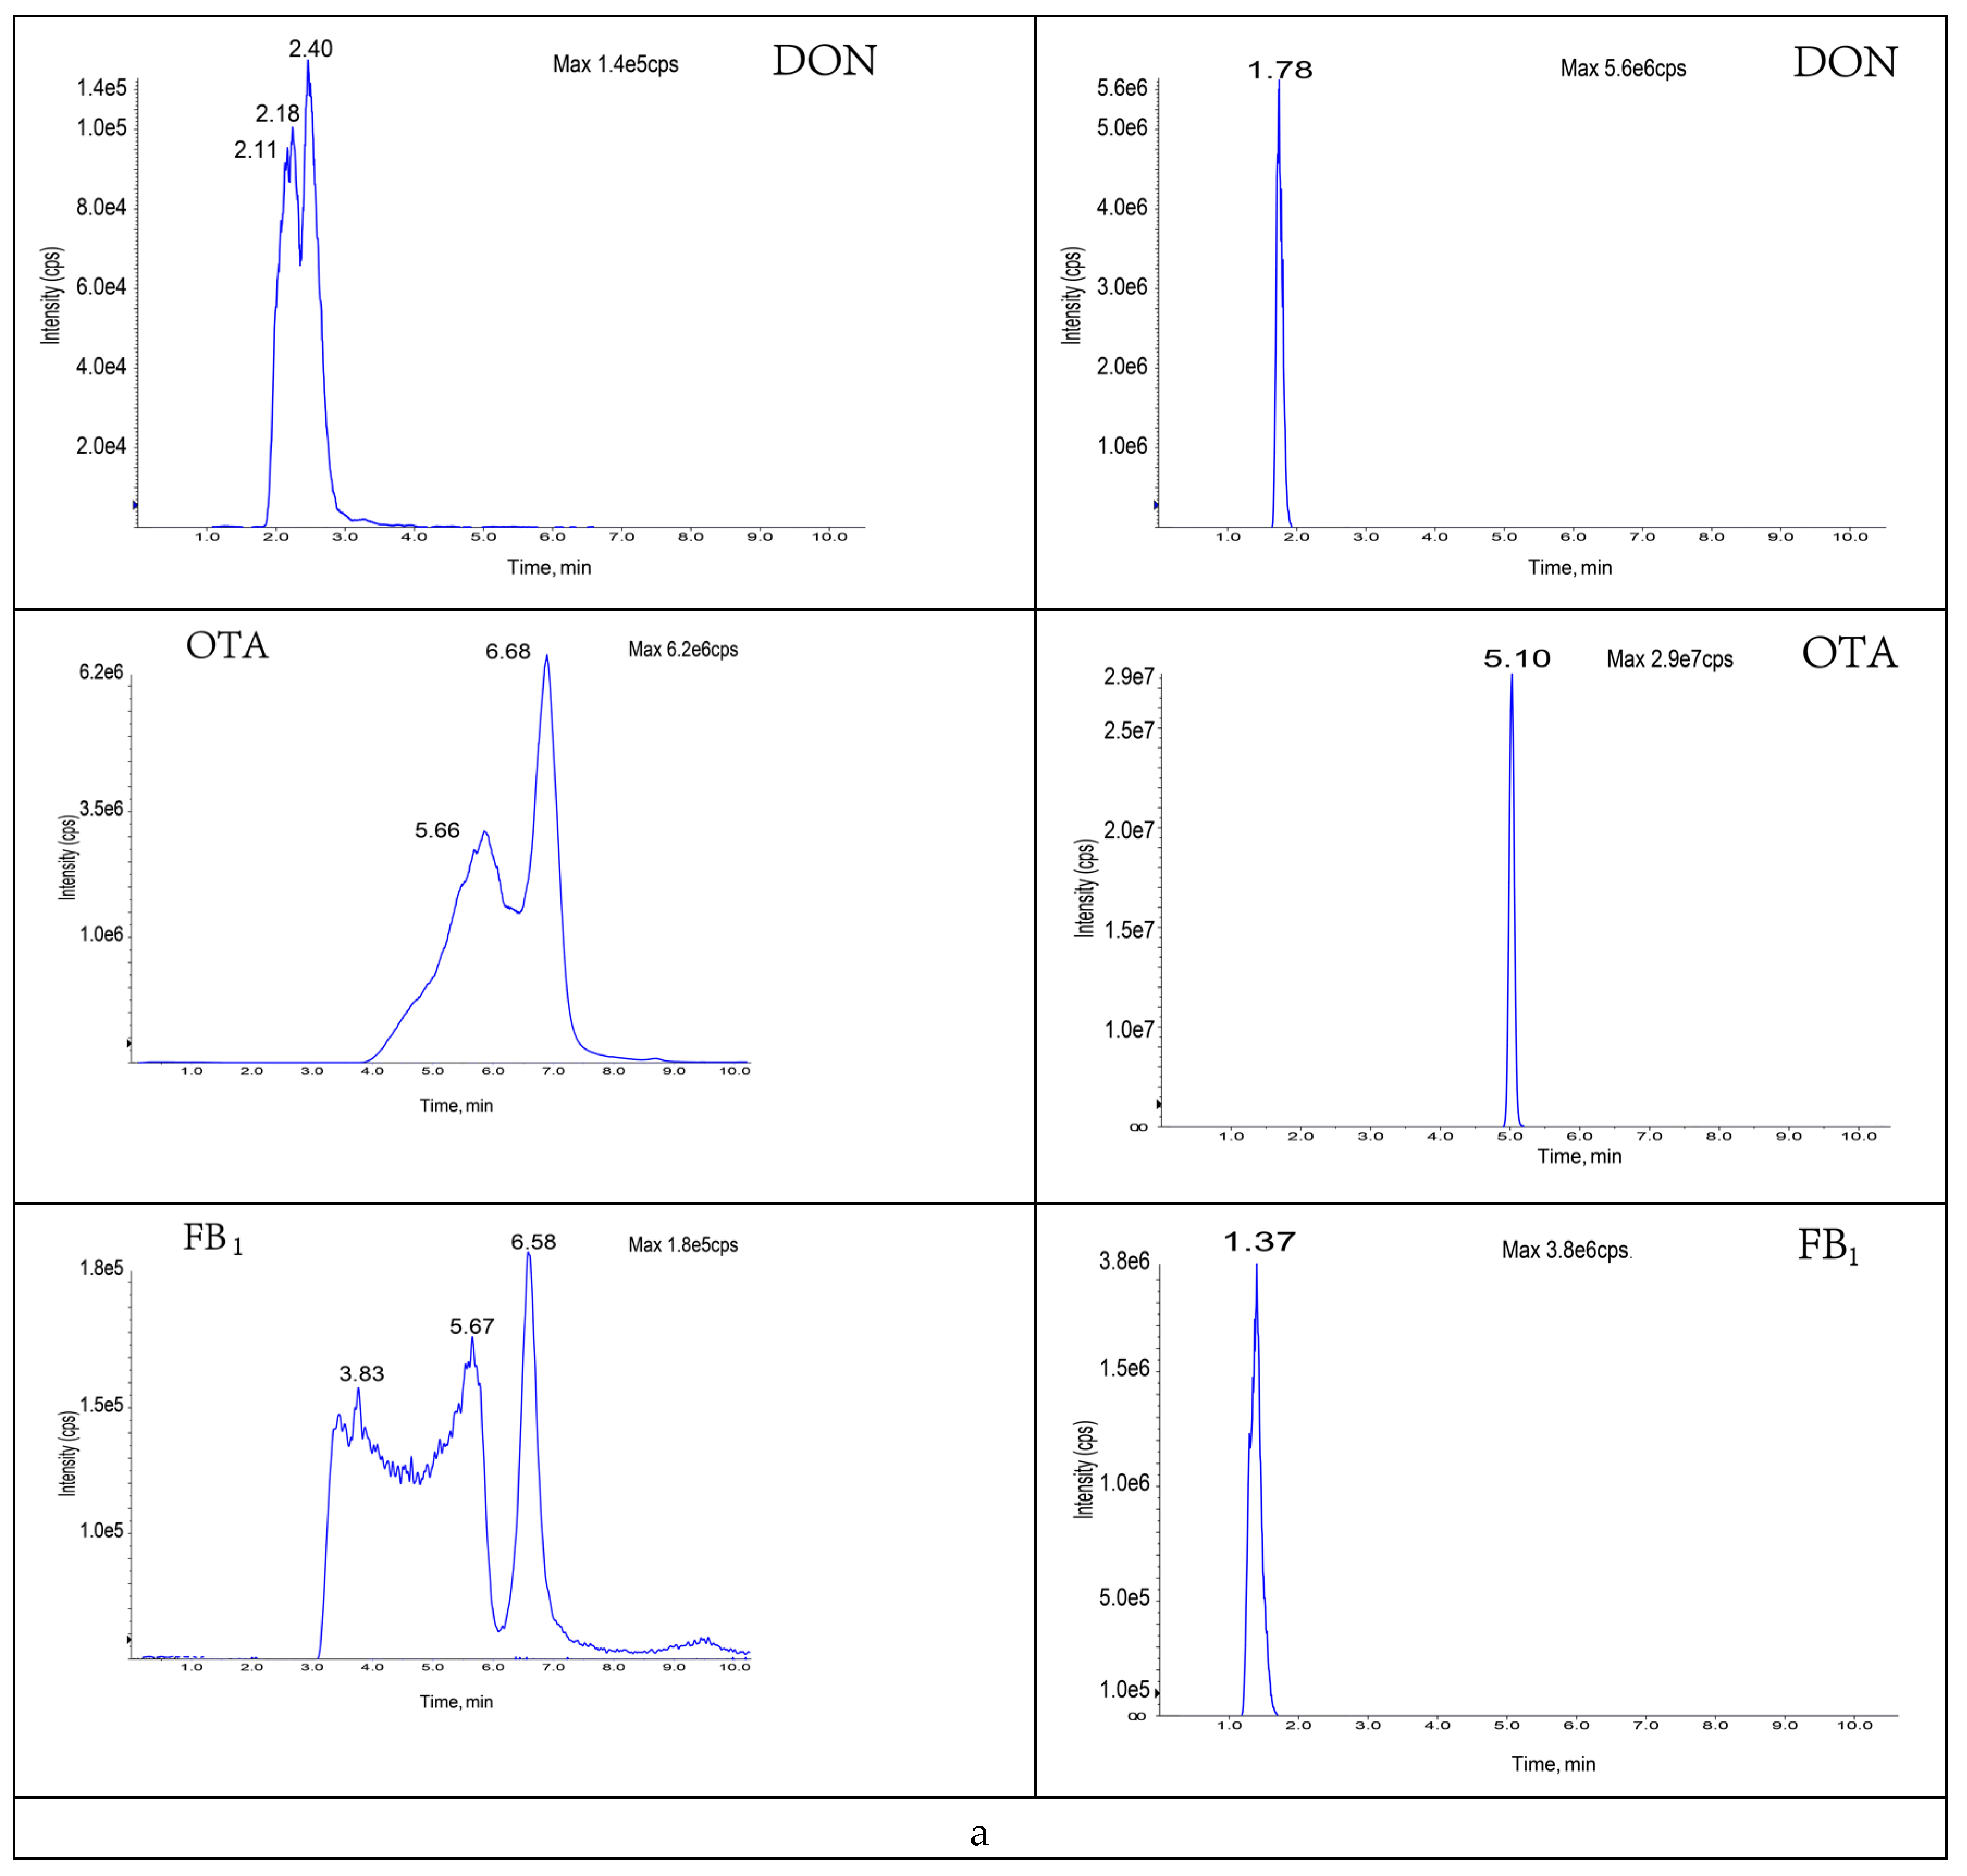
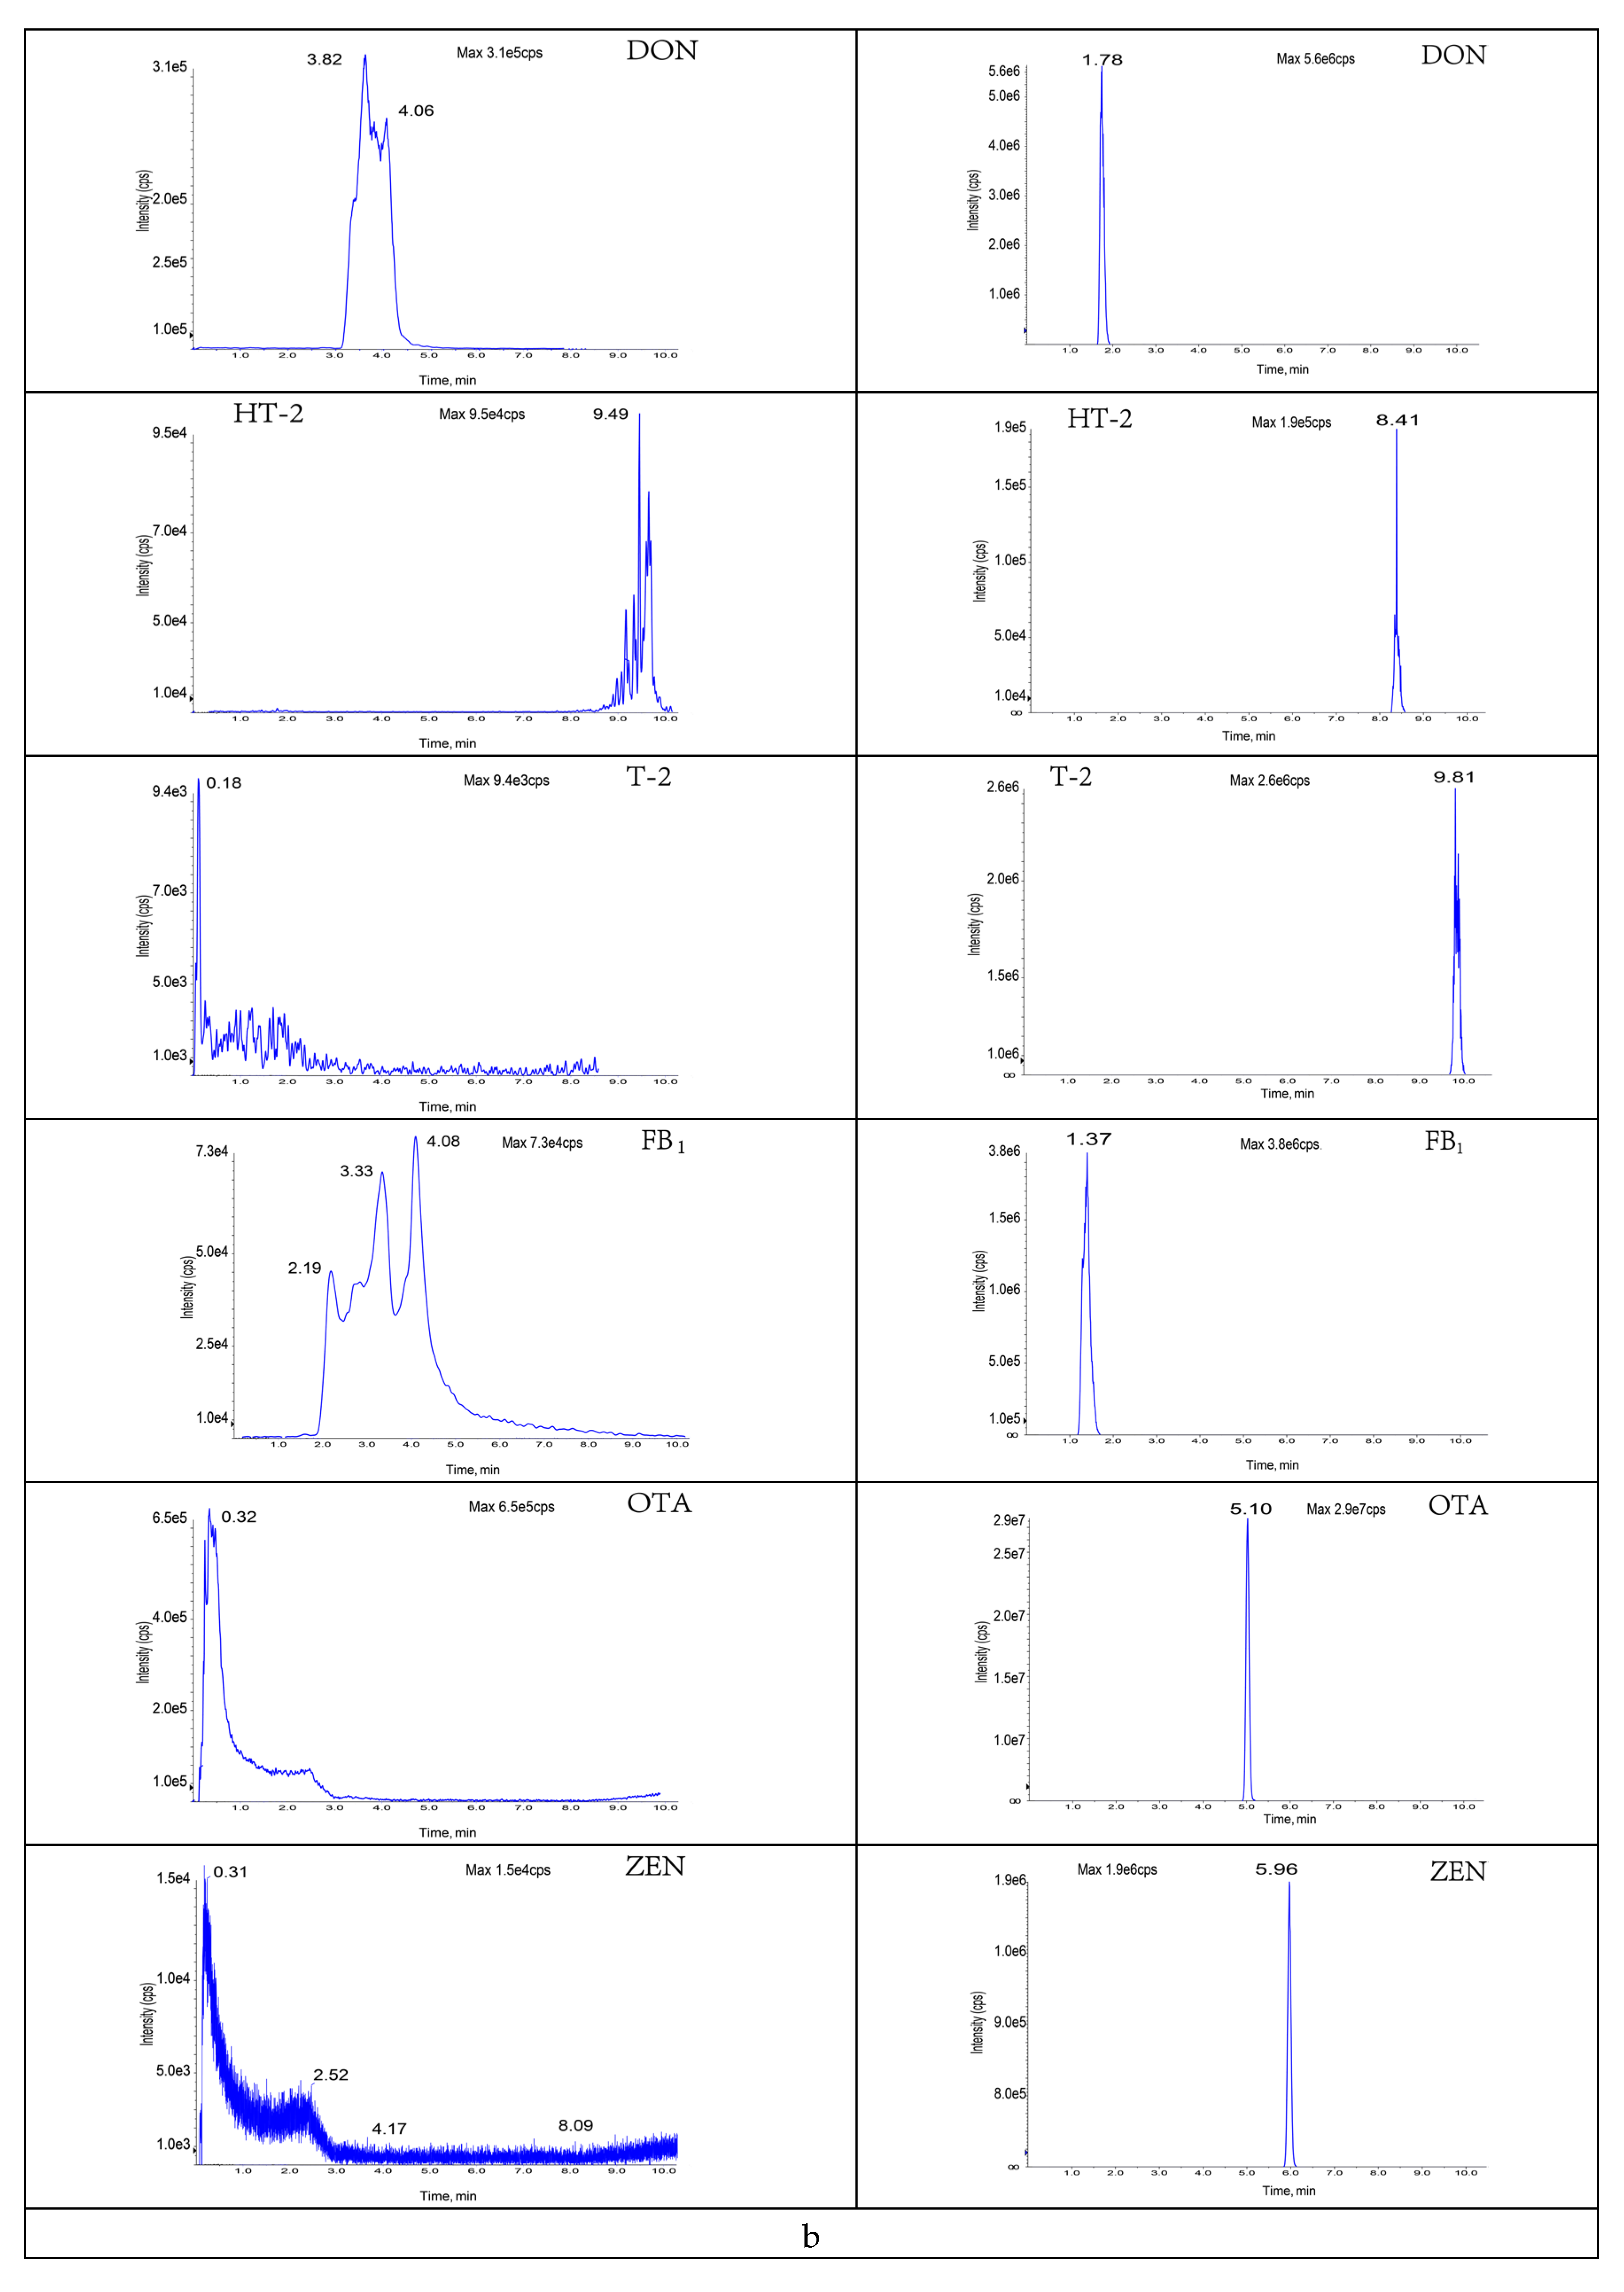
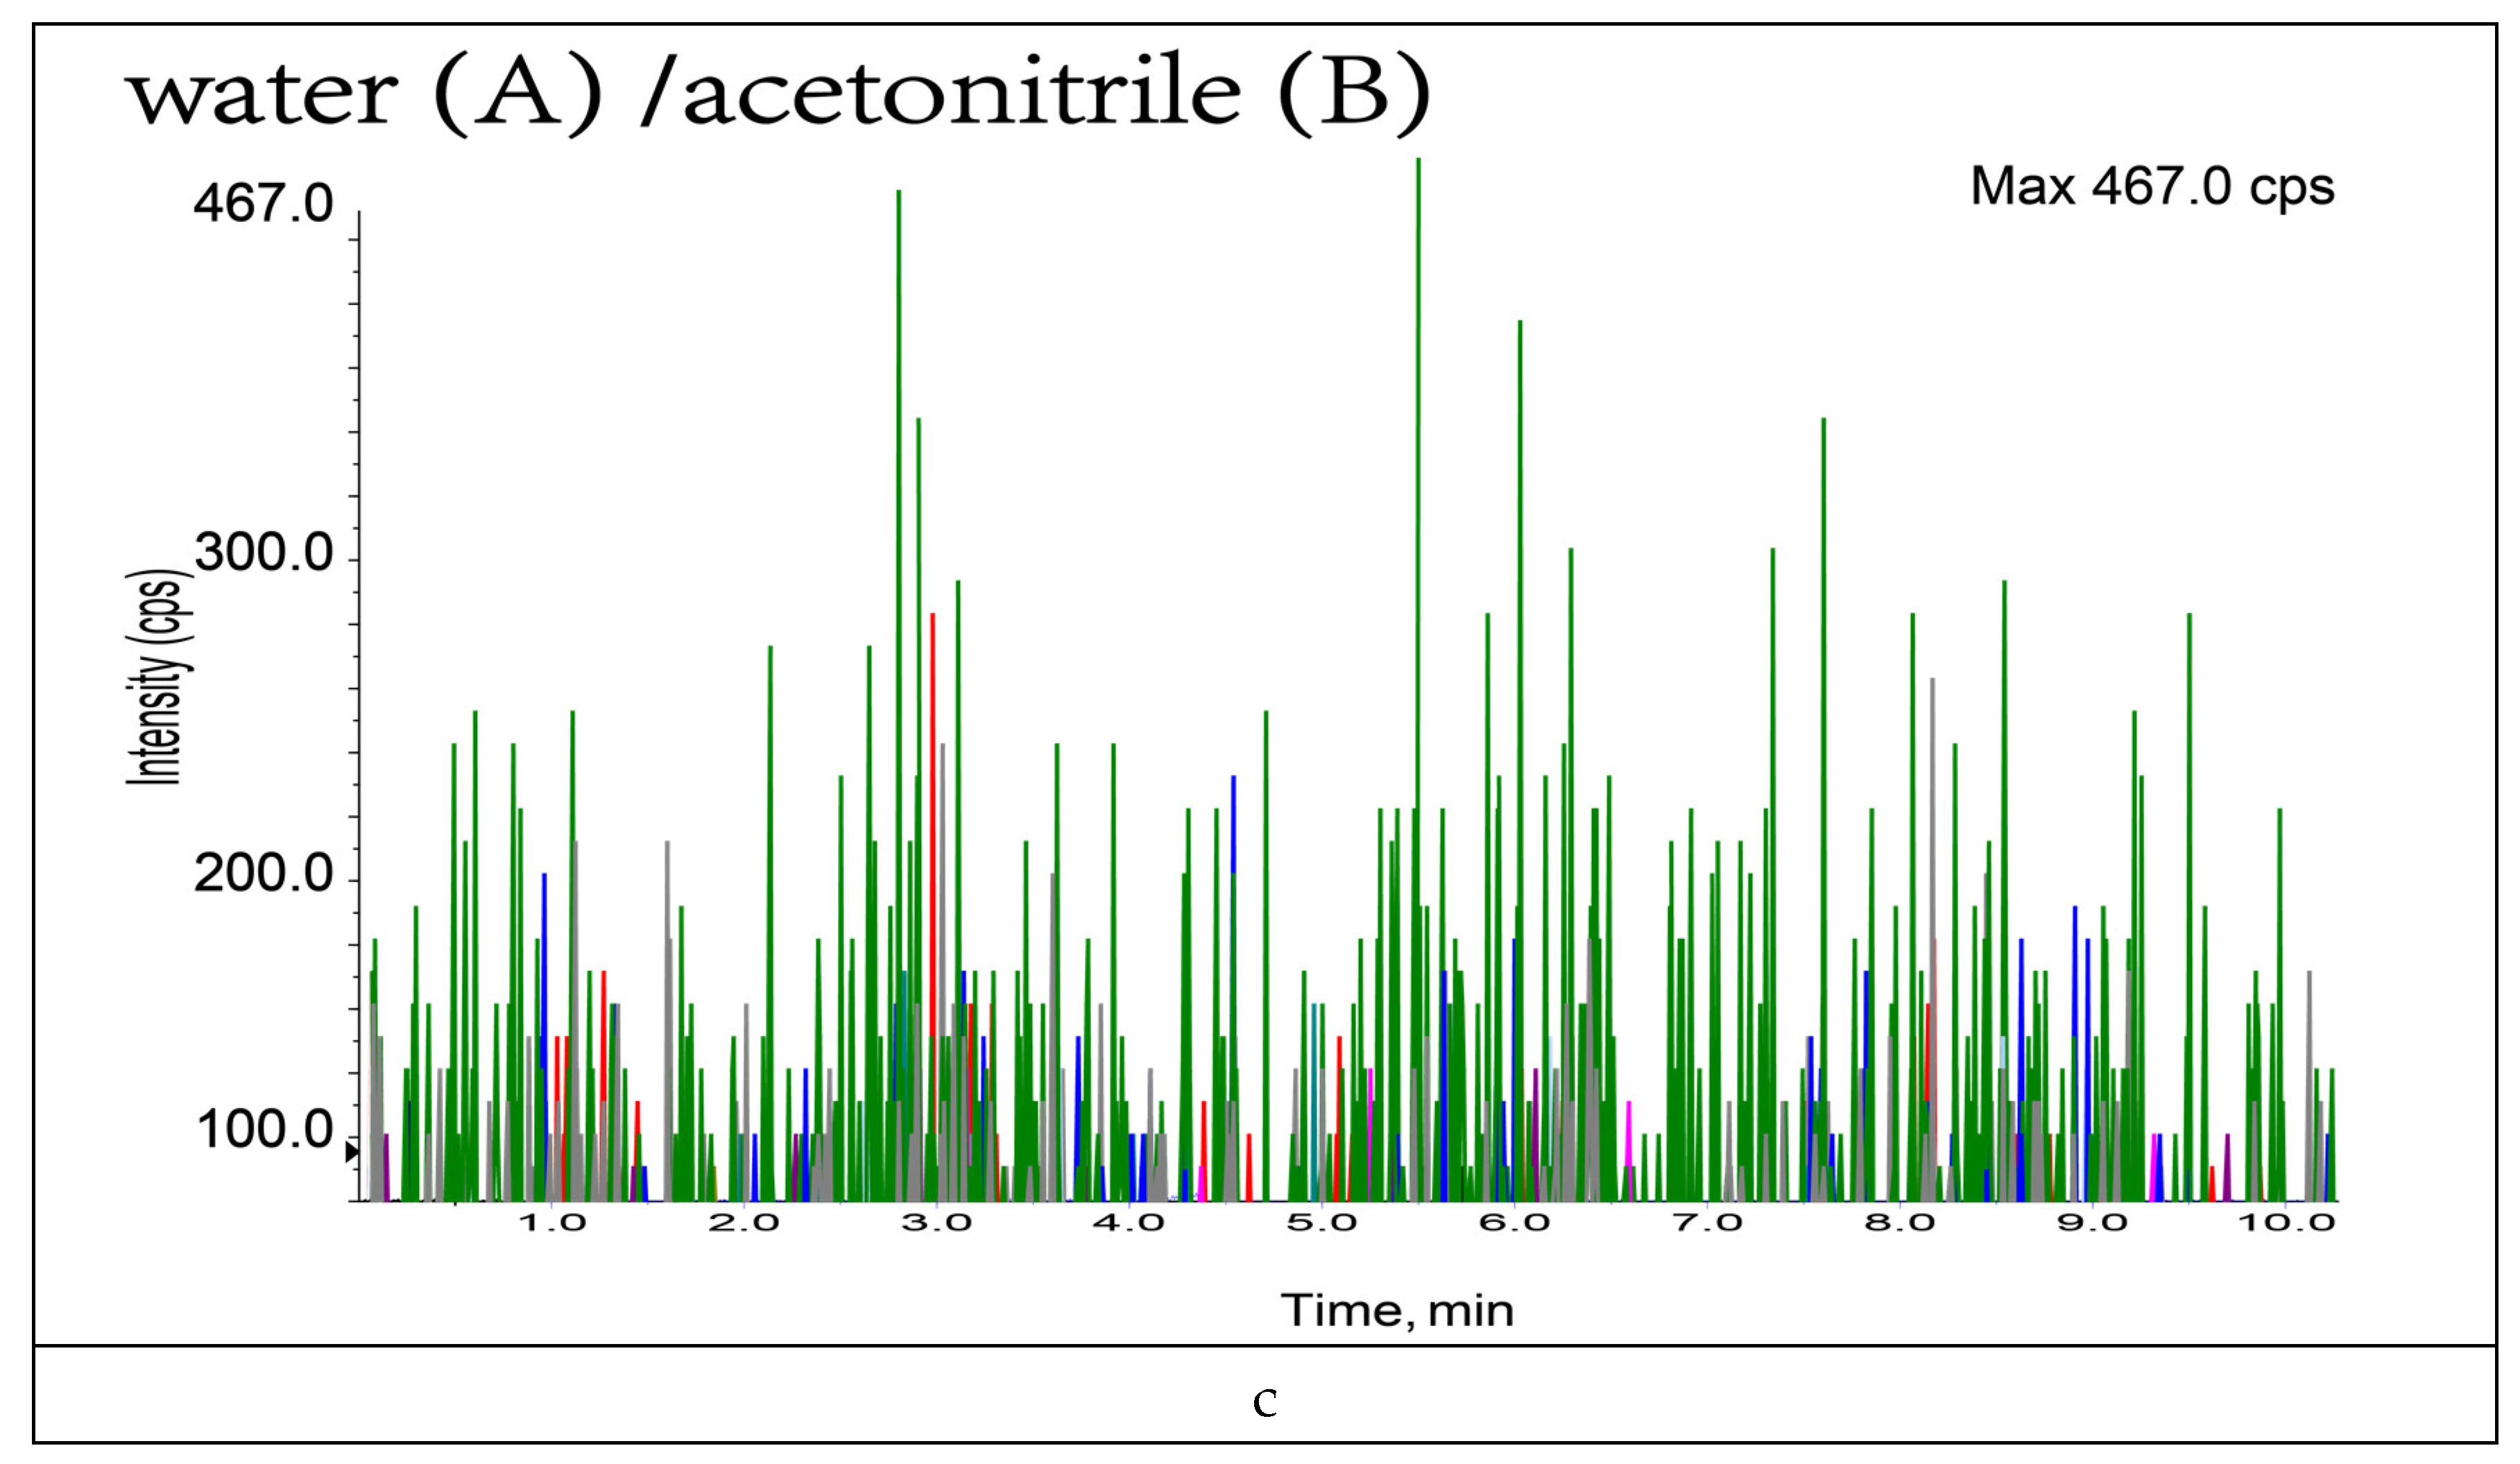
3.1. Optimization of Mobile Phase
3.2. Optimization of Mass Spectrometry Conditions
3.3. Determination of Sample Pre-Treatment Methods
3.3.1. Optimization and Ratio of the Extraction Solution
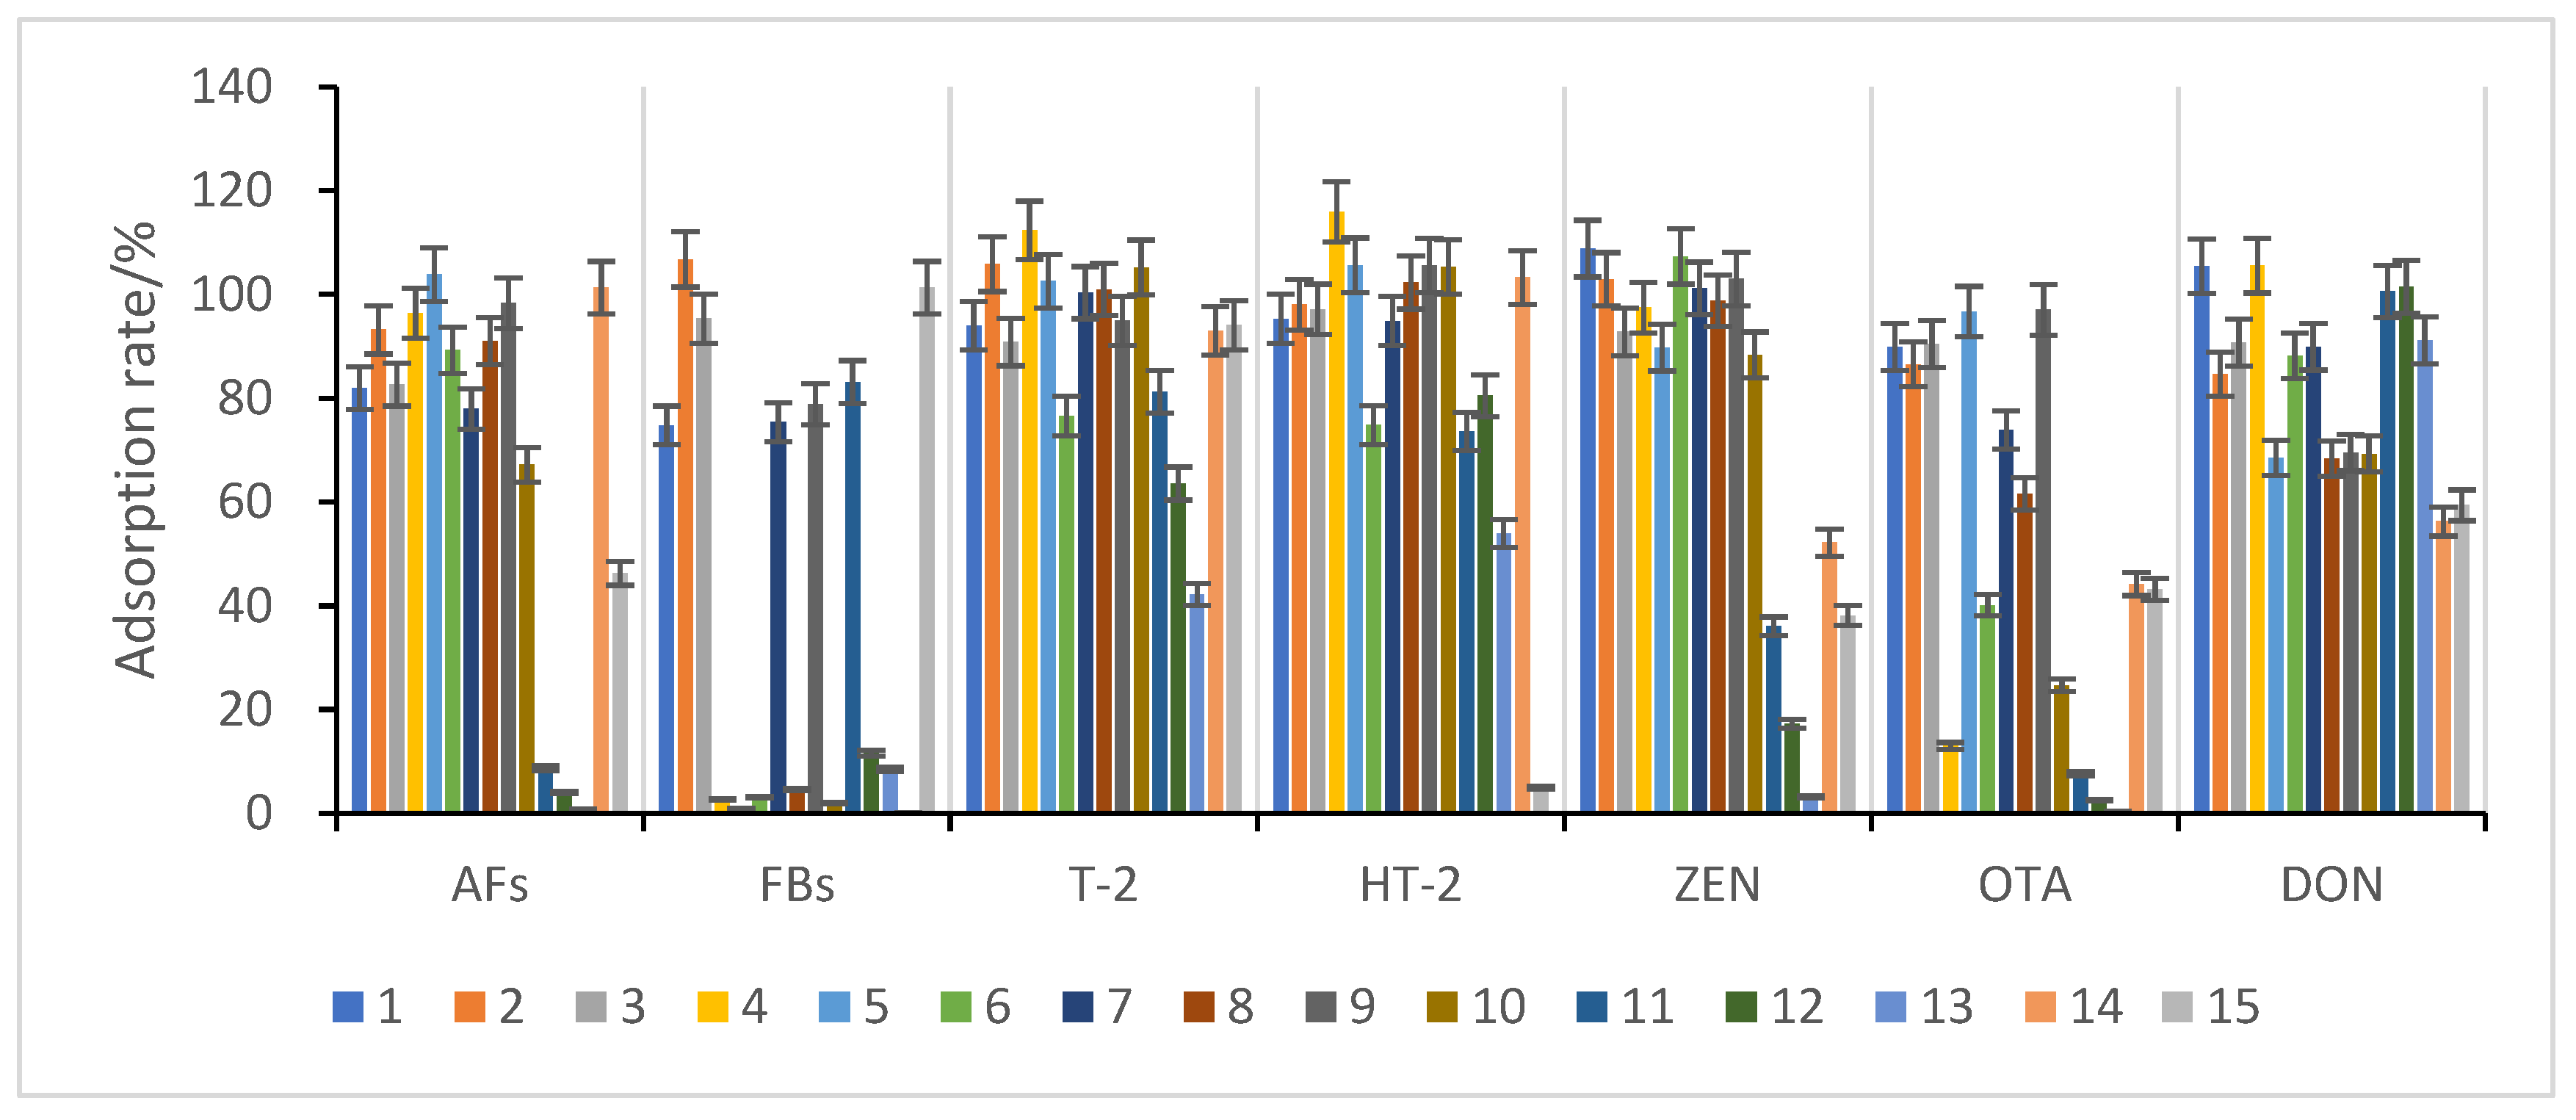
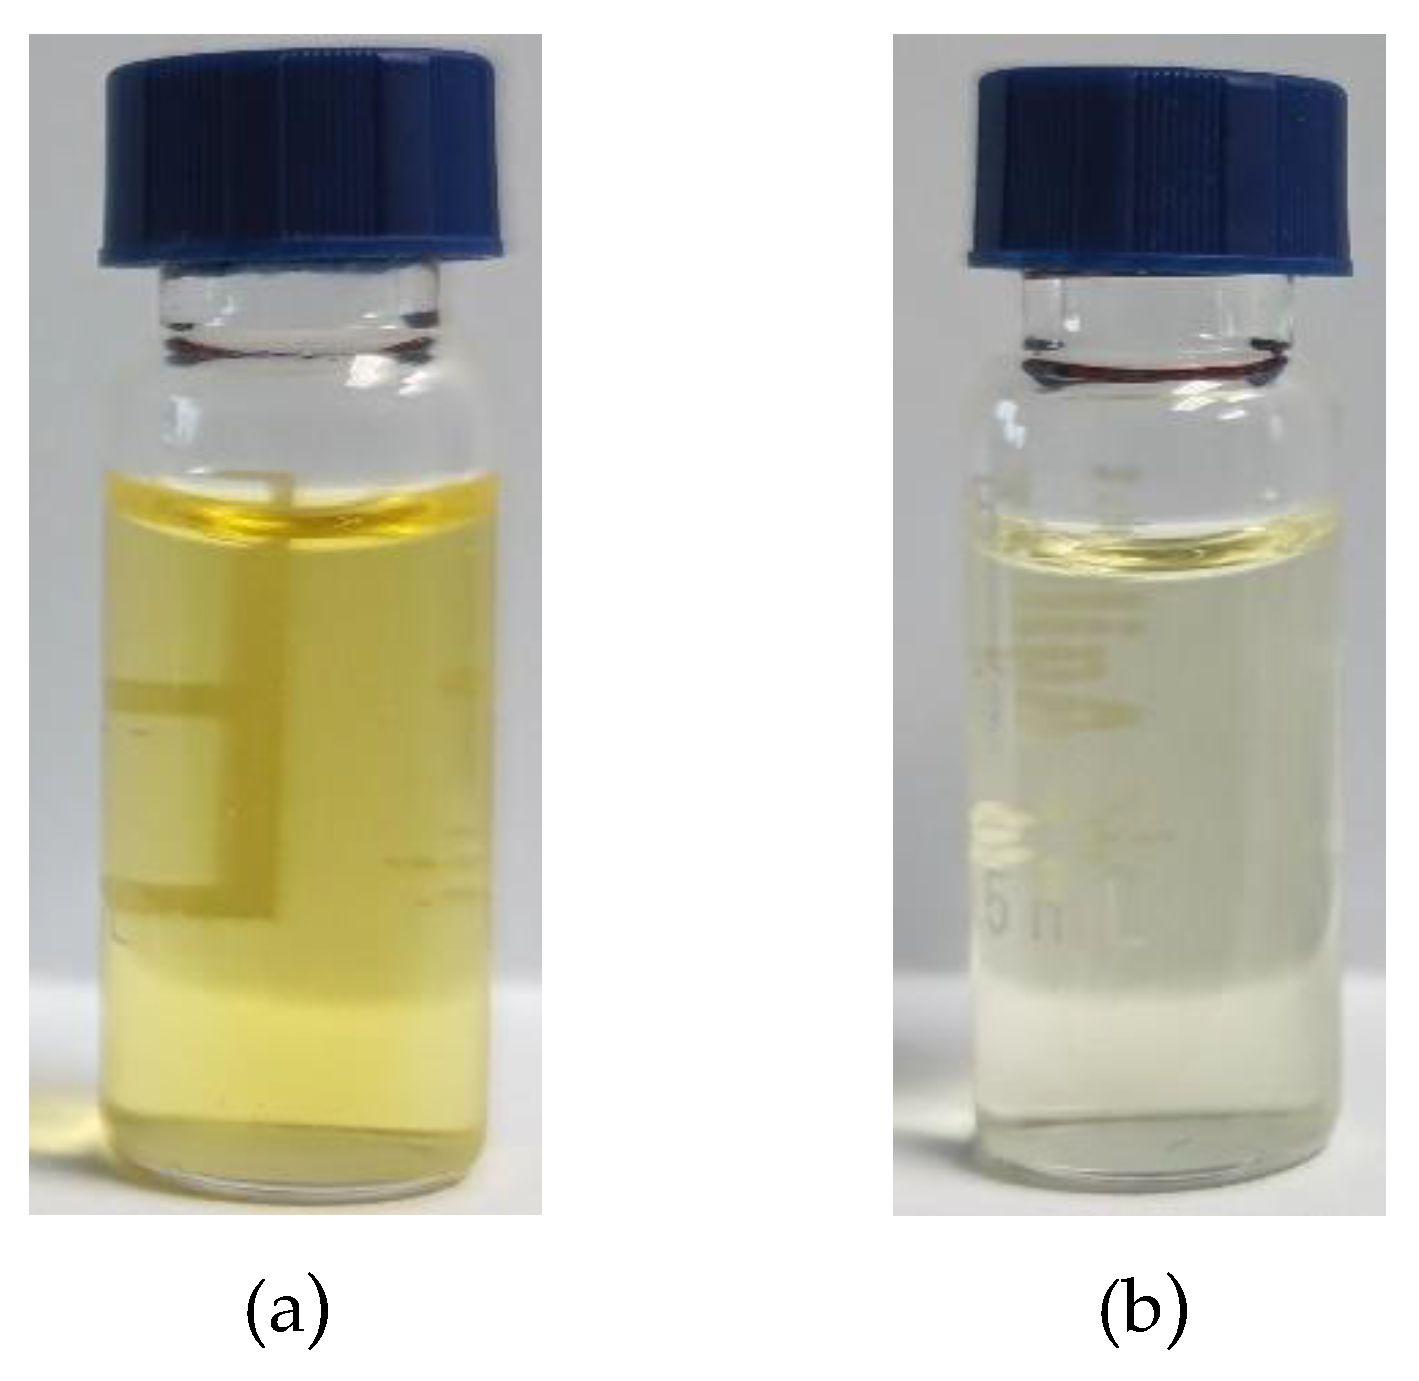
3.3.2. Selection of Purification and Adsorption Materials
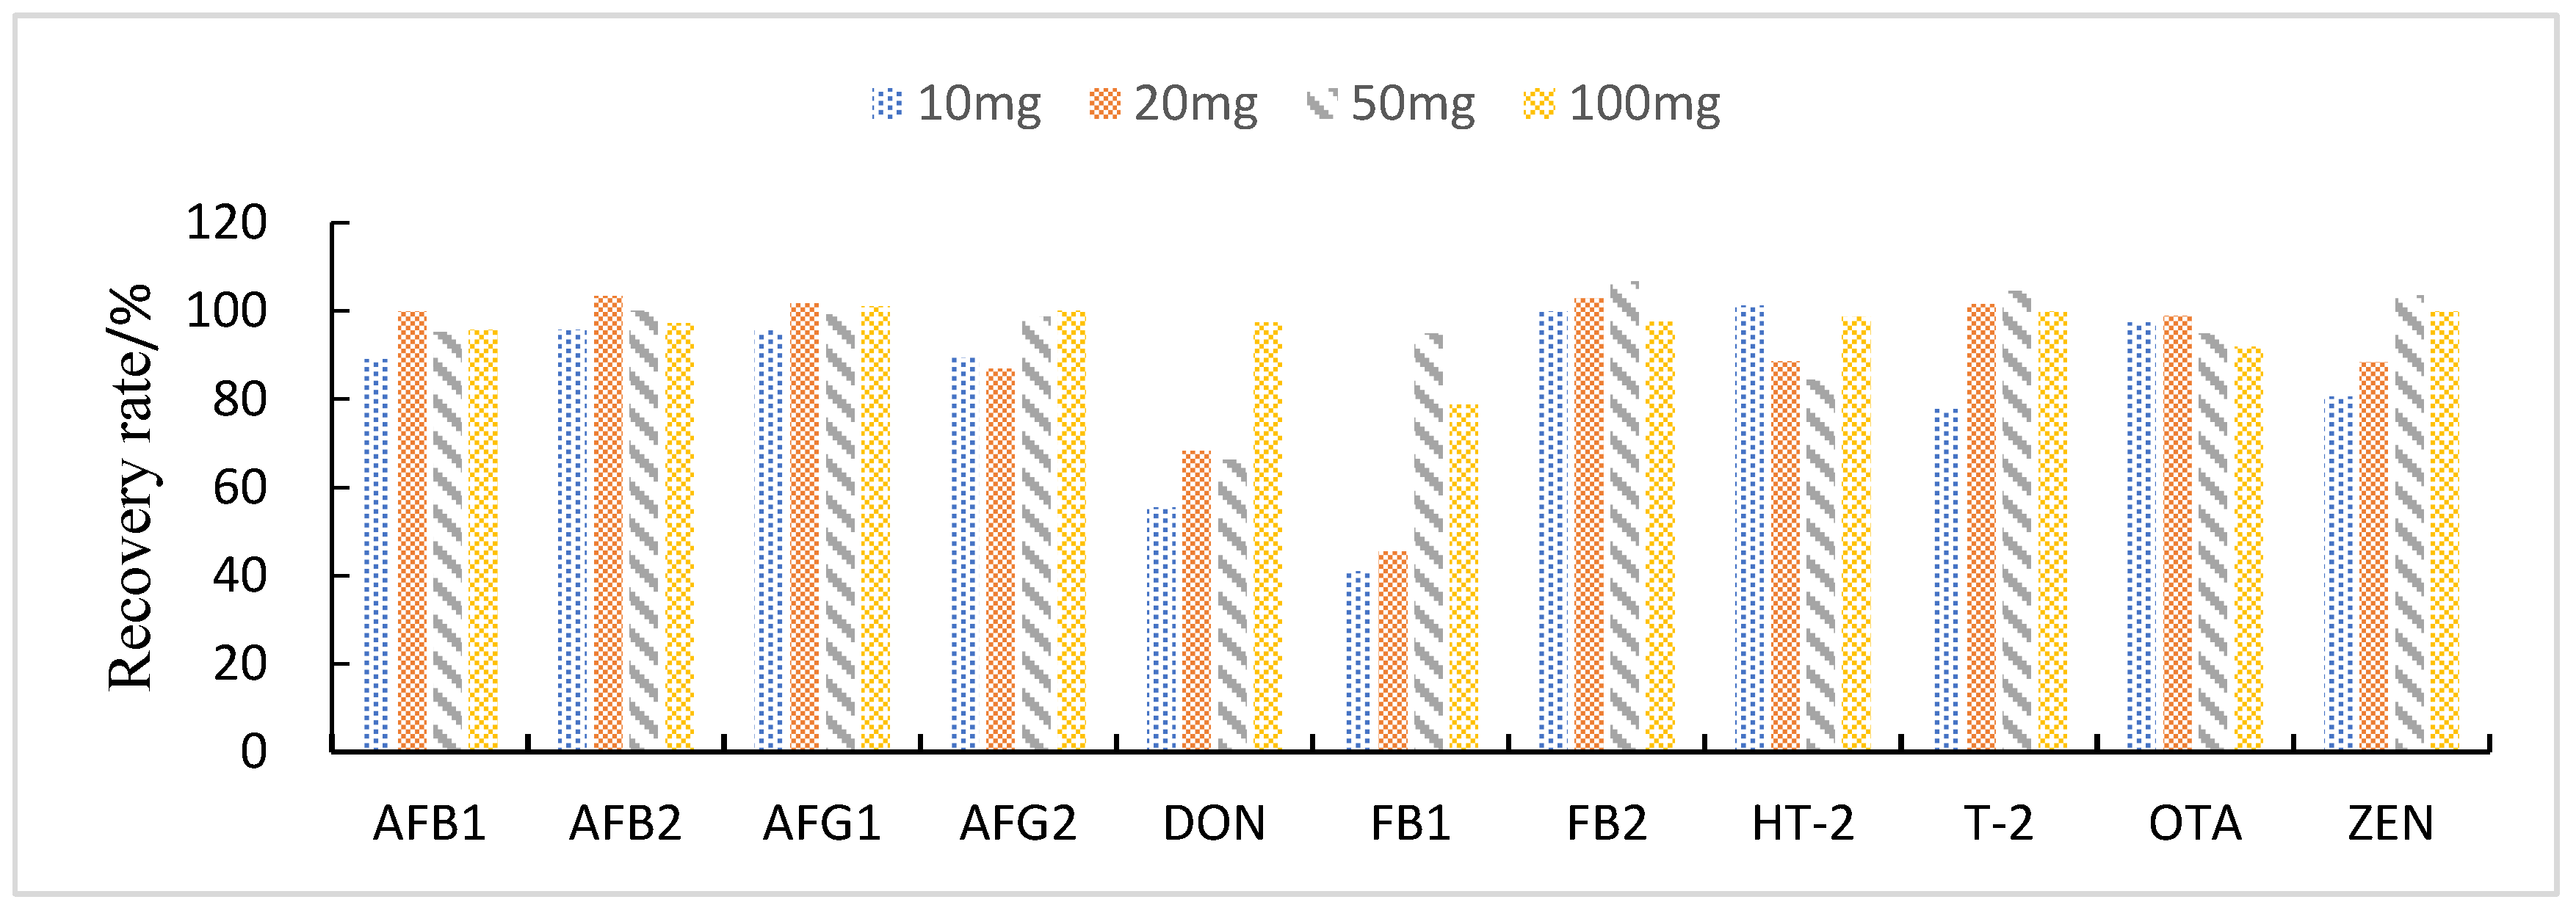
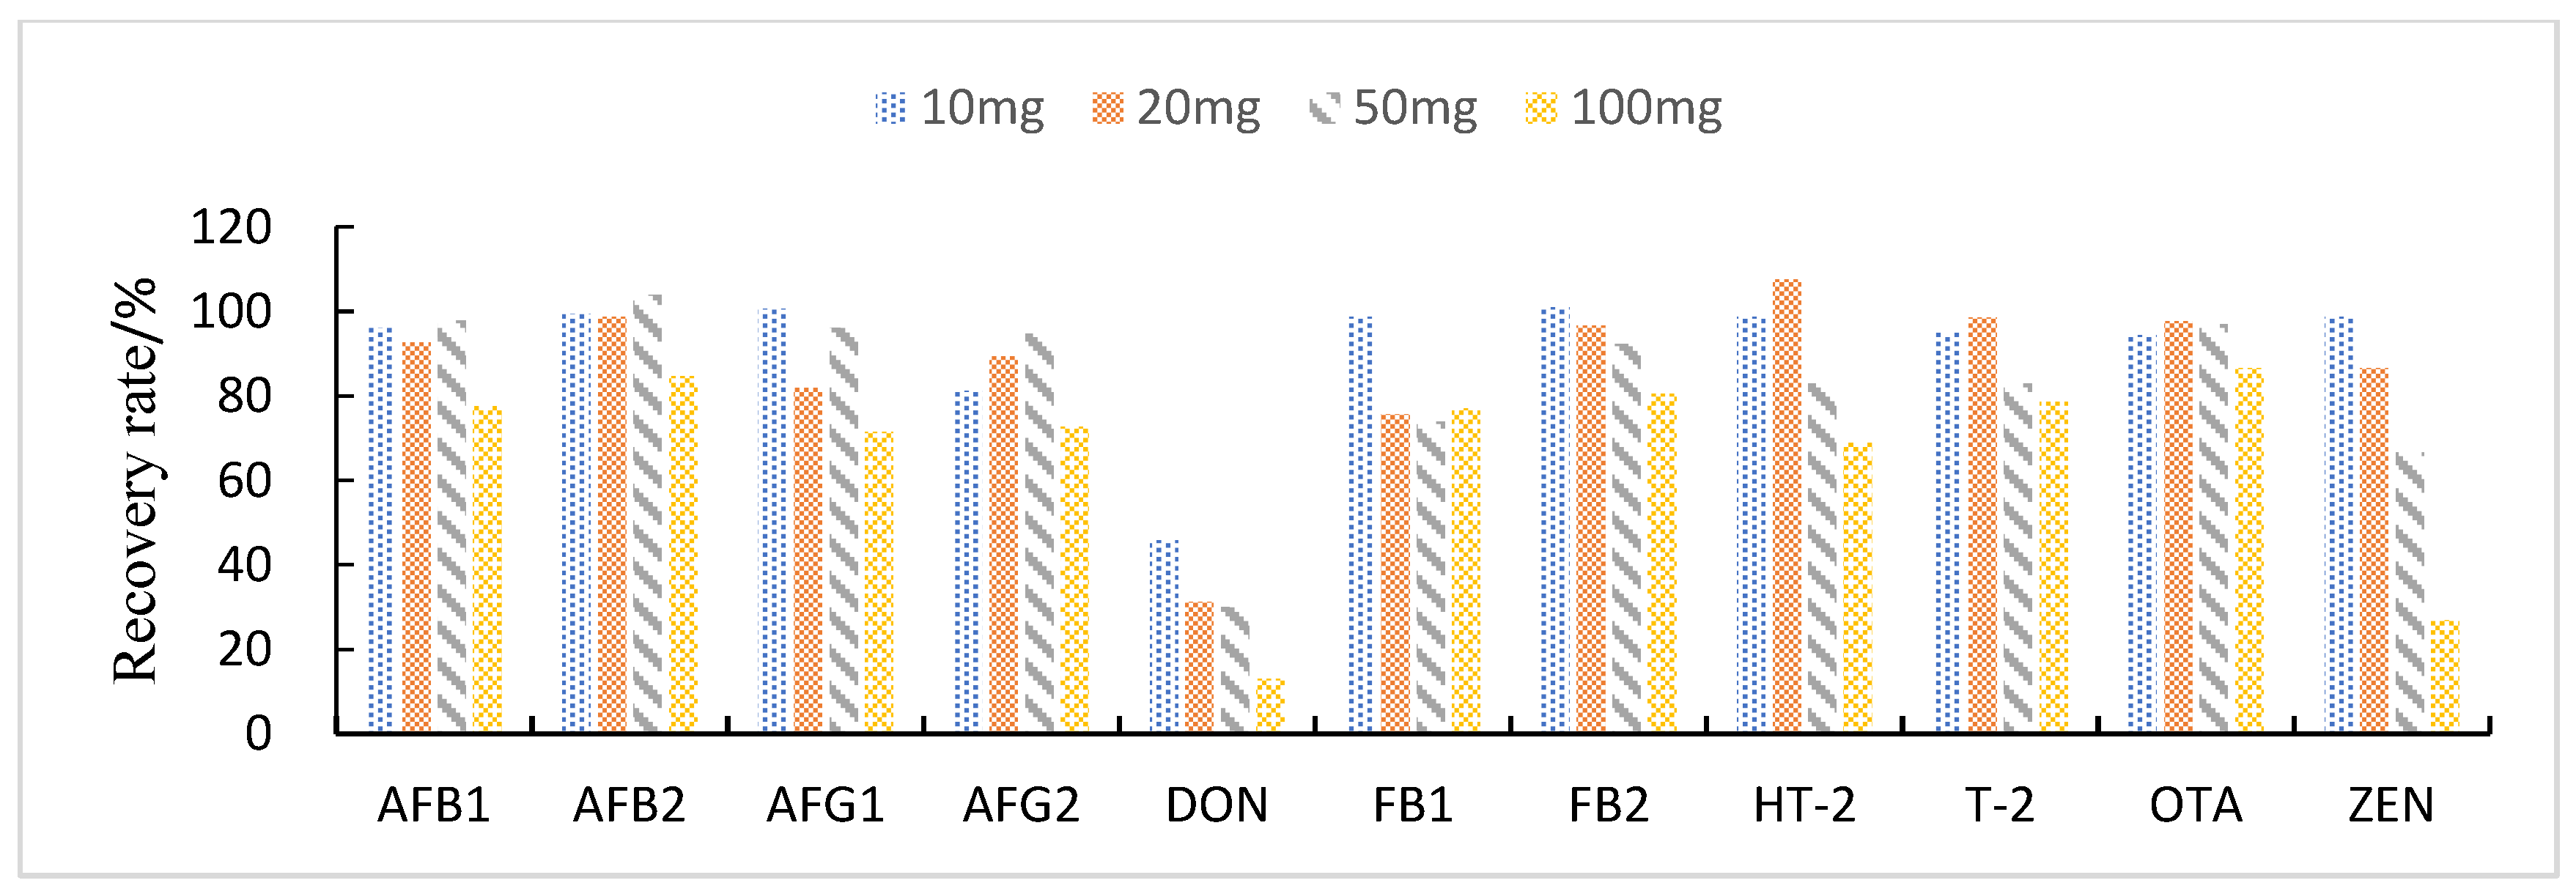
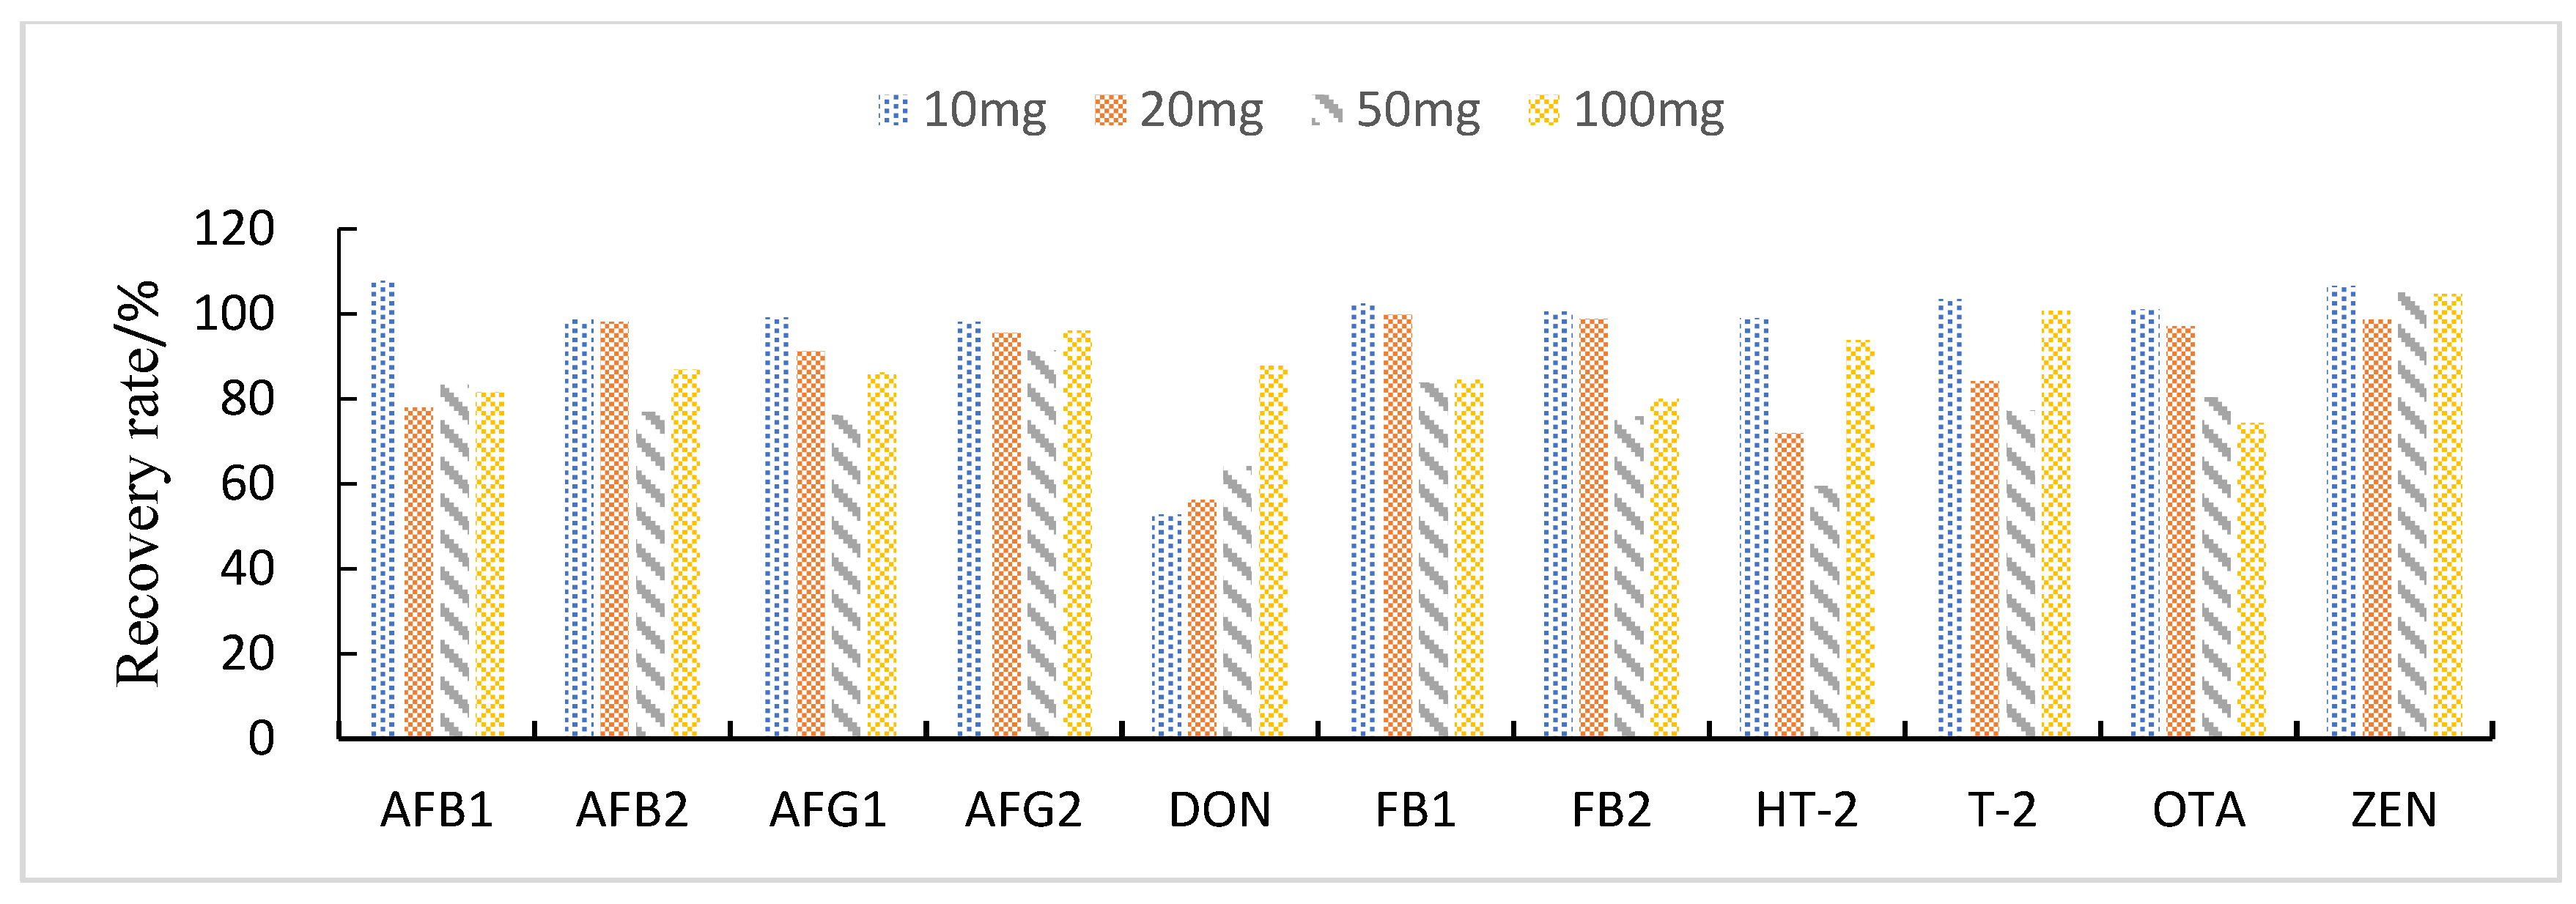
3.3.3. Study of Proportion of Treatment Materials Used
3.4. Validation of the Proposed Method
3.5. Determination of the Proposed Method on Maize
4. Conclusions
Author Contributions
Funding
Institutional Review Board Statement
Informed Consent Statement
Data Availability Statement
Conflicts of Interest
Appendix A


References
- Lattanzio, V.M.T.; Della Gatta, S.; Suman, M.; Visconti, A. Development and in-house validation of a robust and sensitive solid-phase extraction liquid chromatography/tandem mass spectrometry method for the quantitative determination of aflatoxins B1, B2, G1, G2, ochratoxin A, deoxynivalenol, zearalenone, T-2 and HT-2 toxins in cereal-based foods. Rapid Commun. Mass Spectrom. 2011, 25, 1869–1880. [Google Scholar] [CrossRef]
- Miklós, G.; Angeli, C.; Ambrus, Á.; Nagy, A.; Kardos, V.; Zentai, A.; Kerekes, K.; Farkas, Z.; Jóźwiak, Á.; Bartók, T. Detection of Aflatoxins in Different Matrices and Food-Chain Positions. Front. Microbiol. 2020, 11, 1916. [Google Scholar] [CrossRef] [PubMed]
- Abdallah, M.F.; De Boevre, M.; Landschoot, S.; De Saeger, S.; Haesaert, G.; Audenaert, K. Fungal Endophytes Control Fusarium graminearum and Reduce Trichothecenes and Zearalenone in Maize. Toxins 2018, 10, 493. [Google Scholar] [CrossRef] [PubMed]
- Majer-Baranyi, K.; Adányi, N.; Székács, A. Biosensors for Deoxynivalenol and Zearalenone Determination in Feed Quality Control. Toxins 2021, 13, 499. [Google Scholar] [CrossRef] [PubMed]
- Hajnal, E.J.; Kos, J.; Malachová, A.; Steiner, D.; Stranska, M.; Krska, R.; Sulyok, M. Mycotoxins in maize harvested in Serbia in the period 2012–2015. Part 2: Non-regulated mycotoxins and other fungal metabolites. Food Chem. 2020, 317, 126409. [Google Scholar] [CrossRef]
- Van der Fels-Klerx, H.J.I.; Adamse, P.; Punt, A.; Van Asselt, E.D. Data Analyses and Modelling for Risk Based Monitoring of Mycotoxins in Animal Feed. Toxins 2018, 10, 54. [Google Scholar] [CrossRef]
- Eskola, M.; Kos, G.; Elliott, C.T.; Hajslova, J.; Mayar, S.; Krska, R. Worldwide contamination of food-crops with mycotoxins: Validity of the widely cited “FAO estimate” of 25. Crit. Rev. Food Sci. Nutr. 2020, 60, 2773–2789. [Google Scholar] [CrossRef]
- Algammal, A.M.; Elsayed, M.E.; Hashem, H.R.; Ramadan, H.; Sheraba, N.S.; El-Diasty, E.M.; Abbas, S.M.; Hetta, H.F. Molecular and HPLC-based approaches for detection of aflatoxin B1 and ochratoxin A released from toxigenic Aspergillus species in processed meat. BMC Microbiol. 2021, 21, 82. [Google Scholar] [CrossRef]
- Zhang, Y.; Pei, F.; Fang, Y.; Li, P.; Zhao, Y.; Shen, F.; Zou, Y.; Hu, Q. Comparison of concentration and health risks of 9 Fusarium mycotoxins in commercial whole wheat flour and refined wheat flour by multi-IAC-HPLC. Food Chem. 2019, 275, 763–769. [Google Scholar] [CrossRef]
- Murali, H.S. Development and evaluation of multiplex PCR for detection of T-2 and zearalenone producing Fusarium spp. Lett. Appl. Microbiol. 2021, 73, 363–371. [Google Scholar] [CrossRef]
- Zareshahrabadi, Z.; Karimirad, M.; Pakshir, K.; Bahmyari, R.; Motamedi, M.; Nouraei, H.; Zomorodian, K. Survey of aflatoxins and ochratoxin A contamination in spices by HPLC-based method in Shiraz, Southern of Iran. Environ. Sci. Pollut. Res. 2021, 28, 40992–40999. [Google Scholar] [CrossRef] [PubMed]
- Peng, H.; Chang, Y.; Baker, R.C.; Zhang, G. Interference of mycotoxin binders with ELISA, HPLC and LC-MS/MS analysis of aflatoxins in maize and maize gluten. Food Addit. Contam. Part A 2020, 37, 496–506. [Google Scholar] [CrossRef]
- Dhanshetty, M.; Thorat, P.; Banerjee, K. High-Throughput Analysis of Aflatoxins in Cereals, Nuts, and Processed Products Involving Automated Immunoaffinity Cleanup and Inline HPLC–Fluorescence Detection. J. AOAC Int. 2021, 104, 1526–1532. [Google Scholar] [CrossRef] [PubMed]
- Nakhjavan, B.; Ahmed, N.S.; Khosravifard, M. Development of an Improved Method of Sample Extraction and Quantitation of Multi-Mycotoxin in Feed by LC-MS/MS. Toxins 2020, 12, 462. [Google Scholar] [CrossRef] [PubMed]
- Meyer, H.; Skhosana, Z.D.; Motlanthe, M.; Louw, W.; Rohwer, E. Long Term Monitoring (2014–2018) of Multi-Mycotoxins in South African Commercial Maize and Wheat with a Locally Developed and Validated LC-MS/MS Method. Toxins 2019, 11, 271. [Google Scholar] [CrossRef]
- Malachová, A.; Stránská, M.; Václavíková, M.; Elliott, C.T.; Black, C.; Meneely, J.; Hajšlová, J.; Ezekiel, C.N.; Schuhmacher, R.; Krska, R. Advanced LC–MS-based methods to study the co-occurrence and metabolization of multiple mycotoxins in cereals and cereal-based food. Anal. Bioanal. Chem. 2018, 410, 801–825. [Google Scholar] [CrossRef]
- Di Marco Pisciottano, I.; Imperato, C.; Urbani, V.; Guadagnuolo, G.; Imbimbo, S.; De Crescenzo, M.; Soprano, V.; Esposito, M.; Gallo, P. T-2 and HT-2 toxins in feed and food from Southern Italy, determined by LC-MS/MS after immunoaffinity clean-up. Food Addit. Contam. Part B 2020, 13, 275–283. [Google Scholar] [CrossRef]
- Kudumija, N.; Vulić, A.; Lešić, T.; Vahčić, N.; Pleadin, J. Aflatoxins and ochratoxin A in dry-fermented sausages in Croatia, by LC-MS/MS. Food Addit. Contam. Part B 2020, 13, 225–232. [Google Scholar] [CrossRef] [PubMed]
- Hickert, S.; Gerding, J.; Ncube, E.; Hübner, F.; Flett, B.; Cramer, B.; Humpf, H.-U. A new approach using micro HPLC-MS/MS for multi-mycotoxin analysis in maize samples. Mycotoxin Res. 2015, 31, 109–115. [Google Scholar] [CrossRef]
- Wang, Y.; Xiao, C.; Guo, J.; Yuan, Y.; Wang, J.; Liu, L.; Yue, T. Development and Application of a Method for the Analysis of 9 Mycotoxins in Maize by HPLC-MS/MS. J. Food Sci. 2013, 78, M1752–M1756. [Google Scholar] [CrossRef]
- Park, J.; Kim, D.-H.; Moon, J.-Y.; An, J.-A.; Kim, Y.-W.; Chung, S.-H.; Lee, C. Distribution Analysis of Twelve Mycotoxins in Corn and Corn-Derived Products by LC-MS/MS to Evaluate the Carry-Over Ratio during Wet-Milling. Toxins 2018, 10, 319. [Google Scholar] [CrossRef] [PubMed]
- Kappenberg, A.; Juraschek, L. Development of a LC–MS/MS Method for the Simultaneous Determination of the Mycotoxins Deoxynivalenol (DON) and Zearalenone (ZEA) in Soil Matrix. Toxins 2021, 13, 470. [Google Scholar] [CrossRef] [PubMed]
- Solfrizzo, M.; Gambacorta, L.; Bibi, R.; Ciriaci, M.; Paoloni, A.; Pecorelli, I. Multimycotoxin Analysis by LC-MS/MS in Cereal Food and Feed: Comparison of Different Approaches for Extraction, Purification, and Calibration. J. AOAC Int. 2018, 101, 647–657. [Google Scholar] [CrossRef] [PubMed]
- Woo, S.Y.; Ryu, S.Y.; Tian, F.; Lee, S.Y.; Park, S.B.; Chun, H.S. Simultaneous Determination of Twenty Mycotoxins in the Korean Soybean Paste Doenjang by LC-MS/MS with Immunoaffinity Cleanup. Toxins 2019, 11, 594. [Google Scholar] [CrossRef]
- Seo, H.; Jang, S.; Jo, H.; Kim, H.; Lee, S.; Yun, H.; Jeong, M.; Moon, J.; Na, T.; Cho, H. Optimization of the QuEChERS-Based Analytical Method for Investigation of 11 Mycotoxin Residues in Feed Ingredients and Compound Feeds. Toxins 2021, 13, 767. [Google Scholar] [CrossRef]
- Cheng, S.; Wei, Z.; Zhiming, X.; Yang, L.; Xia, F. Trace analysis and identification of 33 sulfonamides and sulfonamide potentiators in eggs by ultrahigh-performance liquid chromatography coupled with quadrupole-high-field orbitrap high-resolution mass spectrometry. Anal. Methods 2021, 13, 4452–4460. [Google Scholar] [CrossRef] [PubMed]
- Mateus, A.R.S.; Barros, S.; Pena, A.; Silva, A.S. Development and Validation of QuEChERS Followed by UHPLC-ToF-MS Method for Determination of Multi-Mycotoxins in Pistachio Nuts. Molecules 2021, 26, 5754. [Google Scholar] [CrossRef]
- NY/T2071-2011; Appendix B. Determination of Aflatoxins, Zearalenone and T-2 in Feeds-Liquid Chromatography-Tandem Mass Spectrometry. Agriculture China (MOA): Beijing China, 2011.
- GB 2761-2017; Appendix C. National Food Safety Standards Limits for Mycotoxins in Food. China Food and Drug Administration (CFDA): Beijing China, 2017.
- Shephard, G.S.; Berthiller, F.; Burdaspal, P.; Crews, C.; Jonker, M.; Krska, R.; Macdonald, S.; Malone, R.; Maragos, C.; Sabino, M.; et al. Developments in mycotoxin analysis: An update for 2010–2011. World Mycotoxin J. 2012, 5, 3. [Google Scholar] [CrossRef]
- Annunziata, L.; Stramenga, A.; Visciano, P.; Schirone, M.; De Colli, L.; Colagrande, M.N.; Campana, G.; Scortichini, G. Simultaneous determination of aflatoxins, T-2 and HT-2 toxins, and fumonisins in cereal-derived products by QuEChERS extraction coupled with LC-MS/MS. Anal. Bioanal. Chem. 2017, 409, 5143–5155. [Google Scholar] [CrossRef]
- Iram, W.; Anjum, T.; Abbas, M.; Khan, A.M. Aflatoxins and ochratoxin A in maize of Punjab, Pakistan. Food Addit. Contam. Part B 2014, 7, 57–62. [Google Scholar] [CrossRef]


| Number | Name | Material Type | Specification |
|---|---|---|---|
| 1 | BONDESIL-SI | Silica gel | 400 μm |
| 2 | Cleanert IC-H | Ion-exchange resin | 40–60 μm |
| 3 | Esela® HLB | Hydrophilic–Lipophilic Balance | 40–60 μm |
| 4 | Aluminum oxide | Alkaline alumina | 100–200 μm |
| 5 | C18 | Silica gel-bonded octadecyl | 50 μm |
| 6 | PSA | Silica gel-bonded N-propylethylenediamine | 40–60 μm |
| 7 | SCX | Sodium sulfonate bonded on silica gel | 50 μm |
| 8 | BONDESIL-FL | Flori silica | 200 μm |
| 9 | SAX | Silica gel-bonded halogenated quaternary Ammonium Salt | 40 μm |
| 10 | SLE | Diatomite | 80–100 mesh |
| 11 | Pesti Carb | Activated carbon | 120–400 mesh |
| 12 | CMCNs | Carboxylated multiwalled carbon nanotubes | 8–15 nm |
| 13 | MCNs | Multiwalled carbon nanotubes | <8 nm |
| 14 | Z-Sep+ | Silica matrix surface double-bonded with C18 and Z-Sep | 100–200 μm |
| 15 | CarbonX | Carbon fiber | 120–400 mesh |
| Time | Flow | Acetonitrile (B) % | 0.1% Formic Acid (A) % |
|---|---|---|---|
| 0.0 | 0.4 | 20 | 80 |
| 0.5 | 0.4 | 20 | 80 |
| 3.0 | 0.4 | 40 | 60 |
| 6.0 | 0.4 | 95 | 5 |
| 7.0 | 0.4 | 95 | 5 |
| 11.0 | 0.4 | 95 | 5 |
| 11.1 | 0.4 | 20 | 80 |
| Toxin | Molecular Formula | Molecular Weight | Precursor Ion (M/Z) | Retention Time (min) | Cone Voltage (V) | Collision Energy (EV) | Fragment Ion (M/Z) |
|---|---|---|---|---|---|---|---|
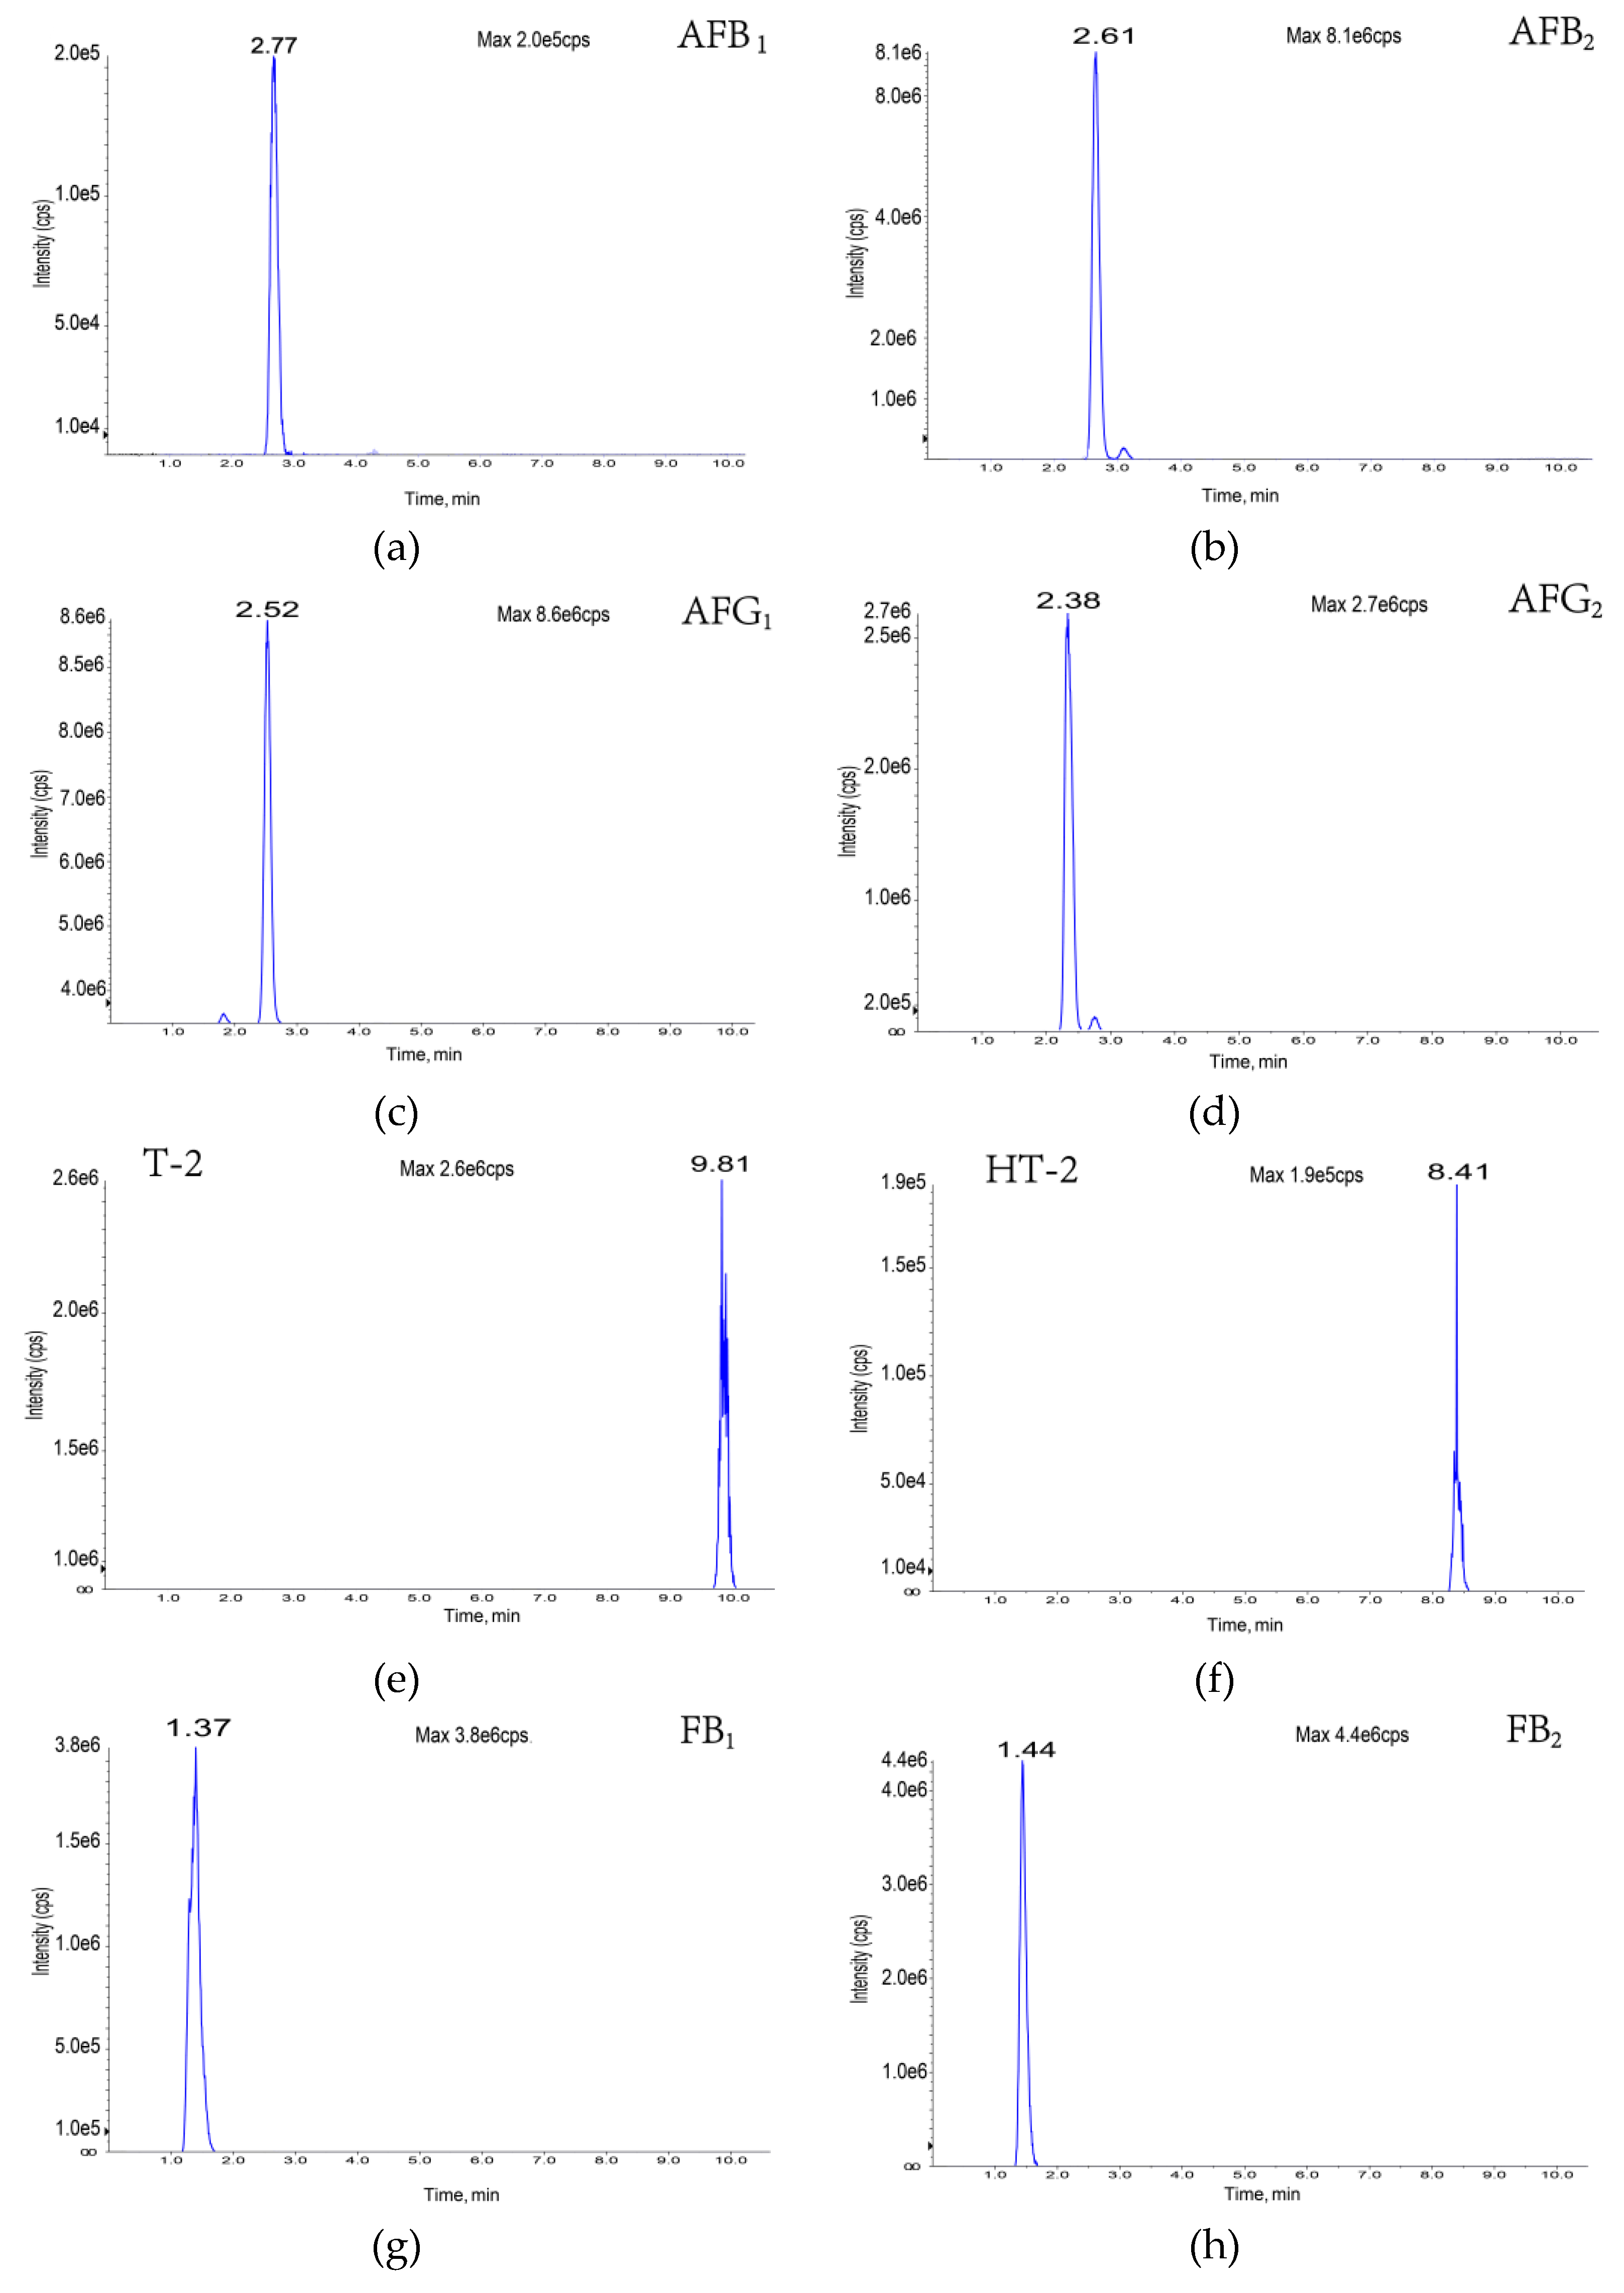
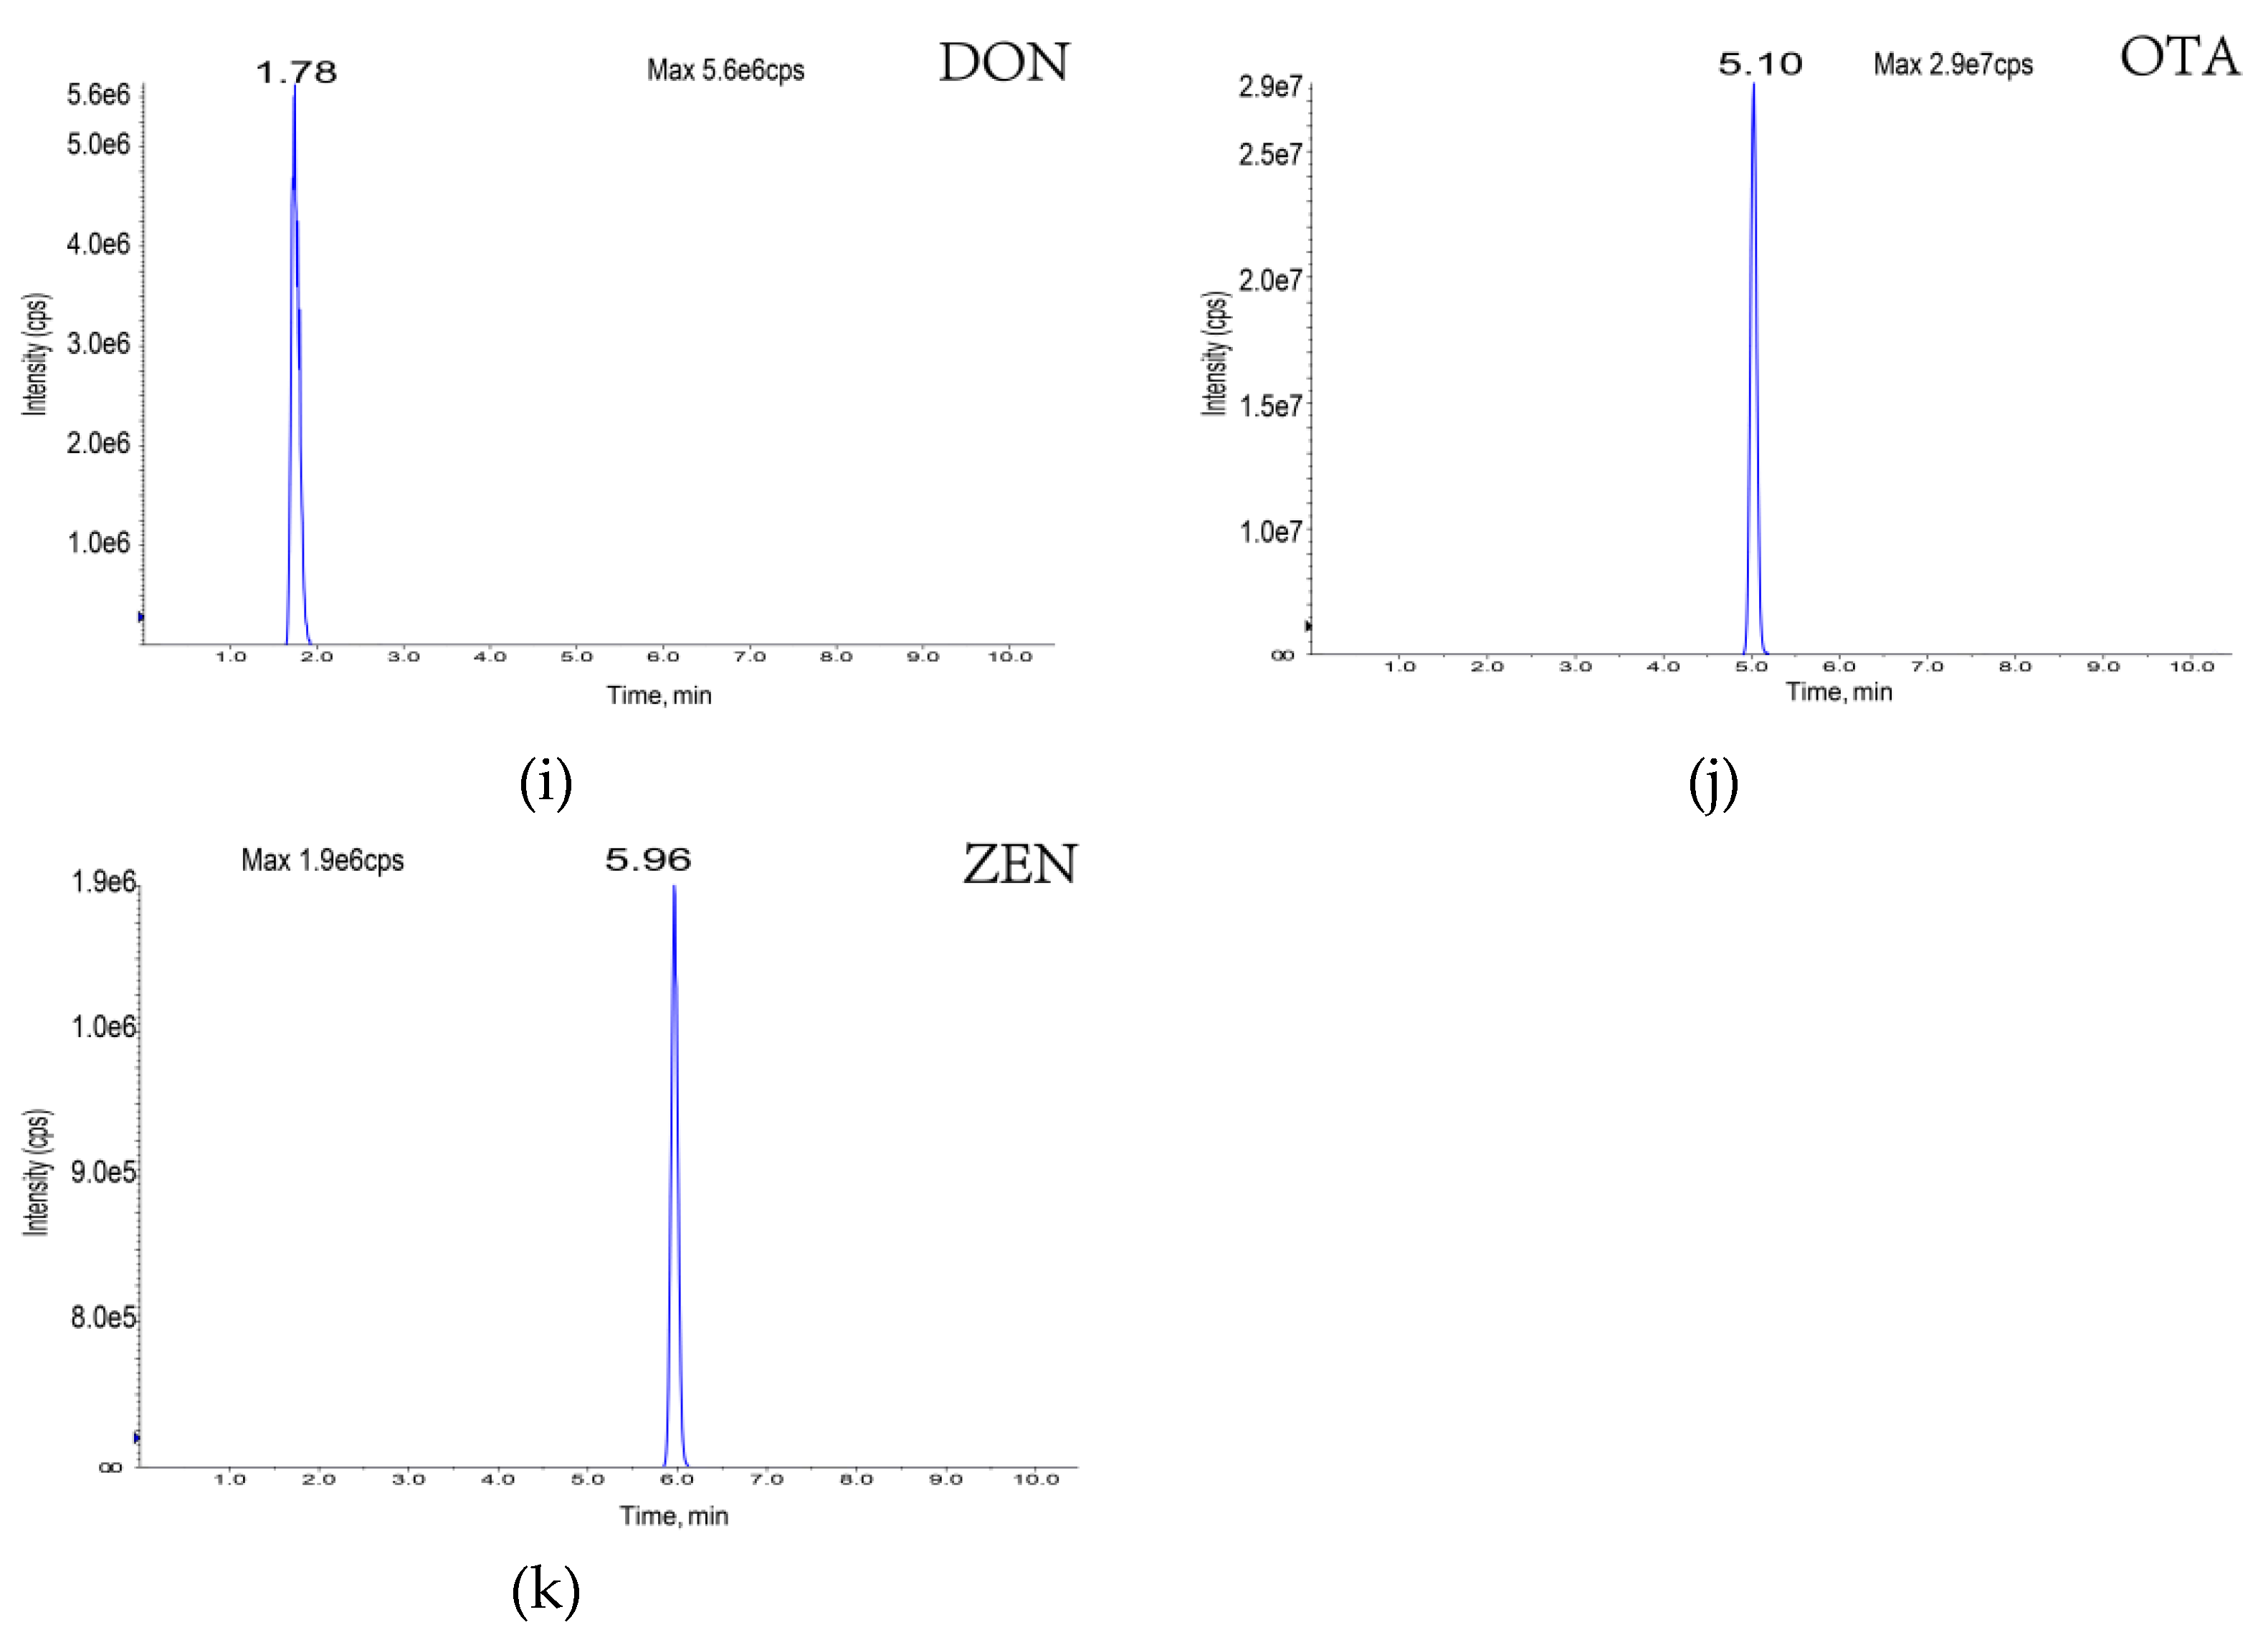
| Aflatoxin B1 | C17H12O6 | 312 | 313 | 2.77 | 160 | 35 | 241, 285 |
| Aflatoxin B2 | C17H14O6 | 314 | 315 | 2.61 | 160 | 35 | 259, 287 |
| Aflatoxin G1 | C17H12O7 | 328 | 329 | 2.52 | 150 | 35 | 243, 200 |
| Aflatoxin G2 | C17H14O7 | 347 | 331 | 2.38 | 160 | 35 | 189, 245 |
| Deoxynivalenol | C15H20O6 | 296 | 296 | 1.78 | 60 | 17 | 249, 203 |
| Fumonisin B1 | C34H59NO15 | 721 | 722 | 1.37 | 80 | 49 | 352, 334 |
| Fumonisin B2 | C34H59NO14 | 705 | 706 | 1.44 | 80 | 49 | 337, 355 |
| T-2 toxin | C24H34O9 | 466 | 484 | 9.81 | 40 | 25 | 185, 305 |
| HT-2 toxin | C22H32O8 | 424 | 442 | 8.34 | 40 | 16 | 263, 245 |
| Zearalenone | C18H22O5 | 318 | 317 | 5.96 | 60 | -35 | 131, 175 |
| Ochratoxin A | C20H18CINO6 | 408 | 404 | 5.10 | −140 | 35 | 239, 193 |
| Feed Matrix | Correlation Coefficient (R2) | Slope (b) | Intercept (a) | LOD (μg/kg) | LOQ (μg/kg) |
|---|---|---|---|---|---|
| Aflatoxin B1 | 0.9996 | 2306 ± 108 | −1669 ± 92 | 0.02 | 0.06 |
| Aflatoxin B2 | 0.9995 | 27,976 ± 811 | −409 ± 38 | 0.04 | 0.12 |
| Aflatoxin G1 | 0.9993 | 14,258 ± 971 | 1030 ± 42 | 0.05 | 0.15 |
| Aflatoxin G2 | 0.9991 | 5767 ± 563 | 601 ± 12 | 0.05 | 0.15 |
| Deoxynivalenol | 0.9992 | 409 ± 38 | 80 ± 8 | 0.02 | 0.06 |
| Fumonisin B1 | 0.9952 | 1468 ± 142 | −1843 ± 136 | 0.15 | 0.5 |
| Fumonisin B2 | 0.9905 | 2798 ± 146 | −5651 ± 178 | 0.2 | 0.6 |
| T-2 toxin | 0.9978 | 1761 ± 33 | −1770 ± 95 | 0.2 | 0.6 |
| HT-2 toxin | 0.9948 | 216 ± 8 | −173 ± 4 | 0.8 | 2.5 |
| Zearalenone | 0.998 | 15,344 ± 169 | −12,071 ± 947 | 0.08 | 0.3 |
| Ochratoxin A | 0.9991 | 104,722 ± 7013 | −106,855 ± 4179 | 0.02 | 0.06 |
| Toxin | 2 μg/kg | 5 μg/kg | 10 μg/kg | ||||||
|---|---|---|---|---|---|---|---|---|---|
| Recovery (%) | Inter-RSD (%) | Intra-RSD (%) | Recovery (%) | Inter-RSD (%) | Intra- RSD (%) | Recovery (%) | Inter RSD (%) | Intra-RSD (%) | |
| Aflatoxin B1 | 89.8 | 10.8 | 8.9 | 87.2 | 8.3 | 8.8 | 92.5 | 5.3 | 8.6 |
| Aflatoxin B2 | 77.5 | 3.5 | 7.8 | 79.2 | 3.8 | 3.7 | 80.9 | 2.3 | 3.5 |
| Aflatoxin G1 | 86.7 | 4.6 | 8.2 | 80.4 | 4.3 | 4.7 | 90.4 | 9.1 | 8.5 |
| Aflatoxin G2 | 83.9 | 7.7 | 9.6 | 83.9 | 7.7 | 7.0 | 87.8 | 3.7 | 4.5 |
| Deoxynivalenol | 87.9 | 8.4 | 8.2 | 87.1 | 9.0 | 12.3 | 89.1 | 4.3 | 8.9 |
| Fumonisin B1 | 85.2 | 6.6 | 8.6 | 84.4 | 5.9 | 8.6 | 85.8 | 4.5 | 8.9 |
| Fumonisin B2 | 84.1 | 11.9 | 13.2 | 88.3 | 11.0 | 10.2 | 89.5 | 6.8 | 5.2 |
| T-2 toxin | 91.0 | 9.3 | 10.6 | 88.8 | 10.5 | 10.3 | 93.7 | 5.7 | 7.3 |
| HT-2 toxin | 91.4 | 5.9 | 6.0 | 90.5 | 5.4 | 7.1 | 92.8 | 9.8 | 10.8 |
| Zearalenone | 92.3 | 6.0 | 6.8 | 93.0 | 0.8 | 1.8 | 98.4 | 4.0 | 3.7 |
| Ochratoxin A | 93.6 | 5.4 | 6.4 | 94.2 | 3.8 | 3.8 | 97.9 | 3.6 | 4.4 |
| Method | Mycotoxin Type | Advantages | Disadvantages | LOQ | Reference |
|---|---|---|---|---|---|
| Methods based on QuEChERS | 10 | Quick, easy, cheap, effective, rugged, safe | Rely on high-precision instruments; mainly used for the analysis of pesticides; cumbersome preparation time. | 0.38~25 μg/kg | [26] |
| 8 | 1.0~200 μg/kg | [29] | |||
| Methods based on multi-antibody immunoaffinity | 12 | High specificity and selectivity, safe | Longer cleaning times and lower specificity; need for special process equipment; high cost of immunoaffinity columns; complex procedures involving degreasing or separate ESI+ and ESI- monitoring. | 0.3~118.7 μg/kg | [22] |
| 6 | 0.1~50 μg/kg | [30] | |||
| 5 | 0.1~1.0 μg/kg | [31] | |||
| SPE | 9 | Simple and inexpensive | Cumbersome and time-consuming to operate. | 0.03~2.12 μg/kg | [19] |
| 9 | 0.3~195.7 μg/kg | [32] | |||
| Multiple-impurity adsorption | 11 | Quick, easy, cheap, strong, effective, safe | / | 0.06~2.5 μg/kg | Methods in this paper |
| Toxin | Lowest (μg/kg) | Highest (μg/kg) | Allowable Limit * | Exceeding the Standard Samples (%) |
|---|---|---|---|---|
| Aflatoxin B1 | 0.17 | 77.65 | 20 | 7 |
| Aflatoxin B2 | 0.11 | 5.00 | 20 | 0 |
| Aflatoxin G1 | 0.03 | 0.16 | 20 | 0 |
| Aflatoxin G2 | 0.08 | 0.59 | 20 | 0 |
| Deoxynivalenol | 9.17 | 1294.19 | 1000 | 4 |
| Fumonisin B1 | 92.28 | 200,212.41 | / | / |
| Fumonisin B2 | 37.45 | 89,834.45 | / | / |
| T-2 toxin | 0.23 | 3.52 | / | / |
| HT-2 toxin | 3.92 | 17.38 | / | / |
| Zearalenone | 0.17 | 526.37 | 60 | 22 |
| Ochratoxin A | 0.02 | 9.67 | 5.0 | 1 |
Publisher’s Note: MDPI stays neutral with regard to jurisdictional claims in published maps and institutional affiliations. |
© 2022 by the authors. Licensee MDPI, Basel, Switzerland. This article is an open access article distributed under the terms and conditions of the Creative Commons Attribution (CC BY) license (https://creativecommons.org/licenses/by/4.0/).
Share and Cite
Guan, X.; Feng, Y.; Suo, D.; Xiao, Z.; Wang, S.; Liang, Y.; Fan, X. Simultaneous Determination of 11 Mycotoxins in Maize via Multiple-Impurity Adsorption Combined with Liquid Chromatography–Tandem Mass Spectrometry. Foods 2022, 11, 3624. https://doi.org/10.3390/foods11223624
Guan X, Feng Y, Suo D, Xiao Z, Wang S, Liang Y, Fan X. Simultaneous Determination of 11 Mycotoxins in Maize via Multiple-Impurity Adsorption Combined with Liquid Chromatography–Tandem Mass Spectrometry. Foods. 2022; 11(22):3624. https://doi.org/10.3390/foods11223624
Chicago/Turabian StyleGuan, Xin, Yuchao Feng, Decheng Suo, Zhiming Xiao, Shi Wang, Ying Liang, and Xia Fan. 2022. "Simultaneous Determination of 11 Mycotoxins in Maize via Multiple-Impurity Adsorption Combined with Liquid Chromatography–Tandem Mass Spectrometry" Foods 11, no. 22: 3624. https://doi.org/10.3390/foods11223624
APA StyleGuan, X., Feng, Y., Suo, D., Xiao, Z., Wang, S., Liang, Y., & Fan, X. (2022). Simultaneous Determination of 11 Mycotoxins in Maize via Multiple-Impurity Adsorption Combined with Liquid Chromatography–Tandem Mass Spectrometry. Foods, 11(22), 3624. https://doi.org/10.3390/foods11223624