Abstract
The residues of aminoglycosides in foods of animal origin are a potential risk to consumers. There have been some immunoassays reported for the screening of aminoglycoside residues, but the method showing the broadest detection spectrum can only be used to detect two drugs. This is because a broad specific recognition reagent is not available. In the present study, the receptor of aminoglycosides (ribosomal protein S12 of Lysinibacillus sphaericus) was expressed, and its affinities and recognition mechanisms for 10 aminoglycosides were studied by using surface plasmon resonance and molecular docking, respectively. Then the receptor was used as a recognition reagent to develop a fluorescence polarization assay on a 96-well microplate for the detection of the 10 drugs in pork muscle samples. The limits of detection for the 10 drugs ranged from 5.25 to 30.25 ng/g. The sensitivities for the 10 drugs were generally consistent with their respective receptor affinities and binding energies. After comprehensive comparison, the method performances were better than all the previously reported immunoassays for aminoglycosides. This is the first study reporting the recognition mechanisms of ribosomal protein S12 of Lysinibacillus sphaericus for 10 aminoglycosides and the use of it as a recognition reagent to develop a pseudo-immunoassay for the multi-determination of aminoglycosides in food samples.
1. Introduction
Aminoglycoside drugs (AGs) have been used for the treatment of Gram-negative bacteria-induced infections in human beings and animals for nearly 80 years. The molecules of 10 commonly used AGs are shown in Figure 1. However, the extensive use of AGs in food-producing animals inevitably leads to their residues in foods of animal origin that are potential risks to the consumers due to their severe nephrotoxicity and ototoxicity [1,2]. Therefore, many methods have been reported to detect AG residues in different food samples; the instrumental method and immunoassay are the commonly used techniques [3,4].
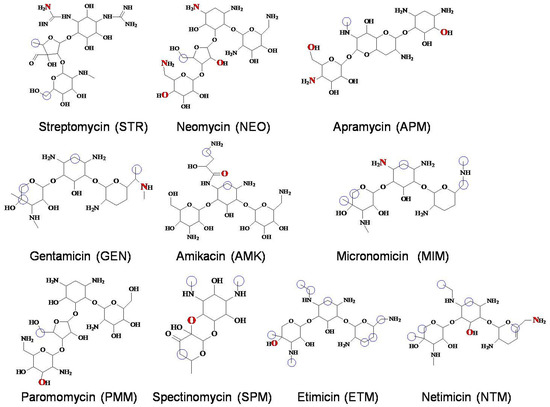
Figure 1.
Molecules of the 10 AGs. (Atoms highlighted inred were the binding sites of hydrogen bond. Atoms highlighted with blue circles were the binding sites of hydrophobic interaction.).
In comparison with instrumental methods, immunoassays are simple and cheap, so they are usually used for the rapid screening of a large number of samples. By now, there have been different types of immunoassays reported to detect AGs, including enzyme-linked, immunosorbent assays [5,6,7,8,9,10,11], fluorometric immunoassays [12], chemiluminescent immunoassays [13], immunochromatographic strips [14,15,16,17], and biosensors [18].
It is well known that the key element of immunoassays is used as a recognition reagent. Among the reported immunoassays for AGs, polyclonal antibodies, monoclonal antibodies, and aptamers are commonly used recognition reagents. However, the recognition abilities of these reagents are limited. For example, most of the antibodies [6,8,9,12,13,14,15,16,17] and all the aptamers [18] can only recognize one drug, and the antibodies showing the broadest recognition spectrum can recognize at most two Ags [5,10,11]. This means that an immunoassay capable of multi-determining Ags residues has not been reported so far, which is because a broad specific recognition reagent for Ags is not available. Therefore, it is necessary to find new recognition reagents with broad recognition ability for Ags.
It is well known that the receptor is a natural macromolecule, and a specific receptor is the usual target site of one class of drugs, so in theory, it should recognize all the species of this class of drugs. During the past few years, some receptors have been used as recognition reagents to develop pseudo-immunoassays for the detection of sulfonamides [19,20,21,22,23], β-lactams [24], tetracyclines [25,26,27], and β2-agonists [28]. Results showed that these receptors exhibited broader detection spectra than the controlled antibodies. For example, our recently reported pseudo-immunoassay based on dihydropteroate synthase could determine 40 sulfonamides [23], better than all the antibody-based immunoassays.
The prokaryotic ribosome is composed of the 50S and 30S subunits, and the latter is composed of 16S rRNA and 21 ribosomal proteins. AGs can bind 16S rRNA helices and ribosomal protein S12 (RpsL12) to interfere with the function of the bacterial ribosome and show an antibacterial effect [29,30,31]. Furthermore, the amino acid mutations in RpsL12 have been proven to be the major mechanism of AG-resistant bacterial strains [32,33,34,35]. Therefore, RpsL12 is the AG receptor that should recognize and bind to all AG species. To the best of our knowledge, however, there has been no study reporting the use of RpsL12 as a recognition reagent for the detection of AGs so far. In addition, all the previously reported studies on RpsL12 focus on studying the AG antibacterial and AG resistant mechanisms, and interaction mechanisms with AGs have not been studied.
Among the reported different immunoassays, the fluorescence polarization immunoassay is very simple and contains only one sample-loading step, so one assay can be finished in several minutes. As a result, this method has been used for the determination of many analytes [36]. In the present study, the Lysinibacillus sphaericus RpsL12 was expressed, and its recognition mechanisms and affinities for the 10 AGs, shown in Figure 1, were studied by using the molecular docking and surface plasmon resonance, respectively. Then it was used as a recognition reagent to develop a fluorescence polarization assay (FPA) for the multi-determination of 10 AGs in a pork muscle sample.
2. Materials and Methods
2.1. Reagents and Chemicals
The standards of streptomycin (STR), neomycin (NEO), gentamicin (GEN), amikacin (AMK), spectinomycin (SPM), apramycin (APM), paromomycin (PMM), netimicin (NTM), and fluorescein isothiocyanate (FITC) were from Shanghai Yuanye Biological Technology Co., Ltd. (Shanghai, China). Micronomicin (MIM) and etimicin (ETM) were from the China National Institute for Food and Drug Control (Beijing, China). All the used biological reagents were the same as those in our recent report [25] (see Supplementary Materials).
2.2. Expression of RpsL12
The recombinant plasmids were synthesized at Sangon Biotech Co., Ltd. (Shanghai, China) by inserting the RpsL12 gene of Lysinibacillus sphaericus (GenBank ID: AHC30887.1) into the express vector pET32a(+). The plasmids containing the express vector pET32a-RpsL12 were transformed into BL21 (D3) for acculturation, and the gene products in the positive colonies were characterized by a polymerase chain reaction and DNA sequencing. Then the RpsL12 was expressed with the same procedures as those described in our recent report [25] (see Supplementary Materials), and the obtained product was analyzed with SDS-PAGE electrophoresis and Western blotting.
2.3. Molecular Docking
The amino acid sequence of L. sphaericus RpsL12 was translated from its gene sequence by using DNAman 6.0 (LynnonBiosoft, San Ramon, CA USA) and compared with the amino acid sequences of several RpsL12 from other bacterial strains. Then its 100% homological 3D conformation (E. coli RpsL12, PDB ID:7P7S) was used to dock with the 10 AGs, and their intermolecular interaction mechanisms were determined, including the binding pocket, binding energy, contact amino acid, intermolecular force, and binding site.
2.4. Surface Plasmon Resonance (SPR)
The affinities of the RpsL12 for the 10 AGs were determined by using the surface plasmon resonance technique (SPR), and the assay procedures were performed according to our recent report [22] (see Supplementary Materials). During the SPR test, the association constant (Ka), dissociation constant (Kd), and equilibrium dissociation constant (KD = Kd/Ka) for the 10 AGs were determined. Furthermore, the absolute affinity constants (KA=Log2(KD)) for the 10 AGs were also calculated, which were used to conveniently compare their affinities.
2.5. Synthesis of Fluorescent Tracer STR-FITC
The fluorescent tracer was synthesized by coupling streptomycin (STR) with fluorescein isothiocyanate (FITC) (Figure 2). Briefly, 12 mg (20 μmol) STR and 25 μL triethylamine were added into 1 mL water. Eight mg (20 μmol) FITC, dissolved in 200 μL DMSO, was added into the above solution to be gently stirred at room temperature for 12 h. Then the mixture was transferred onto a homemade thin-layer chromatography plate and separated by using methanol: benzene (1:3, v/v). The silica gel band containing the target (Rf value of 0.14) was scraped, and the obtained powder was washed with 3 mL methanol. The yellow-green eluate containing STR-FITC (4 mg/mL) was collected and stored at −4 °C for use.
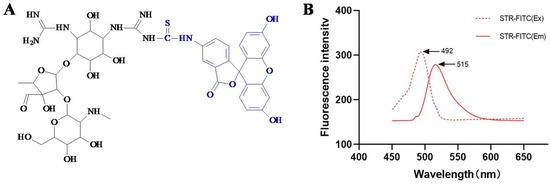
Figure 2.
(A) Molecule of STR-FITC and (B) its fluorescence spectrum. STR-FITC is the conjugate of streptomycin (STR) and fluorescein isothiocyanate (FITC). STR-FITC (Ex) is the excitation wavelength of STR-FITC, and STR-FITC (Em) is emission wavelength of STR-FITC.
2.6. Development of Fluorescence Polarization Assay (FPA)
The analyte solution (50 μL), the fluorescent tracer solution (50 μL), and the RpsL12 solution (50 μL) diluted with PBS (pH 7.0) were added to the wells of a 96-well microplate. The plate was incubated for 3 min, and the fluorescence polarization value (FP) of each well was recorded at λex485/λem528 nm (emission cutoff of 515 nm). During the experiments, the RpsL12 concentration, tracer concentration, incubation time, and pH of the assay solution were optimized. Then the competitive inhibition curves for the 10 AGs were developed by plotting the FP/FP0 values (where FP was the fluorescence polarization value of each concentration and FP0 was the fluorescence polarization value of zero concentration) versus the drug concentrations (Log C). Half of the inhibition concentration (IC50, the analyte concentration showing 50% inhibition) and limit of detection (IC10, the analyte concentration showing 10% inhibition) for each drug were calculated.
2.7. Sample Extraction and Analysis
The AG residues in the pork muscle sample were extracted as follows. Before sample preparation, the fat tissues in the muscle samples were removed as fully as possible. Then 2 g of homogenized pork samples and 5 mL of 3% trichloroacetic acid were added into a centrifuge tube to be stirred for 5 min. After centrifugation at 10,000 rpm for 5 min, the supernatant was neutralized with 30% NaOH solution. Finally, an appropriate volume of the solution was transferred onto the microplate for analysis. During the experiments, some blank pork muscle samples, which were known to be free from AGs, were collected from several controlled slaughterhouses to evaluate the method. The 10 AGs were fortified into the blank samples at different levels to be extracted and analyzed. Finally, 50 real pork muscle samples were collected from some local supermarkets and analyzed as described above.
3. Results and Discussions
3.1. Characterization of RpsL12
In this study, the L. sphaericus RpsL12 gene was directly inserted into pET32a(+) to synthesize the expression vector. As shown in Figure 3A, the expected RpsL12 gene was obtained (1138 bp, containing the target RpsL12 gene 426 bp and the T7 primer 712 bp). As shown in Figure 3B, the expected genes of pET32a(+) (5860 bp) and RpsL12 (426 bp) after enzyme digestion were also obtained. Then the pET32a-RpsL12 was expressed in Escherichia coli BL21(D3). As shown in Figure 3C, the RpsL12 was expressed in both the inclusion body and the supernatant (molecular weight 34 kDa). For convenience, the RpsL12 in the supernatant was purified for the subsequent experiments. As shown in Figure 3D, the results of a Western blotting experiment showed the target protein was obtained. Furthermore, its 100% conserved amino acids were the same as the RpsL12 from other bacterial strains (Figure S1, Supplementary Materials). These results showed that the target RpsL12 was obtained.
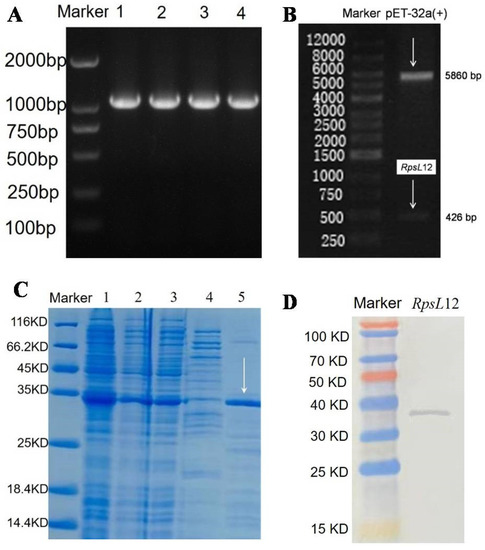
Figure 3.
(A) Agarose gel electrophoresis results of (A) RpsL12 gene (1138 bp, containing RpsL12 gene 426 bp and T7 primer 712 bp) (lane 1-4, PCR products) and (B) express vector pET32a-RpsL12 after enzyme digestion. (C) SDS-PAGE results of RpsL12 (34 kDa) (lane 1, bacterial whole protein; lane 2, supernatant; lane 3, inclusion body; lane 4, collected rinse solution during supernatant purification; lane 5, purified supernatant). (D) Western blotting analysis of RpsL12.
3.2. Recognition Mechanisms for AGs
As far as we know, there has been only one study reporting the intermolecular interaction of L. sphaericus RpsL12 with AGs (streptomycin) [35]. The results showed that the amino acids at the 40–45 positions constructed the binding pocket, and hydrogen bonds (Thr40, Pro41, Arg42, Lys43, Asn45) and hydrophobic interaction (Pro41 and Pro44) were the main intermolecular forces. However, other intermolecular interaction parameters and their interaction mechanisms with other AGs were not studied. In the present study, the 100% homological model of the present L. sphaericus RpsL12 (PDB ID: 7P7S) was docked with the 10 AGs to study its recognition mechanisms, and the docking complexes and docking results were shown in Table 1 and Figure 1 and Figure 4.

Table 1.
Docking results, absolute affinity constants (KA) and determination parameters for the 10 AGs.
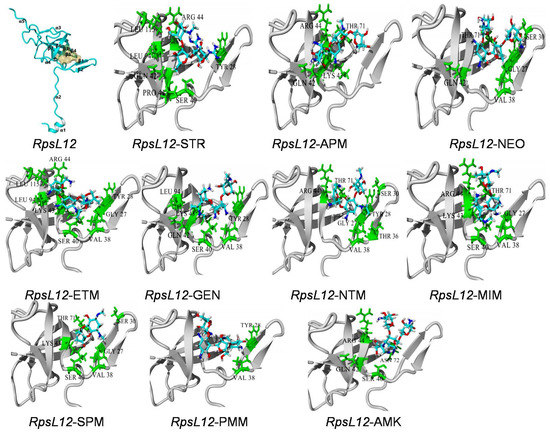
Figure 4.
General conformation of RpsL12 and the close-up view of its docking complexes with the 10 AGs.
As shown in Figure 4, the present RpsL12 contained five α-helixes and seven β-sheets, and the binding pocket was surrounded by β1, β2, β3, and β4. The 10 AGs could all be docked into the pocket. STR, GEN, AMK, MIM, ETM, SPM, NTM and NEO were deep in the pocket, whereas PMM and APM only interacted with one side wall of the pocket. The molecules of STR, GEN, AMK, MIM, ETM, PMM, NTM, and NEO were generally in a “V shape” in the pocket, whereas the molecules of APM and SPM were in plane formations. As shown in Table 1, the hydrophobic interaction was the main intermolecular force, and the hydrogen bond was the secondary force, though the specific contact amino acids for the 10 drugs were not the same.
General considerations of the results are shown in Table 1 and Figure 4. VAL38 from β2 (interacting with 7 AGs) and SER40 from β3 (interacting with 6 AGs) constructed the pocket bottom; GYL27 from β1 (interacting with 5 AGs) and TYR28 from β1 (interacting with 6 AGs) constructed one side of the pocket, and GLN42 from β3 (interacting with 5 AGs), LYS43 from β3 (interacting with 5 AGs) and ARG44 from β3 (interacting with 6 AGs) and THR71 from β4 (interacting with 5 AGs) constructed the other side of the pocket. The positions of these contact amino acids were similar to the previous report [35]. As shown in Figure 1, the specific binding sites in the 10 AGs were different, and this may be because of their different molecular structures. Still, the binding energies of the RpsL12 for the 10 drugs were in a narrow range (5.15–5.84 kcal/moL, Table 1), indicating that the RpsL12 showed comparable recognition for them.
For confirmation of the molecular docking results, the receptor affinities for the 10 drugs were also determined by SPR. The detailed Ka, Kd, KD, and KA are shown in Table S1 (Supplementary Materials), and the KA values are also shown in Table 1. As shown in Table 1, the KA values for the 10 drugs ranged from 11.358–26.102, which meant the present RpsL12 showed comparable affinities to the 10 drugs, consistent with the docking results. The recognition mechanisms of RpsL12 protein for AGs reported in the present study were more comprehensive than the previous report [35].
3.3. Characterization of the Fluorescent Tracer
For the development of a fluorescence polarization assay, a fluorescent tracer was required. In the present study, STR was coupled with FITC to synthesize the fluorescent tracer STR-FITC (Figure 2A). As shown in Figure 2B, its excitation wavelength was 492 nm, and its emission wavelength was 515 nm, indicating that the STR-FITC was synthesized.
3.4. Evaluation of RpsL12 and STR-FITC
For evaluating if the above two reagents could be used to develop an FPA method, the RpsL12, the STR-FITC, and five drugs (STR, erythromycin, avermectin, tetracycline, and sarafloxacin; 0 and 100 ng/mL) were mixed to perform the assay. As shown in Figure 5, when the concentration of these drugs was at 0 ng/mL, the FP values of single RpsL12 and single STR-FITC were all negligible, but the FP values of RpsL12+STR-FITC were high. This proved that the STR-FITC could bind with the RpsL12 to induce the fluorescence polarization phenomenon, i.e., they could be used to develop an FPA method. As shown in Figure 5, when the concentration of these drugs was at 100 ng/mL, the FP value, when detecting STR, largely decreased (inhibition ratio 89%), but the detection of other drugs showed a liter change (inhibition ratios < 4%). These results proved that the RpsL12 was only specific for STR. So, the two reagents were used to optimize the FPA method.
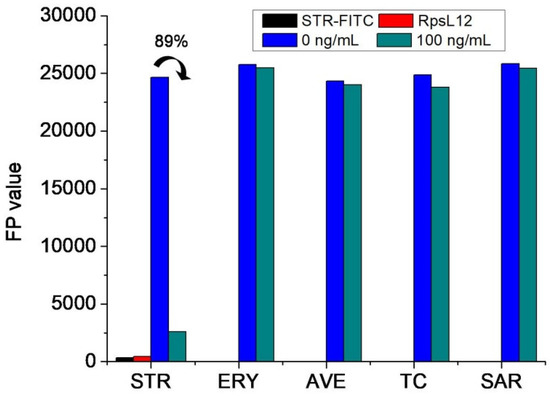
Figure 5.
FP values when testing STR and other drugs by using STR-FITC (8 μg/mL) and RpsL12 (2 μg/mL) (pH 7.0; incubation time 5 min; ERY = erythromycin, AVE = avermectin, TC = tetracycline, SAR = sarafloxacin).
3.5. Optimization of FPA Method
This is the first study reporting the use of RpsL12 as a recognition reagent to develop an FPA method for the detection of AGs. Several parameters were optimized with STR as the representative to obtain the best-performing method. Firstly, the concentrations of RpsL12 and STR-FITC were optimized. During the experiments, different concentrations of RpsL12 and STR-FITC were mixed with an STR solution (100 ng/mL) to perform the assay. As shown in Figure 6A, the inhibition ratio of STR was the highest when the concentrations of RpsL12 and STR-FITC were 2 and 8 μg/mL, respectively. Secondly, the pH of the assay system was optimized. During the experiments, STR and RpsL12 were diluted with PBS at different pH values to perform the assay. As shown in Figure 6B, the inhibition ratio of STR was the highest when the assay system was at a pH of 7.0. Thirdly, the competition time was optimized. As shown in Figure 6C, the inhibition ratio of STR reached a plateau when the mixture was incubated for 3 min. Therefore, the above optimal parameters were used for the following experiments.
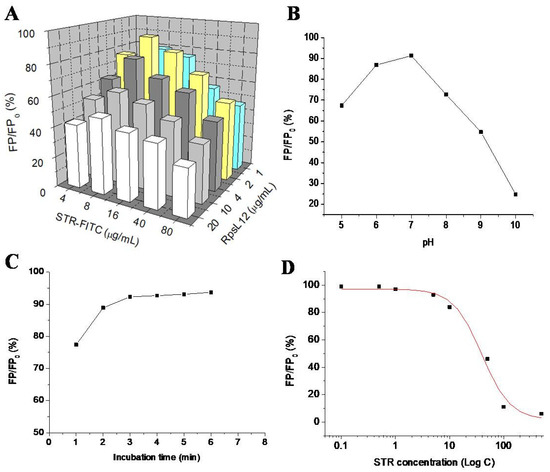
Figure 6.
Results for optimization of (A) RpsL12/STR-FITC concentration (pH 7.0, incubation 5 min), (B) pH (STR-FITC 8 μg/mL, RpsL12 2 μg/mL, incubation 5 min), and (C) incubation time (STR-FITC 8 μg/mL, RpsL12 2 μg/mL, pH 7.0) by using STR (100 ng/mL). (D) Competitive inhibitory curve of STR (0.1–500 ng/mL).
3.6. Method Performances
Under optimal conditions, the 10 AGs were diluted with the extracts of blank pork muscle samples to be assayed by the FPA method. The representative competitive inhibition curve of STR is shown in Figure 6D. As shown in Table 1, the IC50 values for the 10 AGs were in the range of 47.6–72.2 ng/mL, and the limits of detection (IC10) were in the range of 2.1–12.1 ng/mL. Due to the 2.5-fold dilution during sample preparation, the limits of detection for the determination of the 10 AGs in the pork muscle sample were in the range of 5.25–30.25 ng/g.
For an overview of the method sensitivity and RpsL12 recognition ability, the binding energy (5.15–5.84 kcal/moL), KA (11.358–26.102), and IC50 (47.6–72.2 ng/mL) of the 10 AGs were integrated. As shown in Figure 7, the average value of the binding energy was 5.5 with a standard deviation of 0.22, the average value of KA was 60.22 with a standard deviation of 8.19, and the average value of IC50 was 20.74 with a standard deviation of 5.54. This meant that the three parameters for the 10 drugs were all in a narrow range, i.e., the RpsL12 showed comparable bindings, affinities, and sensitivities to the 10 drugs, which was the base to develop the multi-analytes FPA method for the 10 AGs.
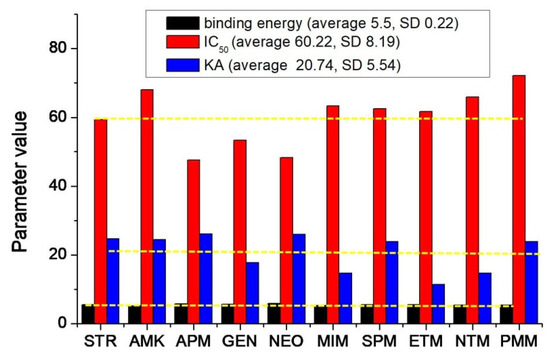
Figure 7.
Change trends of the binding energy, absolute affinity constants (KA), and IC50 for the 10 AGs. (The yellow line is the average value of each parameter).
3.7. Sample Determination
For the evaluation of the method of application, the 10 AGs were fortified in the blank pork muscle samples to be assayed. As shown in Table 2, the recoveries were in the range of 74.5–97.6% and the coefficients of variation were in the range of 6–14%. Finally, the 50 real pork muscle samples were analyzed by the FPA. It was found that only one real sample was determined as positive by the present method, and the residue level was expressed as STR with 26 ± 4.1 ng/g (3 repetitions), which was lower than its maximum residue limit in meat, 100 ng/g [37]. However, the specific drug species could not be identified because of the RpsL12’s broad recognition ability. Therefore, the positive results of the present FPA method for real samples should be confirmed by using an instrumental method (e.g., LC-MS/MS) to identify the specific AGs species, but such an instrumental method capable of simultaneous determining the 10 AGs remained to be studied. Nevertheless, the present FPA method could be used as a simple screening tool for the multi-detection of the 10 AGs in many pork muscle samples.
Table 2.
AGs recoveries from the standards fortified blank pork muscle samples (n = 5).
3.8. Comparison with Related Immunoassays
This study used RpsL12 as a recognition reagent to develop an FPA method for the multi-determination of 10 AGs. For comparison, some previously reported immunoassays for the detection of AGs [5,6,7,8,9,10,11,12,13,14] are listed in Table 3. First, the detection spectrum of the present FPA method was broader than all those methods. Second, the operation process of the present FPA was simpler than all those methods. Third, the assay time of the present FPA method was shorter than all those methods. Fourth, the sensitivity of the present FPA method was not the highest, but it could still be used to detect low levels of AG residues. With a general consideration of these points, the present FPA method showed a better performance than those methods.
Table 3.
Comparisons with some previous immunoassays for detection of AGs.
4. Conclusions
The residues of AGs in foods of animal origin are potential risks to consumers, and many immunoassays have been reported to detect their residues. All the previously reported immunoassays cannot multi-determine this class of drugs, and the immunoassay showing the broadest detection spectrum can only determine two drugs. This present study expressed RpsL12 and used it as a recognition reagent to develop an FPA method for the multi-determination of 10 AGs in pork muscle samples. Results showed that the method performances were generally better than all the previous immunoassays for AGs. Therefore, this method could be used as a simple, rapid, and sensitive tool for multi-screening the residues of the 10 AGs in a large number of food samples.
Supplementary Materials
The following supporting information can be downloaded at: https://www.mdpi.com/article/10.3390/foods11203196/s1. Figure S1: Amino acid sequences of the present RpsL12 (Lysinibacillus sphaericus, PDB: 7P7S) and the RpsL12 proteins of Bacillus subtili (PDB: 3J9W), Escherichia coli (PDB: 5JTE), Enterococcus faecalis (PDB: 7P7U), Thermus thermophilus HB8 (PDB: 2F4V), and Acinetobacter baumannii (PDB: 7RYF). The amino acids highlighted in dark blue are the 100% conserved residues; Table S1: Ka, Kd, KD and KA values of the RpsL12 for the 10 AGs.
Author Contributions
Methodology, W.X.; writing—original draft, L.Z., W.X. and J.W.; validation, J.W.; funding acquisition, J.W.; conceptualization, J.W.; writing—reviewing and editing, J.W. All authors have read and agreed to the published version of the manuscript.
Funding
This research was funded by Natural Science Foundation of Hebei Province (C2020204130), and the APC was funded by the same funder.
Institutional Review Board Statement
This article does not contain any studies with animals performed by any of the authors. This article does not contain any studies with humans. All the authors listed in the manuscript are entitled to the authorship and have approved the final version of the submitted manuscript.
Data Availability Statement
The data presented in this study are available on request from the corresponding author.
Conflicts of Interest
The authors declare no conflict of interest.
References
- Aronson, J.K.; Reynolds, D.J. ABC of monitoring drug therapy, aminoglycoside antibiotics. BMJ 1992, 305, 1421–1424. [Google Scholar] [CrossRef] [PubMed]
- Selimoglu, E. Aminoglycoside-induced ototoxicity. Curr. Pharm. Des. 2007, 3, 119–126. [Google Scholar] [CrossRef]
- Farouk, F.; Azzazy, H.M.E.; Niessen, W.M.A. Challenges in the determination of aminoglycoside antibiotics, a review. Anal. Chim. Acta 2015, 890, 21–43. [Google Scholar] [CrossRef] [PubMed]
- Hari, R.; Taherunnisa, S.; Raut, S.Y.; Mutalik, S.; Koteshwara, K.B. Challenges in the development of analytical test procedure for aminoglycosides: A critical review. J. Appl. Pharm. Sci. 2019, 9, 145–152. [Google Scholar]
- Chen, Y.; Wang, Z.; Wang, Z.; Tang, S.; Zhu, Y.; Xiao, X. Rapid enzyme-linked immunosorbent assay and colloidal gold immunoassay for kanamycin and tobramycin in swine tissues. J. Agric. Food Chem. 2008, 56, 2944–2952. [Google Scholar] [CrossRef] [PubMed]
- Abuknesha, R.A.; Luk, C. Enzyme immunoassays for the analysis of streptomycin in milk, serum and water: Development and assessment of a polyclonal antiserum and assay procedures using novel streptomycin derivatives. Analyst 2005, 130, 964–970. [Google Scholar] [CrossRef] [PubMed]
- Shalev, M.; Kandasamy, J.; Skalka, N.; Belakhov, V.; Rosin-Arbesfeld, R.; Baasov, T. Development of generic immunoassay for the detection of a series of aminoglycosides with 6′-OH group for the treatment of genetic diseases in biological samples. J. Pharmaceut. Biomed. 2013, 75, 33–40. [Google Scholar] [CrossRef]
- Ho, T.Y.J.; Chan, C.; Chan, K.; Wang, Y.C.; Lin, J.; Chang, C.; Chen, C. Development of a novel bead-based 96-well filtration plate competitive immunoassay for the detection of Gentamycin. Biosens. Bioelectron. 2013, 49, 126–132. [Google Scholar] [CrossRef]
- Xu, F.; Jiang, W.; Zhou, J.; Wen, K.; Wang, Z.; Jiang, H.; Ding, S. Production of monoclonal antibody and development of a new immunoassay for apramycin in food. J. Agric. Food Chem. 2014, 62, 3108–3113. [Google Scholar] [CrossRef]
- Jiang, L.; Wei, D.; Zeng, K.; Shao, J.; Zhu, F.; Du, D. An enhanced direct competitive immunoassay for the detection of kanamycin and tobramycin in milk using multienzyme-particle amplification. Food Anal. Methods 2018, 11, 2066–2075. [Google Scholar] [CrossRef]
- Wei, D.; Meng, H.; Zeng, K.; Huang, Z. Visual dual dot immunoassay for the simultaneous detection of kanamycin and streptomycin in milk. Anal. Methods 2019, 11, 70–77. [Google Scholar] [CrossRef]
- Song, E.; Yu, M.; Wang, Y.; Hu, W.; Cheng, D.; Swihart, M.T.; Song, Y. Multi-color quantumdot-based fluorescence immunoassay array for simultaneous visual detection of multiple antibiotic residues in milk. Biosens. Bioelectron. 2015, 72, 320–325. [Google Scholar] [CrossRef] [PubMed]
- Luo, P.J.; Zhang, J.B.; Wang, H.L.; Chen, X.; Wu, N.; Zhao, Y.F.; Wang, X.M.; Zhang, H.; Zhang, J.Y.; Zhu, L.; et al. Rapid and sensitive chemiluminescent enzyme immunoassay for the determination of neomycin residues in milk. Biomed. Environ. Sci. 2016, 29, 374–378. [Google Scholar] [PubMed]
- Jin, Y.; Jang, J.; Lee, M.; Han, C. Development of ELISA and immunochromatographic assay for the detection of neomycin. Clin. Chim. Acta 2006, 364, 260–266. [Google Scholar] [CrossRef] [PubMed]
- Hendrickson, O.D.; Byzova, N.A.; Zvereva, E.A.; Zherdev, A.V.; Dzantiev, B.B. Sensitive lateral flow immunoassay of an antibiotic neomycin. J. Food Sci. Technol. 2021, 58, 292–301. [Google Scholar] [CrossRef]
- Sun, Y.; Yang, J.; Yang, S.; Sang, Q.; Teng, M.; Li, Q.; Deng, R.; Feng, L.; Hu, X.; Zhang, G. Development of an immunochromatographic lateral flow strip for the simultaneous detection of aminoglycoside residues in milk. RSC Adv. 2018, 8, 9580. [Google Scholar] [CrossRef]
- Wei, D.; Zhang, X.; Chen, B.; Zeng, K. Using bimetallic Au@Pt nanozymes as a visual tag and as an enzyme mimic in enhanced sensitive lateral-flow immunoassays: Application for the detection of streptomycin. Anal. Chim. Acta 2020, 1126, 106–113. [Google Scholar] [CrossRef]
- Yue, F.; Li, F.; Kong, Q.; Guo, Y.; Sun, X. Recent advances in aptamer-based sensors for aminoglycoside antibiotics detection and their applications. Sci. Total Environ. 2021, 762, 143129. [Google Scholar] [CrossRef]
- Liang, X.; Wang, Z.; Wang, C.; Wen, K.; Mi, T.; Zhang, J.; Zhang, S. A proof-of-concept receptor-based assay for sulfonamides. Anal. Biochem. 2013, 438, 110–116. [Google Scholar] [CrossRef]
- Wang, Z.; Liang, X.; Wen, K.; Zhang, S.; Li, C.; Shen, J. A highly sensitive and class-specific fluorescence polarisation assay for sulphonamides based on dihydropteroate synthase. Biosens. Bioelectron. 2015, 70, 1–4. [Google Scholar] [CrossRef]
- Liang, X.; Li, C.; Zhu, J.; Song, X.; Yu, W.; Zhang, J.; Zhang, S.; Shen, J.; Wang, Z. Dihydropteroate synthase based sensor for screening multi-sulfonamides residue and its comparison with broad-specific antibody based immunoassay by molecular modeling analysis. Anal. Chim. Acta 2019, 1050, 139–145. [Google Scholar] [CrossRef] [PubMed]
- He, T.; Liu, J.; Wang, J.P. Development of a dihydropteroate synthase based fluorescence polarization assay for detection of sulfonamides and studying its recognition mechanism. J. Agric. Food Chem. 2021, 69, 13953–13963. [Google Scholar] [CrossRef] [PubMed]
- He, T.; Cui, P.L.; Liu, J.; Feng, C.; Wang, J.P. Production of a natural dihydropteroate synthase and development of a signal amplified pseudo immunoassay for determination of sulfonamides in pork. J. Agric. Food Chem. 2022, 70, 3023–3032. [Google Scholar] [CrossRef] [PubMed]
- Ahmed, S.; Ning, J.; Cheng, G.; Maan, M.K.; Chen, T.; Ahmad, I.; Algharib, S.A.; Yuan, Z. Development and validation of an enzyme-linked receptor assay based on mutant protein I188K/S19C/G24C for 40 beta-lactams antibiotics detection in 13 food samples. Microchem. J. 2020, 152, 104354. [Google Scholar] [CrossRef]
- Wang, G.; Zhang, H.C.; Liu, J.; Wang, J.P. A receptor-based chemiluminescence enzyme linked immunosorbent assay for determination of tetracyclines in milk. Anal. Biochem. 2019, 564–565, 40–46. [Google Scholar] [CrossRef]
- Wang, G.; Xia, W.Q.; Liu, J.X.; Wang, J.P.; Liu, J. Directional evolution of TetR protein and development of a fluoroimmunoassay for screening of tetracyclines in egg. Microchem. J. 2019, 150, 104184. [Google Scholar] [CrossRef]
- Xia, W.Q.; Cui, P.L.; Wang, J.P.; Liu, J. Synthesis of photoaffinity labeled activity-based protein profiling probe and production of natural TetR protein for immunoassay of tetracyclines in milk. Microchem. J. 2021, 170, 106779. [Google Scholar] [CrossRef]
- Danyi, S.; Degand, G.; Duez, C.; Granier, B.; Maghuin-Rogister, G.; Scippo, M.L. Solubilisation and binding characteristics of a recombinant beta2-adrenergic receptor expressed in the membrane of Escherichia coli for the multianalyte detection of beta-agonists and antagonists residues in food-producing animals. Anal. Chim. Acta 2007, 589, 159–165. [Google Scholar] [CrossRef]
- Magnet, S.; Blanchard, J.S. Molecular insights into aminoglycoside action and resistance. Chem. Rev. 2005, 105, 477–497. [Google Scholar] [CrossRef]
- Carter, A.P.; Clemons, W.M.; Brodersen, D.E.; Morgan-Warren, R.J.; Wimberly, B.T.; Ramakrishnan, V. Functional insights from the structure of the 30S ribosomal subunit and its interactions with antibiotics. Nature 2000, 407, 340–348. [Google Scholar] [CrossRef]
- Fosso, M.Y.; Li, Y.; Garneau-Tsodikova, S. New trends in the use of aminoglycosides. Med. Chem. Commun. 2014, 5, 1075–1091. [Google Scholar] [CrossRef] [PubMed]
- Sreevatsan, S.; Pan, X.; Stockbauer, K.E.; Williams, D.L.; Kreiswirth, B.N.; Musser, J.M. Characterization of rpsL and rrs mutations in streptomycin-resistant Mycobacterium tuberculosis isolates from diverse geographic localities. Antimicrob. Agents Chemother. 1996, 40, 1024–1026. [Google Scholar] [CrossRef] [PubMed]
- Kirthi, N.; Roy-Chaudhuri, B.; Kelley, T.; Culver, G.M. A novel single amino acid change in small subunit ribosomal protein S5 has profound effects on translational fidelity. RNA 2006, 12, 2080–2091. [Google Scholar] [CrossRef]
- Wang, G.; Inaoka, T.; Okamoto, S.; Ochi, K. A novel insertion mutation in streptomyces coelicolorribosomal S12 protein results in paromomycin resistance and antibiotic overproduction. Antimicrob. Agents Chemother. 2009, 53, 1019–1026. [Google Scholar] [CrossRef]
- Suriyanarayanan, B.; Lakshmi, P.P.; Santhosh, R.S.; Dhevendaran, K.; Priya, B.; Krishna, S. Streptomycin affinity depends on 13 amino acids forming a loop in homology modeled ribosomal S12 protein (rpsL gene) of Lysinibacillussphaericus DSLS5 associated with marine sponge (Tedaniaanhelans). J. Biomol. Struct. Dyn. 2016, 34, 1190–1200. [Google Scholar] [CrossRef] [PubMed]
- Zhang, H.; Yang, S.; Ruyck, K.D.; Beloglazova, N.; Eremin, S.A.; DeSaeger, S.; Zhang, S.; Shen, J.; Wang, Z. Fluorescence polarization assays for chemical contaminants in food and environmental analyses. TRAC Trends Anal. Chem. 2019, 114, 293–313. [Google Scholar] [CrossRef]
- GB 31650-2019; National Food Safety Standard—Maximum Residue Limits for Veterinary Drugs in Foods. Ministry of Agriculture of China: Beijing, China, 2019.
Publisher’s Note: MDPI stays neutral with regard to jurisdictional claims in published maps and institutional affiliations. |
© 2022 by the authors. Licensee MDPI, Basel, Switzerland. This article is an open access article distributed under the terms and conditions of the Creative Commons Attribution (CC BY) license (https://creativecommons.org/licenses/by/4.0/).