Abstract
Nuts used as a snack and meal accompaniment supply plant protein and fatty acids that are beneficial for human health; however, they can also provide minerals. The aim of this study was to determine the content of selected elements that are often deficient in the diet (calcium, potassium, magnesium, selenium, and zinc) in nuts and determine whether they can be used to supplement deficiencies in the diet. In this study, we analyzed 10 types of nuts (n = 120 samples) that are consumed and available for sale in Poland. The content of calcium, magnesium, selenium, and zinc was determined by the atomic absorption spectrometry method, and flame atomic emission spectrometry was used for determination of potassium contents. The highest median calcium content was found in almonds (2825.8 mg/kg), the highest potassium content in pistachio nuts (15,730.5 mg/kg), the highest magnesium and selenium contents in Brazil nuts (10,509.2 mg/kg and 4348.7 μg/kg, respectively), and the highest zinc content in pine nuts (72.4 mg/kg). All the tested nuts are a source of magnesium, eight types of tested nuts are a source of potassium, six nut types are a source of zinc, and four nut types are a source of selenium; however, among the tested nuts, only almonds can be considered a source of calcium. Moreover, we found that selected chemometric methods can be useful in the classification of nuts. The studied nuts are valuable products that can be used to supplement the diet with selected minerals and can therefore be labelled as functional products crucial for disease prevention.
1. Introduction
Nuts is a general term for tree nuts or fruit seeds with an edible grain and an inedible hard shell [1]. Nuts are a widespread group of products consumed most frequently in the Mediterranean diet but recommended for populations worldwide [2]. The most common products of this group are almonds (Amygdalus communis L.), Brazil nuts (Bertholletia excelsa Humb. et Bonpl.), cashews (Anacardium occidentale L.), hazelnuts (Corylus avellana L.), macadamia nuts (Macadamia ternifolia F. v. Mueller), pecan nuts (Carya illinoiensis (Wangenh.) K. Koch), pine nuts (Pinus pinea L.), pistachio nuts (Pistacia vera L.), and walnuts (Juglans regia L.). Peanuts (Arachis hypogea L.) are botanically a legume but are identified by consumers as ‘nuts’ [3].
Nuts is a category of food products with a very wide range of uses, although most often associated with roasted or dried consumption, as an addition to confectionery (cookies, cakes, and chocolate), or hidden in commercial products (sauces, oils, ice creams, butter, and pastes). However, due to their nutritional value, they should be eaten as snacks and as a part of complete meals [4,5].
The first study that reported the beneficial effects of nut consumption on health was published almost 30 years ago [6]. It was a breakthrough moment because since then, research has been conducted on the intensive health effects of nuts. Investigation in the 1990s suggested that some civilizations consumed nuts even before cereal grains became part of their diet [5].
Some consumers are concerned about the consumption of nuts because they are fat-rich and therefore are a very energy-dense food. Although each fat provides the same amount of calories, they are not created equal. It has been scientifically proven that saturated and trans fatty acids have a negative effect on the body’s lipid metabolism. However, fats found in high concentrations in nuts, i.e., monounsaturated (MUFA) and polyunsaturated (PUFA) fatty acids, have beneficial effects on the health of consumers by improving the aforementioned metabolism—therefore, they have the opposite effect [7]. Nut consumption is often associated with increased health risks related to contaminants, such as aflatoxins produced by fungi; in the case of nuts, the most common are Aspergillus flavus, A. parasiticus, and A. nomius [8]. Based on reported cases in 2015–2020, the least contaminated nuts include Brazil nuts, pecans, and walnuts [8,9]. Nuts can also contain toxic elements. In our previous study, 8% of tested samples exceeded the lead limit, 33% of which were pecans. The remaining studied products were considered safe [10]. Nevertheless, there are many health benefits associated with adding nuts from verified sources to the diet. They contain dietary fiber, which has a beneficial effect on the intestines and their peristalsis, as well as a number of vitamins (E, K, B1, B6, and B9), minerals (e.g., calcium (Ca), potassium (K), magnesium (Mg), selenium (Se), and zinc (Zn)), and bioactive compounds (antioxidants, carotenoids, phytosterols, and phenols) [11].
In terms of energy value per 100 g of product, the most caloric nuts are macadamia and pecan (200 kcal). Taking into account nutritional density, the nuts with the highest content of PUFAs are walnuts (13 g); the highest MUFA content is found in macadamia nuts (17 g); the highest protein content is found in almonds and pistachio nuts (6.0 g and 5.8 g, respectively); the highest content of dietary fiber is found in almonds (4 g); the highest content of alpha-tocopherol is found in almonds (7.3 mg); the highest contents of vitamin B6 and B9 are found in pistachio nuts and hazelnuts (0.6 mg and 32 mg, respectively); and the highest contents of mineral elements, such as K and Fe, are found in pistachio nuts (291 mg) and cashews (1.9 mg), respectively [12].
Research databases consist mainly of works exploring individual nuts; however, there is a lack of comparative studies on the most common types of nuts, particularly in terms of minerals, mainly Se content. Moreover, there is little information available about the contents of mineral in nuts, such as pecans or pine nuts, which were analyzed in this study. To the best of our knowledge, no studies have been conducted to date on the parameters of %RVI and INQ, evaluating nuts as a source of minerals in the diet.
Therefore, the aim of our study was to determine the content of the most important minerals essential for the maintenance of human health (Ca, K, Mg, Zn, and Se) in the most commonly consumed types of nuts. We also evaluated nuts as a potential dietary source of these elements, which are very often deficient in the diet, and determined whether the tested nuts can be used as dietary supplementation. Additionally, we supported our results with chemometric analysis.
2. Materials and Methods
2.1. Materials—Collection and Preparation
The study included 120 samples of nuts: 12 samples of 10 types of nuts (almonds, Brazil nuts, cashews, hazelnuts, macadamia nuts, peanuts, pecans, pine nuts, pistachio nuts, and walnuts). Packed nuts were purchased in stationery stores in Poland. The country of origin was specified on 81 packages: Argentina (n = 1), Australia (n = 11), Azerbaijan (n = 1), Bolivia (n = 2), Brazil (n = 5), China (n = 10), Georgia (n = 5), India (n = 7), Iran (n = 8), Italy (n = 1), Pakistan (n = 1), Poland (n = 8), Spain (n = 1), Ukraine (n = 1), USA (n = 16), and Vietnam (n = 3).
The samples of nuts were ground in a mortar and weighed in quantities of approximately 0.3 g (with an accuracy 1 mg) into mineralization vessels; exact masses were noted. Then, 4 mL of spectrally ultrapure concentrated nitric acid (69% HNO3, Tracepur, Merck, Darmstadt, Germany) was added to the vessels, and the samples were subjected to a wet mineralization process using the microwave technique in a closed system (Speedwave, Berghof, Eningen, Germany). The mineralized samples were stored at −20 °C in polypropylene vessels until analysis.
2.2. Ca, K, Mg, Se, and Zn Determination
The content of minerals in the nuts was determined by the atomic absorption spectrometry (AAS) technique with Zeeman background correction (Z-2000, Hitachi, Tokyo, Japan) using the method of atomization in an acetylene-air flame (Ca, Mg, Zn) or graphite tube (Se). Ca, Mg, Se, and Zn contents were determined at a wavelength of 422.7 nm, 285.2 nm, 196 nm, and 213.9 nm, respectively. A lanthanum chloride heptahydrate (Merck, Darmstadt, Germany) solution in a concentration of 1% was used as the modifying reagent to determine Ca and Mg contents. In the case of Se, a palladium-magnesium matrix modifier was used: 900 mg/L magnesium nitrate hexahydrate (Sigma-Aldrich, Steinheim, Germany) and 1500 mg/L palladium (II) nitrate hydrate (Merck, Darmstadt, Germany). Flame atomic emission spectrometry (FAES) was used to determine K contents at a wavelength of 766.5 nm.
Standard calibration curves were prepared using a 1 g/L standard solution of Ca, K, Mg, Se, and Zn (Merck, Darmstadt, Germany). The limit of detection for of Ca, Mg, Se, and Zn determination, estimated as characteristic concentration, was 0.149 mg/kg, 0.01 mg/kg, 1.6 µg/kg, and 0.016 mg/kg, respectively. The detection limit for K was 0.03 mg/kg. Ultrapure water from a Simplicity UV water purification system (Millipore, Molsheim, France) and spectral-grade reagents were used in all the experiments.
2.3. Verifying the Accuracy of the Method
The accuracy of the method was verified using Simulated Diet D certified reference material (Livsmedelsverket, National Food Agency, Sweden). The contents of individual elements in the reference material were determined, and the results were compared with the concentrations listed on the certificate. The average percent recoveries for analytical methods used in the examination of Ca, K, Mg, Se, and Zn contents were 98.5, 99.4, 102.5, 101.6, and 103%, respectively. The precision of methods for determination of Ca, K, Mg, Se, and Zn were 3.2, 2.8, 2.6, 2.6, and 3.7, respectively. The RSD (relative standard deviation) value did not exceed 5%.
2.4. Assessment of Nuts as a Source of Minerals in the Diet
In order to assess the use of nuts as natural food products for supplementation of minerals in the diet, the following parameters were calculated: percent of recommended dietary allowance (%RDA) [13], percent of reference value intake (%RVI) [14,15], and index of nutritional quality (INQ) [16].
RDA determines the level of consumption of a nutrient that covers the needs of almost all people in the group, depending on age and gender [13].
Food products can be considered a source of mineral components when the consumption of their standard portion covers more than 15% of RVI for minerals: Ca (800 mg), K (2000 mg), Mg (375 mg), Se (55 µg), and Zn (10 mg) [14,15]. We adopted a portion weight of 42 g as the most common amount used in dietary intervention studies [11].
The INQ is a ratio of the nutrient-to-calorie content of foods [16]. It can be calculated according to the following formula:
where:
A—content of the tested component in 100 g of the product based on the results obtained in this study;
B—the standard of energy demand depending on gender, physical activity, age, and body weight (for women: 2100 kcal; for men: 2600 kcal);
C—energy value provided by 100 g of the product (for almonds: 604 kcal; Brazil nuts: 656 kcal; cashews: 553 kcal; hazelnuts: 666 kcal; macadamia nuts: 718; peanuts: 610 kcal; pecans: 691 kcal; pine nuts: 691 kcal; pistachio nuts: 621 kcal; walnuts: 666 kcal);
D—the requirement for the tested component depending on age and gender (for women: 1000 mg Ca, 3500 mg K, 310 mg Mg, 55 µg Se, and 8 mg Zn; for men: 1000 mg Ca, 3500 mg K, 400 mg Mg, 55 µg Se, and 11 mg Zn).
An INQ value above 1 indicates that the product is a good source of nutrients and can be used to supplement dietary deficiencies.
2.5. Statistical Analysis
The obtained data were statistically analyzed using Statistica software (Tibco, Palo-Alto, CA, USA). The results are presented as average value (A.V.) with standard deviation (SD), minimum (Min.), maximum (Max.), median (Med.), and first and third quartiles (Q1–Q3). The normality of the distribution of the data was checked by the Shapiro–Wilk test. Kruskal–Wallis analysis of variance (ANOVA) with post hoc analysis was performed to demonstrate the differences in the mineral content between the types of nuts. The relationship between the content of the examined elements was assessed on the basis of Spearman’s rank correlation. Differences at a p-value < 0.05 were considered statistically significant.
The next step was chemometric analysis, including cluster analysis (CA), principal components analysis (PCA), and discriminant analysis (DA). Cluster analysis was performed on the basis of the single-bond agglomeration method, and the distance measure was the Euclidean distance.
3. Results
3.1. Ca, K, Mg, Se, and Zn Contents
Table 1 presents a comparison of the content of the tested elements in 10 types of nuts.

Table 1.
Ca, K, Mg, Se, and Zn contents in various type of nuts.
The median Ca content in the examined nuts ranged from 145.3 mg/kg in pine nuts to 2825.8 mg/kg for almonds. Brazil nuts, hazelnuts, pistachio nuts, and walnuts were characterized by Ca contents above 1000 mg/kg.
Among all tested nuts, pistachios are the most K-rich (15,730.5 mg/kg), whereas macadamias have the lowest K content (4591.7 mg/kg).
The lowest Mg content was found in pistachio nuts (1463.3 mg/kg), and the highest Mg content was found in Brazil nuts (10,509.2 mg/kg) and cashews (7281.3 mg/kg).
Brazil nuts also had the highest Se content (4348.7 μg/kg), which was about 12 times higher than that observed in cashews (353.9 μg/kg) and 121 times higher than that in almonds (36.8 μg/kg).
Among the examined nuts, the lowest Zn content was found in macadamia nuts (15.7 mg/kg) and the highest in pine nuts (72.4 mg/kg), with high Zn content also found in cashews (67.2 mg/kg) and Brazil nuts (61.6 mg/kg).
3.2. Nuts as a Source of Minerals in the Diet
In the case of Ca, the RDA was ranged from 0.6% (pine nuts) to 13.0% (almonds). Among all types of nuts tested, only almonds can be considered a source of Ca, as one portion met RVI at 16% (Table 2). The calculated INQ for men and women was above 1 in almonds only.
Table 2.
The content of the tested elements in a standard portion of nuts weighing 42 g and percent of RDA, RVI, and INQ for adults.
The consumption of a standard portion of nuts provides between 5.6% (macadamia nuts) and 18.8% of the RDA (pistachio nuts) for K. All the nuts, except pecans and macadamia nuts, can be considered a source of K (a serving covers more than 15% of RVI). Four types of nuts (pistachio nuts, almonds, cashews, and hazelnuts) can supplement K deficiencies in the diet for men and women, taking into account the INQ value of.
On the basis of the determined content of Mg in nuts, consumption of a standard portion provides 15.9% (pistachios, for men) to 159.9% of the RDA (Brazil nuts, for women). Due to the relatively high content of Mg, all the nuts analyzed in this study can provide more than 15% RVI. In addition, according the INQ values of the studied nuts, they can all be used to supplement Mg deficiencies in the diet.
A recommended 42 g daily portion of nuts fulfills the RDA for Se from 3.8% (hazelnuts) to 348.7% (Brazil nuts). Only four types of nuts can be considered a source of Se in the diet (Brazil nuts, cashews, macadamia nuts, and pistachio nuts), providing 22 to 349% RVI. The above-mentioned types of nuts, as well as peanuts, had an INQ above 1.
Taking into account the determined Zn content in the nuts, the RDA coverage was assessed, which ranged from 6.2% (macadamia nuts, for men) to 41.3% (pine nuts, for women). Most of the tested nuts (almonds, Brazil nuts, cashews, peanuts, pecans, and pine nuts) cover more than 15% of the RVI. All types of nuts, except for macadamia and pistachios, had an INQ above 1.
Brazil nuts have high contents of Se and Mg—to cover 100% of the RDA, it is enough to consume only 12 g and 26.3–33.9 g, respectively. However, in the case of Zn, a portion of 101.8 g to 140.0 g will cover 100% of the RDA (Table 3).
Table 3.
The amount of nuts (g) that covers 100% of the recommended dietary allowance (RDA).
3.3. Chemometric Analysis
The first step of chemometric data analysis was to assess the correlation between the content of elements in the tested nuts. We observed a positive, significant relationship between the content of Mg and Zn in pine nuts and pistachio nuts, as well as between all the studied types. High Zn content also correlated with the high Ca content in Brazil nuts and pecans. Moreover, high Ca content was correlated with high K content in all tested samples (Table 4).
Table 4.
Correlations between the contents of the examined elements.
In order to classify the examined nuts in terms of the content of beneficial elements, as well as to identify relationships between these factors, a chemometric analysis was performed, including CA, PCA, and DA.
CA can distinguish objects into groups. The results of the chemometric analysis are presented in the form of a dendrogram in Figure 1. The criteria used allowed for the identification of characteristic clusters. In the case of the analysis of Ca contents in nuts, two main clusters were observed: one for Brazil nuts and walnuts (with medium Ca content). CA for Mg distinguished two clusters, including one with pistachios (the lowest average Mg content). In the case of Se, clusters were distinguished, including separate clusters for Brazil nuts (with the highest Se content) and for peanuts (with medium values). CA in terms of Zn content distinguished walnuts (with medium values) and pecans (with almost the highest maximum value). CA analysis on the basis of the potassium content distinguished a main cluster containing W.
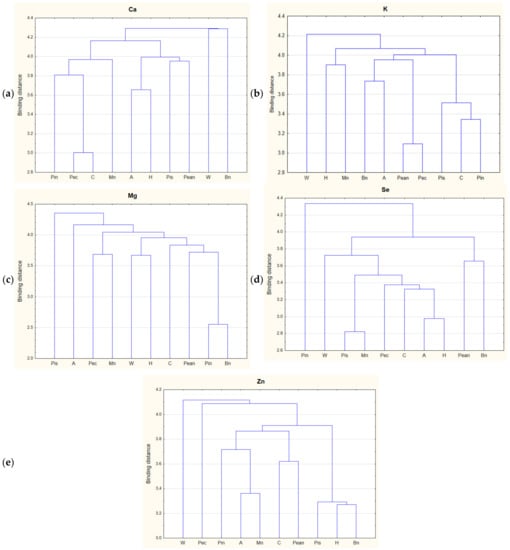
Figure 1.
Analysis of the clusters of tested nuts: (a) calcium, (b) potassium, (c) magnesium, (d) selenium, and (e) zinc. Abbreviations: A—almonds, Bn—Brazil nuts, C—cashews, Ca—calcium, H—hazelnuts, K—potassium, Mg—magnesium, Mn—macadamia nuts, Pean—peanuts, Pec—pecans, Pin—pine nuts, Pis—pistachio nuts, Se—selenium, W—walnuts, Zn—zinc.
The purpose of PCA is, inter alia, to reduce variables characterizing the studied cases. A high correlation was observed between the first three variables (Mg and Zn, r = 0.55; and Mg and Se, r = 0.63). The components corresponding to the first two factors explain 64.0% of the total variance, three factors explain 83.1% of the total variance, and four factors explain 95.0% of the total variance. In accordance with the Kaiser criterion, the components with eigenvalues greater than 1 were classified for interpretation; therefore, the quality of the representation was 77.3%. Figure 2 presents a plot of factor coordinates for the cases for factors 1 and 2. The Mg variable has a high value of the coefficient fifth (0.75), the variable Zn—the fourth (0.44), the variable Se—the third (0.56), the variable Ca—the second (0.74), and the variable K—the second (0.60).
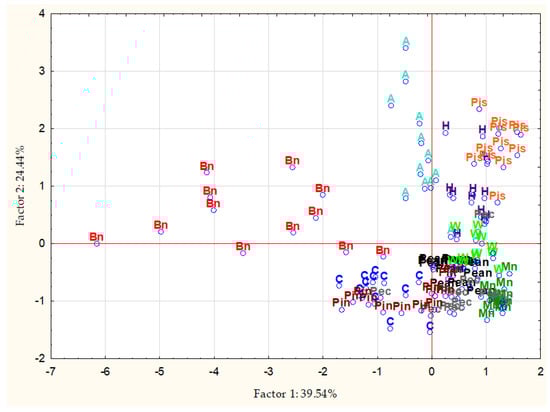
Figure 2.
Principal component analysis scatter plot for factors 1 and 2. Abbreviations: A—almonds, Bn—Brazil nuts, C—cashews, H—hazelnuts, Mn—macadamia nuts, Pean—peanuts, Pec—pecans, Pin—pine nuts, Pis—pistachio nuts, W—walnuts.
The last analysis performed was the DA. In the case of examining the content of 5 elements in 10 types of nuts, the discrimination was highly significant (Wilks’ Lambda: 0.004, F = 29.995, p < 0.0001).
All variables were highly significant and were classified into the model. All discriminant functions were significant. The first function was responsible for 41% of the explained variance, two factors explained 71% of the total variance, three factors explained 92% of the total variance, and four factors explained 99% of the total variance. The mean values of the canonical variables enabled determination of which types of nuts were best distinguished by each of the functions: function 1 distinguishes mainly Brazil nuts, function 2 distinguishes Brazil nuts, function 3 distinguishes macadamia nuts, function 4 distinguishes Brazil nuts and pistachio nuts, and function 5 distinguishes pecans, as shown in Figure 3.
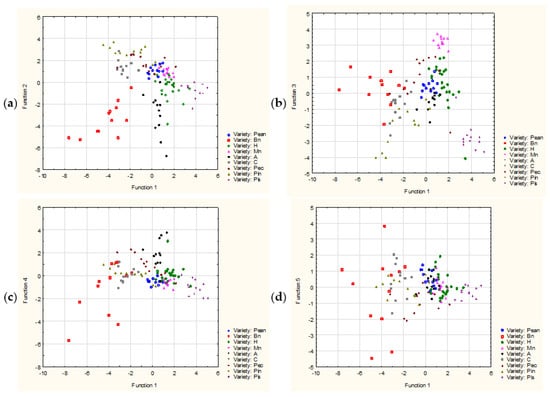
Figure 3.
Discriminant analysis scatter plots for factors 1 and 2 (a), 1 and 3 (b), 1 and 4 (c), and 1 and 5 (d). Abbreviations: A—almonds, Bn—Brazil nuts, C—cashews, H—hazelnuts, Mn—macadamia nuts, Pean—peanuts, Pec—pecans, Pin—pine nuts, Pis—pistachio nuts, W—walnuts.
4. Discussion
The elements investigated this study are necessary for the proper growth and functioning of the human body. Unfortunately, their dietary intake is often insufficient, which is a global problem.
Janowska-Miasik [17] reported that Ca and Mg intake is below the recommended intake among the adult population of Poland. Additionally, according to our previous research, 28% of elderly subjects presented with Zn deficiency [18]. Globally, it is estimated that 17.3% of the population has inadequate Zn intake, with the highest proportions in Africa (23.9%) and Asia (19.4%). Pregnant females and their young children are the highest-risk groups for Zn deficiency [19]. Se deficiency affects between 500 million and 1 billion people worldwide due to inadequate dietary intake. The average intake of Se in Eastern Europe is lower than that in Western Europe [20,21]. Therefore, supplementing the diet with these ingredients seems to be necessary. However, nutrients from supplements may exhibit different physiological responses and absorption compared to nutrients found in food [19].
Currently, natural sources of nutritional ingredients are highly valued and recommended. Our research confirms the viability of nuts as a source of bioavailable minerals.
Most authors express the content of elements as an average content; therefore, in the following discussion, we refer to the average content values obtained in our study. Table 5 shows a comparison of our results with literature values.
Table 5.
The content of selected minerals in nuts in comparison to literature values.
Almonds are distinguished from other nuts with the highest average Ca content (3099.1 ± 1210.4 mg/kg). Other authors reported mean values ranging from 1491 to 3450 mg/kg. In the case of Mg, the values reported by most authors were twofold lower (2360–2650 mg/kg) than those obtained in the present study (5424 mg/kg), Moodley et al. [22], who reported similar values. The Zn contents obtained in the present study were similar to those reported by other researchers. Based on our study results, it can be concluded that the investigated nuts are a source of Ca, K, Mg, and Zn and can be labelled as functional products that can be used to effectively supplement the diet with these elements. Studies have shown, among other things, that due to the content of these elements, almonds have a significant effect in terms of improving not only lipid metabolism but also carbohydrate-insulin metabolism [23,24,25,26,27,28,29]. In patients with type 2 diabetes mellitus (T2DM), consumption of these nuts in the form of a snack (43 g serving) reduced postprandial blood glucose levels and increased the feeling of fullness without weight gain [27]. In patients treated with statins, the daily consumption of 100 g of almonds for four weeks did not affect body weight but improved high-density lipoprotein (HDL-c) levels and, by improving the parameters of lipoproteins, reduced the risk of cardiovascular diseases (CVD) [30]. Li et al. conducted a study including people with T2DM and reported that consumption of 60 g of almonds per day for four weeks reduced serum insulin concentration by 4.1% and the HOMA-IR index of insulin resistance by 9.2% compared to the control group. Moreover, the authors reported a reduction in total cholesterol (TC) and low-density lipoprotein (LDL-c) [26]. In people with coronary artery disease, consumption of 10 g per day for 12 weeks increased HDL-c and decreased TC, LDL-c, and triglycerides (TG) [31].
In Brazil nuts, other authors significantly lower contents of all analyzed elements than those reported in the present study. Furthermore, these nuts were identified by us as an excellent source of Se, K, Mg, and Zn in the diet. The addition of one item to the diet may have a positive effect on increasing the level of Se and the activity of glutathione peroxidase (GPx) [32,33]. This was observed in obese women and was not affected by the genotype associated with the Pro198Leu polymorphism [32]. Huguenin et al. reported a decrease in oxidative stress, the level of oxidized-LDL, and blood pressure (BP) and an increase in the activity of GPx in the blood in patients with hypertension and dyslipidemia who consumed 13 g per day for 12 weeks [33].
However, it should be emphasized that Se is an element with a narrow safety margin. Consumption of approximately 12 g of Brazil nuts (about 3 pieces) is sufficient to meet 100% of RDA. Therefore, long-term consumption of large quantities of these nuts, which are characterized by a high Se content, may result in a health-hazardous increase in serum Se levels [34].
In our study, cashews were characterized by a higher content of Zn, K, and Mg compared to the values reported in studies by other authors. These nuts had a higher content of Zn and Mg compared to data obtained by other authors and may be a rich source of these elements. Consumption of cashews for 28 days corresponding to 11% of the daily energy requirement (28–64 g/day) in patients with mild hypercholesterolemic disorders improved of lipid metabolism, i.e., TC and LDL-c were reduced [35]. A meta-analysis of three studies by Jalali et al. showed that the consumption of 30–42 g per day significantly reduced systolic BP but did not affect the lipid metabolism or diastolic BP in any of the studied groups (healthy adults and people with metabolic syndrome (MetS) and T2DM) [36].
Hazelnuts can be successfully used for the prevention of Mg deficiency. The contents of Mg and K reported in the present study were 2-fold and 1.5-fold higher than the values reported by other authors, respectively. In a 12-week study by Tey et al., no significant effect of hazelnut consumption on inflammatory markers and cell adhesion molecules was reported in overweight and obese people, regardless of the dose (30 and 60 g/day). However, their consumption improved the quality of the diet, although no adverse changes in body composition were observed. Consumption of 30 g per day of nuts is possible without losing the ‘desire to consume’ and ‘overall liking’ compared to a dose of 60 g/day [37].
In addition to Brazil nuts and cashews, macadamia and pistachio nuts proved to be a good source of Se. Garg et al. showed that monthly consumption of macadamia nuts in the amount of 15% of the daily energy requirement (40–90 g/day) in men with hypercholesterolemia favorably changed the biomarkers of oxidative stress, thrombosis, and inflammation, as well as risk factors for coronary heart disease, but also resulted in a reduction in TC and LDL-c and an increase in HDL-c [38,39].
Peanuts, as well as hazelnuts, can also be classified as functional products with the capacity to supplement the diet with Mg and K. Introducing peanuts, especially with high olein content, into a 4-week low-energy diet improved anthropometric parameters (body mass index (BMI), waist-to-hip ratio, and body fat tissue) of overweight adult men [40]. High-olein peanuts, in particular, increased diet-induced thermogenesis in overweight and obese men, purportedly by increasing the expression of disjoint protein (UCP) genes, in addition to reducing hunger through energy intake and increasing satiety [41]. Reis et al. conducted a study that investigated the glycemic response to peanut consumption in young people with normal BMI. Consumption of 63 g/day led to a reduction in carbohydrate consumption and postprandial glycemia [42]. Including them in the diet will not only improve the quality of the diet but also the feeling of fullness and increase thermogenesis [40,43,44].
Despite obtaining lower values in terms of Mg and Zn content in pecans compared to literature data, they have been shown to be a source of these components. Morgan and Clayshulte conducted a study on persons without lipid disorders. Subjects were randomly assigned to a test group that consumed 68 g of pecans per day for 8 weeks or to a control group that did not eat any nuts. In the pecan group, after 8 weeks, a decrease in LDL-c was demonstrated (from 2.61 ± 0.5 to 2.46 ± 0.6 mmol/L; p < 0.05). Moreover, the levels of TC and HDL-c in the study group was significantly lower than those in the control group (4.22 ± 0.8 vs. 5.02 ± 0.5 mmol/L; 1.37 ± 0.2 vs. 1.47 ± 0.3 mmol/L, p < 0.05), respectively) [45]. Rajaram et al. proved that, inter alia, introducing pecan nuts (72 g) to the diet for 4 weeks reduced TC and LDL-c by 0.32 mmol/L and TG by 0.14 mmol/L, in addition to increasing the concentration of HDL-c by 0.06 mmol/L [46].
The novelty of our study is the inclusion of pine nuts in the analysis, which have been investigated in only a few studies to date. Our research revealed that they can be a good source of Mg, K, and Zn. Lee et al. tested the effect of a dietary enrichment of 30 g/day of a mixture of nuts (walnuts, peanuts, and pine nuts) on metabolic markers in people with MetS and BMI of at least 23 kg/m2 for 6 weeks. Among women, TC and nonHDL-c levels improved in the nut group compared to the control group not consuming this product [47]. Using the semi-quantitative food frequency questionnaire, Jung et al. assessed the total consumption of nuts (peanuts, almonds, and pine nuts). They showed that an intake of 15 g/week was inversely related to the risk of MetS in the general Korean population [48].
In the case of pistachio nuts, our results were similar to the values obtained by other authors. Pistachios can be used for dietary supplementation of K, Mg, and Se. Kasliwal et al. conducted a study in which 40 g of pistachios was administered daily to patients with mild changes in lipid metabolism for three months. A reduction in the level of morning fasting glucose and LDL-c concentration was observed, as well as an increase in HDL-c and an improvement in blood vessel stiffness and endothelial function [49]. In healthy people using pistachios in the amount of 42 and 84 g/day for three weeks, LDL-c was reduced [50]. In a study by Hernández-Alonso et al., people with prediabetes ate 57 g of pistachios per day for eight weeks, which resulted in improved insulin sensitivity and decreased expression of several genes (fibrinogen, platelet factor 4, oxidized LDL-c, Interleukin-6 mRNA, and resistin) [51]. A study with two snacks (25 g) was also conducted on diabetic patients. This amount was enough to result in significant changes from the point of view of the disease, i.e., a decrease in glycosylated hemoglobin (HbA1c), blood glucose levels, systolic BP, BMI, and highly sensitive C-reactive protein (hs-CRP) [52]. Another study that also investigated diabetic patients revealed that a 4-week diet with 20% of daily energy from pistachios (from 59 to 128 g) reduced TC, TG, and fructosamine compared to the control diet [53]. The diet with these nuts also showed a beneficial effect in terms of reducing WC, LDL-c, hs-CRP, TNF-alpha, and thiobarbituric acid reactive substances (TBARS), in addition to increasing the concentration of adiponectin in people with MetS [54].
Walnuts, as well as peanuts and hazelnuts, can be labelled as functional products with the capacity to enrich the diet with Mg. In one study, consuming 56 g of walnuts per day for eight weeks improved endothelial function in overweight and visceral obese adults. These results were compared with a control group that consumed an ad libitum diet without nuts. The patients did not increase their body weight and even experienced a reduction in their waist circumference (WC) [55]. Ma et al. included walnuts in the diet of subjects accounting 12% of total daily energy consumption for 12 months. Although the patients did not change their eating habits, their plasma lipid profile changed (the concentrations of TC, TG, an LDL-c were reduced) [56]. Spaccarotella et al. reported that in men at risk of prostate cancer, the introduction of 75 g of walnuts per day into the diet improved their biomarkers (decrease in alpha and gamma–tocopherol ratio, increase in gamma–tocopherol and prostate-specific free antigen-PSA) and the vascular health of blood vessels [57]. The effect of walnuts on lipid peroxidation and the function of the endothelium is due to the active substances contained in them, such as α-linolenic acid and alpha-tocopherol [55,56,58,59,60].
Chemometric analyses of nuts described in the literature are primarily related to data on the chromatographic fingerprint [61], interpretation of results obtained by Raman spectroscopy [62] or Fourier transform infrared spectroscopy [63], or a combination of chemometric and metabolomic techniques [64].
This kind of data analysis, especially PCA, can be useful in determining and assessing the relationship between the contents of elements in nuts. In our study, four factors explained 95.0% of the total variation. Kafaoğlu et al. [65] determined the content of 17 elements in nuts an grains, including Ca, Mg, Se, and Zn. In the case of PCA, the authors identified more principal components—six components accounted for a lower percentage (89.1%) of the variance than in our model.
The consumption of nuts in Poland and the relationship with other eating habits and lifestyles were assessed based on data obtained in two multicenter studies: WOBASZ, conducted in 2003–2005; and WOBASZ II, conducted in 2013–2014. Among 12,946 participants, 299 people (2.3%) reported eating nuts. The average consumption in this group was 56.0 ± 52.8 g/day. Nut eaters were distinguished by a higher index of a healthy diet, higher consumption of antioxidants and polyphenols, lower consumption of red meat, lower consumption of processed meats, and more frequent consumption of antiatherosclerotic foods compared to the control group [66].
A strength of our study is that we included almost all nuts available on the market. Secondly, we filled a gap in the literature regarding the content of minerals, especially Se, in macadamia, pecan, and pine nuts. Thirdly, for the first time, an assessment of whether a product can be labelled as a source of a particular mineral was carried out. However, our research is also subject to a limitation. We did not include coconut in the study due to the difficulty in obtaining a representative number of samples resulting from the limited availability of the product.
5. Conclusions
A comparison of the most commonly consumed types of nuts showed differences in the content of minerals. In the present study, we confirmed that the studied nuts are valuable products that can be used to supplement the diet with selected minerals and can be labelled as functional products. All analyzed types of nuts can be considered a source of Mg. Moreover, the consumption of almonds is particularly recommended for Ca, K, and Zn; Brazil nuts for Se and Zn; cashews for K, Se, and Zn; hazelnuts for K; macadamia nuts for Se; peanuts, pecans, and pine nuts for Zn; and pistachio nuts for K and Se deficiencies. Including the mentioned nuts in the diet can not only improve the quality of the diet but can also be crucial in the prevention of a multitude of diseases.
Author Contributions
Conceptualization, R.M.-Ż., A.P.-J. and K.S.; methodology, K.S. and J.S.; software, A.P.-J. and P.N.; validation, M.G. and K.S.; formal analysis, M.G. and A.P.-J.; investigation, R.M.-Ż., M.G., J.B., J.P., P.N., G.K., J.M.B. and J.S.; resources, R.M.-Ż., A.P.-J. and P.N.; data curation, R.M.-Ż. and K.S.; writing—original draft preparation, R.M.-Ż., A.P.-J. and M.G.; writing—review and editing, K.S. and P.N.; visualization, A.P.-J. and R.M.-Ż.; supervision, R.M.-Ż. and K.S.; project administration, R.M.-Ż. and K.S.; funding acquisition, R.M.-Ż. and K.S. All authors have read and agreed to the published version of the manuscript.
Funding
This research was funded by the Medical University of Białystok (SUB/2/DN/21/004/2216).
Data Availability Statement
The data supporting the reported results are available from the corresponding author upon reasonable request.
Conflicts of Interest
The authors declare no conflict of interest.
References
- Mohammed, S.G.; Qoronfleh, M.W. Nuts. Adv. Neurobiol. 2020, 24, 395–419. [Google Scholar] [CrossRef]
- Ros, E.; Martínez-González, M.A.; Estruch, R.; Salas-Salvadó, J.; Fitó, M.; Martínez, J.A.; Corella, D. Mediterranean diet and cardiovascular health: Teachings of the PREDIMED study. Adv. Nutr. 2014, 5, 330s–336s. [Google Scholar] [CrossRef]
- Ros, E. Health Benefits of Nut Consumption. Nutrients 2010, 2, 652–682. [Google Scholar] [CrossRef]
- Maestri, E.; Imperiale, D.; Marmiroli, N. Nuts, nut products and other seeds. In Food Integrity Handbook a Guide to Food Authenticity Issues and Analytical Solutions; Lees, J.-F.M.M., Ed.; Eurofins Analytics France: Nantes, France, 2018; pp. 127–136. [Google Scholar]
- Dreher, M.L.; Maher, C.V.; Kearney, P. The traditional and emerging role of nuts in healthful diets. Nutr. Rev. 1996, 54, 241–245. [Google Scholar] [CrossRef] [PubMed]
- Fraser, G.E.; Sabaté, J.; Beeson, W.L.; Strahan, T.M. A possible protective effect of nut consumption on risk of coronary heart disease. The Adventist Health Study. Arch. Intern. Med. 1992, 152, 1416–1424. [Google Scholar] [CrossRef] [PubMed]
- Griel, A.E.; Kris-Etherton, P.M. Tree nuts and the lipid profile: A review of clinical studies. Br. J. Nutr. 2006, 96 (Suppl. 2), S68–S78. [Google Scholar] [CrossRef]
- Pickova, D.; Ostry, V.; Malir, F. A Recent Overview of Producers and Important Dietary Sources of Aflatoxins. Toxins 2021, 13, 186. [Google Scholar] [CrossRef] [PubMed]
- Rapid Alert System for Food and Feed Portal Database. Available online: https://webgate.ec.europa.eu/rasff-window/portal/ (accessed on 9 February 2020).
- Bielecka, J.; Puścion-Jakubik, A.; Markiewicz-Żukowska, R.; Soroczyńska, J.; Nowakowski, P.; Grabia, M.; Mielcarek, K.; Przebierowska, K.; Kotowska, K.; Socha, K. Assessment of the Safe Consumption of Nuts in Terms of the Content of Toxic Elements with Chemometric Analysis. Nutrients 2021, 13, 3606. [Google Scholar] [CrossRef]
- De Souza, R.G.M.; Schincaglia, R.M.; Pimentel, G.D.; Mota, J.F. Nuts and Human Health Outcomes: A Systematic Review. Nutrients 2017, 9, 1311. [Google Scholar] [CrossRef]
- U.S. Department of Agriculture, Agricultural Research Service. USDA National Nutrient Database for Standard Reference, Release 28. Available online: http://www.ars.usda.gov/ba/bhnrc/ndl (accessed on 20 March 2021).
- Jarosz, M.; Rychlik, E.; Stoś, K.; Charzewska, J. Nutrition Standards for the Population of Poland and Their Application. Available online: https://www.pzh.gov.pl/normy-zywienia-2020/ (accessed on 20 March 2021).
- European Commission (EC) Regulation (Ec) No 1924/2006 of The European Parliament and of the Council on Nutrition and Health Claims Made on Foods. Available online: https://eur-lex.europa.eu/legal-content/PL/TXT/?uri=CELEX%3A32006R1924 (accessed on 9 January 2021).
- European Commission (EC) on the Provision of Food Information to Consumers, Amending Regulations (EC) No 1924/2006 and (EC) No 1925/2006 of the European Parliament and of the Council, and Repealing Commission Directive 87/250/EEC, Council Directive 90/496/EEC, Commission Directive 1999/10/EC, Directive 2000/13/EC of the European Parliament and of the Council, Commission Directives 2002/67/EC and 2008/5/EC and Com-Mission Regulation (EC) No 608/2004. Available online: https://eur-lex.europa.eu/legal-content/EN/TXT/?uri=CELEX%3A32011R1169&qid=1614259348662 (accessed on 11 January 2021).
- Sorenson, A.W.; Hansen, R.G. Index of food quality. J. Nutr. Educ. 1975, 7, 53–57. [Google Scholar] [CrossRef]
- Janowska-Miasik, E.; Waśkiewicz, A.; Witkowska, A.M.; Drygas, W.; Markhus, M.W.; Zujko, M.E.; Kjellevold, M. Diet quality in the population of Norway and Poland: Differences in the availability and consumption of food considering national nutrition guidelines and food market. BMC Public Health 2021, 21, 319. [Google Scholar] [CrossRef]
- Markiewicz-Żukowska, R.; Gutowska, A.; Borawska, M.H. Serum Zinc Concentrations Correlate with Mental and Physical Status of Nursing Home Residents. PLoS ONE 2015, 10, e0117257. [Google Scholar] [CrossRef]
- Bailey, R.L.; West, K.P., Jr.; Black, R.E. The epidemiology of global micronutrient deficiencies. Ann. Nutr. Metab. 2015, 66 (Suppl. 2), 22–33. [Google Scholar] [CrossRef]
- Mistry, H.D.; Broughton Pipkin, F.; Redman, C.W.; Poston, L. Selenium in reproductive health. Am. J. Obstet. Gynecol. 2012, 206, 21–30. [Google Scholar] [CrossRef]
- Prabhu, K.S.; Lei, X.G. Selenium. Adv. Nutr. 2016, 7, 415–417. [Google Scholar] [CrossRef]
- Moodley, R.; Kindness, A.; Jonnalagadda, S.B. Elemental composition and chemical characteristics of five edible nuts (almond, Brazil, pecan, macadamia and walnut) consumed in Southern Africa. J. Environ. Sci. Health. B 2007, 42, 585–591. [Google Scholar] [CrossRef]
- Worldwide trends in body-mass index, underweight, overweight, and obesity from 1975 to 2016: A pooled analysis of 2416 population-based measurement studies in 128·9 million children, adolescents, and adults. Lancet 2017, 390, 2627–2642. [CrossRef]
- Berryman, C.E.; West, S.G.; Fleming, J.A.; Bordi, P.L.; Kris-Etherton, P.M. Effects of daily almond consumption on cardiometabolic risk and abdominal adiposity in healthy adults with elevated LDL-cholesterol: A randomized controlled trial. J. Am. Heart Assoc. 2015, 4, e000993. [Google Scholar] [CrossRef]
- Jenkins, D.J.; Kendall, C.W.; Marchie, A.; Josse, A.R.; Nguyen, T.H.; Faulkner, D.A.; Lapsley, K.G.; Blumberg, J. Almonds reduce biomarkers of lipid peroxidation in older hyperlipidemic subjects. J. Nutr. 2008, 138, 908–913. [Google Scholar] [CrossRef]
- Li, S.C.; Liu, Y.H.; Liu, J.F.; Chang, W.H.; Chen, C.M.; Chen, C.Y. Almond consumption improved glycemic control and lipid profiles in patients with type 2 diabetes mellitus. Metabolism 2011, 60, 474–479. [Google Scholar] [CrossRef]
- Tan, S.Y.; Mattes, R.D. Appetitive, dietary and health effects of almonds consumed with meals or as snacks: A randomized, controlled trial. Eur. J. Clin. Nutr. 2013, 67, 1205–1214. [Google Scholar] [CrossRef] [PubMed]
- Tinkov, A.A.; Bogdański, P.; Skrypnik, D.; Skrypnik, K.; Skalny, A.V.; Aaseth, J.; Skalnaya, M.G.; Suliburska, J. Trace Element and Mineral Levels in Serum, Hair, and Urine of Obese Women in Relation to Body Composition, Blood Pressure, Lipid Profile, and Insulin Resistance. Biomolecules 2021, 11, 689. [Google Scholar] [CrossRef] [PubMed]
- Barreca, D.; Nabavi, S.M.; Sureda, A.; Rasekhian, M.; Raciti, R.; Silva, A.S.; Annunziata, G.; Arnone, A.; Tenore, G.C.; Süntar, İ.; et al. Almonds (Prunus dulcis Mill. D. A. Webb): A Source of Nutrients and Health-Promoting Compounds. Nutrients 2020, 12, 672. [Google Scholar] [CrossRef] [PubMed]
- Ruisinger, J.F.; Gibson, C.A.; Backes, J.M.; Smith, B.K.; Sullivan, D.K.; Moriarty, P.M.; Kris-Etherton, P. Statins and almonds to lower lipoproteins (the STALL Study). J. Clin. Lipidol. 2015, 9, 58–64. [Google Scholar] [CrossRef] [PubMed]
- Jamshed, H.; Sultan, F.A.; Iqbal, R.; Gilani, A.H. Dietary Almonds Increase Serum HDL Cholesterol in Coronary Artery Disease Patients in a Randomized Controlled Trial. J. Nutr. 2015, 145, 2287–2292. [Google Scholar] [CrossRef]
- Cominetti, C.; de Bortoli, M.C.; Purgatto, E.; Ong, T.P.; Moreno, F.S.; Garrido, A.B., Jr.; Cozzolino, S.M. Associations between glutathione peroxidase-1 Pro198Leu polymorphism, selenium status, and DNA damage levels in obese women after consumption of Brazil nuts. Nutrition 2011, 27, 891–896. [Google Scholar] [CrossRef]
- Huguenin, G.V.; Oliveira, G.M.; Moreira, A.S.; Saint’Pierre, T.D.; Gonçalves, R.A.; Pinheiro-Mulder, A.R.; Teodoro, A.J.; Luiz, R.R.; Rosa, G. Improvement of antioxidant status after Brazil nut intake in hypertensive and dyslipidemic subjects. Nutr. J. 2015, 14, 54. [Google Scholar] [CrossRef]
- Rayman, M.P. Selenium and human health. Lancet 2012, 379, 1256–1268. [Google Scholar] [CrossRef]
- Mah, E.; Schulz, J.A.; Kaden, V.N.; Lawless, A.L.; Rotor, J.; Mantilla, L.B.; Liska, D.J. Cashew consumption reduces total and LDL cholesterol: A randomized, crossover, controlled-feeding trial. Am. J. Clin. Nutr. 2017, 105, 1070–1078. [Google Scholar] [CrossRef]
- Jalali, M.; Karamizadeh, M.; Ferns, G.A.; Zare, M.; Moosavian, S.P.; Akbarzadeh, M. The effects of cashew nut intake on lipid profile and blood pressure: A systematic review and meta-analysis of randomized controlled trials. Complement. Ther. Med. 2020, 50, 102387. [Google Scholar] [CrossRef]
- Tey, S.L.; Gray, A.R.; Chisholm, A.W.; Delahunty, C.M.; Brown, R.C. The dose of hazelnuts influences acceptance and diet quality but not inflammatory markers and body composition in overweight and obese individuals. J. Nutr. 2013, 143, 1254–1262. [Google Scholar] [CrossRef]
- Garg, M.L.; Blake, R.J.; Wills, R.B. Macadamia nut consumption lowers plasma total and LDL cholesterol levels in hypercholesterolemic men. J. Nutr. 2003, 133, 1060–1063. [Google Scholar] [CrossRef]
- Garg, M.L.; Blake, R.J.; Wills, R.B.; Clayton, E.H. Macadamia nut consumption modulates favourably risk factors for coronary artery disease in hypercholesterolemic subjects. Lipids 2007, 42, 583–587. [Google Scholar] [CrossRef] [PubMed]
- Alves, R.D.; Moreira, A.P.; Macedo, V.S.; de Cássia Gonçalves Alfenas, R.; Bressan, J.; Mattes, R.; Costa, N.M. Regular intake of high-oleic peanuts improves fat oxidation and body composition in overweight/obese men pursuing a energy-restricted diet. Obesity 2014, 22, 1422–1429. [Google Scholar] [CrossRef] [PubMed]
- Duarte Moreira Alves, R.; Boroni Moreira, A.P.; Silva Macedo, V.; Brunoro Costa, N.M.; Gonçalves Alfenas Rde, C.; Bressan, J. High-oleic peanuts increase diet-induced thermogenesis in overweight and obese men. Nutr. Hosp. 2014, 29, 1024–1032. [Google Scholar] [CrossRef] [PubMed]
- Reis, C.E.; Bordalo, L.A.; Rocha, A.L.; Freitas, D.M.; da Silva, M.V.; de Faria, V.C.; Martino, H.S.; Costa, N.M.; Alfenas, R.C. Ground roasted peanuts leads to a lower post-prandial glycemic response than raw peanuts. Nutr. Hosp. 2011, 26, 745–751. [Google Scholar] [CrossRef] [PubMed]
- Wien, M.; Oda, K.; Sabaté, J. A randomized controlled trial to evaluate the effect of incorporating peanuts into an American Diabetes Association meal plan on the nutrient profile of the total diet and cardiometabolic parameters of adults with type 2 diabetes. Nutr. J. 2014, 13, 10. [Google Scholar] [CrossRef]
- Reis, C.E.; Ribeiro, D.N.; Costa, N.M.; Bressan, J.; Alfenas, R.C.; Mattes, R.D. Acute and second-meal effects of peanuts on glycaemic response and appetite in obese women with high type 2 diabetes risk: A randomised cross-over clinical trial. Br. J. Nutr. 2013, 109, 2015–2023. [Google Scholar] [CrossRef] [PubMed]
- Morgan, W.A.; Clayshulte, B.J. Pecans Lower Low Density Lipoprotein Cholesterol in People with Normal Lipid Levels. J. Am. Diet. Assoc. 2000, 100, 312–318. [Google Scholar] [CrossRef]
- Rajaram, S.; Burke, K.; Connell, B.; Myint, T.; Sabaté, J. A monounsaturated fatty acid-rich pecan-enriched diet favorably alters the serum lipid profile of healthy men and women. J. Nutr. 2001, 131, 2275–2279. [Google Scholar] [CrossRef]
- Lee, Y.J.; Nam, G.E.; Seo, J.A.; Yoon, T.; Seo, I.; Lee, J.H.; Im, D.; Bahn, K.-N.; Jeong, S.A.; Kang, T.S.; et al. Nut consumption has favorable effects on lipid profiles of Korean women with metabolic syndrome. Nutr. Res. 2014, 34, 814–820. [Google Scholar] [CrossRef]
- Jung, J.Y.; Park, S.K.; Oh, C.M.; Choi, J.M.; Ryoo, J.H.; Kim, J.; Kim, M.K. The association between metabolic syndrome and peanuts, pine nuts, almonds consumption: The Ansan and Ansung Study. Endocrine 2019, 65, 270–277. [Google Scholar] [CrossRef]
- Kasliwal, R.R.; Bansal, M.; Mehrotra, R.; Yeptho, K.P.; Trehan, N. Effect of pistachio nut consumption on endothelial function and arterial stiffness. Nutrition 2015, 31, 678–685. [Google Scholar] [CrossRef] [PubMed]
- Baer, D.J.; Gebauer, S.K.; Novotny, J.A. Measured energy value of pistachios in the human diet. Br. J. Nutr. 2012, 107, 120–125. [Google Scholar] [CrossRef] [PubMed]
- Hernández-Alonso, P.; Salas-Salvadó, J.; Baldrich-Mora, M.; Juanola-Falgarona, M.; Bulló, M. Beneficial effect of pistachio consumption on glucose metabolism, insulin resistance, inflammation, and related metabolic risk markers: A randomized clinical trial. Diabetes Care 2014, 37, 3098–3105. [Google Scholar] [CrossRef] [PubMed]
- Parham, M.; Heidari, S.; Khorramirad, A.; Hozoori, M.; Hosseinzadeh, F.; Bakhtyari, L.; Vafaeimanesh, J. Effects of pistachio nut supplementation on blood glucose in patients with type 2 diabetes: A randomized crossover trial. Rev. Diabet. Stud. 2014, 11, 190–196. [Google Scholar] [CrossRef] [PubMed]
- Sauder, K.A.; McCrea, C.E.; Ulbrecht, J.S.; Kris-Etherton, P.M.; West, S.G. Pistachio nut consumption modifies systemic hemodynamics, increases heart rate variability, and reduces ambulatory blood pressure in well-controlled type 2 diabetes: A randomized trial. J. Am. Heart Assoc. 2014, 3, e000873. [Google Scholar] [CrossRef]
- Gulati, S.; Misra, A.; Pandey, R.M.; Bhatt, S.P.; Saluja, S. Effects of pistachio nuts on body composition, metabolic, inflammatory and oxidative stress parameters in Asian Indians with metabolic syndrome: A 24-wk, randomized control trial. Nutrition 2014, 30, 192–197. [Google Scholar] [CrossRef]
- Katz, D.L.; Davidhi, A.; Ma, Y.; Kavak, Y.; Bifulco, L.; Njike, V.Y. Effects of walnuts on endothelial function in overweight adults with visceral obesity: A randomized, controlled, crossover trial. J. Am. Coll. Nutr. 2012, 31, 415–423. [Google Scholar] [CrossRef] [PubMed]
- Ma, Y.; Njike, V.Y.; Millet, J.; Dutta, S.; Doughty, K.; Treu, J.A.; Katz, D.L. Effects of walnut consumption on endothelial function in type 2 diabetic subjects: A randomized controlled crossover trial. Diabetes Care 2010, 33, 227–232. [Google Scholar] [CrossRef]
- Spaccarotella, K.J.; Kris-Etherton, P.M.; Stone, W.L.; Bagshaw, D.M.; Fishell, V.K.; West, S.G.; Lawrence, F.R.; Hartman, T.J. The effect of walnut intake on factors related to prostate and vascular health in older men. Nutr. J. 2008, 7, 13. [Google Scholar] [CrossRef]
- Souza, R.G.; Gomes, A.C.; Naves, M.M.; Mota, J.F. Nuts and legume seeds for cardiovascular risk reduction: Scientific evidence and mechanisms of action. Nutr. Rev. 2015, 73, 335–347. [Google Scholar] [CrossRef]
- Kranz, S.; Hill, A.M.; Fleming, J.A.; Hartman, T.J.; West, S.G.; Kris-Etherton, P.M. Nutrient displacement associated with walnut supplementation in men. J. Hum. Nutr. Diet. 2014, 27 (Suppl. 2), 247–254. [Google Scholar] [CrossRef] [PubMed]
- Torabian, S.; Haddad, E.; Rajaram, S.; Banta, J.; Sabaté, J. Acute effect of nut consumption on plasma total polyphenols, antioxidant capacity and lipid peroxidation. J. Hum. Nutr. Diet. 2009, 22, 64–71. [Google Scholar] [CrossRef]
- Campmajó, G.; Navarro, G.J.; Núñez, N.; Puignou, L.; Saurina, J.; Núñez, O. Non-Targeted HPLC-UV Fingerprinting as Chemical Descriptors for the Classification and Authentication of Nuts by Multivariate Chemometric Methods. Sensors 2019, 19, 1388. [Google Scholar] [CrossRef] [PubMed]
- Taylan, O.; Cebi, N.; Yilmaz, M.T.; Sagdic, O.; Ozdemir, D.; Balubaid, M. Rapid detection of green-pea adulteration in pistachio nuts using Raman spectroscopy and chemometrics. J. Sci. Food Agric. 2021, 101, 1699–1708. [Google Scholar] [CrossRef]
- Valasi, L.; Georgiadou, M.; Tarantilis, P.A.; Yanniotis, S.; Pappas, C.S. Rapid screening on aflatoxins’ presence in Pistachia vera nuts using diffuse reflectance infrared Fourier transform spectroscopy and chemometrics. J. Food Sci. Technol. 2021, 58, 356–365. [Google Scholar] [CrossRef] [PubMed]
- Kalogiouri, N.P.; Manousi, N.; Klaoudatos, D.; Spanos, T.; Topi, V.; Zachariadis, G.A. Rare Earths as Authenticity Markers for the Discrimination of Greek and Turkish Pistachios Using Elemental Metabolomics and Chemometrics. Foods 2021, 10, 349. [Google Scholar] [CrossRef] [PubMed]
- Kafaoğlu, B.; Fisher, A.; Hill, S.; Kara, D. Chemometric evaluation of trace metal concentrations in some nuts and seeds. Food Addit. Contam. Part A Chem. Anal. Control. Expo. Risk Assess. 2014, 31, 1529–1538. [Google Scholar] [CrossRef]
- Witkowska, A.M.; Waśkiewicz, A.; Zujko, M.E.; Szcześniewska, D.; Śmigielski, W.; Stepaniak, U.; Pająk, A.; Drygas, W. The Consumption of Nuts is Associated with Better Dietary and Lifestyle Patterns in Polish Adults: Results of WOBASZ and WOBASZ II Surveys. Nutrients 2019, 11, 1410. [Google Scholar] [CrossRef]
- Tošić, S.B.; Mitić, S.S.; Velimirović, D.S.; Stojanović, G.S.; Pavlović, A.N.; Pecev-Marinković, E.T. Elemental composition of edible nuts: Fast optimization and validation procedure of an ICP-OES method. J. Sci. Food Agric. 2015, 95, 2271–2278. [Google Scholar] [CrossRef] [PubMed]
- Amorello, D.; Orecchio, S.; Pace, A.; Barreca, S. Discrimination of almonds (Prunus dulcis) geographical origin by minerals and fatty acids profiling. Nat. Prod. Res. 2016, 30, 2107–2110. [Google Scholar] [CrossRef]
- Bai, S.H.; Brooks, P.; Gama, R.; Nevenimo, T.; Hannet, G.; Hannet, D.; Randall, B.; Walton, D.; Grant, E.; Wallace, H.M. Nutritional quality of almond, canarium, cashew and pistachio and their oil photooxidative stability. J. Food Sci. Technol. 2019, 56, 792–798. [Google Scholar] [CrossRef] [PubMed]
- Ros, E.; Singh, A.; O’Keefe, J.H. Nuts: Natural Pleiotropic Nutraceuticals. Nutrients 2021, 13, 3269. [Google Scholar] [CrossRef] [PubMed]
- Drogoudi, P.D.; Pantelidis, G.; Bacchetta, L.; De Giorgio, D.; Duval, H.; Metzidakis, I.; Spera, D. Protein and mineral nutrient contents in kernels from 72 sweet almond cultivars and accessions grown in France, Greece and Italy. Int. J. Food Sci. Nutr. 2013, 64, 202–209. [Google Scholar] [CrossRef]
- Łoźna, K.; Styczyńska, M.; Hyla, J.; Bienkiewicz, M.; Figurska-Ciura, D.; Biernat, J.; Bronkowska, M. Mineral composition of tree nuts and seeds. J. Elem. 2020, 25, 745–756. [Google Scholar] [CrossRef]
- Suliburska, J.; Krejpcio, Z. Evaluation of the content and bioaccessibility of iron, zinc, calcium and magnesium from groats, rice, leguminous grains and nuts. J. Food Sci. Technol. 2014, 51, 589–594. [Google Scholar] [CrossRef]
- Cardoso, B.R.; Duarte, G.B.S.; Reis, B.Z.; Cozzolino, S.M.F. Brazil nuts: Nutritional composition, health benefits and safety aspects. Food Res. Int. 2017, 100, 9–18. [Google Scholar] [CrossRef]
- U.S. Department of Agriculture. USDA National Nutrient Database for Standard Reference; US Department of Agriculture: Washington, DC, USA, 2016. [Google Scholar]
- Liu, B.; Liang, J.; Zhao, D.; Wang, K.; Jia, M.; Wang, J. Morphological and Compositional Analysis of Two Walnut (Juglans regia L.) Cultivars Growing in China. Plant Foods Hum. Nutr. 2020, 75, 116–123. [Google Scholar] [CrossRef]
- Juranović Cindrić, I.; Zeiner, M.; Hlebec, D. Mineral Composition of Elements in Walnuts and Walnut Oils. Int. J. Environ. Res. Public Health 2018, 15, 2674. [Google Scholar] [CrossRef]
- Lima, L.W.; Stonehouse, G.C.; Walters, C.; Mehdawi, A.F.E.; Fakra, S.C.; Pilon-Smits, E.A.H. Selenium Accumulation, Speciation and Localization in Brazil Nuts (Bertholletia excelsa H.B.K.). Plants 2019, 8, 289. [Google Scholar] [CrossRef] [PubMed]
- Yin, L.L.; Tian, Q.; Shao, X.Z.; Kong, X.Y.; Ji, Y.Q. Determination of Trace Elements in Edible Nuts in the Beijing Market by ICP-M. Biomed. Environ. Sci. 2015, 28, 449–454. [Google Scholar] [CrossRef] [PubMed]
- Silva Junior, E.C.; Wadt, L.H.O.; Silva, K.E.; Lima, R.M.B.; Batista, K.D.; Guedes, M.C.; Carvalho, G.S.; Carvalho, T.S.; Reis, A.R.; Lopes, G.; et al. Natural variation of selenium in Brazil nuts and soils from the Amazon region. Chemosphere 2017, 188, 650–658. [Google Scholar] [CrossRef] [PubMed]
- Harangozo, Ľ.; Šnirc, M.; Árvay, J.; Jakabová, S.; Čéryová, S. Biogenic and Risk Elements in Walnuts (Juglans regia L.) from Chosen Localities of Slovakia. Biol. Trace. Elem. Res. 2021, 199, 2047–2056. [Google Scholar] [CrossRef] [PubMed]
Publisher’s Note: MDPI stays neutral with regard to jurisdictional claims in published maps and institutional affiliations. |
© 2022 by the authors. Licensee MDPI, Basel, Switzerland. This article is an open access article distributed under the terms and conditions of the Creative Commons Attribution (CC BY) license (https://creativecommons.org/licenses/by/4.0/).