
Impact of Enzymatic Hydrolysis and Microfluidization on the Techno-Functionality of Oat Bran in Suspension and Acid Milk Gel Models


Abstract
:1. Introduction
2. Materials and Methods
2.1. Raw Material and Enzyme
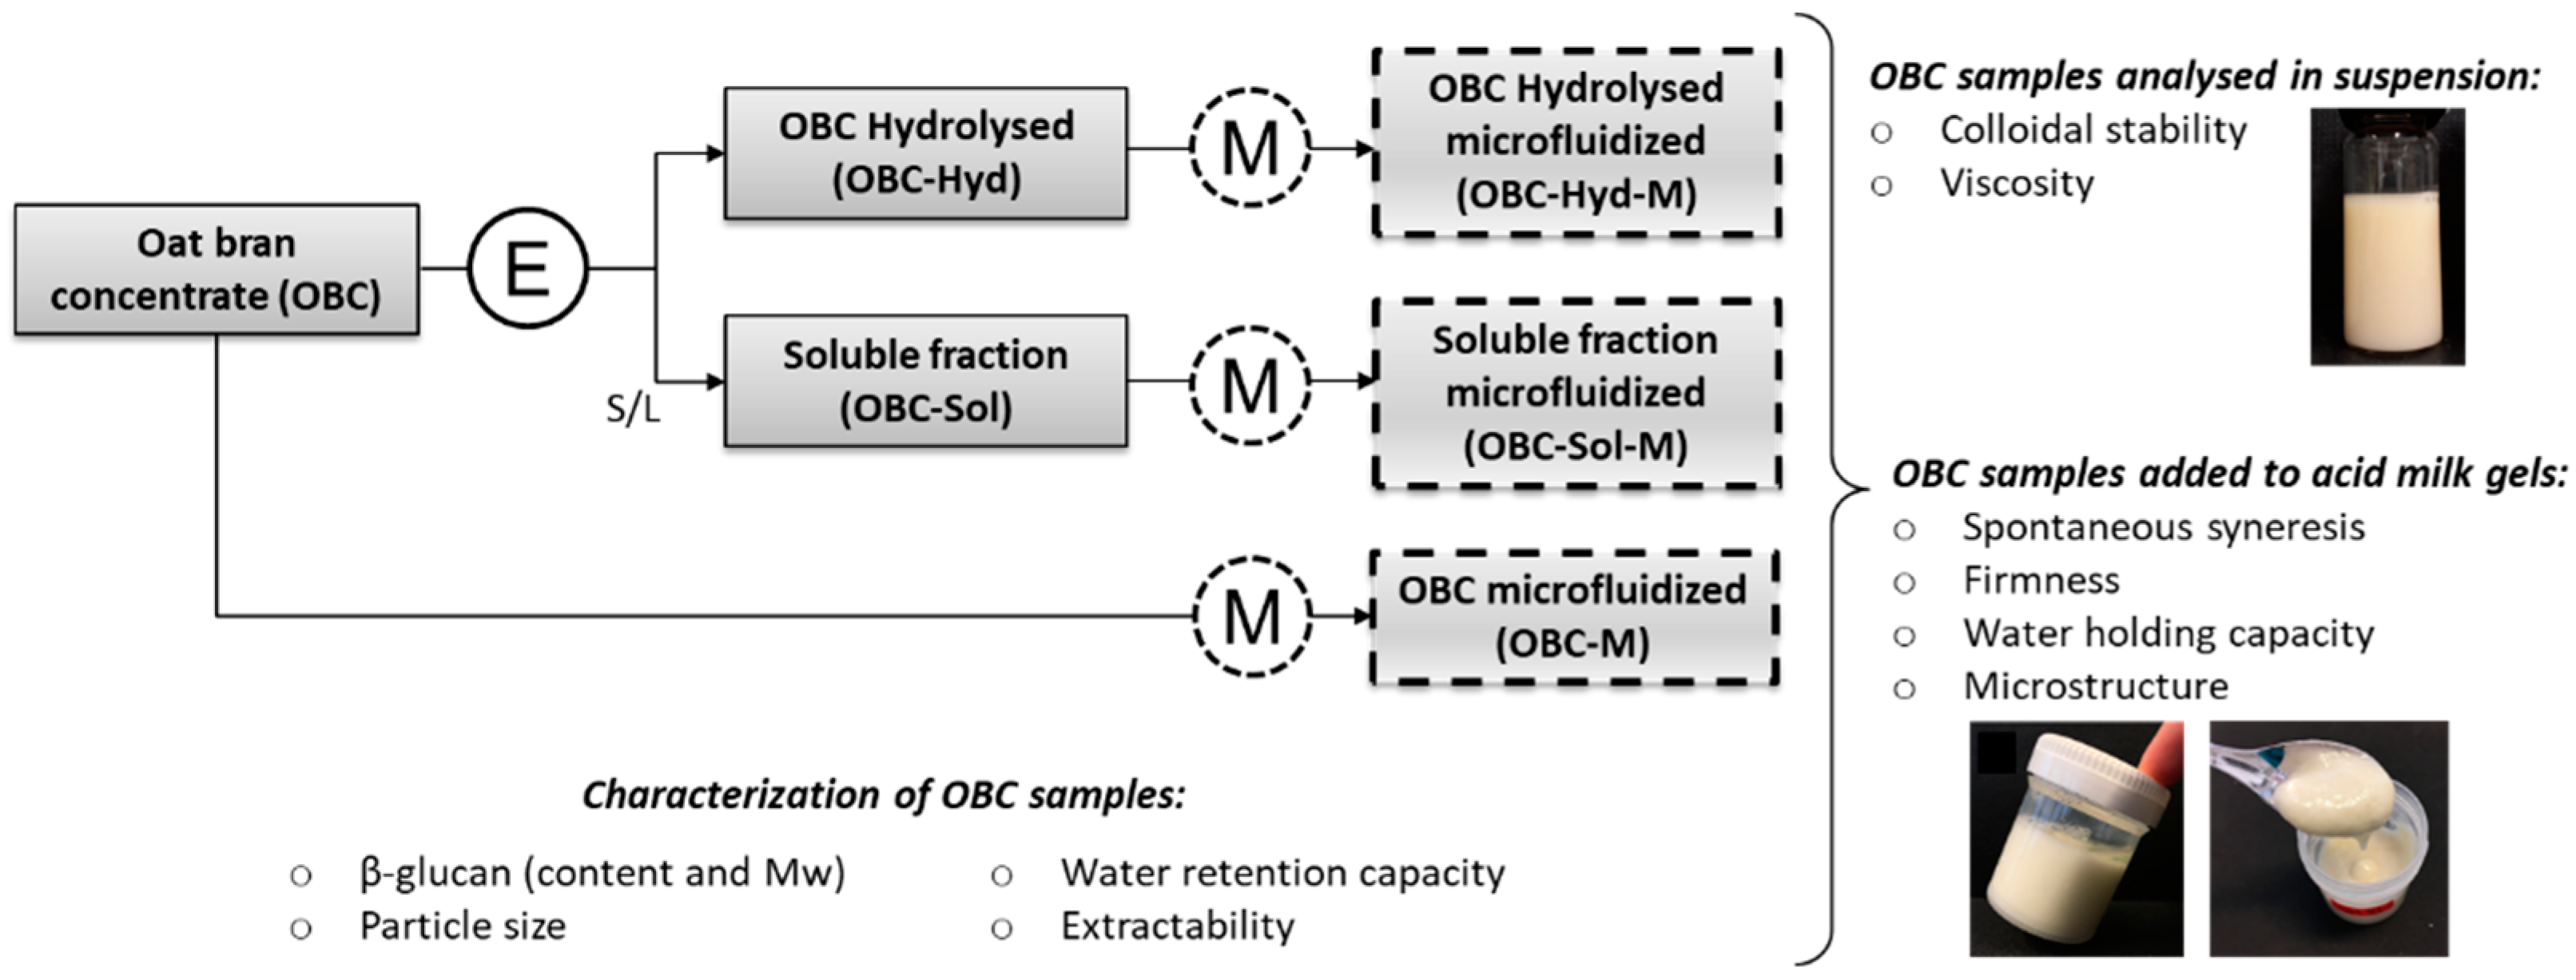
2.2. Study Design
2.3. Enzymatic Treatment and Microfluidization
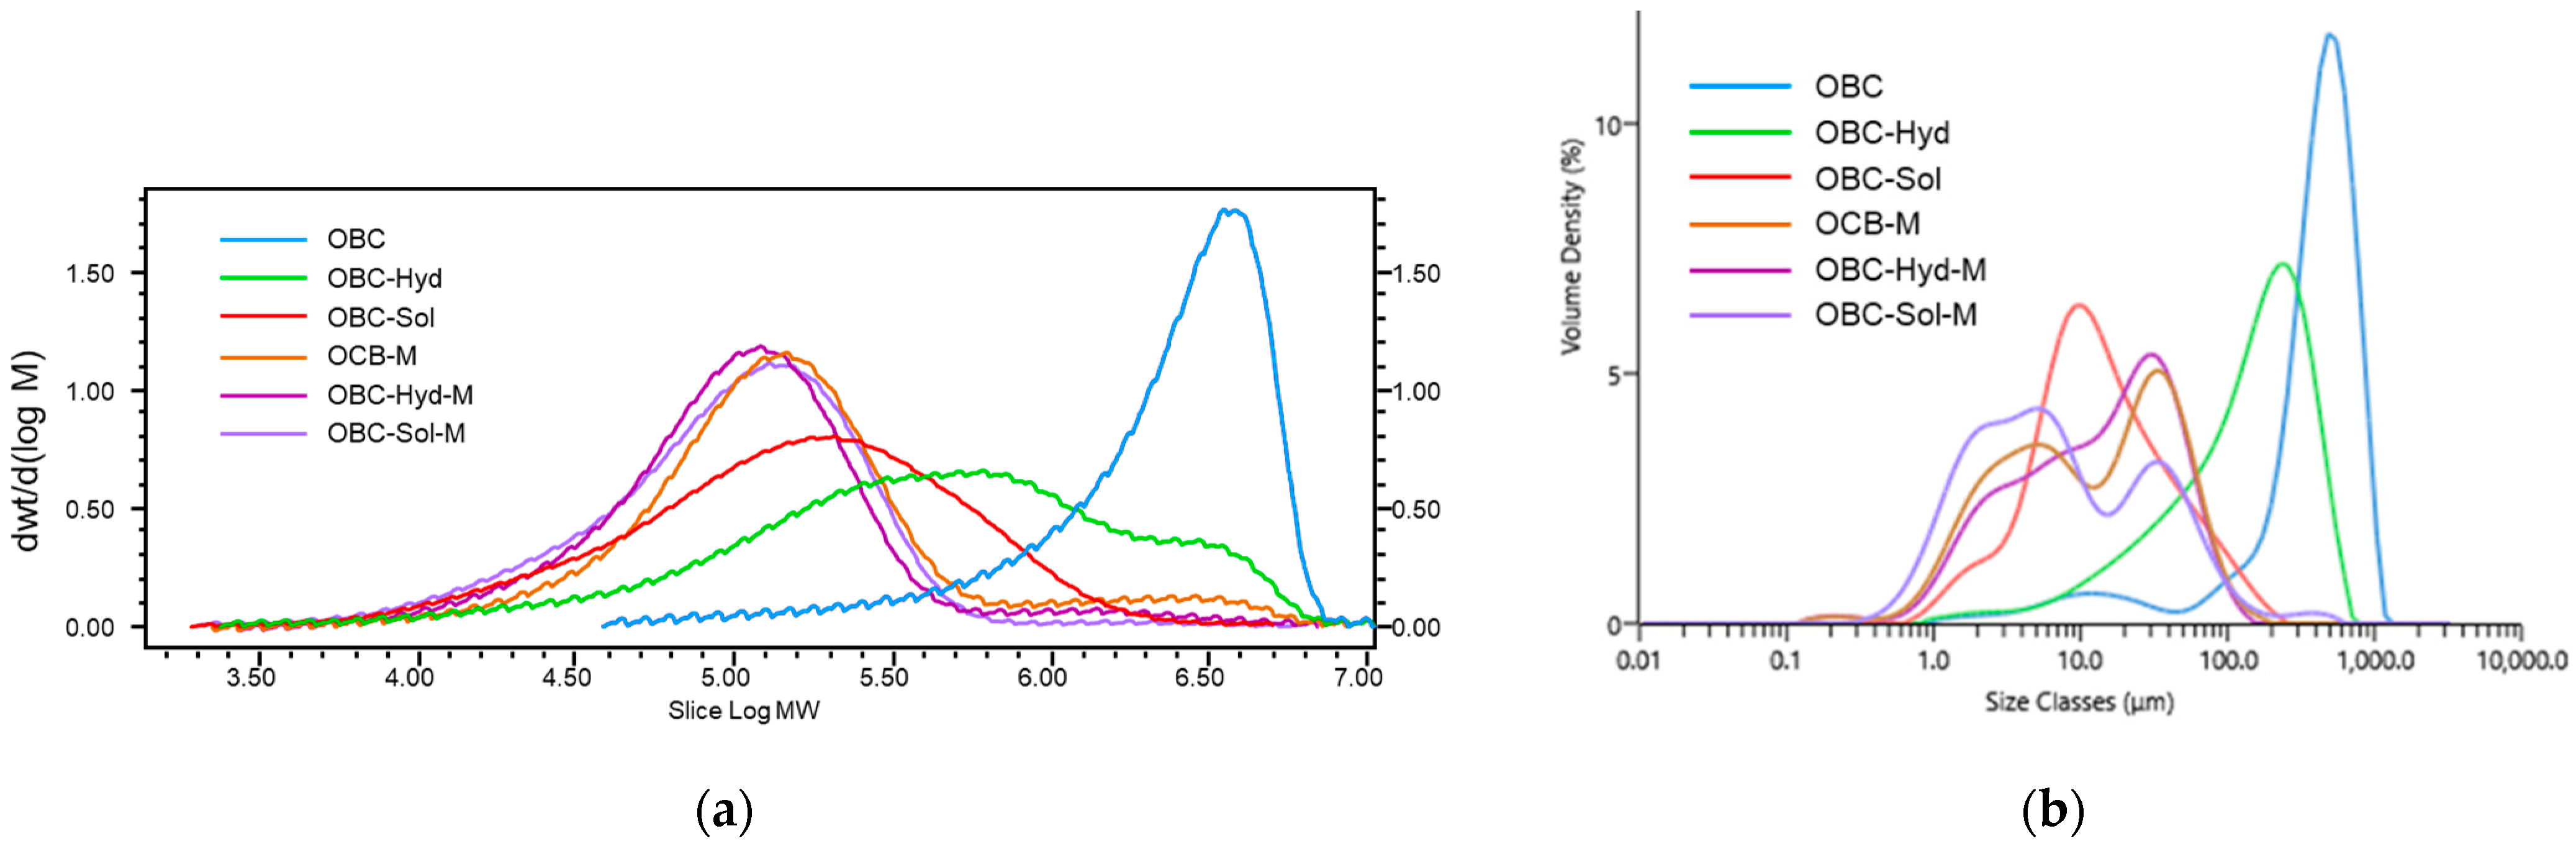
2.4. β-Glucan Molecular Weight (Mw) Distribution
2.5. Preparation of the OBC Suspensions
2.6. Particle Size
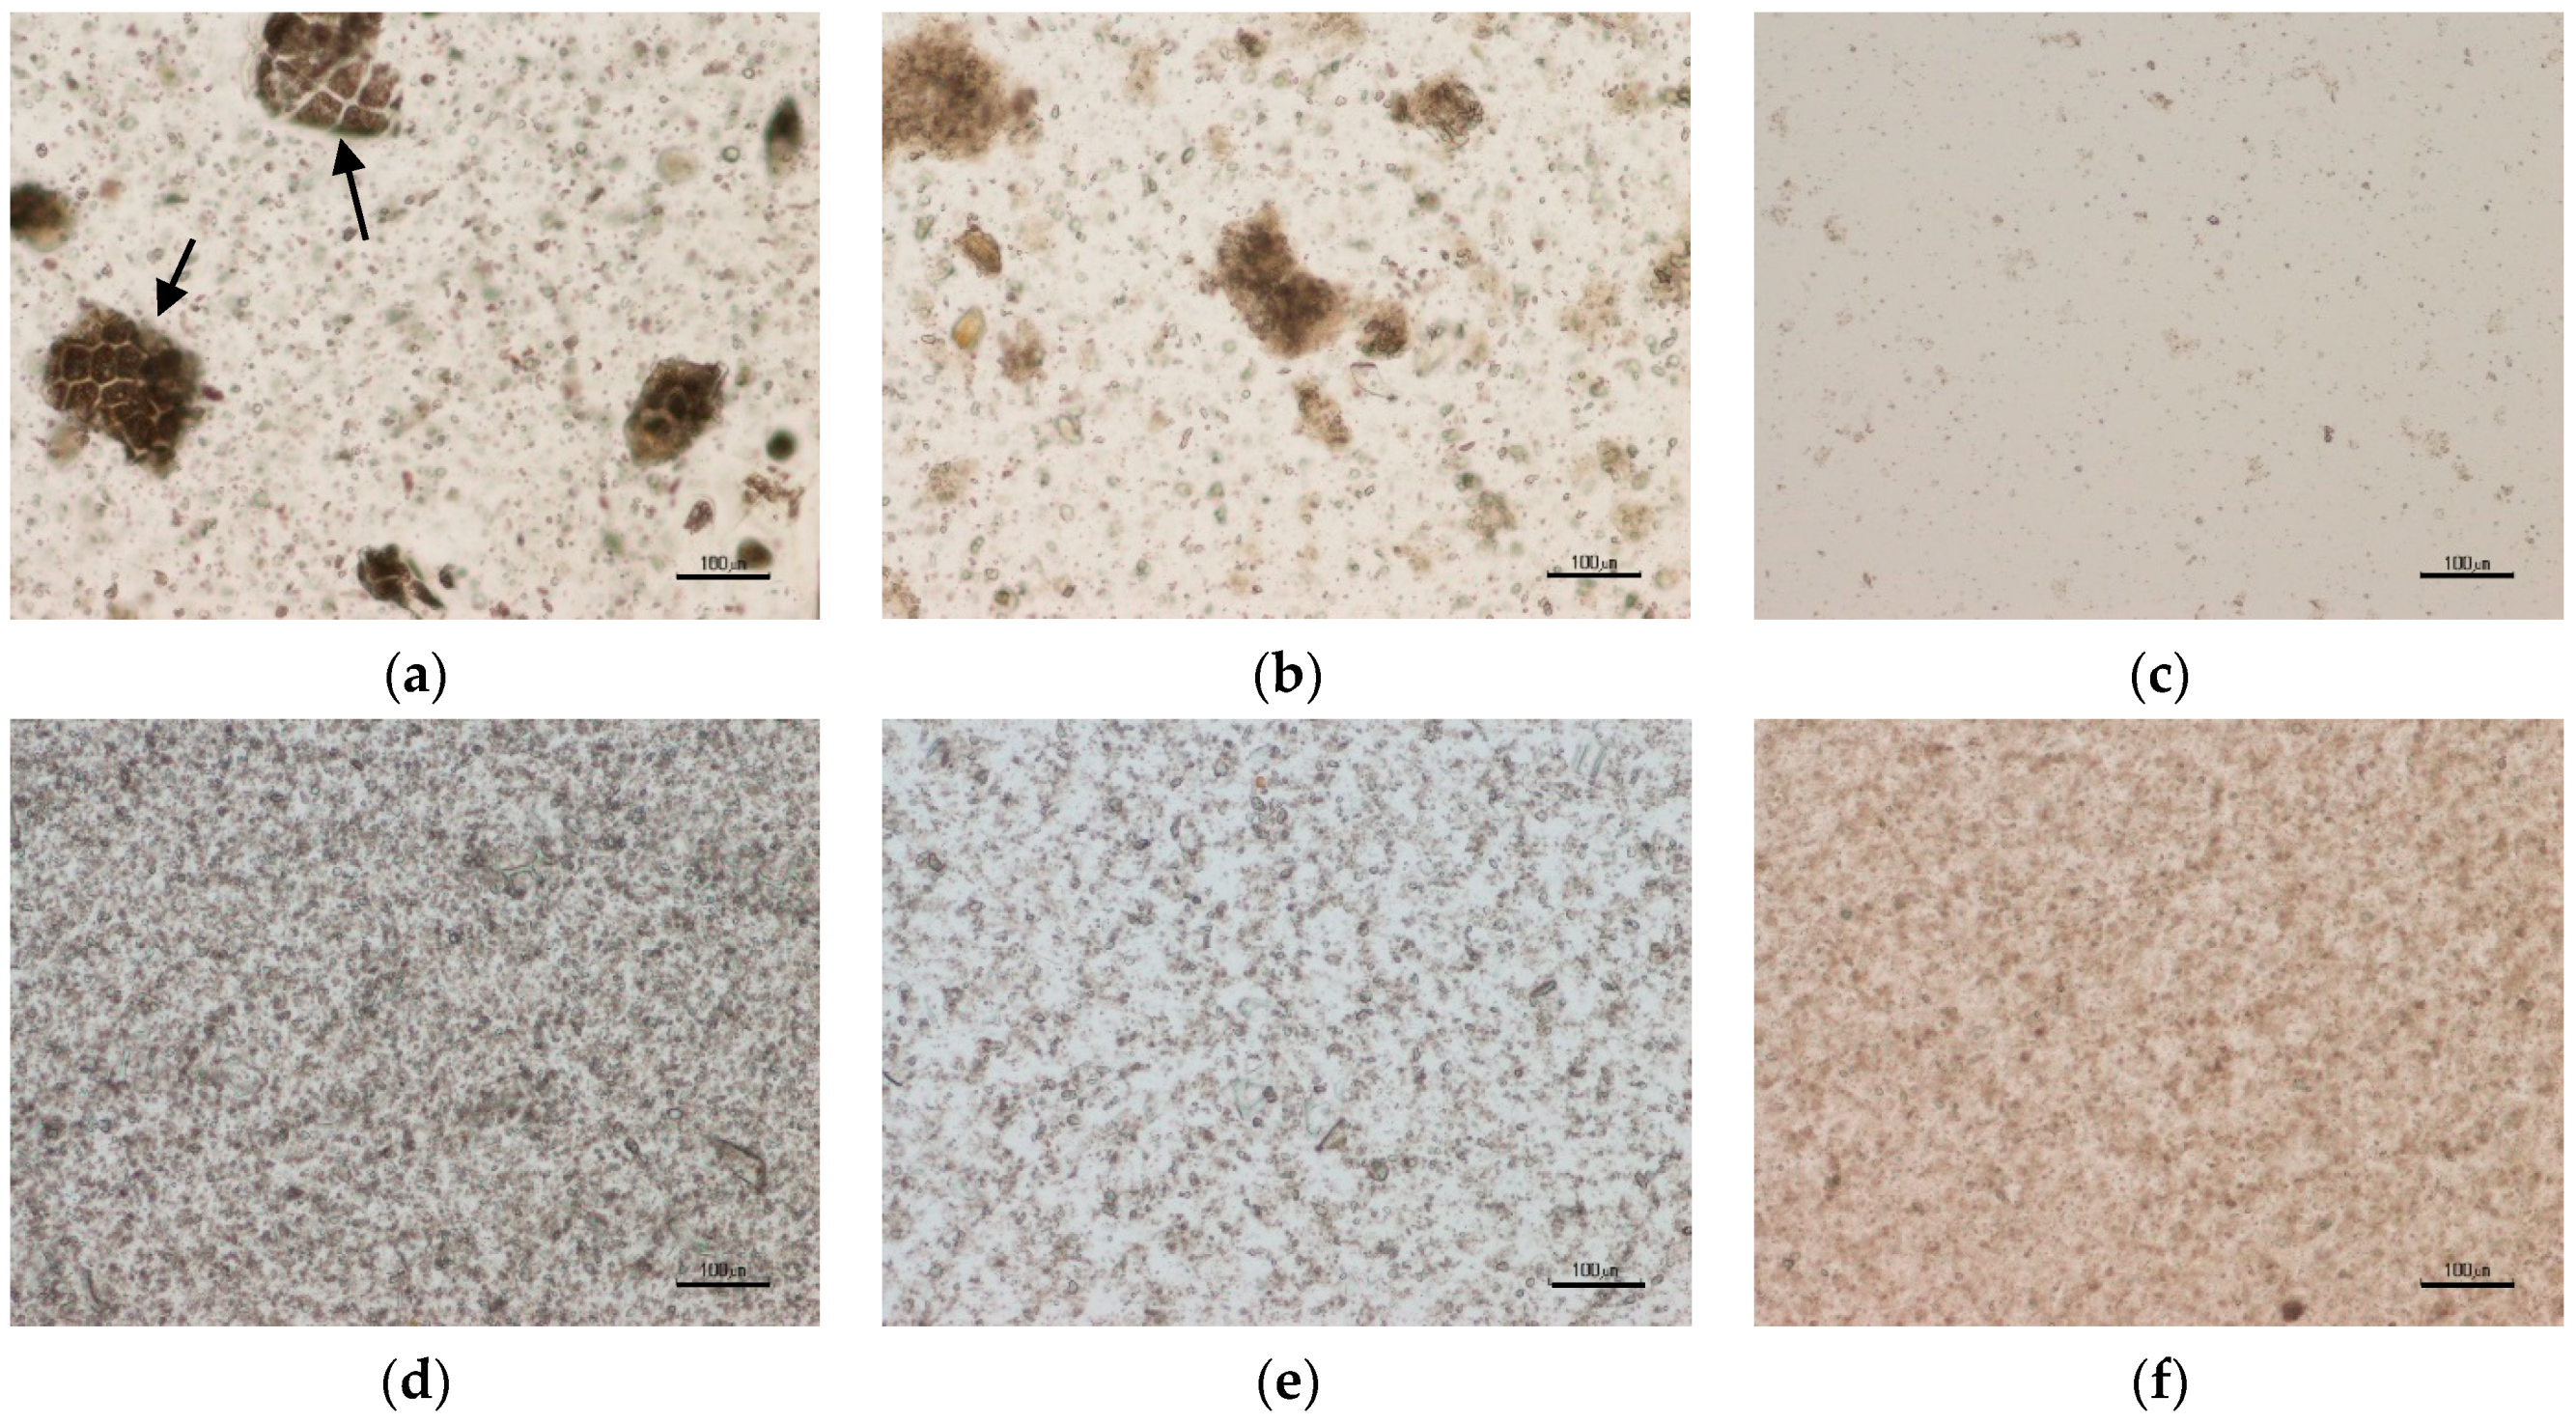
2.7. Microscopy
2.8. Water Retention Capacity (WRC) and Extractability
2.9. Colloidal Stability
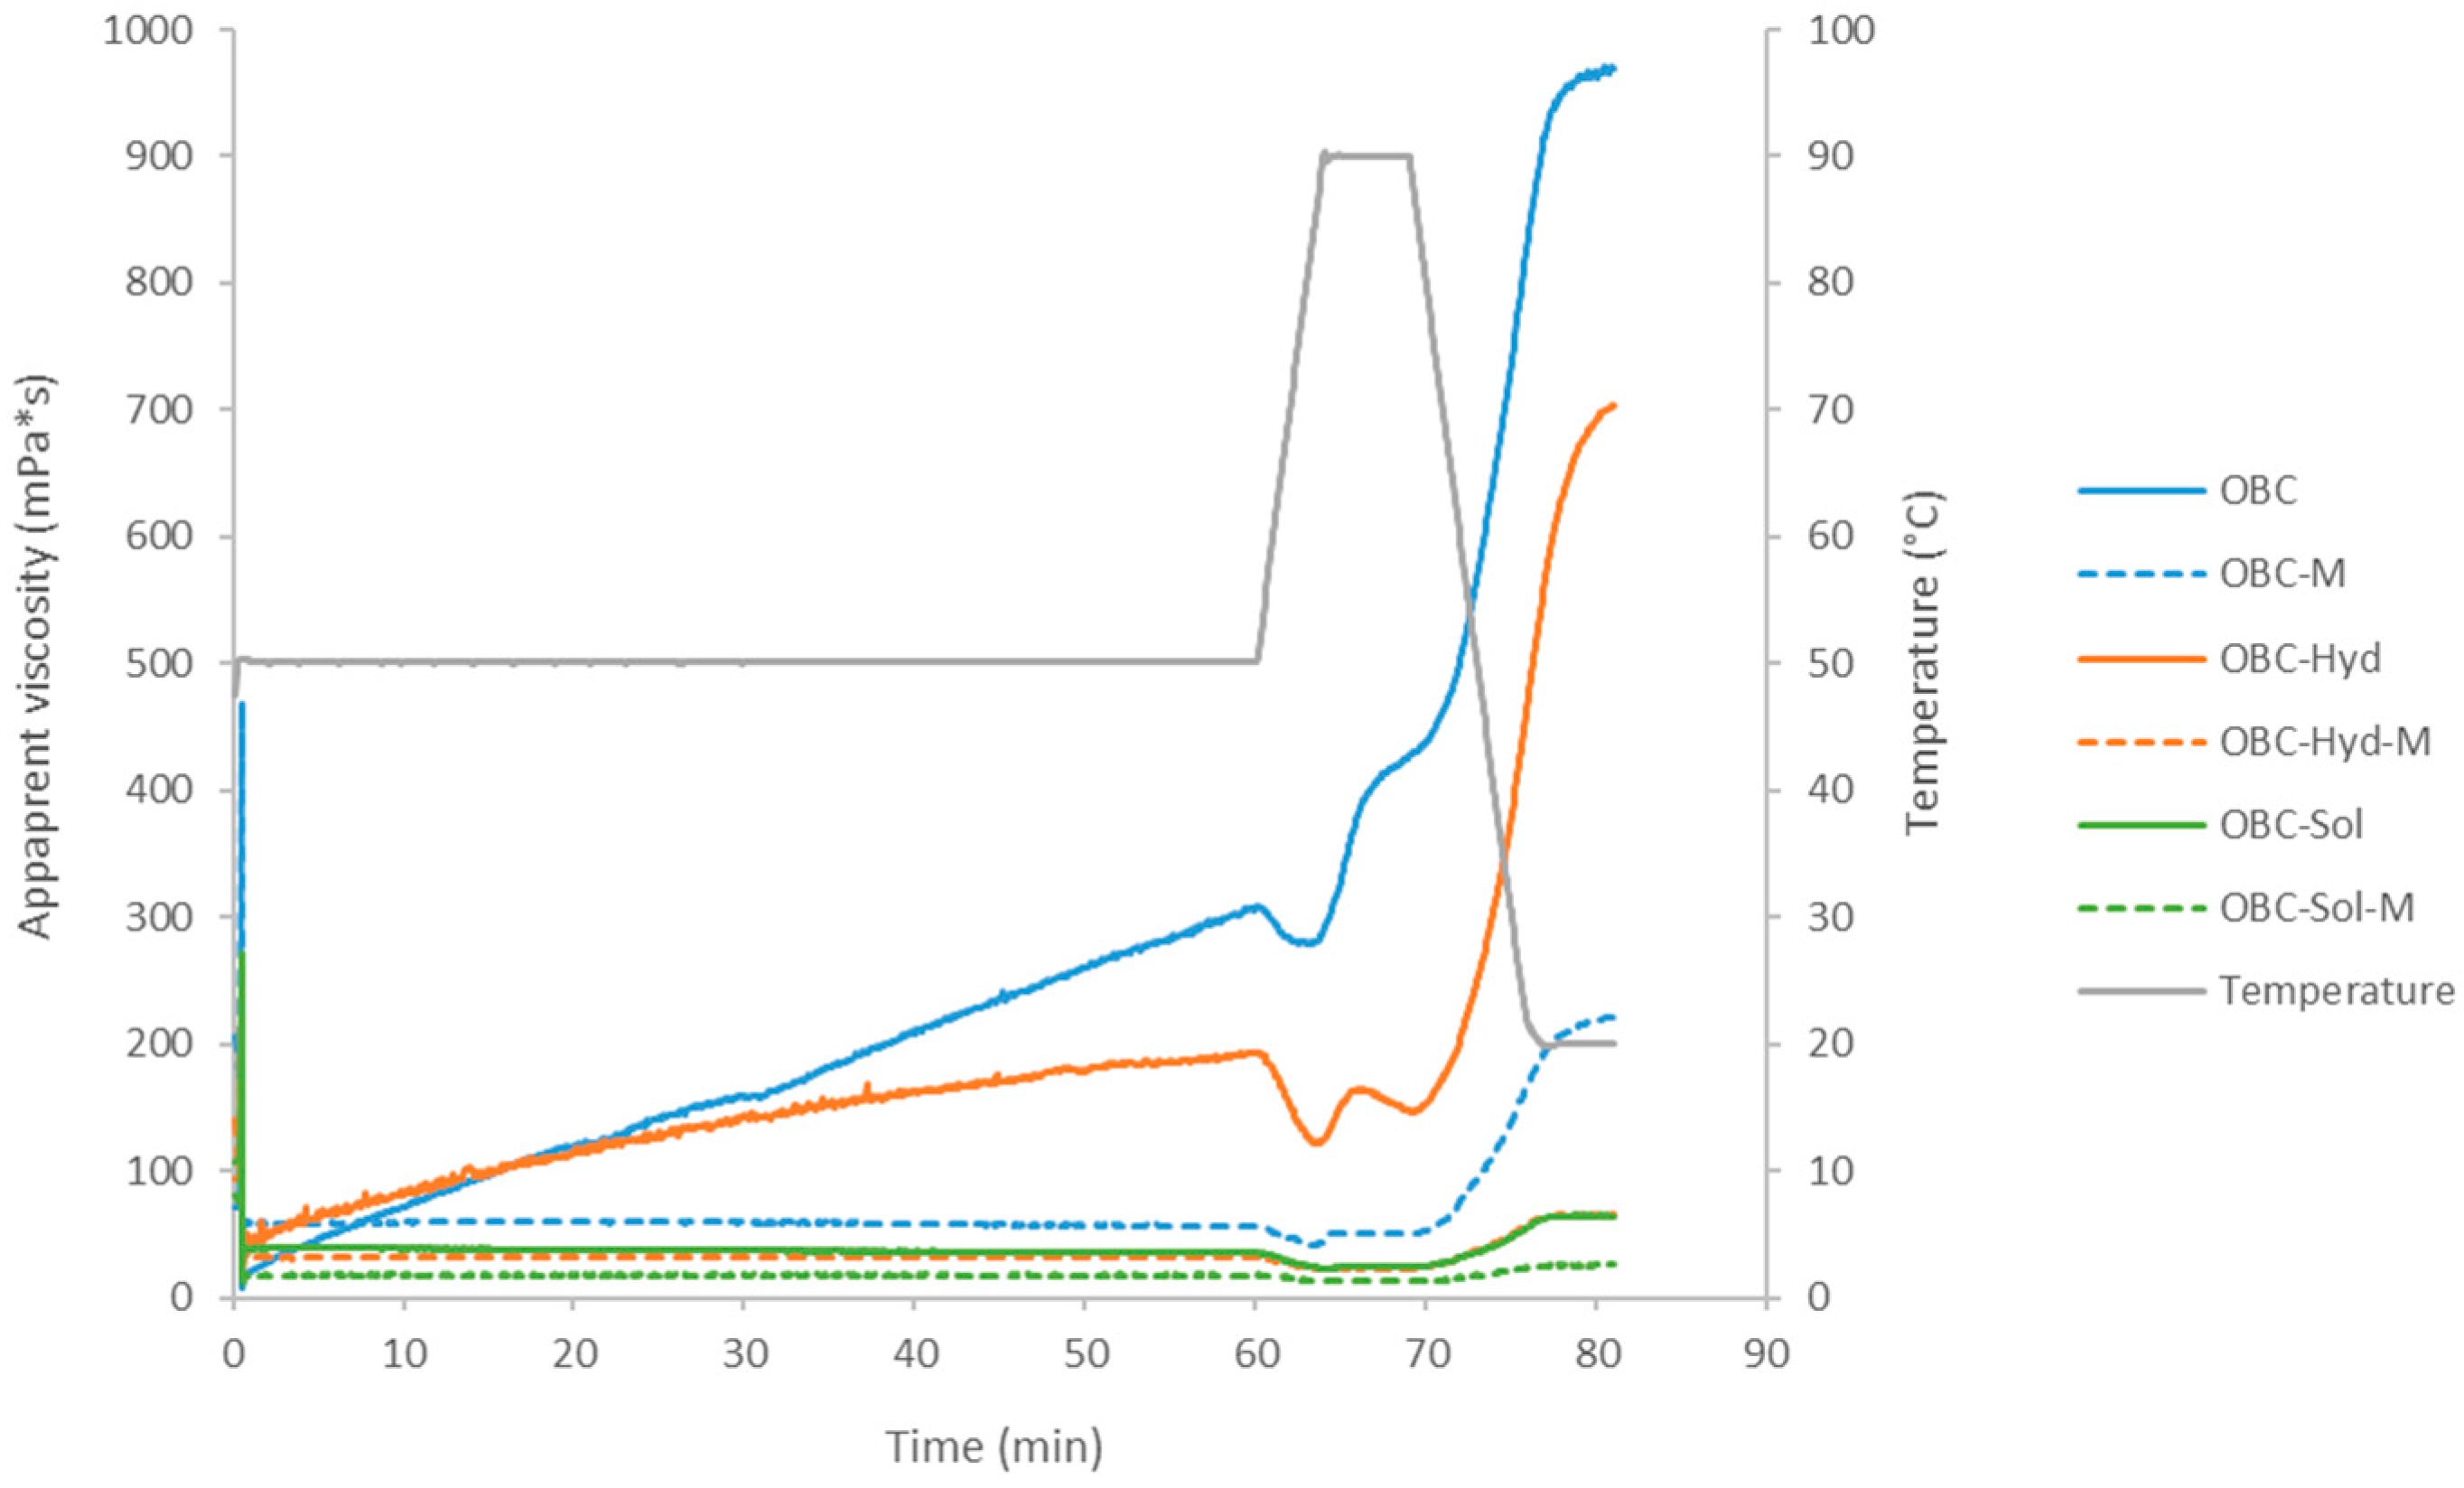
2.10. Viscosity
2.11. Preparation of Acid Milk Gels Enriched with Oat Samples
Characterization of Acid Milk Gels Enriched with OBC Samples
2.12. Statistical Analysis
3. Results and Discussion
3.1. Impact of Processing on OBC Characteristics
3.2. Properties of OBC Samples in Suspension
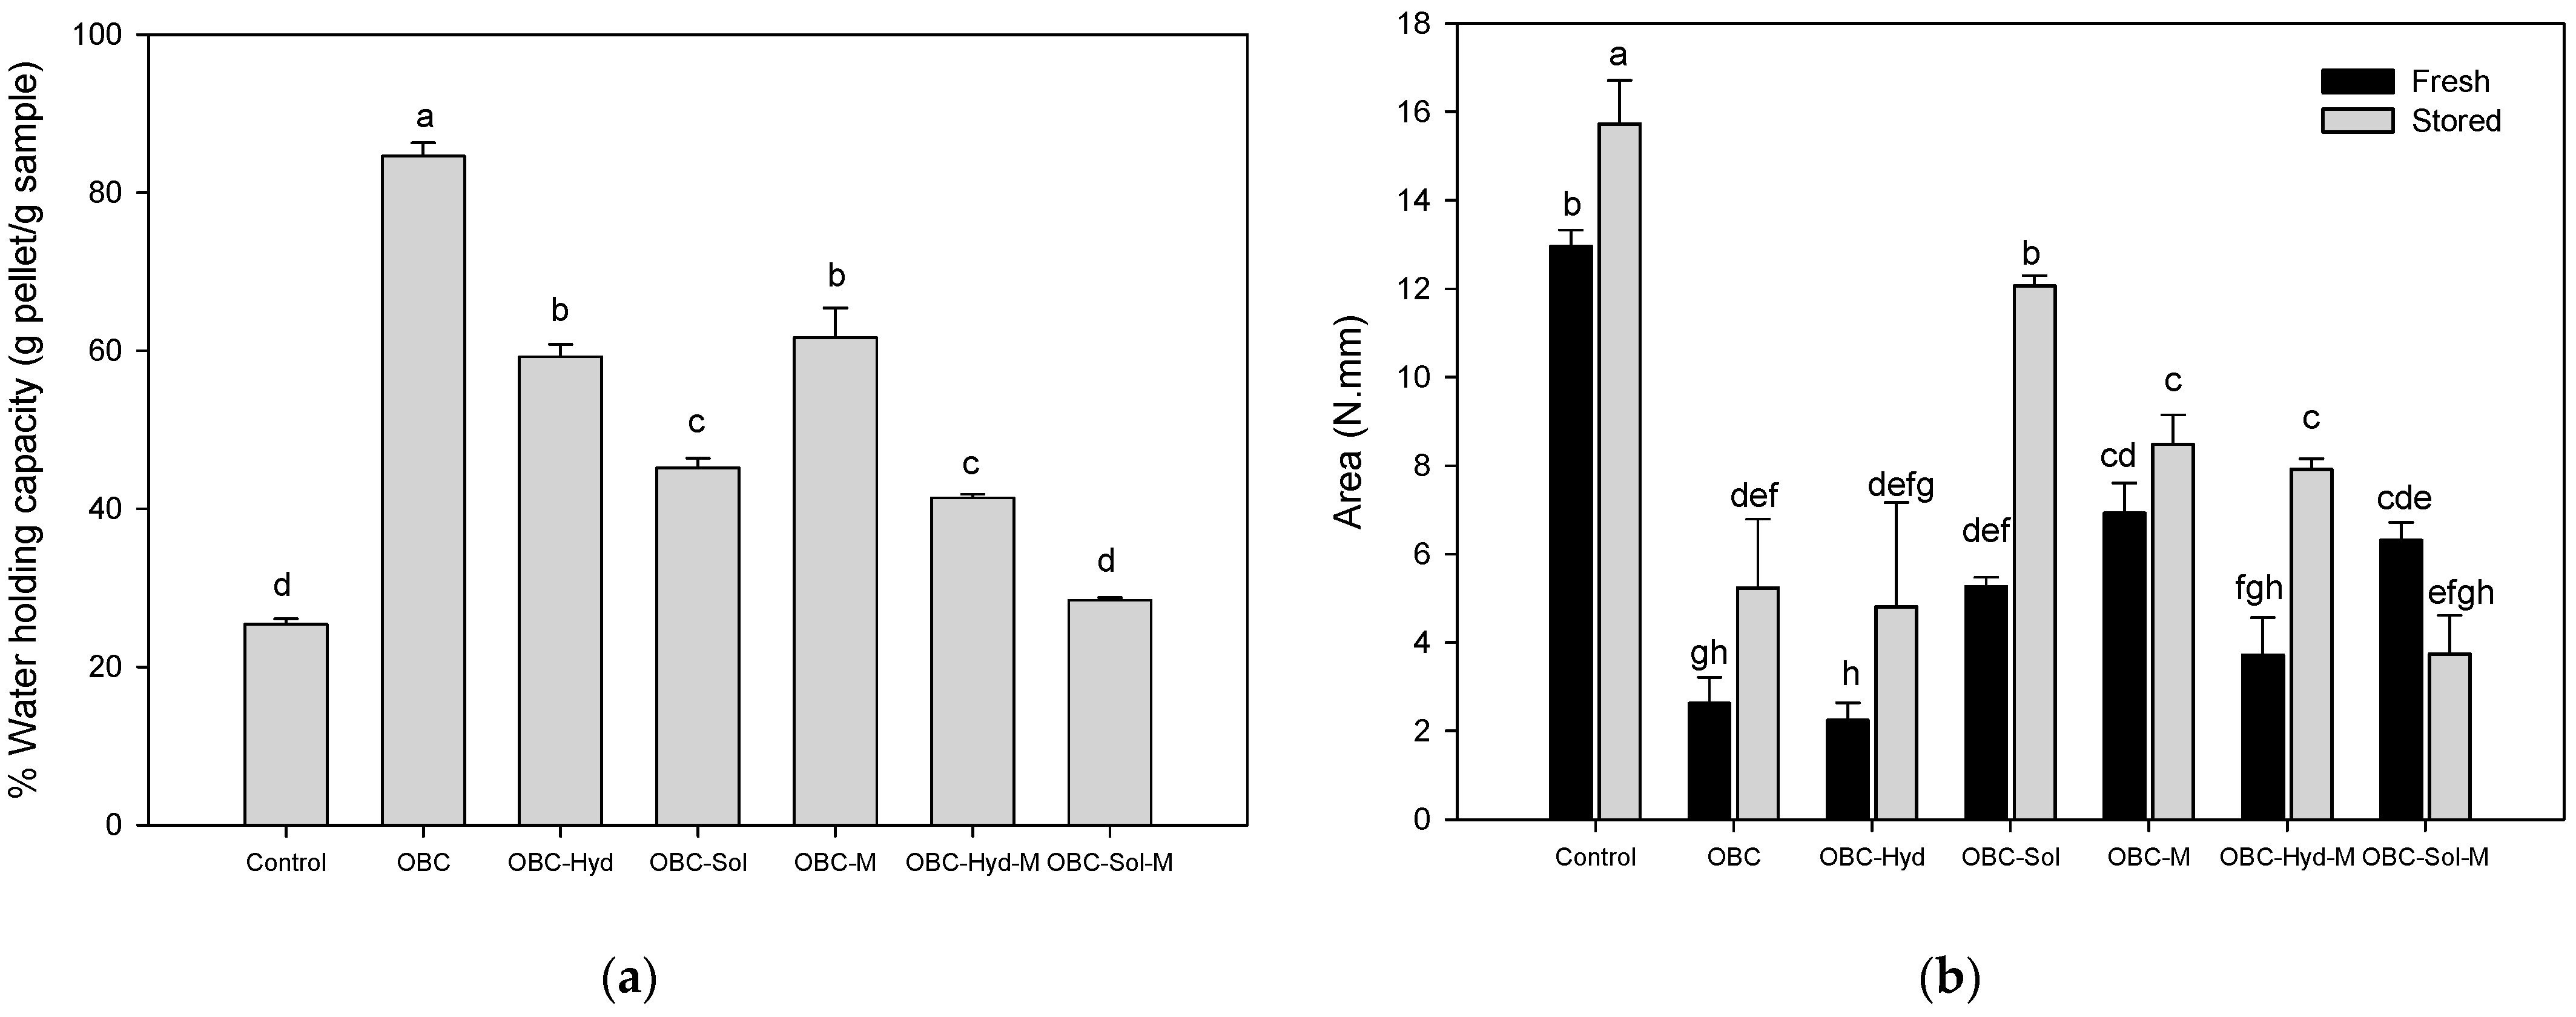
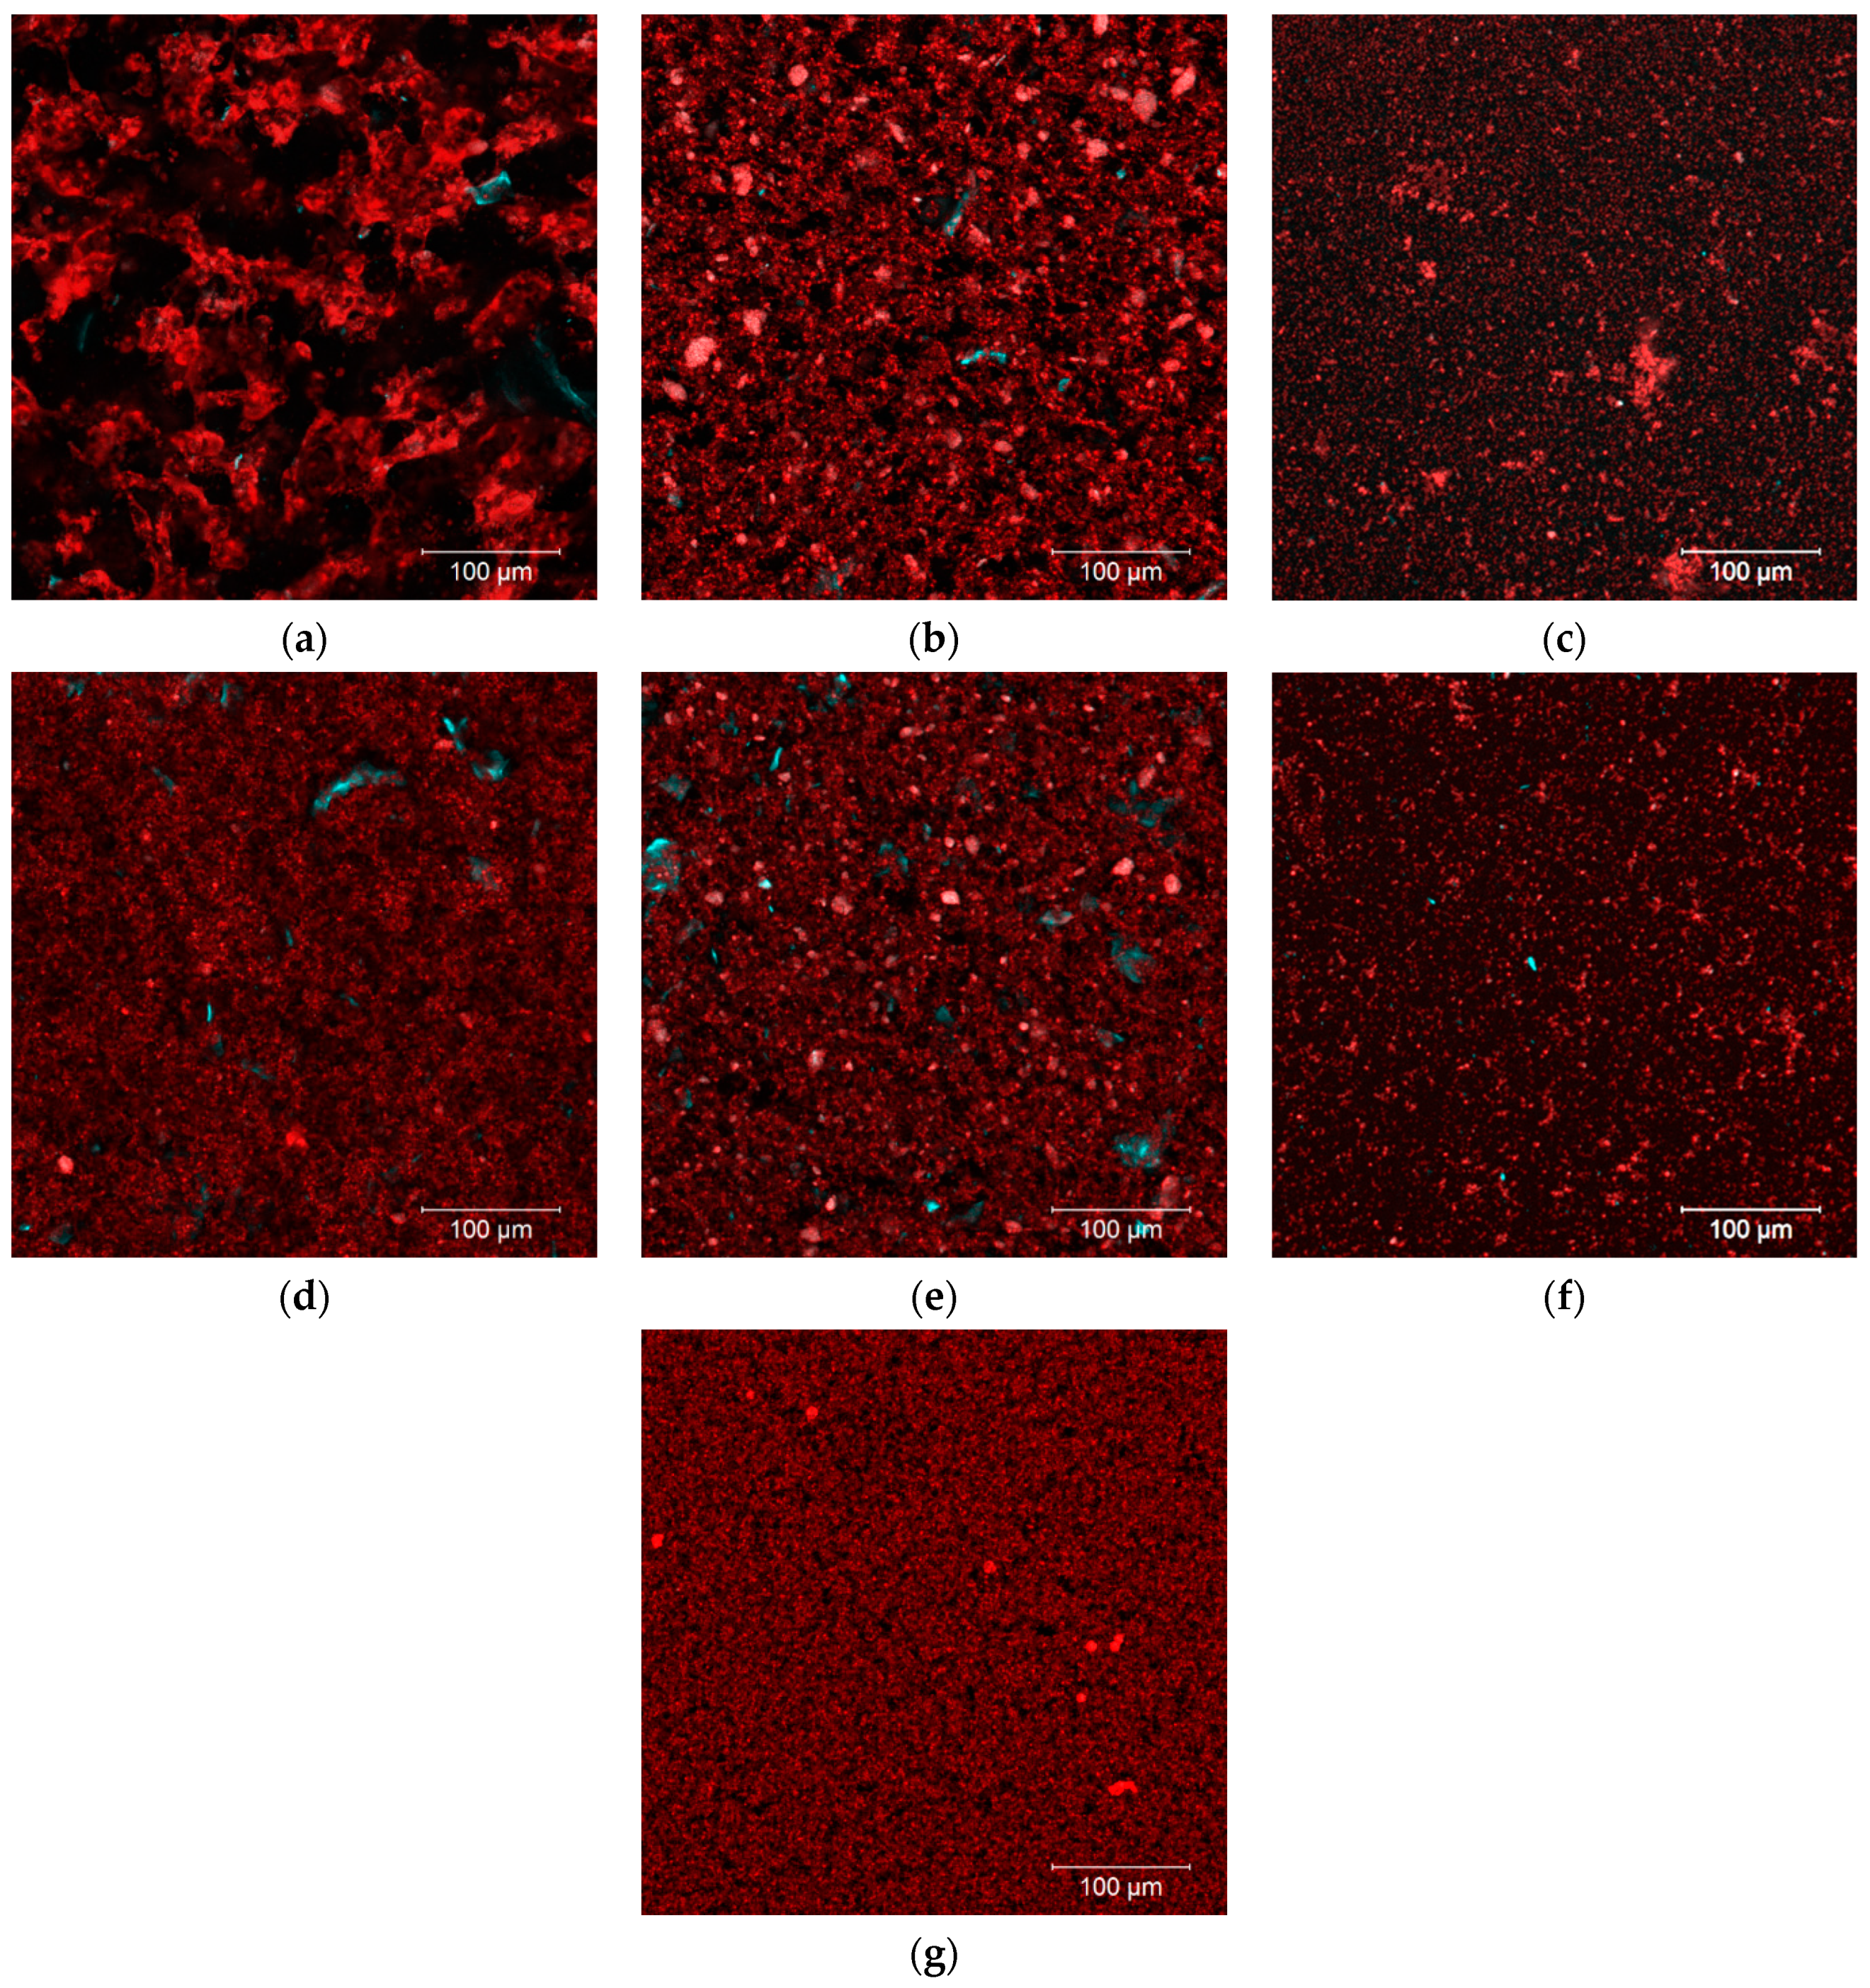
3.3. Properties of Acid Milk Gels with OBC Samples
4. Conclusions
Author Contributions
Funding
Institutional Review Board Statement
Informed Consent Statement
Data Availability Statement
Acknowledgments
Conflicts of Interest
References
- Butt, M.S.; Tahir-Nadeem, M.; Khan, M.K.I.; Shabir, R.; Butt, M.S. Oat: Unique among the cereals. Eur. J. Nutr. 2008, 47, 68–79. [Google Scholar] [CrossRef]
- EFSA Panel on Dietetic Products, Nutrition and Allergies (NDA). Scientific Opinion on the substantiation of health claims related to beta-glucans from oats and barley and maintenance of normal blood LDL-cholesterol concentrations (ID 1236, 1299), increase in satiety leading to a reduction in energy intake (ID 851, 852). EFSA J. 2011, 9, 2207. [Google Scholar] [CrossRef] [Green Version]
- Flander, L.; Salmenkallio-Marttila, M.; Suortti, T.; Autio, K. Optimization of ingredients and baking process for improved wholemeal oat bread quality. LWT—Food Sci. Technol. 2007, 40, 860–870. [Google Scholar] [CrossRef]
- Rieder, A.; Holtekjølen, A.K.; Sahlstrøm, S.; Moldestad, A. Effect of barley and oat flour types and sourdoughs on dough rheology and bread quality of composite wheat bread. J. Cereal Sci. 2012, 55, 44–52. [Google Scholar] [CrossRef]
- Sibakov, J.K.; Kirjoranta, S.J.; Alam, S.A.; Kokkonen, H.; Jurvelin, J.S.; Jouppila, K.; Poutanen, K.S.; Sozer, N. Effect of Oat Bran Fractions on Extrudates Made of Defatted Oats. Food Bioprocess Technol. 2015, 8, 445–458. [Google Scholar] [CrossRef]
- Havrlentová, M.; Petruláková, Z.; Burgárová, A.; Gago, F.; Hlinková, A.; Šturdík, E. Cereal β-glucans and their significance for the preparation of functional foods—A review. Czech J. Food Sci. 2011, 29, 1–14. [Google Scholar] [CrossRef] [Green Version]
- Lyly, M.; Salmenkallio-Marttila, M.; Suortti, T.; Autio, K.; Poutanen, K.; Lähteenmäki, L. Influence of oat β-glucan preparations on the perception of mouthfeel and on rheological properties in beverage prototypes. Cereal Chem. 2003, 80, 536–541. [Google Scholar] [CrossRef]
- Patsioura, A.; Galanakis, C.M.; Gekas, V. Ultrafiltration optimization for the recovery of β-glucan from oat mill waste. J. Memb. Sci. 2011, 373, 53–63. [Google Scholar] [CrossRef]
- Sibakov, J.; Myllymäki, O.; Suortti, T.; Kaukovirta-Norja, A.; Lehtinen, P.; Poutanen, K. Comparison of acid and enzymatic hydrolyses of oat bran β-glucan at low water content. Food Res. Int. 2013, 52, 99–108. [Google Scholar] [CrossRef]
- Kivelä, R.; Nyström, L.; Salovaara, H.; Sontag-Strohm, T. Role of oxidative cleavage and acid hydrolysis of oat beta-glucan in modelled beverage conditions. J. Cereal Sci. 2009, 50, 190–197. [Google Scholar] [CrossRef]
- Kivelä, R.; Pitkänen, L.; Laine, P.; Aseyev, V.; Sontag-Strohm, T. Influence of homogenisation on the solution properties of oat β-glucan. Food Hydrocoll. 2010, 24, 611–618. [Google Scholar] [CrossRef]
- Microfluidics International Corporation. Microfluidizer® Processor User Guide—Innovation through Microfluidizer Processor Technology; Microfluidics International Corporation: Westwood, MA, USA, 2018. [Google Scholar]
- Rosa-Sibakov, N.; Mäkelä, N.; Aura, A.M.; Sontag-Strohm, T.; Nordlund, E. In vitro study for investigating the impact of decreasing the molecular weight of oat bran dietary fibre components on the behaviour in small and large intestine. Food Funct. 2020, 11, 6680. [Google Scholar] [CrossRef]
- Hakkola, S.; Nylund, L.; Rosa-Sibakov, N.; Yang, B.; Nordlund, E.; Pahikkala, T.; Kalliomäki, M.; Aura, A.M.; Linderborg, K.M. Effect of oat β-glucan of different molecular weights on fecal bile acids, urine metabolites and pressure in the digestive tract—A human cross over trial. Food Chem. 2021, 342, 128219. [Google Scholar] [CrossRef] [PubMed]
- Brennan, C.S.; Tudorica, C.M. Carbohydrate-based fat replacers in the modification of the rheological, textural and sensory quality of yoghurt: Comparative study of the utilisation of barley beta-glucan, guar gum and inulin. Int. J. Food Sci. Technol. 2008, 43, 824–833. [Google Scholar] [CrossRef]
- Lazaridou, A.; Vaikousi, H.; Biliaderis, C.G. Impact of mixed-linkage (1→3, 1→4) β-glucans on physical properties of acid-set skim milk gels. Int. Dairy J. 2008, 18, 312–322. [Google Scholar] [CrossRef]
- Lazaridou, A.; Serafeimidou, A.; Biliaderis, C.G.; Moschakis, T.; Tzanetakis, N. Structure development and acidification kinetics in fermented milk containing oat β-glucan, a yogurt culture and a probiotic strain. Food Hydrocoll. 2014, 39, 204–214. [Google Scholar] [CrossRef]
- Rinaldi, L.; Rioux, L.E.; Britten, M.; Turgeon, S.L. Invitro bioaccessibility of peptides and amino acids from yogurt made with starch, pectin, or β-glucan. Int. Dairy J. 2015, 46, 39–45. [Google Scholar] [CrossRef]
- Lazaridou, A.; Biliaderis, C.G. Concurrent phase separation and gelation in mixed oat β-glucans/sodium caseinate and oat β-glucans/pullulan aqueous dispersions. Food Hydrocoll. 2009, 23, 886–895. [Google Scholar] [CrossRef]
- Sharafbafi, N.; Tosh, S.M.; Alexander, M.; Corredig, M. Phase behaviour, rheological properties, and microstructure of oat β-glucan-milk mixtures. Food Hydrocoll. 2014, 41, 274–280. [Google Scholar] [CrossRef]
- Mårtensson, O.; Andersson, C.; Andersson, K.; Öste, R.; Holst, O. Formulation of an oat-based fermented product and its comparison with yoghurt. J. Sci. Food Agric. 2001, 81, 474–480. [Google Scholar] [CrossRef]
- Fu, R.; Li, J.; Zhang, T.; Zhu, T.; Cheng, R.; Wang, S.; Zhang, J. Salecan stabilizes the microstructure and improves the rheological performance of yogurt. Food Hydrocoll. 2018, 81, 1314–1321. [Google Scholar] [CrossRef]
- Raikos, V.; Grant, S.B.; Hayes, H.; Ranawana, V. Use of β-glucan from spent brewer’s yeast as a thickener in skimmed yogurt: Physicochemical, textural, and structural properties related to sensory perception. J. Dairy Sci. 2018, 101, 5821–5831. [Google Scholar] [CrossRef] [PubMed] [Green Version]
- Bailey, M.; Nevalainen, K. Induction, isolation and testing of stable Trichoderma reesei mutants with improved production of solubilising cellulose. Enzyme Microb. Technol. 1981, 3, 153–157. [Google Scholar] [CrossRef]
- Aktas-Akyildiz, E.; Sibakov, J.; Nappa, M.; Hytönen, E.; Koksel, H.; Poutanen, K. Extraction of soluble β-glucan from oat and barley fractions: Process efficiency and dispersion stability. J. Cereal Sci. 2018, 81, 60–68. [Google Scholar] [CrossRef]
- Rosa-Sibakov, N.; Sibakov, J.; Lahtinen, P.; Poutanen, K. Wet grinding and microfluidization of wheat bran preparations: Improvement of dispersion stability by structural disintegration. J. Cereal Sci. 2015, 64, 1–10. [Google Scholar] [CrossRef]
- Suortti, T. Size-exclusion chromatographic determination of β-glucan with postcolumn reaction detection. J. Chromatogr. A 1993, 632, 105–110. [Google Scholar] [CrossRef]
- De Bondt, Y.; Rosa-Sibakov, N.; Liberloo, I.; Roye, C.; Van de Walle, D.; Dewettinck, K.; Goos, P.; Nordlund, E.; Courtin, C.M. Study into the effect of microfluidisation processing parameters on the physicochemical properties of wheat (Triticum aestivum L.) bran. Food Chem. 2020, 305, 125436. [Google Scholar] [CrossRef] [PubMed]
- Rosa-Sibakov, N.; Hakala, T.K.; Sözer, N.; Nordlund, E.; Poutanen, K.; Aura, A.M. Birch pulp xylan works as a food hydrocolloid in acid milk gels and is fermented slowly in vitro. Carbohydr. Polym. 2016, 154, 305–312. [Google Scholar] [CrossRef]
- Kortekangas, A.; Silventoinen, P.; Nordlund, E.; Ercili-Cura, D. Phytase treatment of a protein-enriched rice bran fraction improves heat-induced gelation properties at alkaline conditions. Food Hydrocoll. 2020, 105, 105787. [Google Scholar] [CrossRef]
- Wang, T.; Sun, X.; Zhou, Z.; Chen, G. Effects of microfluidization process on physicochemical properties of wheat bran. Food Res. Int. 2012, 48, 742–747. [Google Scholar] [CrossRef]
- Lazaridou, A.; Biliaderis, C.G.; Izydorczyk, M.S. Molecular size effects on rheological properties of oat β-glucans in solution and gels. Food Hydrocoll. 2003, 17, 693–712. [Google Scholar] [CrossRef]
- Valoppi, F.; Wang, Y.J.; Alt, G.; Peltonen, L.J.; Mikkonen, K.S. Valorization of Native Soluble and Insoluble Oat Side Streams for Stable Suspensions and Emulsions. Food Bioprocess Technol. 2021, 14, 751–764. [Google Scholar] [CrossRef]
- Ma, C.Y.; Harwalkar, V.R. Chemical characterization and functionality assessment of oat protein fractions. J. Agric. Food Chem. 1984, 32, 144–149. [Google Scholar] [CrossRef]
- Wang, B.; Li, D.; Wang, L.J.; Chiu, Y.L.; Chen, X.D.; Mao, Z.H. Effect of high-pressure homogenization on the structure and thermal properties of maize starch. J. Food Eng. 2008, 87, 436–444. [Google Scholar] [CrossRef]
- Che, L.; Li, D.; Wang, L.; Özkan, N.; Chen, X.D.; Mao, Z. Effect of high-pressure homogenization on the structure of cassava starch. Int. J. Food Prop. 2007, 10, 911–922. [Google Scholar] [CrossRef]
- Stute, R.; Klingler, R.W.; Boguslawski, S.; Eshtiaghi, M.N.; Knorr, D. Effects of high pressures treatment on starches. Starch/Staerke 1996, 48, 399–408. [Google Scholar] [CrossRef]
- Zhang, J.; Zhang, M.; Wang, C.; Zhang, Y.; Rong, A.; Bai, X.; Zhang, Y.; Zhang, J. Effects of high hydrostatic pressure on microstructure, physicochemical properties and in vitro digestibility of oat starch/β-glucan mixtures. Int. J. Food Sci. Technol. 2021. [Google Scholar]
- Nordlund, E.; Aura, A.M.; Mattila, I.; Kössö, T.; Rouau, X.; Poutanen, K. Formation of phenolic microbial metabolites and short-chain fatty acids from rye, wheat, and oat bran and their fractions in the metabolical in vitro colon model. J. Agric. Food Chem. 2012, 60, 8134–8145. [Google Scholar] [CrossRef] [PubMed]
- Sibakov, J.; Myllymäki, O.; Holopainen, U.; Kaukovirta-Norja, A.; Hietaniemi, V.; Pihlava, J.M.; Poutanen, K.; Lehtinen, P. Lipid removal enhances separation of oat grain cell wall material from starch and protein. J. Cereal Sci. 2011, 54, 104–109. [Google Scholar] [CrossRef]
- Syrbe, A.; Bauer, W.J.; Klostermeyer, H. Polymer science concepts in dairy systems—An overview of milk protein and food hydrocolloid interaction. Int. Dairy J. 1998, 8, 179–193. [Google Scholar] [CrossRef]

| Β-Glucan | 3 d50 (µm) | 4 WRC (mL/g) | Extractability (%) | Apparent Viscosity (mPa·s) | Colloidal Stability (mL) | ||||||
|---|---|---|---|---|---|---|---|---|---|---|---|
| Content (g/100 g d.m.) | 1 Mw (kDa) | 2 Đ | At 60 min | Final | 1 h | 4 h | 24 h | ||||
| OBC | 21.1 ± 0.2 b | 2748 ± 65 | 2.1 ± 0.2 | 426 ± 6 a | 3.0 ± 0.0 b | 9.9 ± 0 f | 305 ± 2 a | 969 ± 7 a | 1.5 ± 0.6 a | 2.3 ± 1.3 a | 16.3 ± 0.4 a |
| OBC-Hyd | 21.2 ± 0.2 b | 893 ± 42 | 6.7 ± 1.0 | 124 ± 5 b | 3.1 ± 0.1 b | 21.3 ± 1 e | 198 ± 21 b | 684 ± 22 b | 0.8 ± 0.3 ab | 1.5 ± 0.4 ab | 15.4 ± 1.3 a |
| OBC-Sol | 44.5 ± 0.8 a | 294 ± 20 | 4.1 ± 0.3 | 14 ± 0.4 c | 1.9 ± 0.2 d | 80.2 ± 1 a | 34 ± 2 cd | 63 ± 4 d | 1.0 ± 0.8 ab | 1.4 ± 0.8 ab | 4.0 ± 2.9 b |
| OBC-M | n.a. | 350 ± 2 | 4.4 ± 0.5 | 12 ± 0.2 c | 2.5 ± 0.2 c | 27.3 ± 2 d | 56 ± 2 c | 218 ± 5 c | 0.5 ± 0.0 b | 0.5 ± 0.0 b | 0.5 ± 0.0 c |
| OBC-Hyd-M | n.a. | 203 ± 10 | 3.2 ± 0.1 | 15 ± 0.2 c | 2.3 ± 0.1 c | 47.6 ± 1 b | 32 ± 1 cd | 65 ± 2 d | 0.8 ± 0.3 ab | 0.6 ± 0.3 b | 1.3 ± 0.6 bc |
| OBC-Sol-M | n.a. | 148 ± 9 | 2.7 ± 0.2 | 6.2 ± 0.1 c | 5.8 ± 0.1 a | 38.9 ± 0 c | 17 ± 1 d | 26 ± 1 e | 1.0 ± 0.0 ab | 1.1 ± 0.2 ab | 1.1 ± 0.2 bc |
Publisher’s Note: MDPI stays neutral with regard to jurisdictional claims in published maps and institutional affiliations. |
© 2022 by the authors. Licensee MDPI, Basel, Switzerland. This article is an open access article distributed under the terms and conditions of the Creative Commons Attribution (CC BY) license (https://creativecommons.org/licenses/by/4.0/).
Share and Cite
Rosa-Sibakov, N.; de Oliveira Carvalho, M.J.; Lille, M.; Nordlund, E. Impact of Enzymatic Hydrolysis and Microfluidization on the Techno-Functionality of Oat Bran in Suspension and Acid Milk Gel Models. Foods 2022, 11, 228. https://doi.org/10.3390/foods11020228
Rosa-Sibakov N, de Oliveira Carvalho MJ, Lille M, Nordlund E. Impact of Enzymatic Hydrolysis and Microfluidization on the Techno-Functionality of Oat Bran in Suspension and Acid Milk Gel Models. Foods. 2022; 11(2):228. https://doi.org/10.3390/foods11020228
Chicago/Turabian StyleRosa-Sibakov, Natalia, Maria Julia de Oliveira Carvalho, Martina Lille, and Emilia Nordlund. 2022. "Impact of Enzymatic Hydrolysis and Microfluidization on the Techno-Functionality of Oat Bran in Suspension and Acid Milk Gel Models" Foods 11, no. 2: 228. https://doi.org/10.3390/foods11020228
APA StyleRosa-Sibakov, N., de Oliveira Carvalho, M. J., Lille, M., & Nordlund, E. (2022). Impact of Enzymatic Hydrolysis and Microfluidization on the Techno-Functionality of Oat Bran in Suspension and Acid Milk Gel Models. Foods, 11(2), 228. https://doi.org/10.3390/foods11020228